using activity-based costing to measure … · activity-based costing system (tdabc) in hospitality...
TRANSCRIPT

ijcrb.webs.com
INTERDISCIPLINARY JOURNAL OF CONTEMPORARY RESEARCH IN BUSINESS
COPY RIGHT © 2014 Institute of Interdisciplinary Business Research 162
JANUARY 2014
VOL 5, NO 9
USING ACTIVITY-BASED COSTING TO MEASURE
CUSTOMER PROFITABILITY: CUSTOMER-SPECIFIC
SELLING AND MARKETING EXPENSES ANALYSIS
"AN APPLICATION STUDY IN AN INDUSTRIAL
COMPANY"
DR. ABDUL AZIZ A. ABDUL RAHMAN
DR. NOUR ALDEEN M. GHAFEER
University of Philadelphia, Amman, Jordan
Faculty of Administrative & financial sciences
Accounting Department
Abstract This study aims to determine the costs and profitability for a sample of customers in
an industrial company by using activity based costing and compare the results with
traditional costing data. We will analyze the Customer-Specific Selling and Marketing
Expenses to achieve this purpose by determining the customer's costs, then to
determine customer's profitability.
To arrive at a reined measure of customer profitability, the researchers go to assign
costs of four big customers by using philosophy of activity based costing in allocating
overhead costs for the company's data of 2013.
The results show that six variables, i.e. the product handling, order taking, delivery
vehicles, rush deliveries, Annual tourist program for customers, and visits to
customers influences on the profitability contributed by customers.
Keywords: Customer profitability, Customer-specific Selling and marketing
expenses, activity based costing, customer-level operating costs.
Introduction: Most companies still use traditional methods to allocate overhead costs to products,
services, channels, and customers. These companies use often one allocation base to
allocate the plant-wide indirect costs by using machine hours, number of employees,
direct labor hours as allocation bases to that cost objects. Furthermore, other
companies also go to deduct many types of nonmanufacturing indirect costs from
operating income such as, delivering finished goods to customers, advertising, order
taking, visiting customers, and so on, which are very important to measure customer
profitability.
Activity based costing system helps companies to categorize costs related to
customers into different cost pools on the basis of different types of cost drivers, or
cost-allocation bases, which assist to determine costs related to each customer, and
then will lead to compute the profitability for each customer also.
The importance of the study: The importance of this study emerges from the fact that most of companies still use
traditional methods to allocate overhead costs to customers which will lead to distort
the customers profitability, and then to complicate distinguishing between profitable
customers and unprofitable customers.

ijcrb.webs.com
INTERDISCIPLINARY JOURNAL OF CONTEMPORARY RESEARCH IN BUSINESS
COPY RIGHT © 2014 Institute of Interdisciplinary Business Research 163
JANUARY 2014
VOL 5, NO 9
Analyzing Customer-Specific Selling and Marketing Expenses by using activity based
costing system, the company can improve its profitability by determine the
unprofitable customers, then try to eliminate them.
The objectives of the study: The researcher aims at fulfilling the following goals:
1. Determine the profitability for some customers by using activity based
costing system and traditional costing system.
2. Obtain a broad overview about the factors which effect with customers-
profitability.
3. Make procedures assist to determine profitable customers and focusing them,
and determine losable customers and work to improve its profitability.
The problem of the study: From the previous points, the problem of the study can be summed up as follows:
1. Is there a difference between the cost of each customer by using the two
systems; activity based costing and traditional costing system?
2. Is there a difference between the profitability of each customer by using the
two systems; activity based costing and traditional costing system?
The study hypotheses: The researcher tries to test if these hypotheses are correct:
H1: There is a significant difference between cost of different customers in ABC
system and that of traditional system in the company under study.
H2: There is a significant difference between profitability of different customers in
ABC system and that of traditional system in the company under study.
The methodology of the study: The researchers have adopted the descriptive application methodology because it suits
the objectives of this study. The researchers have also depended on information
resources relating to the study and have analyzed it.
Previous studies:
1. Zohreh Hajiha, Samad Safari Alishah (2011)
The purpose of this paper is examination of implementation feasibility of time-driven
activity-based costing system (TDABC) in hospitality industry and analyzes
profitability of various costumer groups by this system in Iranian context. The results
of this system were compared with those of traditional costing system in an Iranian
large hotel named Parsian Hotel (as a case study). Regarding to the goal of the
subject, this is an application research by case study. The results showed that using
TDABC model, in comparison with the existing traditional system in Parsian Hotel,
provides more proper data on cost and profitability of customers. Also, the proposed
model distinguishes non-added value activities and demonstrates real capacity of each
parts of the hotel. Therefore, managers of service companies, especially in hospitality
industry, can calculate necessary time for activities by time equations in TDABC.
Thus they can do necessary actions to decrease this time and increase hotels’
profitability.

ijcrb.webs.com
INTERDISCIPLINARY JOURNAL OF CONTEMPORARY RESEARCH IN BUSINESS
COPY RIGHT © 2014 Institute of Interdisciplinary Business Research 164
JANUARY 2014
VOL 5, NO 9
2. Mullika Jumpapang, Phapruke Ussahawanitchakit (2012)
The objective of this study is to examine the relationships among three dimensions of
marketing learning orientation, marketing practice competency, service innovation,
customer value creation, and marketing profitability through a moderating role of
marketing experience. Marketing learning orientation consists of customer learning
focus, competitive learning capability, and marketing knowledge diversity. In this
study, 294 hotel businesses in Thailand were chosen as the sample of the study. The
results indicate that three dimensions of marketing learning orientation have a
significant positive association with marketing practice competency. Customer
learning focus has a significant positive impact on customer value creation, while
marketing knowledge diversity has a significant positive impact on service
innovation. In addition, it reveals that marketing practice competency has a significant
positive effect on service innovation and customer value creation. Furthermore,
service innovation can increase marketing profitability directly and indirectly through
customer value creation. The moderating role of marketing experience among the
relationships of three dimensions of marketing learning orientation, marketing
practice competency, service innovation, and customer value creation are found not
significant.
Additionally, the potential discussion with the results is implemented in the study.
Theoretical and managerial contributions are presented. The future study needs to
search for mediating variables and moderating variables and includes them in the
conceptual model in order to increase the contributions and benefits of the study.
Likewise, it needs to collect data from different groups of sample and/or comparative
population or from other business sectors in Thailand or elsewhere.
3. Morten Holm & V. Kumar & Carsten Rohde (2012)
Customer profitability measurement is an important element in customer relationship
management and a lever for enhanced marketing accountability. Two distinct
measurement approaches have emerged in the marketing literature: Customer
Lifetime Value (CLV) and Customer Profitability Analysis (CPA). Myriad models
have been demonstrated within these two approaches across industries. However,
limited efforts have been made to explain when sophisticated CLV or CPA models
will be most useful. This paper explores the advantages and limitations of
sophisticated CLV and CPA models and proposes that the degree of sophistication
deployed when implementing customer profitability measurement models is
determined by the type of complexity encountered in firms’ customer environments.
This gives rise to a contingency framework for customer profitability measurement
model selection and five research propositions.
Additionally, the framework provides design and implementation guidance for
managers seeking to implement customer profitability measurement models for
resource allocation purposes.
4. Raj Devasagayam, Nicholas R. Stark, and Laura S. Valestin (2013)
Past literature has suggested maximizing customer satisfaction as a strategic choice to
increase customer loyalty and ensuring revenues. However, the relationship between
increase customer satisfaction and resultant revenue has remained unexamined. This
research focuses on optimizing customer satisfaction rather than maximizing it. This
optimization of customer satisfaction is based on maximizing profitability. In aiming
for higher customer satisfaction levels with no regard to profitability, a company runs

ijcrb.webs.com
INTERDISCIPLINARY JOURNAL OF CONTEMPORARY RESEARCH IN BUSINESS
COPY RIGHT © 2014 Institute of Interdisciplinary Business Research 165
JANUARY 2014
VOL 5, NO 9
the risk of self-annihilation. Based on conceptual foundations of prior research on
Return on Quality (ROQ), we propose the construct of Return on Satisfaction (ROS).
We review frameworks of customer satisfaction examined by scholars in marketing
and then propose a conceptual ROS model. We use empirical data (n=1597) obtained
from an institution of higher education to test the conceptual model we propose.
Results indicate that the data demonstrates construct validity and points to promising
directions for further research. We conclude by underscoring managerial implications
as well as the scholarly contributions of this research.
Methods and data: We have access to revenue, cost, and marketing and selling expense data for four big
customers of DAWOUD Company, a firm in the Compounds feed industry, used
Activity-Based Costing (ABC) in assessing the profitability picture in order to better
understand which customers were profitable and which were subsidized. Then we will
answer the two these questions:
1. What is the impact of customer-specific marketing and selling expenses on
customer costs?
2. What is the impact of customer-specific marketing and selling expenses on
customer profitability?
To answer these two questions, the researchers try to analyze revenues for each
customer, then the costs for each customer by using the four steps in developing an
ABC system which prepared by (R. S. Kaplan and R. Cooper, 1998):
- Develop the activity dictionary.
- Determine how much the organization is spending on each of its activities.
- Identify the organization's products, services, and customers.
- Select activity cost drivers that link activity costs to the organization's
products, services, and customers.
Customer-Revenue Analysis: Before we going to determine the amount of revenues for each of our four customers,
we have to refer that the company sells variety volume of its vegetable oils, 8 liters,
16 liters, and 200 liters. The researchers have access to the following information
relating to revenues for the four customers with prices for each category of items sold
to these customers and also to discount of quantity. The results are displayed in the
following tables for DAWOUD Company for the year of 2013:

ijcrb.webs.com
INTERDISCIPLINARY JOURNAL OF CONTEMPORARY RESEARCH IN BUSINESS
COPY RIGHT © 2014 Institute of Interdisciplinary Business Research 166
JANUARY 2014
VOL 5, NO 9
The analysis of customer-revenue:
Table No. 1: Customer-revenues for four big customers. Customer No. 10221
Category Quantity Quantity Discount Net Quantity Selling Price Per Unit Amount
8 liters 8770 5% 8331.5 $12 $99978
16 liters 4325 5% 4108.75 $23 $94501.25
200 liters 215 5% 204.25 $275 $56168.75
Total Revenues $250648
Customer No. 10249
Category Quantity Quantity Discount Net Quantity Selling Price Per Unit Amount
8 liters 6650 5% 6317.5 $12 $75810
16 liters 3540 5% 3363 $23 $77349
200 liters 143 5% 135.85 $275 $37358.75
Total Revenues $190517.75
Customer No. 10253
Category Quantity Quantity Discount Net Quantity Selling Price Per Unit Amount
8 liters 6325 5% 6008.75 $12 $72105
16 liters 3490 5% 3315.5 $23 $76256.5
200 liters 137 5% 130.15 $275 $35791.25
Total Revenues $184152.75
Customer No. 10260
Category Quantity Quantity Discount Net Quantity Selling Price Per Unit Amount
8 liters 6219 5% 5908.05 $12 $70896.6
16 liters 3230 5% 3068.5 $23 $70575.5
200 liters 129 5% 122.55 $275 $33701.25
Total Revenues $175173.35
The results stated in the table clearly indicate that the total revenues for the four
customers are $800,491.75, and there are two variables explain revenue differences
across these four customers: (1) the quantity they purchased and (2) the magnitude of
the quantity discounting.

ijcrb.webs.com
INTERDISCIPLINARY JOURNAL OF CONTEMPORARY RESEARCH IN BUSINESS
COPY RIGHT © 2014 Institute of Interdisciplinary Business Research 167
JANUARY 2014
VOL 5, NO 9
Tracking quantity discount by customer helps improve customer profitability, because
it promote customers to buy in big quantity to get more quantity discounts. The
following diagram summarizes the revenue for each customer in dollars:
Figure 1- Customer-Revenue
0
50000
100000
150000
200000
250000
300000
CUS. N. 21 CUS. N. 49 CUS. N. 53 CUS. N. 60
REVENUES
Customer-Cost Analysis: Customer cost information is essential for managerial decision making (Dalci et al,.
2010). Understanding the true costs of serving specific customers is important for
every organization. Those companies who understand which customers are more
profitable and which are not are ―armed with valuable information needed to make
successful managerial decision to improve overall organizational profitability (van
Raaij, 2003; Dalci et al, 2010).
In the changing technological environment, when the internet and e-commerce gains
the customers on their side, companies realized that traditional cost accounting
systems do not provide accurate cost information, information used in the decision
making process. As an answer to these changes, activity based costing (ABC) was
designed and, in time, gained popularity, because it focuses on the activities
associated with the costs and assigns activity costs to products, services or customers
that consume resources. Because of these characteristics ABC (1) becomes a tool for
determining true costs of bots sales, marketing activities and customers; (2) will help
companies to make better decisions based on accurate costing information (Stapleton
et al, 2004; van Raaij, 2005; Cugini et al, 2007; Dalci et al, 2010).
The mechanism of ABC requires going through several stages. First, ABC assumes
that products, services or customers generate activities and activities consume
resources. Second, product costing involves a two-step allocation process in which
costs are first allocated to activities and then the activity costs are allocated to
products or customers based on each product or customers demand for, or
consumption of the activities (Stapleton et al, 2004).
While traditional cost systems rely on arbitrary allocation of overhead costs, ABC
classifies cost pools according to the activities performed within the organization.
Moreover, by understanding the hierarchical levels of the costs ABC enables
managers to better understand cost causation and make better decision, it help
managers to understand which customers are profitable and which ones are not and
leads to increased profitability (Dalci et al, 2010; Horngren, et al, 2012).
By reviewing the data for the company under study, The researchers could determine
six cost pools (activities) related to customers, costs of each activity, and cost drivers
for each activity also, with own total levels at the level of the company under study.
The researchers also could determine information on the quantity of cost drivers used
by each of four customers. The following tables summarize the results:

ijcrb.webs.com
INTERDISCIPLINARY JOURNAL OF CONTEMPORARY RESEARCH IN BUSINESS
COPY RIGHT © 2014 Institute of Interdisciplinary Business Research 168
JANUARY 2014
VOL 5, NO 9
Table No. 2: Activity information at the level of the company. Activity Area Activity Cost Cost Driver Activity Level Cost Driver Rate
Product handling $193000 Weight of units Sold 1746210 $0.11
Order taking $40000 Purchase Order 530 $75.47
Delivery vehicles $113000 Delivery mile traveled 63000 $1.79
Rush deliveries $26000 Expedited delivery 94 $276.59
Visits to customers $36000 Sales visit 500 $72
Annual tourist program $38000 Number of customers
covered by the program 19 $2000
Total costs of activities $873000
Information on the quantity of cost drivers used by each of four big customers is as
follows:
Table No. 3: Cost driver information for the four big customers. Customer No. 21 Customer No. 49 Customer No. 53 Customer No. 60
Weight of units sold 182360 138440 134040 127230
Number of purchase order 40 30 55 50
Number of deliveries 100 70 50 30
Miles traveled per delivery 40 50 140 220
Number of rush deliveries 5 6 9 13
Number of visits to customers 12 7 17 22
Customers covered by the program 1 1 1 1
The following table summarizes information about the customer-level operating
costs, which are as follows:
Table No. 4: Customer-level operating costs. CUSTOMER
No. 21 No. 49 No. 53 No. 60 Product handling
$O.11 × 182360; 138440; 134040; 127230
$20059.6
$15228.4
$14744.4
$13995.3 Order taking
$75.47 × 40; 30; 55; 50
$3018.8
$2264.1
$4150.9
$3773.5 Delivery vehicles
$1.79 × (40×100); (50×70); (140×50); (220×30)
$7160
$6265
$12530
$11814 Rush deliveries
$276.59 × 5; 6; 9; 13
$1382.9
$1659.5
$2489.3
$3595.6 Visits to customers
$72 × 12; 7; 17; 22
$864
$504
$1224
$1584 Annual tourist program
$2000 each
$2000
$2000
$2000
$2000 Total customer-level operating costs $34485.3 $27921 $37138.6 $36762.4
The company under study has 47 customers. So, for decision making purposes, it
allocates all customer-level operating costs to all customers equally. This traditional
method in allocating these types of costs to customers leads to distort customer-level
costs, then to distort customer-level operating income (Horngren, 2012).
To calculate the share of each customer from all customer-level operating costs by
using traditional method applied in the company, the result will be $18575
($873000/47 customers (Agents). The following diagram summarizes the customer-
level operating costs for each customer by using activity based costing system and
traditional costing system in dollars:

ijcrb.webs.com
INTERDISCIPLINARY JOURNAL OF CONTEMPORARY RESEARCH IN BUSINESS
COPY RIGHT © 2014 Institute of Interdisciplinary Business Research 169
JANUARY 2014
VOL 5, NO 9
Figure 2- Customer-level operating costs (ABC – Traditional)
0
5000
10000
15000
20000
25000
30000
35000
40000
CUS. No. 21 CUS. No. 49 CUS. No. 53 CUS. No. 60
ABC
Traditional
This diagram shows clearly the fundamental differences between the customer-level
operating costs calculated by using activity based costing system, and customer-level
operating costs calculated by using traditional costing system.
Customer-profitability: Many specialists (Kaplan&Atkinson, 1998; Albu&Albu, 2005; Murphy et al, 2005)
argue that ABC permits a customer profitability analysis by comparing the revenue
streams with the service costs associated with specific customers or customer groups.
An analysis of customer differences in revenues and costs can provide insight into
why differences exist in the operating income earned from different customers.
Managers use this information to ensure that customers making large contribution to
the operating income of a company receive a high level of attention from the
company.
Before we go to compute the profitability for each customer, we need at the beginning
to compute the cost of goods sold for each customer. Then to deduct the cost of goods
sold for each customer from the customer's revenues to get gross margin, then to
deduct all customer-level operating costs, and then to arrive to customer-level
operating income. The following table summarizes them:

ijcrb.webs.com
INTERDISCIPLINARY JOURNAL OF CONTEMPORARY RESEARCH IN BUSINESS
COPY RIGHT © 2014 Institute of Interdisciplinary Business Research 170
JANUARY 2014
VOL 5, NO 9
Table No. 5: Cost of Goods Sold for four Big Customers of DAWOUD Company for the year of 2013: CUS. No. 21 CUS. No. 49 CUS. No. 53 CUS. No. 60
Category Cost per unit Quantity Total costs Quantity Total costs Quantity Total costs Quantity Total costs
8 Liters $10 8770 $87700 6650 $66500 6325 $63250 6219 $62190
16 Liters $18 4325 $77850 3540 $63720 3490 $62820 3230 $58140
200 Liters $215 215 $46225 143 $30745 137 $29455 129 $27735
Cost of goods sold $211775 $160965 $155525 $148065
The table shows the cost of goods sold for each customer. The results will use to identify the gross margin for each customer bu using the two
systems; activity based costing system and traditional costing system. Cost of goods sold is one element of customer profitability.
To determine customer-profitability, the researchers summarize all information needed to this purpose in the following tables:
Table No. 6: Customer-Profitability Analysis for four Big Customers of DAWOUD Company for the year of 2013 by
using (ABC): CUSTOMER
CUS. No. 21 % CUS. No. 49 % CUS. No. 53 % CUS. No. 60 % Total %
Revenues $250648 100.0% $190517.75 100.0% $184152.75 100.0% $175173.35 100.0% $800491.85 100.0%
-Cost of goods sold $211775 84.5% $160965 84.5% $155525 84.5% $148065 84.5% $676330 84.5%
Gross margin $38873 15.5% $29552.75 15.5% $28627.75 15.5% $27108.35 15.5% $124161.85 15.5%
-Customer-level operating costs $34485.3 13.7% $27921 14.7% $37138.6 20.1% $36762.4 21% $136307.3 17%
-Customer-level operating income $4387.7 1.8% $1631.75 0.8% $(8510.85) -4.6% $(9654.05) -5.5% $(12145.45) -1.5%
The table shows that the profitability of customers by using activity based costing system. The results suggest that the customer number 21 and
the customer number 49 achieve profits for the company, as the customer number 21 has achieved profits of $ 4387.7 a gain of 1.8% of its total
revenues, while the customer number 49 has achieved profits of 1631.75 a gain of 0.8% of its total revenues.
As for customers number 53 and 60, they achieve losses for the company, to the customer number 53 at $ 8510.85 and to the customer number
60at $ 9654.05, with gain of 4.6% loss of the total revenue for the customer number 53, and 5.5% loss of the total revenue for the customer
number 60.
Activity based costing can allocate the customer-level operating costs to customers in a feasible way, which is reflected in the measurement of
the cost customer's costs in correct way, enabling the company to better determine profitability for the customers.

ijcrb.webs.com
INTERDISCIPLINARY JOURNAL OF CONTEMPORARY RESEARCH IN BUSINESS
COPY RIGHT © 2014 Institute of Interdisciplinary Business Research 171
JANUARY 2014
VOL 5, NO 9
Table No. 7: Customer-Profitability Analysis for four Big Customers of DAWOUD Company for the year of 2013 by
using (Traditional): CUSTOMER
CUS. No. 21 % CUS. No. 49 % CUS. No. 53 % CUS. No. 60 % Total %
Revenues $250648 100.0% $190517.75 100.0% $184152.75 100.0% $175173.35 100.0% $800491.85 100.0%
-Cost of goods sold $211775 84.5% $160965 84.5% $155525 84.5% $148065 84.5% $676330 84.5%
Gross margin $38873 15.5% $29552.75 15.5% $28627.75 15.5% $27108.35 15.5% $124161.85 15.5%
-Customer-level operating costs $18575 7.5% $18575 9.7% $18575 10% $18575 10.6% $74300 9.2%
-Customer-level operating income $20298 8% $10977.75 5.8% $10052.75 5.5% $8533.35 4.9% $49861.85 6.3%
The table shows that all customers may achieve profits by using traditional costing system. And the reason for these results is due to the inability
of the company to determine the costs of each customer accurately. Which makes the company is unable to distinguish between the winners
from the losers customers.
ijcrb.webs.com
INTERDISCIPLINARY JOURNAL OF CONTEMPORARY RESEARCH IN BUSINESS
COPY RIGHT © 2014 Institute of Interdisciplinary Business Research 172
JANUARY 2014
VOL 5, NO 9
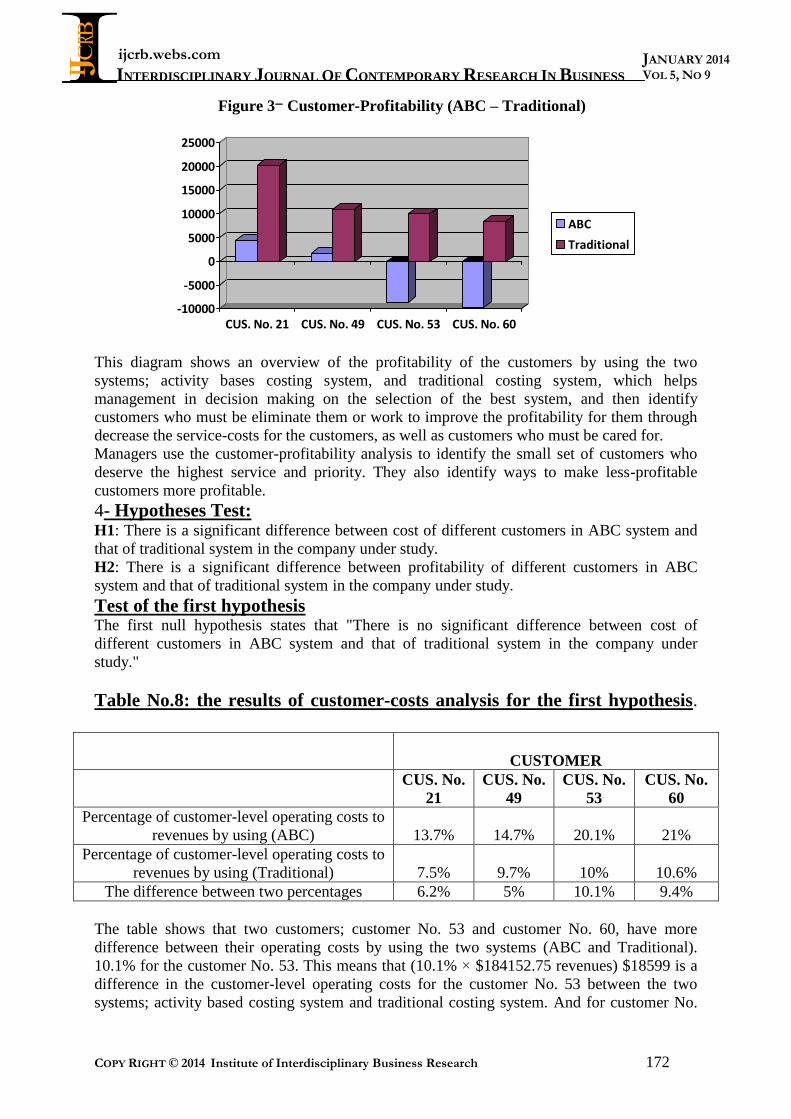
Figure 3- Customer-Profitability (ABC – Traditional)
-10000
-5000
0
5000
10000
15000
20000
25000
CUS. No. 21 CUS. No. 49 CUS. No. 53 CUS. No. 60
ABC
Traditional
This diagram shows an overview of the profitability of the customers by using the two
systems; activity bases costing system, and traditional costing system, which helps
management in decision making on the selection of the best system, and then identify
customers who must be eliminate them or work to improve the profitability for them through
decrease the service-costs for the customers, as well as customers who must be cared for.
Managers use the customer-profitability analysis to identify the small set of customers who
deserve the highest service and priority. They also identify ways to make less-profitable
customers more profitable.
4- Hypotheses Test: H1: There is a significant difference between cost of different customers in ABC system and
that of traditional system in the company under study.
H2: There is a significant difference between profitability of different customers in ABC
system and that of traditional system in the company under study.
Test of the first hypothesis The first null hypothesis states that "There is no significant difference between cost of
different customers in ABC system and that of traditional system in the company under
study."
Table No.8: the results of customer-costs analysis for the first hypothesis.
CUSTOMER
CUS. No.
21
CUS. No.
49
CUS. No.
53
CUS. No.
60
Percentage of customer-level operating costs to
revenues by using (ABC) 13.7% 14.7% 20.1% 21%
Percentage of customer-level operating costs to
revenues by using (Traditional) 7.5% 9.7% 10% 10.6%
The difference between two percentages 6.2% 5% 10.1% 9.4%
The table shows that two customers; customer No. 53 and customer No. 60, have more
difference between their operating costs by using the two systems (ABC and Traditional).
10.1% for the customer No. 53. This means that (10.1% × $184152.75 revenues) $18599 is a
difference in the customer-level operating costs for the customer No. 53 between the two
systems; activity based costing system and traditional costing system. And for customer No.

ijcrb.webs.com
INTERDISCIPLINARY JOURNAL OF CONTEMPORARY RESEARCH IN BUSINESS
COPY RIGHT © 2014 Institute of Interdisciplinary Business Research 173
JANUARY 2014
VOL 5, NO 9
60, the difference is 9.4%. This means that (9.4% × $175173.35 revenues) $16466 is a
difference in the customer-level operating costs for the customer No. 60 between the two
systems; activity based costing system and traditional costing system. These differences are a
significant proportion and prove the first hypothesis of this search, which states "There is a
significant difference between cost of different customers in ABC system and that of
traditional system in the company under study".
Test of the second hypothesis The second null hypothesis states that "There is no significant difference between profitability
of different customers in ABC system and that of traditional system in the company under
study."
Table No.9: the results of customer-profitability analysis for the second
hypothesis.
CUSTOMER
CUS. No.
21
CUS. No.
49
CUS. No.
53
CUS. No.
60
Percentage of customer-profitability to
revenues by using (ABC) 1.8% 0.8% -4.6% -5.5%
Percentage of customer-profitability to
revenues by using (Traditional) 8% 5.8% 5.5% 4.9%
The difference between two percentages -6.2% -5% -10.1% -10.4%
The table shows that two customers; customer No. 53 and customer No. 60, have more
difference between their profitability by using the two systems (ABC and Traditional). 10.4%
for the customer No. 60. This means that (10.4% × $175173.35 revenues) $18218 is a
difference in the customer-level profitability for the customer No. 60 between the two
systems; activity based costing system and traditional costing system. And for customer No.
53, the difference is 10.1%. This means that (10.1% × $184152.75 revenues) $18599 is a
difference in the customer-level profitability for the customer No. 60 between the two
systems; activity based costing system and traditional costing system. These differences are a
significant proportion and prove the second hypothesis of this search, which states ": There is
a significant difference between profitability of different customers in ABC system and that
of traditional system in the company under study ".
Results:
The following points represent the results: 1. There is a fundamental difference between the customer-level operating costs
according to the activity based costing system and the customer-level operating
costs according to traditional costing system
2. There is a fundamental difference between the customer-profitability according to
the activity based costing system and the customer-profitability according to
traditional costing system
3. The results show that the customer-level operating costs have a significant effect
on the customer-costs.
4. The results show that the customer-level operating costs have a significant effect
on the customer-profitability.
ijcrb.webs.com
INTERDISCIPLINARY JOURNAL OF CONTEMPORARY RESEARCH IN BUSINESS
COPY RIGHT © 2014 Institute of Interdisciplinary Business Research 174
JANUARY 2014
VOL 5, NO 9
Recommendations:
The following points can be considered as real recommendations in this
field: 1. Need to work on the allocation of the costs of customer service to customers in a
reasonable manner.
2. Need to work on the application of the activity based costing system, because it
provides a better mechanism for the allocation of customer-level operating costs.
3. The need to reconsider the customer-level operating costs, because it will impact on
the customer- profitability.

ijcrb.webs.com
INTERDISCIPLINARY JOURNAL OF CONTEMPORARY RESEARCH IN BUSINESS
COPY RIGHT © 2014 Institute of Interdisciplinary Business Research 175
JANUARY 2014
VOL 5, NO 9
References:
Books 1. Allseed, Ismail M. Strategic Management. Aljameiah Aldar for publishing, Egypt,
2007.
2. Atkinson, K. ; Matsumura, Y. Management Accounting. International Edition ,
Prentice Hall, 2007.
3. Atkinson, K., Advanced Management Accounting. International Edition, Prentice
Hall, 1998.
4. Horngren, C. T. ; and others, cost Accounting., 14th
Edition, Pearson, 2012.
5. Zahirul H. Strategic Management Accounting. 2nd
Edition, Prentice Hall, 2007.
Researches: 1. Bih-Ru L. (2007) Management accounting in ERP integrated MRP and TOC
environments, Industrial Management & Data Systems, Vol. 107, No. 8.
2. Chen I.J., Popovich K. (2003) Understanding customer relationship management
(CRM). People, process and technology, Business Process Management Journal, Vol.
9, No. 5.
3. Cugini A., Caru A., Zerbini F. (2007) The cost of customer satisfaction: a framework
for strategic cost management in service industries, European Accounting Review,
Vol. 16, No. 3.
4. Dalci I., Tanis V., Kosan L. (2009) Customer profitability analysis with Time-Driven
Activity-Based Costing: a case study in a Hotel, accepted paper Emerald Group
Publishing Limited;
5. Helgesen O. (2007) Customer accounting and customer profitability analysis for the
order handling industry – A managerial accounting approach, Industrial Marketing
Management, No. 36.
6. Kazunori Itō, Mohsen Souissi, "managerial accounting as a tool for corporate strategy:
synergy creation and anergy inhibition", Journal of International Business Research,
Volume 11, Number 1 2012.
7. Lambert D. (2010) Customer relationship management as a business process, Journal
of Business & Industrial Marketing, Vol. 25, No. 1.
8. Lobo M. X. ; Tilt C. ; Forsaith D., "The Future of Management Accounting: A South
Australian Perspective". Journal of Applied Management Accounting Research, 2004.
9. Morten Holm & V. Kumar & Carsten Rohde, "Measuring customer profitability in
complex environments: an interdisciplinary contingency framework", Journal of the
Academy of Marketing Science (2012).
10. Mullika Jumpapang, Phapruke Ussahawanitchakit, "marketing learning orientation,
service innovation, customer value creation and marketing profitability: Empirical
study of hotel businesses in Thailand". International journal of business research,
Volume 12, Number 4, 2012.
11. Murphy J.J., Burton J., Gleaves R., Kitshoff J. (2005) Converting Customer Value:
From Retention to Profit, Barnes & Noble;
12. Ngai E.W.T. (2005) Customer relationship management research (1992 - 2002) An
academic literature review and classification, Marketing Intelligence & Planning,
Vol. 23, No. 6.

ijcrb.webs.com
INTERDISCIPLINARY JOURNAL OF CONTEMPORARY RESEARCH IN BUSINESS
COPY RIGHT © 2014 Institute of Interdisciplinary Business Research 176
JANUARY 2014
VOL 5, NO 9
13. Ngai E.W.T., Xiu L., Chau D.C.K. (2009) Application of data mining techniques in
customer relationship management: a literature review and classification, Expert
Systems with Applications, No. 36.
14. Raj Devasagayam, Nicholas R. Stark, and Laura S. Valestin , " Examining the
Linearity of Customer Satisfaction: Return on Satisfaction as an Alternative", journal
of Business Perspectives and Research, January-June, 2013.
15. Sharkar M. Z. H. ; Obhan, M. A. S. ; Sultana, S., "Management Accounting
Development and Practices in Bangladesh", BRAC University Journal, vol. III, no.2,
2006.
16. Shebab E.M., Sharp M.W., Supramanian L., Spedding T.A. (2004) Enterprise
resource planning. An integrative review, Business Process Management Journal,
Vol. 10, No. 4.
17. Sin L., Tse A., Yim F. (2005) CRM: conceptualization and scale development,
European Journal of Marketing, Vol. 39, No. 11/12.
18. Sliman S. Alsoboa, Jehad Saleh Aldehayyat, "The Impact of Competitive Business
Strategies on Managerial Accounting Techniques: A Study of Jordanian Public
Industrial Companies", International Journal of Management Vol. 30 No. 2 Part 1
June 2013.
19. Stapleton D., Pati S., Beach E., Julmanichoti P. (2004) Activity based costing for
logistics and marketing, Business Process Management Journal, Vol. 10, No. 5.
20. Tuan Z. T. M. ; Malcolm S. ; Hadrian D., "Management Accounting and
Organizational Change: An Exploratory Study in Malaysian Manufacturing Firms".
Journal of Applied Management Accounting Research, Vol.8.No.2, 2010.
21. Van Raaij E.M. (2005) The strategic value of customer profitability analysis,
Marketing Intelligence & Planning, Vol. 23, No. 4.
22. Zohreh Hajiha and Samad S. Alishah, " implementation of time-driven activity-based
costing system and customer profitability analysis in the hospitality industry :
evidence from Iran". Economics and Finance Review Vol. 1(8) pp. 57 – 67, October,
2011.