use of reliability assessment method to quantify probabilistic … · · 2017-07-06use of...
TRANSCRIPT

Use of Reliability Assessment Method to
Quantify Probabilistic Safety of Reactor
Thermal Hydraulic Parameters
Presented by
1
N. H. Badun and M. H. Altaf
IAEA-CN-251-5, 6-9 June 2017, Vienna, Austria
Badrun Nahar Hamid, PhD RPED, INST, AERE
Bangladesh Atomic Energy Commission E-Mail:[email protected]

Safety Analysis of a System based on probabilistic
concept. This term does not imply any particular approach or any particular interpretation of probability.
2
What is Probabilistic Safety Analysis (PSA)?
Why PSA is necessary?
Safety margin inherent in the design for operation alter
due to uncertainties arise from the factors such as
crack like defects , degradation of material strength,
accuracy and frequency of pre- and in service
inspections and service loadings etc. It means it is not
realistic in most problems to assign specific, constants
values to this parameters. These parameters can be
best represented statistical distributions rather than
single values representing absolute certainty.

Levels of PSA for Reactor Safety Analysis Level 1 PSA (Core Damage frequency)
Level 2 PSA (Containment Failure Frequency with Source Term Analysis )
Level 3 PSA (Risk Analysis)
3

What is Reliability ?
Reliability is the probabilistic measure of structural safety and it is the numerical value obtained by the reliability analysis. Staring from the principles of limit state analysis, reliability analysis is then applied to the codified design to calculate the probability of failure or unacceptable performance of the structural component.
4

How reliability analysis can help?
Reliability analysis enables engineer to tackle the
Analysis
Quantification
To understand the requirement for frequency of inspection
To perform risk assessment
To take appropriate decision whether the structure is at the
design stage or in the construction stage or in actual use.
5

Uncertainties in Reliability Analysis
The accuracy in reliability measurement depends on the
analyst’s present state of knowledge and experience about the
structure, and the computed reliability is likely to change as
more information becomes available. Lack of information about
the uncertainties involved with different parameters may result
in the prediction of structural reliability being inaccurate. These
uncertainties can arise from a large number of sources:
Physical Uncertainties
Statistical Uncertainties
Model Uncertainties
Human Errors
6

7
Limit State Condition and Safety Margin Equation
The structural performance of a complete structure or part of it is generally described by a specified set of limit states that separate the desired states of the structure from adverse states. In a reliability context, the random variables associated with each limit state need to be identified. Therefore, it is necessary to group these variables into demand and capacity variables so that a safety margin equation can be defined. Then the system failure is given by single limit state function , say

where S is the load variable known as demand variable, and R is the resistance effect variable known as a capacity variable. More generally, if there are n basic random variables that represent a vector of n basic variables, the safety margin or limit state equation can then be formulated as
Above equation is the safety margin equation, and the reliability or the probability of non-violation of the limit state can be expressed as R = 1-Pf = 1 - P [M 0] 8

9
Method for Estimating Reliability

Reliability Assessment Methods
First Order Reliability Method (FORM)
Second Order Reliability Methods (SORM)
Monte Carlo Simulation Method
• Importance Sampling Method
• Directional Simulation Method Variance Reduction
Techniques
10

11
FORM/SORM Method

12
Limitations of FORM/SORM

13
Limitations of FORM/SORM

14
Crude Monte Carle Simulation

15
Crude Monte Carle Simulation

16
Crude Monte Carle Simulation

17
Crude Monte Carle Simulation

18
The estimate of failure probability Pf is itself a random variable with its own mean and variance. In crude Monte Carlo analysis, this variance is dependent only on the number of trials and the true value of Pf. A number of so called variance reduction techniques are available which serve to improve the efficiency of the calculation considerably by reducing the number of trials so that the solution will be obtained within a small confidence range. Two such techniques which are useful in reliability studies are importance sampling and directional simulation. For these methods to be used a certain amount of additional information is required- for example, the location of the region of the sampling space which is going to contribute most to the failure probability. Only directional simulation is discussed here.
Variance Reduction Technique

Application of the Methods
The methods that we shall be examining originated in the field of structural engineering where high levels of reliability are normally to be expected such as in advanced systems : aerospace structures, offshore oil and gas production, nuclear pressure vessels or system, etc. However, these methods have wide applicability now a days in other fields such as electrical, mechanical, electronic even in financial systems, although in some areas the full potentials is still to be realized.
Application in Fracture Mechanics
Probabilistic Fracture Mechanics (PFM), which blends fracture mechanics with the theory of probability and statistics, advances the reliability assessment of structural systems. It plays an important role in probabilistic safety assessment of systems with crack-like defects. PFM focuses on the sizes and shapes of cracks, their location and orientation and their probabilistic descriptions.
6/7/2017
19

Developing a reliability-based methodology for the fracture
integrity assessment of a structural component using Finite
Element Method (FEM)
Research Tool: ABAQUS and ZENCRACK
Typical geometry
Ductile Material
Fracture failure of an expansion loop containing a crack
20

FE Modelling and Analysis
21

g(ZP, ZT,ZY, ZJIC) = JIC (ZJIC) – J(ZP, ZT, ZY) 0
ZP ~ Pressure, P, Gumbel Variable ZT ~Temperature, T, Normal Variable ZY ~ Material Yielding, Y, Lognormal Variable + Temperature Dependency ZJIC ~ Fracture Toughness, JIC, Lognormal Variable
Initiation Based Fracture Failure
22

Zk
Zi
M = g(Z) = 0
(xi, xk)
Failure Region Safe Region
q
j
ff rq
P1
22
211
Directional Simulation Method
q ~ number of trials, rf is the failure
surface distance from the origin
r
23 23

q
j
jf rq
P1
22
411
The present problem is in four-dimensional Space:
g(ZP, ZT,ZY, ZJIC) = JIC (ZJIC) – J(ZP, ZT, ZY) 0
24

25
Box and Muller Method for Random Number Generation
It produces a pair of independent standard normal
variates given by
where u1 and u2 are independent random variables
from the same rectangular distribution in the interval
[0,1].

SM = JIC -J 0
Calculation of rf for q=75 trials
q
j
jf rq
P1
22
411
26

0
1
2
3
17 18 19 20 21 22
-Lo
g10(P
f)
crack depth, mm
Probability of failure with respect to the crack depth
27

Crack Length:
Crack Depth (mm) Pf Smallest rf 70:21 8.556E-2 1.368 < 1.6818 70:20 1.889E-2 2.077 < 2.4181 70:19 4.462E-3 2.614 < 2.7636 70:18 1.887E-3 2.896 < 3.000 70:15 4.5844E-4 3.314 < 3.3660 70:12 8.5710E-5 3.758 < 3.8863 70:10 4.3862E-5 3.928 < 4.0880
Results
28
Probability of failure with respect to the crack depth

Application in Reactor CoreThermal Hydraulics
Research Tool: COOLOD-N2 Code
Core arrangement of the TRIGA reactor.
Stainless Steel
Top End Fitting
Graphite
Graphite
Uranium
Zirconium
Hydride
Stainless Steel
Bottom End Fitting
TRIGA LEU fuel
29

30
Clad Clad Coolant Coolant Fuel meat
neutron
neutron
neutron
neutron
fission
heat
heat
heat
heat heat
heat heat
heat heat
Heat Source
30

Two major design criteria were set up for the thermal hydraulic
design so that fuel rods may have enough safety margins for the
condition of normal operation.
(1) To avoid nucleate boiling of coolant anywhere in the core in
order to give enough allowance against the burnout of the fuel elements
even at the hottest spot in the core
(2) To give enough margin against the burn out itself of the fuel
elements under the condition of normal operation so that there may be
enough margin also for operational transients. The departure from the
nucleate boiling ratio (DNBR) was decided to be not less than 1.5 to
meet this criterion.
Thermal Hydraulic Design Criteria
31

6/7/2017 32

Power distribution in the reactor fuel cells
Heat conduction in fuel rods
Heat Transportation from fuel to coolant
flow
flow distribution and heat balance
peak fuel temperature
onset of nucleate boiling
critical heat flux/DNB heat flux
flow instability
vibrations and deformation of fuel plates
Subject of Thermal Hydraulics
33

34
Thermal-hydraulic Analysis Procedures
Coolant temperature
ONB conditions DNB heat flux
Flow distribution
Flow rate Pressure loss
Heat Transportation
Heat transfer coefficient
Fuel surface temperature
Fuel clad temperature
Power distribution

35
Computer Codes for Thermal-hydraulic & Safety Analysis
Steady State Thermal-Hydraulic Analysis Codes
Transient Thermal-Hydraulic Analysis Codes
PLTEMP/ANL…………..ANL
NATCON…………………..ANL
MATRA-h………………….HANARO
COOLOD-N2…………….JAEA
HEATHYD…………………IAEA
STAT…………………………TRIGA
NCTRIGA………………….TRIGA
EUREKA2/RR…………….JAEA
PARET…………………………ANL
RELAP5……………………….NRC
COBRA…………………………IAEA
MARS…………………………..HANARO

Outline of TRIGA Mark-II Research Reactor
The research reactor TRIGA Mark-II is a 3MW pool
type, light water moderated and cooled reactor with
19.7 % LEU Rod type fuels.
Steady State Condition or Normal Operational
Condition. Two modes are adapted for core cooling ,
these are :
One is a natural circulation cooling mode for a
"Low power range" of up to 500KW
The other is a forced-convection cooling mode
for a "High power range", of up to 3MW.
36

Parameters Design Value
Fuel Element 20% w/o U-ZrH, 19.7% enriched
Total number of fuel in the core 100
Cladding Stainless Steel 304L
Reflector Graphite
Inlet Temperature OC 40.6
Radius of Zr rod (cm) 0.3175
Outline of TRIGA Mark-II Research Reactor
37

Fuel radius (cm) 1.82245 Fuel radius (cm)
Clad outer radius
(cm)
1.87706 Clad outer radius
(cm)
Gap width (cm) 0.00381 Gap width (cm)
Active fuel length
(cm)
38.1 Active fuel length
(cm)
Flow area (cm2) 5.3326 Flow area (cm2)
Hydraulic Diameter
(cm)
1.80594 Hydraulic Diameter
(cm)
Pressure (Pa) 1.60654 105 Pressure (Pa)
Outline of TRIGA Mark-II Research Reactor
38

Friction Loss Coefficient 0.07
Pressure Loss Coefficient 1.81 (inlet); 2.12 (Outlet)
Pitch (cm) 4.5716
Coolant Velocity (cm/sec)
(a) Natural Convection Mode
(b) Forced Flow
30.48
287.58
Mass Flow rate, kg/m2s
(a) Natural Convection Mode
(b) Forced Convection Mode
145.20
3.2089 103
Outline of TRIGA Mark-II Research Reactor
39

40
Fuel rod
Gap
Clad
CL
r
Fuel Meat
z
0
Hea
t co
nd
uct
ion
Heat conduction
cool
ant
cool
ant
Fuel Rod Temperature of TRIGA Type Reactor
41
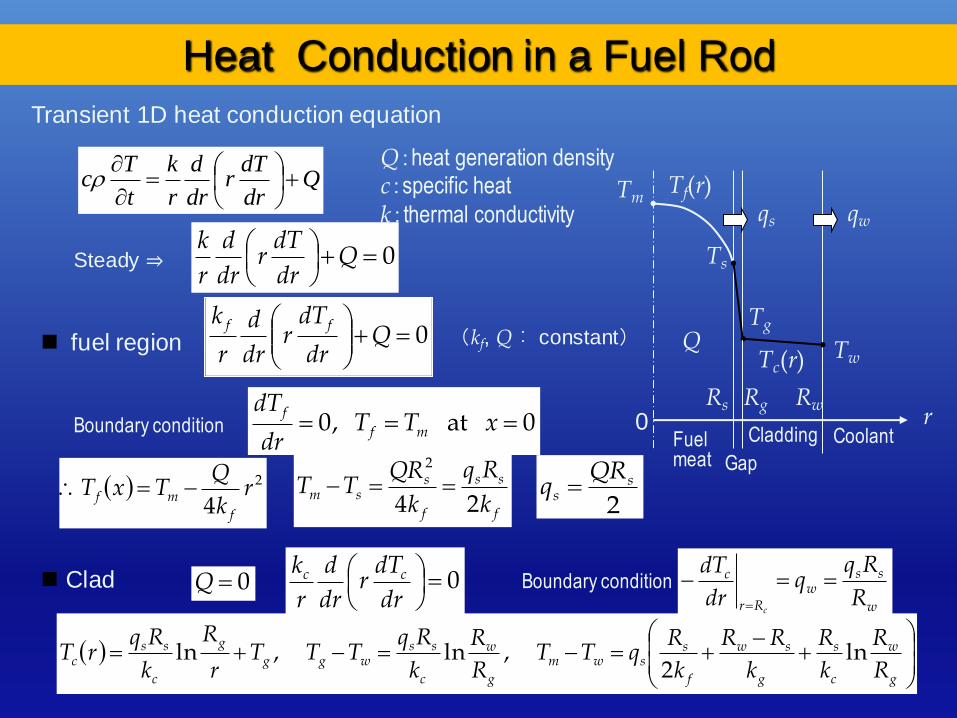
Heat Conduction in a Fuel Rod
Transient 1D heat conduction equation
Qdr
dTr
dr
d
r
k
t
Tc
Steady ⇒ 0
Q
dr
dTr
dr
d
r
k
fuel region 0
Q
dr
dTr
dr
d
r
k ff
Q:heat generation density c:specific heat
k:thermal conductivity
(kf, Q : constant)
Boundary condition 0 at ,0 xTTdr
dTmf
f
2
4r
k
QTxT
f
mf 2
ss
QRq
f
ss
f
ssm
k
Rq
k
QRTT
24
2
Clad 0Q 0
dr
dTr
dr
d
r
k cc
w
ssw
Rr
c
R
Rqq
dr
dT
c
g
w
c
s
g
sw
f
sswm
g
w
c
sswgg
g
c
ssc
R
R
k
R
k
RR
k
RqTT
R
R
k
RqTTT
r
R
k
RqrT ln
2 ,ln ,ln
Boundary condition
0 Fuel meat
Cladding Coolant
Tm Tf(r)
Ts
Tc(r) Tw
Rs r
Q
qs qw
Tg
Rw
Gap
Rg

42
Gap Conductance
gsgG TThq
0 Rs Rg Rw uniform gap
gs
gs
cf
eff
gas
opengTT
TTkh
44
,
111
eff : effective gap width (Rg-Rs) kgas : thermal conductivity of gas
effect of solid conductance
contactopengg hhh ,
eff
i
cf
cf
contactH
p
kk
kkCh
2
pi : contact pressure H : Meyer’s hardness number C : constant
(theoretical)
conduction radiation
eff
Ts
Tg Tc
Tm
Solid conductance

43
Fluid Equations
Fluid mass equation
Fluid momentum equation
Fluid energy equation
A
w
g
x
w
tA
w
x
F
x
zgA
x
pA
x
vw
t
vA k
x
Aq
vhw
xt
eA w
w
2
2
qw
0 Wall heat flux
Mass flow rate
gravity
Flow area
Elevation x z
Distance in the flow direction
: fluid density v : fluid velocity p : thermodynamic pressure Fk : frictional force e : fluid specific energy u : fluid specific internal energy h : fluid enthalpy : gravity potential function Aw : wall heated area t : time
2
2vue
puh
zg

g(Zmin, ZT) = DNBR(Zmin) – DNBR(ZT) 0
ZT ~Inlet Temperature, Normal Variable DNBR(Zmin) ~ Minimum DNBR, Normal Variable
Safety Margin Equation
44
Definition of DNBR

45
Probability of failure with respect to Rod Hot Factor
for 50 trials

Conclusion
It is seen that the probability of failure increases with increase in rod factor values, which is expected. Hence, it seems the method works well in determining fuel failure probability. However, this is indeed a very preliminary attempt where reactor steady state has been considered. As a part of reactor safety analysis, the authors at present have given focus to calculate the fuel failure probability as a function induced reactivity considering reactivity initiated transient analysis. It can be concluded that the method opens a new area for further research in reactor thermal hydraulics.
46

47
References
[1] First Order Reliability Concepts for Design Codes, CEB Bulletin No. 112, Joint Committee on Structural Safety (JCSS), (1976). [2] Joint Committee on Structural Safety, JCSS-OSTL/DIA/VROU-10-11-20000, 637-686, (2000). [3] Thoft-Christensen, P. and Baker; M. J., Structural Reliability Theory and its Applications, New York, (1982). [4] Melchers, R.E., Structural Reliability-Analysis and Prediction, John Wiley & Sons, UK, 1999. [5] Badrun Nahar Hamid, “A Methodology for the Reliability-Based Fracture Assessment of Structural Components”; PhD Thesis, University of Aberdeen, Scotland, United Kingdom, (2006).

48
[6] Ditlevsen, O., Olesen, R., & Mohr, G., Struc. Safety, Solutions of a class of load combination problems by directional simulation, 4 (1987) 95-109.
[7] Ditlevsen, O. and Bjerager, P., Jour.of Eng. Mech., Plastic reliability analysis by directional simulation, ASCE, 105(1989)1347-1362. [8] Baker, M. J. and Turner, R., Reliability Methods for the Design and Operation of Offshore Structures, Brite Project No. 1270, 1991. [9] Box, G.E.P. and Muller, M.E., Ann.of Math. Stat., A note on the Generation of Random Normal Deviates, 29 (1958). [10] Kaminaga, M., COOLOD-N2: A Computer Code for the analyses of Steady State Thermal Hydraulic in Research Reactors”, JAERI, 1994.

6/7/2017 49