use of recycled rubber tire crumbs for waterproofing of
TRANSCRIPT
International Journal of Civil and Structural Engineering Research ISSN 2348-7607 (Online) Vol. 3, Issue 2, pp: (95-132), Month: October 2015 - March 2016, Available at: www.researchpublish.com
Page | 95 Research Publish Journals
Use of Recycled Rubber Tire Crumbs for
Waterproofing of Concrete
Anjerick J. Topacio1, Nikko C. Gozo
2, Sydh Roeth V. Marquez
3,
Rommel Victor M. Poblete4, Harriet S. Ramos
5
Department of Civil Engineering College of Engineering, Computer Studies and Architecture, Lyceum of the Philippines
University-Cavite Governor‘s Drive, General Trias Cavite Philippine 4107
Abstract: This study describes the use and testing of recycled rubber tire crumbs as alternative construction
material with waterproofing ability that could serve as a better alternative to the existing waterproofing products.
This research seeks the further use of rubber tire crumbs as a waterproofing agent in concrete structures to help
improve the recycling of waste materials in accordance with the principle of sustainable development. The test
procedures used in this research made use of experiments like water absorption test, sorptivity test, and water
permeability test, utilizing different sieve sizes of rubber crumbs. The results of the tests for the waterproofing
ability of the rubber concrete mixture using these test procedures were compared with some of the waterproofing
products available in the market to determine if the rubber crumbs could be an alternative. The compressive
strength for non- bearing structures (600 psi) of the rubber concrete mixture has also been maintained since
previous experiments with rubber components proved that the compressive ability of the concrete drastically went
down. It is hoped that this research can help future studies in generating innovations with the use of rubber
crumbs in construction.
Keywords: Waterproofing of Concrete Recycled Rubber Tire Crumbs.
1. INTRODUCTION
1.1 Background:
Discarded vehicle tires are serious contributors to solid wastes which have historically been disposed of in landfills. This
rubber waste has been considered as one of the major environmental challenges facing municipalities around the world
because waste rubber does not easily decay even after a long period of landfill treatment.
Although concrete is the most popular construction material, it has some limitations -- low tensile strength, low ductility,
low energy absorption, shrinkage, and cracking associated with hardening and curing. (Wang et al. 2000) Several studies
performed recently have shown that application of the recycled tire rubber might improve these weak characteristics of
concrete.
Rubberized asphalt has been used for decades on roadways. As proof, The Intermodal Surface Transportation Efficiency
Act (ISTEA), promulgated in 1991, mandated the use of a minimum of 5% recycled rubber by weight of asphalt placed,
and the per cent of rubber used was to increase gradually up to 20% by the year 1997. The mandate, however, was
revoked in 1996 (Khatib et al. 1999), leaving rubberized concrete a technology infant. Many studies have since been
performed to investigate the feasibility of the use of rubber in concrete. Since a number of ways to use the recycled
rubber in the concrete design is possible and since there are still many factors and properties that should be investigated,
it may be difficult to expect that mass production of rubberized concrete will be available in the market soon today or in
the near future. However, many studies have demonstrated the mechanical and environmental advantages of the use of
recycled tire as additive to cement concrete.

International Journal of Civil and Structural Engineering Research ISSN 2348-7607 (Online) Vol. 3, Issue 2, pp: (95-132), Month: October 2015 - March 2016, Available at: www.researchpublish.com
Page | 96 Research Publish Journals
One of the solutions suggested is the use of tire rubber particles as additives in cement-based materials. Rubber has
physical properties such as low density, and moisture absorption, as well as good thermal and acoustic insulator that
makes it a good additive for concrete‘s waterproofing as well as insulation. By also recycling rubber tires, we can
contribute in saving our environment.
1.2 Glossary:
Crumb rubber is the name given to any material derived by reducing scrap tires or other rubber into uniform granules
with the inherent reinforcing materials such as steel and fiber removed along with any other type of inert contaminants
such as dust, glass, or rock. Crumb rubber is manufactured from two primary feedstock: tire buffing, a byproduct of tire
retreading and scrap tire rubber. Scrap tire rubber comes from three types of tires: passenger car tires, which represent
about 84 percent of units or approximately 65 percent of the total weight of U.S. scrap tires; truck tires, which constitute
15 percent of units, or 20 percent of the total weight of U.S. scrap tires; and off-the-road tires, which account for 1
percent of units, or 15 percent of the total weight of U.S. scrap tires. End product yields for each of these tire types are
affected by the tire‘s construction, strength and weight. On average, 10 to 12 pounds of crumb rubber can be derived from
one passenger tire. Overall, a typical scrap tire contains (by weight): 70 percent recoverable rubber, 15 percent steel, 3
percent fiber, and 12 percent extraneous material (e.g. inert fillers)
1.3 Preview:
The next section, section 2, contains the statement of the problem, after which the objectives, and significance of the
study are explained in Section 4, section 5 then provides a Review of Previous Studies and Related Literature, while
Section 6 explains the methods used in the study. The Results and discussion are then presented in Section 7, while the
Conclusion and Recommendation are given in Section 8. The next section, Section 9, presents the Acknowledgement, and
finally Section 10, lists the References.
Crumb Rubber Particle Size Measurement:
Different crumb rubber market segments have different crumb rubber size requirements. Within a specific crumb rubber
market, each application has its own requirements in terms of particle size and purity. Although ASTM International,
formerly known as the American Society for Testing and Materials (ASTM), has standards for specifying different size
ranges of crumb rubber, such as 30 mesh or 80 mesh, it is often necessary for crumb rubber manufacturers to have a more
detailed knowledge of the range of particle sizes, not just the maximum size. To accomplish this, some method of particle
size determination is necessary.
Sieve analysis is the most common technique for determining particle size measurement. It consists of shaking and
tapping a measured quantity of crumb rubber sample through a specified number of test sieves over a specified time. The
amount of sample retained on each screen is weighed and results are given as the percentage of sample retained on each
screen. The recommended procedure for sieve analysis using the Rotap method is provided in ASTM 5644.
Rubber Tire Crumbs are recycled rubber from automotive and truck scrap tires in which steel and fluff are removed
during the recycling process, leaving tire rubber with a granular consistency. Continued processing with a granulator
and/or cracker mill, possibly with the aid of cryogenics or mechanical means, can reduce the size of the particles further.
The particles are then sized and classified based on various criteria including color (black only or black and white). The
granulate is sized by passing it through a screen, with the size based on a dimension (1/4") or mesh (holes per inch: 10,
20, etc.)
Cement is a material with adhesive and cohesive properties that make it capable of bonding material fragments
(aggregates) into a compact whole. In this process, it imparts strength and durability to the hardened mass called
concrete.
Concrete is a composite material composed of water, coarse granular material (the fine and coarse aggregate or filler)
embedded in a hard matrix of material (the cement or binder) that fills the space among the aggregate particles and glues
them together. The cements used in the making of concrete are called hydraulic cement – so named, because they have
the property of reacting chemically with water in an exothermic (heat– generating) process called hydration that results in
water–resistant products. The products of hydration form a viscous cement paste, which coats the aggregate surfaces and
fills some of the void spaces between the aggregate pieces. The cement paste loses consistency (stiffens) on account of
gradual loss of ―free water‖, absorption and evaporation, and subsequently ―sets‖, transforming the mixture into a solid

International Journal of Civil and Structural Engineering Research ISSN 2348-7607 (Online) Vol. 3, Issue 2, pp: (95-132), Month: October 2015 - March 2016, Available at: www.researchpublish.com
Page | 97 Research Publish Journals
mass. If the consistency of the cement paste is either excessively ―harsh‖ or excessively ―wet‖, there is a danger of
segregation, and the aggregate tends to separate out of the mix; which will adversely affect the quality of the hardened
concrete and result in a ―honeycomb‖ appearance. The freshly set cement paste gains strength with time (hardens), on
account of progressive filling of the void spaces in the paste with the reaction products, also resulting in a decrease in
porosity and permeability.
Permeability is a measure of the ability of a porous material to allow fluids to pass through it
Portland Cement is the most common type of cement in general use around the world, used as a basic ingredient of
concrete, mortar, stucco, and most non-specialty grout
Aggregates are inert granular materials such as sand, gravel, or crushed stone that, together with water and Portland
cement, are essential ingredients of concrete. Since aggregate occupies about three–quarters of the volume of concrete, it
contributes significantly to the structural performance of concrete, especially strength, durability and volume stability.
Aggregates are formed from natural sources by the process of weathering and abrasion, or by artificially crushing a larger
parent (rock) mass. Other types of aggregates may be used for plain concrete members (Code Cl. 5.3.1) but as far as
possible, preference shall be given to natural aggregates. Aggregates are generally categorized into fine aggregate
(particle size between 0.0075 mm and 4.75 mm) and coarse aggregate (particle larger than 4.75 mm), as described in IS
383: 1970.
Sand, taken from river beds and pits, is normally used as fine aggregate, after it is cleaned and rendered free from silt,
clay and other impurities; stone (quarry) dust is sometimes used as a partial replacement for sand.
Gravel and crushed rock are normally used as coarse aggregate. The maximum size of coarse aggregate to be used in
reinforced concrete work depends on the thickness of the structural member and the space available around the
reinforcing bars. Generally, a maximum nominal size of 20 mm is found to be satisfactory in RC structural elements.
However, in cases where the member happens to be very thin, the Code (CI 5.3.3) specifies that the size should be
restricted to one–fourth of the minimum thickness of the member. In the case of heavily reinforced members, it should be
restricted to 5 mm less than the minimum clear spacing between bars or minimum cover to reinforcement, whichever is
smaller. In such situations, the maximum nominal size is frequently taken as 10 mm. In situations where there is no
restriction to the flow of concrete, as in most plain concrete work, there is no such restriction on the maximum aggregate
size. It is common to use aggregate up to 40 mm nominal size in the base concrete underneath foundations. The Code (CI
5.3.3) even permits the use of ―plums‖ above 160 mm in certain cases of mass concreting up to a maximum limit of 20
percent by volume of concrete.
Plums are large random–shaped stones dropped into freshly– placed mass concrete to economize on the concrete;
such mass concrete is sometimes called ―Cyclopean concrete‖. Mention may also be made of a special type of aggregate,
known as lightweight aggregate, which (although not used for reinforced concrete work) is sometimes used to
manufacture ―lightweight concrete‖ masonry blocks, which have low unit weight and good thermal insulation and fire
resistance properties. Lightweight aggregate may be obtained from natural sources of ―sintered fly ash‖ or ―bloated clay‖
(conforming to IS 9142 : 1979)
Density in a qualitative manner is the measure of the relative "heaviness" of objects with a constant volume.
Water that is fit for human consumption (potable water) is generally considered to be suitable for concreting but
when the potability of the water is suspect, it is advisable to perform a chemical analysis of the water, in accordance with
IS 3025. The pH value of the water should not be less than 6. The concentration of solids in water should be within
certain ―permissible limits‖ that are specified in the Code (CI 5.4) In particular, the content of sulphates (as SO3 ) is
limited to 400 mg/l, while that of chlorides is restricted to 500 mg/l in reinforced concrete (and 2000 mg/l in plain
concrete). Sea water is particularly unsuitable for mixing or curing of concrete. The Code also recommends testing for
initial setting time of cement paste (as per IS 4031 (Part 5): 1988) and compressive strength of concrete cubes (as per IS
516: 1959), when there is doubt regarding the sustainability of the water for proper strength development of concrete.
The water in a concrete mix is required not only for hydration with cement, but also for ―workability.‖
Workability may be defined as ―that property of the freshly mixed concrete (or mortar) which determines the ease and
homogeneity with which it can be mixed, placed, compacted and finished‖. The main factor that influences workability is,
in fact, the water content (in the absence of admixtures), as the ―inter–particle lubrication‖ is enhanced by the mere

International Journal of Civil and Structural Engineering Research ISSN 2348-7607 (Online) Vol. 3, Issue 2, pp: (95-132), Month: October 2015 - March 2016, Available at: www.researchpublish.com
Page | 98 Research Publish Journals
addition of water. The amount of water required for lubrication depends on the aggregates type, texture and grading: finer
particles require more water to wet their larger specific surface; angular aggregates require more water than rounded ones
of the same size; aggregates with greater porosity consume more water from the mix. The main factor that influences
workability is, in fact, the water content (in the absence of admixtures), is the ―inter–particle lubrication which is
enhanced by the mere addition of water. The amount of water required for lubrication depends on the aggregates type,
texture and grading: finer particles require more water to wet their larger specific surface; angular aggregates require
more water than rounded ones of the same size; aggregates with greater porosity consume more water from the mix.
Water content in a mix is also related to the fineness of cement – the finer the cement, the greater the need for water – for
hydration as well as for workability. It may be recalled that workability is required to facilitate full placement in the
formwork (even in areas of restricted access) and full compaction, minimizing the voids in concrete. If a mix is too dry,
bubbles of entrapped air create voids, and there is danger of segregation. The addition of water provides for better
cohesion of the mix and better compaction, and causes the air bubbles to get expelled. However, there is a danger in
adding too much water, because it would be water, rather than cement paste, that takes place of the air bubbles. This
water evaporates subsequently, leaving behind voids.
Hence, even if the fresh concrete were to be ―fully compacted‖, voids may still be present in the hardened concrete,
adversely affecting its strength, impermeability, etc. Moreover there is the danger of segregation of ―grout‖ (cement plus
water) in a very wet mix. The excess water tends to rise to the surface of such a mix, as the solid constituents settle
downwards; this is called bleeding.
The ―optimum‖ water content in a mix is that at which the sum of volumes of entrapped air and of entrapped water is a
minimum, and for which the density achievable (by the method of compaction employed) is a maximum. The NSCP
(2010) Code recommends that the workability of concrete should be controlled by the direct measurement of water
content in the mix. For this, workability should be checked at frequent intervals, by one of the standard tests (slump,
compacting factor of vee – bee), described in IS 1199: 1959. The NSCP (2010) Code also recommends certain ranges of
slump, compacting factor and vee – bee time that are considered desirable for various ―degree of workability‖ (very low,
low, medium, high) and placing conditions. For the purpose of mix design, the water content is usually taken in the range
of 180 – 200 li/m3 (unless admixtures are used). If the aggregate is wet, then this should be appropriately accounted for,
by measuring the moisture content in the aggregate.
Isn't normal, good quality concrete waterproof?
In order to provide sufficient workability for proper placing and compaction and to facilitate proper mixing and
transportation to site, most plant-batched concrete will contain water in excess of that required to simply hydrate the
cement. As concrete hardens, this excess water leaves the concrete and creates a network of fine capillaries and internal
pores. Natural capillary absorption is the predominant mechanism of water transport through concrete whether or not a
head of hydrostatic pressure is present. In essence, as far as water is concerned, normal concrete behaves like a dense
sponge. One cubic meter of normal, good quality dry concrete will absorb the equivalent of roughly 60 liters of water in
just 30 minutes! (Test in accordance with BS 1881, part 122). It is the speed of this absorption that is important as this
will directly affect the level of dampness, say in a basement, or the onset of reinforcement corrosion due to dissolved
chlorides being carried into the concrete by water, say in a sub-sea tunnel, the tidal zone of bridge supports or from
melting slush after de-icing salt has been applied.
Water Absorption refers to the amount of water absorbed by a composite material when immersed in water for a
stipulated period of time.
Waterproofing refers to the process of reducing a material‘s capillary water absorption properties or lowering its
permeability to water.
Waterproof -- The term '‖Waterproof‖ conjures up a whole range of ideas. If the structure in question is to retain
water, say a water storage tank, then the designer may simply work to the design requirements of the water retaining
code, BS 8007, which sets out to limit crack width. This may be achieved by utilizing a good quality, ordinary concrete,
close attention to joint details and providing extra crack control reinforcement; dampness being acceptable. If, on the
other hand, the structure is habitable or designed to house sensitive electronic equipment or valuable archives, then
simply designing to the water retaining code is not sufficient. This is especially given so that ordinary good quality
concrete provides little resistance to the passage of water vapor.
There are several degrees of waterproofing to be considered, all loosely defined under 4 categories in BS 8102. At the
lowest level, Grade 1, there is ― Water-tight‖ which simply means that water will not run or flow freely through the

International Journal of Civil and Structural Engineering Research ISSN 2348-7607 (Online) Vol. 3, Issue 2, pp: (95-132), Month: October 2015 - March 2016, Available at: www.researchpublish.com
Page | 99 Research Publish Journals
concrete; at the upper levels, Grades 3 & 4, there is ―Damp-proof‖, which not only requires there to be no visible water
ingress but also that very high levels of ―water-vapor- resistance‖ will be achieved. This applies whether or not
hydrostatic pressures are present.
Rubber has many properties that makes it a good material for waterproofing concrete. But then, waterproof concrete is a
misnomer because nothing can be completely impervious to water under infinite pressure over infinite time. The term
waterproof for concrete has reduced capillary water absorption properties as well as low permeability to water under
pressure. In line to this, the researchers focused this study in finding out a mix design incorporated by rubber tire crumbs
that will reduce water absorption of concrete compared with the normal or conventional concrete in the market.
In order to provide sufficient workability for proper placing and compaction and to facilitate proper mixing and
transportation to site, most plant-batched concrete will contain water in excess of that required to simply hydrate the
cement. As concrete hardens, this excess water leaves the concrete and creates a network of fine capillaries and internal
pores. Natural capillary absorption is the predominant mechanism of water transport through concrete whether or not a
head of hydrostatic pressure is present. In essence, as far as water is concerned, normal concrete behaves like a dense
sponge.
One cubic meter of normal, good quality dry concrete will absorb the equivalent of roughly 60 liters of water in just 30
minutes! (Test in accordance with BS 1881, part 122). It is the speed of this absorption that is important as this will
directly affect the level of dampness, say in a basement, or the onset of reinforcement corrosion due to dissolved
chlorides being carried into the concrete by water, say in a sub-sea tunnel, the tidal zone of bridge supports or from
melting slush after de-icing salt has been applied. Even the highest quality concrete contains a network of pores and
capillaries and, without adequate damp-proofing protection, this may result in dampness or leaks causing deterioration of
internal finishes, mould formation and a health hazard, especially in heated environments where damp concrete is a haven
for bacterial development. Where chlorides and oxygen are present, corrosion to the reinforcement will occur. Where
sulfates are present in the surrounding soils and groundwater, serious deterioration of the cement matrix can occur, both
situations causing untold damage to the structure.
Even the highest quality concrete contains a network of pores and capillaries and, without adequate damp-proofing
protection, this may result in dampness or leaks causing deterioration of internal finishes, mould formation and a health
hazard, especially in heated environments where damp concrete is a haven for bacterial development.
Sorptivity is defined as a measure of the capacity of the medium to absorb or desorb liquid by capillarity
Specimen refers to a portion or quantity of material for use in testing, examination or study
Superplasticizer is a chemical admixture which yields higher compressive and flexural strength, lowers permeability,
increases resistance to weathering, improves the bond of concrete and re reinforcement, reduces the volume change from
drying and wetting, and reduces shrinkage cracking tendencies
Temperature Tolerance refers to the capacity to withstand a full range of ambient temperature extremes without
undergoing permanent property change.
Thermal Insulation refers to the process of insulating against transmission of heat as well as to a material of
relatively low heat conductivity used to shield a volume against loss or entrance of heat by radiation, convection, or
conduction
Universal Testing Machine, also known as a universal tester or materials testing machine or materials test frame is
used to test the tensile stress and compressive strength of materials.
Slump Test is an empirical test that measures the workability of fresh concrete.
Compressive Strength is the maximum compressive stress that under gradually applied load a given solid material
will sustain without fracture.
1.3 Preview:
The Next Section, Section 2, contains the Statement of the Research Problem, which is followed by an Explanation
of the Objectives, Scope, and Significance of the Research in Section 3. Section 4 then provides a Review of
Previous Studies and Related Literature, while Section 5 explains the Methods used in the Research. The Results

International Journal of Civil and Structural Engineering Research ISSN 2348-7607 (Online) Vol. 3, Issue 2, pp: (95-132), Month: October 2015 - March 2016, Available at: www.researchpublish.com
Page | 100 Research Publish Journals
and Discussion are then presented in Section 6, while the Conclusion and Recommendation are presented in
Section . The next section, Section 8, contains the Acknowledgement, and finally Section 9 contains the References.
2. STATEMENT OF THE RESEARCH PROBLEM
• This research sought to determine whether it would be feasible to use recycled rubber tire crumbs for waterproofing
concrete. In particular, this research wanted to find out the best classification of rubber tire crumbs that would be suitable
for reducing the water absorption and permeability of concrete.
3. OBJECTIVES, CIRCUMSTANCES, SIGNIFICANCE, AND SCOPE OF THE RESEARCH
3.1 General Objective:
The general objective of this research is to analyze the feasibility of recycled rubber tires for use in the field of
construction. It aims to find a rubber-concrete mixture using recycled rubber tire crumbs that can enhance the
waterproofing capacity of concrete.
3.2 Specific Objectives:
The study‘s specific objectives were (a) to utilize discarded rubber tires in the form of rubber tire crumbs in reducing
concrete‘s permeability and water absorption—in effect make the concrete itself waterproof , (b) to try different classes
of rubber tire crumbs namely Class A, Class B and Class C in the experiment to identify which is most suitable for
reducing concrete‘s permeability and water absorption, (c) to investigate the best mix proportion that will attain a
waterproof concrete characteristic that will comply with the ASTM standard test method for water absorption and
permeability and sorptivity of concrete, (d) to investigate whether the rubber- concrete mixture is suitable for structural
concrete (2500 psi) or for non-bearing structure (600 psi), and (e) to make a recommendation based on the results of this
experiment as to which mix can be used for a structural lightweight concrete or for non-bearing structure as well as which
mix has the lowest water absorption and permeability rate.
3.3 Significance of the Study:
Rubber tire wastes were already used in making asphalt mixes for paving roads and other related construction works. In
line with this, the study used rubber tire crumbs as aggregates in reinforced concrete. The rubber properties such as its
density, moisture absorption, and thermal insulation were factors that make it a good material for water proofing as well
as for insulation benefitting the construction industry. Also, the study utilized waste materials which help in conserving
our environment. This can benefit the community due to the fact that rubber tire crumbs are cheaper than other aggregates
and sometimes they can be obtained at no cost at all. Because of lighter mass in the concrete mixture, when rubber tire
crumbs were used, the weight of the structure would be reduced at the same time. In line with this, the researchers
focused this study in finding out a mix design incorporated by rubber tire crumbs that will reduce water absorption of
concrete compared with the normal or conventional concrete in the market.
This paper experimentally investigates the contribution of rubber dust or waste materials incorporated to the aggregates in
the production of ordinary Portland cement mortar. The output hopes to provide preliminary information about the
strength of hardened concrete mixture with 5%, 10% and 20% of rubber to the weight of sand with a cement aggregates
ration 1. 2 paper, therefore, compares the variation of strength with different percentage of rubber dust.
In the early 1960‘s, enormous researchers have been conducted to agglomerate fibers in various types in concrete, such as
plastics, nylon, asbestos, carbon or glass. (Baraidan et.al, 1989). Up to this moment, the authors does not have updates in
the hope to gain wide acceptance of the incorporation of waste rubber waste dust in concrete construction to prevent its
future accumulation. This lessen the unabated increasing cost of construction materials a little bit.
The growing concern for waste disposal, coupled with the environmental hazards of the present methods of recycling and
the need to utilize more effectively the raw material resources available, justify a good cause for research and
development of innovative building materials utilizing recycled wastes that are locally abundant. Aggregate occupies
about 70% to 75% of the volume of mortar. Therefore one cubic meter of mortar alone will require at least 70 cubic meter
of sand. If we can replace 20% of the volume of sand with waste rubber, 0.14 cubic meter of waste rubber can be
consumed.

International Journal of Civil and Structural Engineering Research ISSN 2348-7607 (Online) Vol. 3, Issue 2, pp: (95-132), Month: October 2015 - March 2016, Available at: www.researchpublish.com
Page | 101 Research Publish Journals
Hence, a contractor will benefit from this study for these dust aggregates are cheaper and sometimes even free. Then, the
owner or any establishments will no longer worry about in disposing their rubber tire wastes. Generally, it is the whole
community who will benefit much for it will not accumulate anymore tire wastes.
Waste Tires must not be thrown out or burned; instead it should be kept and recycled, for they possess the properties for
road construction as a binder modifier in asphalt road.
3.4 Circumstances of the Study:
This study was conducted at 159 R. M. Asuncion St. Tubuan 2, Silang, Cavite during the First Semester of Academic
Year 2014-2015. The experiments were conducted between the months of July and October 2014.
3.5 Scope and Delimitation of the Study:
The study focused on attaining and identifying the best rubber-concrete mixture using Class A, Class B and Class C
rubber crumbs that would reduce the concrete‘s permeability and water absorption. This study also wanted to determine
whether the output would be suitable for use in structural or non-structural members of structure, making use of ASTM
standards procedures. Thus this study limited itself to waterproofing tests. Because of lighter mass in the concrete
mixture, when rubber tire crumbs were used, the weight of the structure would be reduced at the same time. In line with
this, the researchers focused this study in finding out a design mix incorporated by rubber tire crumbs that will reduce
water absorption of concrete compared with the normal or conventional concrete in the market
4. REVIEW OF THE LITERATURE
In the late 1990s, Dr. Han Zhu, an engineering professor at Arizona State University, was amazed at the number of
recyclable tires he saw while visiting a shredding plant in the greater Phoenix area. His immediate thought was to develop
a way to convert them for use in concrete. Utilizing facilities at the university and the ready labor force his students
provided, Zhu started putting his ideas to work. As he experimented with this concept, Zhu drafted a few other people to
help him with his project. Two individuals who quickly became major players were George Way and Doug Carlson. Way
is currently an engineering consultant but at the time was the chief pavement design engineer for the Arizona Department
of Transportation. Carlson was a board member of the Recycle Tire Engineering and Research Foundation, a group
created to explore material properties and potential engineering applications of recycled rubber. Later on, Mark Belshe, a
vice president of FNF Construction, was also drawn into the mix. In 2003, Zhu accepted a professorship in China, and the
crumb rubber concrete project was turned over to ASU‘s Dr. Kamil Kaloush.
To date, the project has dealt mostly with poured concrete, but the group got excited about the possibilities for precast
applications as well.
―The vast majority of the characteristics we discovered in regard to crumb rubber would be just as valid for precast as for
poured-in-place,‖ Kaloush said. ―For example, it produces a lightweight panel that is beneficial in noise control as it is
well-insulated.
Also, in an environment with a number of computers and other electrical equipment, this insulation would tend to assist
with static reduction in walls,‖ he said. ―I was impressed with the fact that crumb rubber concrete has excellent
freezethaw characteristics,‖ Way added. In fact, the team found that expansion/contraction was cut in half.
Yet another advantage was that shrinkage, and thus cracking, was reduced. ―We took special note that cracking was
reduced to the point that 45 degree cracking was virtually lost completely,‖ said Carlson.
Obviously these were all excellent advantages. But were there any characteristics that might be considered
disadvantageous? ―The most obvious was strength reduction. The greater the rubber content, the more reduced the
strength was,‖ explained Kaloush. ―I don‘t know if this was a disadvantage or not,‖ Carlson added. ―But the crumb
rubber takes the place of aggregate, and as a result, more cement is needed in the formula.‖
Other than that short list, apparently there were no other disadvantages, said Way.
Possible applications of precast concrete utilizing crumb rubber concrete abound. ―Having formally been with A-DOT,
the first thing that came to mind for me are the Jersey Barriers you see on highways during construction,‖ said Way. ―The
fact that they would be somewhat lighter would mean that they could be transported quicker and easier.‖
International Journal of Civil and Structural Engineering Research ISSN 2348-7607 (Online) Vol. 3, Issue 2, pp: (95-132), Month: October 2015 - March 2016, Available at: www.researchpublish.com
Page | 102 Research Publish Journals
Easier transport isn‘t the only advantage. ―The virtual elimination of the 45 degree cracking would particularly come into
play here,‖ said Carlson.
Kaloush added that barriers made with crumb rubber would be much more forgiving should they be run into, which
would help protect the barrier itself as well as the vehicle that hits it. ―It is my hope to be doing some extensive
experimentation in this area in the very near future,‖ he said.
Another possible application for concrete cast with recycled rubber is in sidewalks. Kaloush has found that the crumb
rubber produces an end product this is nearly non-slip in nature. ―What I envision is a situation where all your utility
pipes – water, sewer, electrical, phone and TV cables – would be run under the sidewalk rather than the streets,‖ he said.
―With precast sidewalk panels, you could simply lift them up when you need to get to the pipes to work on them.‖
In the long run, Kaloush said that this would be far less expensive than having to constantly tear up streets to work on the
pipes. ―You wouldn‘t need new materials every time – all you would have to do is pick them up and then replace them,‖
he said. ―And look at how much more convenient it would be to close down a sidewalk rather than a street. This should
be a tremendous selling point for precast proponents in trying to sell it to various cities and other municipalities.‖
This isn‘t as farfetched as it may first seem, according to Way. ―In Europe, they are already utilizing a variation on this
theme,‖ he said. ―While it might be difficult to retrofit a city with this program, there is so much new construction going
on that this concept could really be a major innovation. All it would take is a very proactive marketing plan on the part of
the precast community,‖ added Way.
―Crumb rubber panels would be ideal for nearly all non-load bearing walls in an office building,‖ said Kaloush. ―The fact
that it is lighter and a nonconductor of both noise and electricity makes it an ideal candidate for use in that capacity.‖
Residential housing could also benefit. ―Here in the Southwest we have a lot of homes with clay tile roofs,‖ said Carlson,
explaining that strength, for the most part, is not a major concern because of the lack of snow and ice. ―You could create a
precast roof with a high percentage of crumb rubber that would be lightweight, help control noise going both ways and,
from experiments thus far, should prove to be a good deal cooler.‖
Carlson was referring to the fact that Kaloush, and Zhu before him, have been running tests that seem to indicate that the
crumb rubber concrete is cooler than its regular counterpart.
―These studies are inconclusive at this time, but to this point they seem to support the theory that it is cooler,‖ said
Kaloush. ―I was able to take some photos with an infrared camera, and from those, at least, the crumb rubber is cooler.‖
The idea of a ―cooler‖ concrete leads to a possible piece in the puzzle for battling the Urban Heat Island Affect, suggested
Belshe. ―That‘s one of the things that caught FNF Construction‘s attention. Any time we can make a major stride in
controlling a problem like that, we become very interested.‖
In fact, the use of crumb rubber concrete could very well open another major area for the precast industry: ―green‖
buildings. ―If enough applications can be found and used, it might be possible to land contracts with the government and
companies who feel strongly enough about the Green Building program that they make adherence to those rules a
prerequisite for doing business with them,‖ said Carlson.
Like every other innovation, crumb rubber concrete will, undoubtedly, face its share of skeptics. The experts believe,
however, that end-users especially will be impressed by the fact that the process is so environmentally sound. While real
evidence will need to be gathered to verify that the advantages outweigh the possible cost increase of producing crumb
rubber panels, this is one area that may turn out to be a ―cushy‖ investment.
It was estimated that more than 250.000.000 post consumption tires were accumulated annually in the 15 States of the
European Union. In 1992, about 65% of the quantity produced in the then 12 member states was stored in dumps and
only 35% underwent other regeneration methodologies. Ten years later, in 2002, the situation was completely overturned
in the 15 member states. More than 65% of post-consumption tires were prepared for reuse/export, rebuilding, recycling
and energy regeneration, whereas less than 35% was stored in dumps. Energetic and material product recycling
represented the two principle types of regeneration and amounted to 44% of the total. With reference to actual codes
(Dumps directive 199/31/EC), and despite the fact that the disposal in dumps of whole tires was forbidden since 2003 and
that of lacerated tires since 2006, only 8 States adopted such directives. The practice of absorbing used tires in controlled
dumps should be avoided because it creates another source of pollution. Tires represent a bulky refusal and require huge
dump sites as more than 75% of a tire‗s volume is void. The presence of cavities and rubber elasticity also create

International Journal of Civil and Structural Engineering Research ISSN 2348-7607 (Online) Vol. 3, Issue 2, pp: (95-132), Month: October 2015 - March 2016, Available at: www.researchpublish.com
Page | 103 Research Publish Journals
mechanical instability with danger of fires in the stocked refuse mass. Furthermore, dumps can turn into a fertile habitat
for the proliferation of rats and insects. To worsen matters, tires tend to re-emerge in time from the dump and
microorganisms may take more than 100 years to biodegrade them. The necessity to find alternative solutions to used
tires is thus clear. Moreover, the increased consumption of concrete in building construction raised the problem of
impoverishment of natural resources. Such considerations confirmed the necessity to develop innovative technologies and
alternative materials to improve not only the performance level of concrete but also, and above all, to support the policy
of environmental protection. It must also be remembered that most developing countries had to raise their awareness
regarding the recycling of waste materials but have not yet developed effective standards and laws as regards the local
reuse of waste materials.
Over the past few years, a number of researches have focused on the use of different shapes and sizes of waste tires in
concrete. A mixture composed of ordinary concrete (Portland cement) and rubber from recycled tires has been presented
in the technical literature under the names of Rubber Concrete‖ or Rubber Modified Concrete‖. The rubber used in most
cases was derived from post consumption tires of motor vehicles and trucks subjected to mechanical trituration or to
cryogenic processes. Given the applications and performances required by the final product, the rubber was used as it is‖
or, in some occasions, the textile component was removed and the steel fibers unstrained. In other circumstances, the
rubber surface was subjected to particular chemical pretreatments to reinforce adhesion of the rubber with the grout,
obtaining a clear improvement of some final properties of the concrete. The latter solution has gained worldwide
recognition in the engineering field, directing many researchers in recent years to carry out additional research on the use
of waste rubber in concrete (Eldin and Senouci 1992, 1993a, b, Aliet al.1993, Leeet al.1998, Topcu, 1995,1997, Fattuhi
and Clark 1996, Toutanji 1996, Huynh and Raghavan 1996, Topcu and Avcular1997, Liet al.1996, Raghavanet
al.1998,Choubane et al., 1999,Segre and Joekes 2000,Pierce and Blackwell 2003, Hernandez-Olivares and Barluenga,
2004, Siddique and Naik,2004,Sukontasukkul and Chaikaew, 2006, Chouet al., 2007, Topcu and Demir, 2007,Bataynehet
al., 2008, Ganjian et al., 2009).
The aim of this recent research was to assess the mechanical strength and durability performance of the concrete
incorporating various contents of the ordinary Portland cement as well as to study the effect of curing methods on
compressive strength of the concrete as well as the physical properties, which were investigated in terms of density,
absorption and volume of permeable voids as an (porosity). Many researchers consider these physical properties as
indicative of the permeability of the concrete. In other words, these were considered as an indirect method to measure the
permeability and to evaluate it.
That the increase of cement content and the reduction which leads to more durable concrete because of loss of absorption
and porosity characteristics, higher density and compressive strength.
Philippine Studies on Rubber:
―Rubber was introduced in the Philippines in the early 1900s when the country was going through a difficult agricultural
phase. The rubber manufactured as tires and shoes mostly came from Indonesia and Thailand. In the early 1920s, rubber
mills were established in Basilan, but it was only in the 1950s when local private corporations embarked on setting up
rubber processing plants in Mindanao. Today, large– scale rubber plantations such as Goodyear, Goodrich, and Firestone
are well established in the country along with domestic corporations such as the Menzi Corporation.
Dr. Eugenio A. Alcala, Executive Director of the Philippine Rubber Board, Inc. (PRBI) has reported that there are more
than 50,000 uses of rubber, explaining that the there are two kinds of rubber used in the manufacture of products ,
synthetic and natural rubber. Natural rubber is preferred since it is more durable, adhesive, and impermeable. The most
popular is the automobile tire. According to PRBI Director Eleazar, 70 percent of the rubber industry supplies the tire
sector.
Dr. Abdul Aziz Kadir, secretary general of the International Rubber Research and Development Board (IRRDB),
Malaysia, asserted that the future is bright for the rubber industry because of its wide product range. He highlighted the
market for birth control (condom), rubberwood (furniture), and the niche market for rubber -based products such as
medical products (surgical gloves), foam mattresses, and even artificial flowers (roses).
Moreover, Dr. Ramli Othman of the Malaysian Rubber Board (MRB) said that there is an increasing demand for
rubberwood as source of latex and timer. ―We are promoting the planting of latex – timber clones in both conventional
and forest rubber plantations. This will make rubber production a more competitive and attractive industry.‖

International Journal of Civil and Structural Engineering Research ISSN 2348-7607 (Online) Vol. 3, Issue 2, pp: (95-132), Month: October 2015 - March 2016, Available at: www.researchpublish.com
Page | 104 Research Publish Journals
In the study of rubber economics presented by Dr. Hidde Smit, secretary general of the International Rubber Study Group
(IRSG) based in London, he reported that the Philippine rubber industry would be soaring high in the world market by the
year 2020 compared to other rubber producing countries in Asia and in other parts of the world. This is because of the
high production and consumption of natural rubber in the Philippines. He also asserted that the Philippines could produce
as much as 250- 350 million tons of rubber in the coming years. ―We expect prices to remain high‖, said Dr. Smit when
asked about the stability of the price of rubber in the world market. According to his report, the competition would be up
between the Philippines and Vietnam, which also shows great potential in the rubber industry. On the other hand, China
turns out to be a major consumer of rubber. Apparently, one–third of the world rubber production goes to China.
Water rubber materials (rubber dust in layman‘s term) used in this study were waste from various tire recapping centers
in Cagayan de Oro City. The waste materials passes through sieve number 20 with mesh opening of 0.85 mm. Lucma
(World Book, 1992 science year) said, about five percent (5%) of waste tire are recycled, chiefly by grinding them into
crumbs. This rubber crumbs can be molded into a new products or mixed with asphalt for surfacing highways and athletic
fields.
In Cagayan de Oro City, rubber recycling particularly waste tires are up to flower pots, water containers, and to recapping
industry where the less damaged tires will be recapped (retreaded) and it is where these waste are taken. The author
wishes to establish a definitive use of these waste materials in the world of construction technology as existed in other
countries, while the future accumulation of these waste will be prevented if this technology gain nation acceptance that is
proven to be reliable as it is referred to the Philippine standard. Garcia et.al 1996 said, experts are of the opinion that an
ecological disaster of the inhabitants of the planet Earth is just around the corner. The unwanted by products of our
mechanized, industrialized and urbanized environment will soon overwhelm us like a rushing avalanche unless we do
something drastic to remedy by situation.
This paper experimentally investigates the contribution of rubber dust or waste materials incorporated to the aggregates in
the production of ordinary Portland cement mortar. The output hopes to provide preliminary information about the
strength of hardened concrete mixture with 5%, 10% and 20% of rubber to the weight of sand with a cement aggregates
ration 1. 2 paper, therefore, compares the variation of strength with different percentage of rubber dust.
In the early 1960‘s, enormous researchers have been conducted to agglomerate fibers in various types in concrete, such
as plastics, nylon, asbestos, carbon or glass. (Baraidan et.al, 1989). Up to this moment, the authors does not have updates
in the hope to gain wide acceptance of the incorporation of waste rubber waste dust in concrete construction to prevent its
future accumulation. This lessen the unabated increasing cost of construction materials a little bit.
The growing concern for waste disposal, coupled with the environmental hazards of the present methods of recycling and
the need to utilize more effectively the raw material resources available, justify a good cause for research and
development of innovative building materials utilizing recycled wastes that are locally abundant.
Aggregate occupies about 70% to 75% of the volume of mortar. Therefore one cubic meter of mortar alone will require at
least 70 cubic meter of sand. If we will replace 20% of the volume of sand with waste rubber, 0.14 cubic meter of waste
rubber will be consumed.
The contractor will benefit in this study for these dust aggregates are cheaper and sometimes are free. Then, the owner or
any establishments will no longer worry in disposing their wastes. Generally, it is the whole community who will benefit
much for it will not accumulate anymore.
Waste Tires must not be thrown out or burned; instead it should be kept and recycled, for they possess the properties for
road construction as a binder modifier in asphalt road.
Since the obtained results for stability and compressive strength between sample A and D produces lesser difference
compared to other samples, the researchers highly recommend sample A that contains 15% by weight of total asphalt
content in designing asphalt melting waste tire rubber. Pollution control device must be used in construction procedure
for melting waste tire rubber.
Cost analysis using waste tire rubber as binder modifier for bituminous road construction is recommended for further
study.

International Journal of Civil and Structural Engineering Research ISSN 2348-7607 (Online) Vol. 3, Issue 2, pp: (95-132), Month: October 2015 - March 2016, Available at: www.researchpublish.com
Page | 105 Research Publish Journals
5. METHODS
The study employed the experimental method to investigate the effect of incorporating different classification of rubber
tire crumbs as part of the volume of aggregates in waterproofing of concrete and in the structural strength of the mortar.
ASTM procedures were followed in selecting the materials, making and curing test specimens, and the nominal mix
design for proportioning of normal concrete. The aggregate-rubber tire crumbs ratio was the independent variable used in
the evaluation of water absorption rate, permeability, sorptivity and compressive strength of the concrete.
5.1 Materials Used in the Study:
The materials used in making plain concrete which is the controlled variable were Type I Portland Cement, ASTM
Standard Coarse and Fine aggregates, and potable or tap water, while for the rubber-concrete mixture, Class A, B, and C
rubber tire crumbs were incorporated as part of the volume of aggregates. A series of two kinds of mixes with varying
percentage of rubber tire crumbs content for each class were used. The cylindrical specimens with different contents of
rubber tire crumbs were cured for 7 days, 14 days, 21 days and 28 days. Testing of compressive strength was done at
ASTEC Materials and Testing Center.
The crumb rubber used in this study was obtained from a local tire recapping center in Imus, Cavite which is a byproduct
of tire retreading. The researchers provided scrap tires, and the local dealer gave the equivalent rubber crumbs in
kilograms. The local dealer also sells crumb rubber. Four to five kilograms of rubber crumbs can be derived from a
typical scrap tire. Table 1 shows the percentage content of a typical scrap tire based on its weight.
Table 1 Content of a Typical Scrap Tire
Content Percentage
Recoverable rubber 70%
Steel 15%
Fiber 3%
Extraneous material (e.g. Inert fillers) 12%
There are three classes of rubber tire crumbs used in this study, namely, Class A, Class B and Class C. Table 2 shows
classification of rubber tire crumbs based on the sieve opening used and equivalent mesh size.
Table 2 Rubber Tire Crumb Sizes
CLASS Sieve Opening Mesh Size
A 1.18 mm No. 16
B 2.36 mm No. 8
C 4.75 mm No. 4
Cement:
The cement used in this study was pure Type I Portland Cement conforming to the ASTM
Standards which was procured from a local construction supplier and distributor in Silang, Cavite.
Water has a significant role to play in the making of concrete – in mixing of fresh concrete and in curing of hardened
concrete. In order to ensure proper strength development and durability of concrete, it is necessary that the water used for
mixing and curing is free from impurities such as oils, acids, alkalis, salts, sugar and organic materials. In this study
potable or tap water was used in the mixture.
For the Coarse Aggregate, ASTM C-33 states that this should consist of gravel, crushed gravel, crushed stone, air-cooled
blast furnace slag, or crushed hydraulic-cement concrete, or a combination thereof, conforming to the requirements of this
specification. Based on the ASTM C-31 and C-192, the standard specimen shall be the 6 by 12-in. [150 by 300-mm]
cylinder while the nominal maximum size of the coarse aggregate must not exceed 2 inches. Nominal maximum size of
the aggregate is defined as the smallest sieve opening through which the entire sample of the aggregate will pass. In this
study, the maximum size of ¾ inch coarse aggregates were used which were bought from a local construction supplier
and distributor in Silang, Cavite.

International Journal of Civil and Structural Engineering Research ISSN 2348-7607 (Online) Vol. 3, Issue 2, pp: (95-132), Month: October 2015 - March 2016, Available at: www.researchpublish.com
Page | 106 Research Publish Journals
Since the Fine Aggregate should consist of natural sand, manufactured sand, or a combination thereof, The fine aggregate
used in this study was the locally available white sand in local construction suppliers and distributor in Silang, Cavite
which conforms to ASTM C33 .
5.2 Instruments used:
As to the instruments used, the researchers had to make some improvisations because some of them were unavailable.
The cylinder molds that were used were PVC pipes with a diameter of 6 inches and a height of 12 inches which conforms
to ASTM C-31 Standard Practice for Making and Curing Concrete Test Specimens on the Field and ASTM C-192
Standard Practice for Making and Curing Concrete Test Specimens on the Laboratory specifications for cylindrical mold.
The slump cone mold was also improvised by fabricating a 1.5 mm thick metal sheet in the form of a lateral surface of a
frustum of a cone with a base of 8 in. [200 mm] in diameter, the top 4 in. [100 mm] in diameter, and the height 12 in.
[300 mm] with the base and the top open and parallel to each other at right angles to the axis of the cone and has foot
pieces and handles which conforms to the ASTM C-143 Standard Test Method for Slump of Hydraulic-Cement
Concrete.5.3 Data Gathering and Procedure
Mix Design:
Concrete proportions must be selected to provide workability, consistency, density, strength, and durability, for the
particular application based on ACI 211.1-91.
Based on the nominal mix design method, there are two different ways in proportioning concrete mixture namely by
volume or by mass. Volume method is the most common and convenient method in mixing concrete to attain the desired
strength of concrete. Concrete mixture involves cement, sand, gravel and water cement ratio. Proportioning by volume
method had been long practiced and it is proven effective and successful. Most construction industry used this method in
proportion the mixture of the concrete. Table 3 shows the ratio of the cement, sand and gravel mixture while Table 4
shows the strength and use of each mixture class.
Table 3 Mixture Proportioning by Volume Method
Mixture Class Proportion Cement In Bag Sand
cu.m.
Gravel
cu.m. 40 kg 50 kg
Class AA 1:1.5:3 12 9.5 0.5 1.0
A 1:2:4 9 7 0.5 1.0
B 1:2.5:5 7.5 6.0 0.5 1.0
C 1:3:6 6.0 5.0 0.5 1.0
Table 4 Strength of Concrete Mixture Class
Mixture Class Strength of Mixture Use
Class AA 4000 PSI Retaining walls, concrete under water
A 3500 PSI Beams, slabs, footings, columns
B 3000 PSI
C 2500 PSI Plant boxes, non-critical areas
Specimen:
The ASTM C-192 Standard Practice for Making and Curing Concrete Test Specimens in the Laboratory was the basis of
experimentation in this study. The cylindrical specimens that were to be subjected to compressive stress were 6 inches
[150 mm] in diameter by a height of 12 inches [300 mm], four specimen per each ratio were to be casted for 7, 14, 21 and
28 days curing of concrete. On the other hand the specimens that were to be used for the water absorption and
permeability test were in the form of a cube with an edge of 4 inches [100 mm].
The details of mix designation for all specimens used in the experimental program are given by Table 5. The cement-
gravel-sand proportion used was 1:1.5:3 with a water-cement ratio of 0.5 whose standard compressive strength is 4000
psi (27.6 MPa) based on the arbitrary method of proportioning concrete mixture.

International Journal of Civil and Structural Engineering Research ISSN 2348-7607 (Online) Vol. 3, Issue 2, pp: (95-132), Month: October 2015 - March 2016, Available at: www.researchpublish.com
Page | 107 Research Publish Journals
Table 5 Concrete Test Specimen Design Mix
Aggregate Reduction: 10% Fine and 30% Coarse
Specimen
Name
Rubber
Crumb Class
Concrete Content (Percent of Total Volume)
Cement Fine
Aggregate
Coarse
Aggregate
Rubber
Crumbs
w/c Ratio
RC-1 A 18.18% 24.54% 38.18% 19.1% 0.5
RC-3 B 18.18% 24.54% 38.18% 19.1% 0.5
RC-5 C 18.18% 24.54% 38.18% 19.1% 0.5
Aggregate Reduction: 20% Fine and 50% Coarse
Specimen
Name
Rubber
Crumb Class
Concrete Content (Percent of Total Volume)
Cement Fine
Aggregate
Coarse
Aggregate
Rubber
Crumbs
w/c Ratio
RC-2 A 18.18% 21.82% 27.28% 32.73% 0.5
RC-4 B 18.18% 21.82% 27.28% 32.73% 0.5
RC-6 C 18.18% 21.82% 27.28% 32.73% 0.5
No Reduction: Ordinary Concrete
Specimen
Name
Rubber
Crumb Class
Concrete Content (Percent of Total Volume)
Cement Fine
Aggregate
Coarse
Aggregate
Rubber
Crumbs
w/c Ratio
OC 18.18% 27.27% 54.55% - 0.5
5.3 Mixing and Casting Procedure:
The materials were prepared and mixed in conformity with ASTM C-192. The cement, rubber tire crumbs and fine
aggregates were laid on a metal sheet and handmixed with trowel or shovel until they were thoroughly blended, and then
the coarse aggregate was added and mixed again until uniformly distributed throughout the batch. Water was then added
and mixed until the batch became homogenous. Slump test was done immediately after mixing to measure the degree of
consistency and workability of the concrete mixture while the other portion of the mixture was placed on the mold for the
cylindrical and cubic specimen and then tamped and consolidated to avoid voids and airentrainment. It was then kept in
storage for initial curing. , after 24 hours they were removed from the mold. The cylindrical specimens were then
immersed in water for curing in 7, 14, 21 and 28 days respectively before subjecting to compressive test. The cubic
specimens were stored in room temperature.
5.4Testing:
5.4.1 Slump Test (ASTM C 143M-00):
The concrete slump test Slump Test (ASTM C 143M-00) is an empirical test that measures the workability of fresh
concrete. More specifically, it measures the consistency of the concrete in that specific batch. This test is performed to
check the consistency of freshly made concrete. Consistency is a term very closely related to workability. It is a term
which describes the state of fresh concrete. It refers to the ease with which the concrete flows. It is used to indicate the
degree of wetness. Workability of concrete is mainly affected by consistency i.e. wetter mixes will be more workable than
drier mixes, but concrete of the same consistency may vary in workability. It is also used to determine consistency
between individual batches.
This test method covers determination of slump of hydraulic-cement concrete, both in the laboratory and in the field. It
was originally developed to provide a technique to monitor the consistency of unhardened concrete. Under laboratory
conditions, with strict control of all concrete materials, the slump is generally found to increase proportionally with the
water content of a given concrete mixture, and thus to be inversely related to concrete strength. Under field conditions,
however, such a strength relationship is not clearly and consistently shown. Care should therefore be taken in relating
slump results obtained under field conditions to strength.
5.4.2 Compressive Strength Test for Cylindrical Specimen (ASTM C 39M-01):
Compressive strength test is a mechanical test measuring the maximum amount of compressive load a material can bear
before fracturing. The test piece, usually in the form of a cube, prism, or cylinder, is compressed between the platens of a

International Journal of Civil and Structural Engineering Research ISSN 2348-7607 (Online) Vol. 3, Issue 2, pp: (95-132), Month: October 2015 - March 2016, Available at: www.researchpublish.com
Page | 108 Research Publish Journals
compression-testing machine by a gradually applied load. The results of this test method are used as a basis for quality
control of concrete proportioning, mixing, and placing operations; determination of compliance with specifications;
control for evaluating effectiveness of admixtures and similar uses.
The specimens for the compressive strength of concrete test were cured for 7, 14, 21 and 28 days. The result shows that
as the reduction of fine aggregate and coarse aggregate increases, the compressive strength of concrete drastically
decreases.
Batches of each kind of cylinder specimen were tested after curing for 7, 14, 21 and 28 days respectively to identify its
variation. The compressive strength test was done at ASTEC Materials Testing Center in No. 102 Aguinaldo Highway,
Brgy. Sampaloc-1, Pala Pala, Dasmariñas, Cavite using a Universal Testing Machine.
5.4.3 Water Absorption Test in accordance with ASTM C 642:
ASTM C 642 covers the determinations of density, percent absorption of water, and percent voids in hardened concrete.
This test method is useful in developing the data required for conversions between mass and volume for concrete. It can
be used to determine conformance with specifications for concrete and to show differences from place to place within a
mass of concrete. In this study, absorption after immersion was only conducted. There are two methods commonly used
to determine if concrete is waterproof: absorption and permeability testing. Absorption tests are simple to perform and
can be done by any materials lab. The test measures the weight of water absorbed into a concrete specimen over time as a
result of capillary absorption, or wicking.
The cubic specimen with an edge of 4 inches [100 mm] has a volume of 64 cu.in. [1000000 cu.mm.] conforms to ASTM
C-642 which states that the volume of the specimen shall be not less than 350 cu. cm. [35000 cu.mm.] (or for normal
weight concrete, approximately 800 g). The specimens were weighed before oven drying and were oven dried for 24
hours at a temperature of 100 degree Celsius and weighed again. It was then cooled and submerged in water for 48 hours.
The following mass was recorded after performing the test specified in the standard:
A= mass of oven-dried sample in air, g
B = mass of surface-dry sample in air after immersion, g
The value of absorption rate is now computed based on the formula:
Absorption after immersion, % = [(B – A)/A]* 100
5.4.4 Water Sorptivity Test in accordance with ASTM C 1585:
ASTM C 1585 test method is used to determine the rate of absorption (sorptivity) of water by hydraulic cement concrete
by measuring the increase in the mass of a specimen resulting from absorption of water as a function of time when only
one surface of the specimen is exposed to water. The exposed surface of the specimen is immersed in water and water
ingress of unsaturated concrete dominated by capillary suction during initial contact with water.
The specimens used in the experiment were cylindrical specimens with a diameter of 4 inches and a depth of 2 inches.
The standard method is condition samples in an oven for 3 days at 50 degree Celsius and kept in a sealable container for
not less than 15 days after oven drying. The specimens were then weighed. After weighing, the side surface of each
specimen was sealed by wax and the top portion which was not exposed to water was covered by plastic wrapper and
secured with a tape. The new weight of the specimen was then recorded. The rate of absorption was conducted using a
container with sticks as support for the specimen so that the face won‘t have contact with the container, they were then
filled by water 1 to 3 mm above the surface of the stick supports. The timer was then started when the specimens were
placed above the supports. The mass was then recorded in intervals specified by the ASTM Standard. The result was
tabulated and the rate of absorption was computed using the formula:
I = mt / (a* d)
where mt = the change in mass in grams, at different time (t)
a = exposed area of the specimen, mm².
d = density of water in g/mm³.

International Journal of Civil and Structural Engineering Research ISSN 2348-7607 (Online) Vol. 3, Issue 2, pp: (95-132), Month: October 2015 - March 2016, Available at: www.researchpublish.com
Page | 109 Research Publish Journals
5.5 Statistical Design:
The following figures show the percentage content of the volume of concrete
Figure 7 Aggregate reduction: 10% fine and 30% coarse
Figure 7 shows the first mix design wherein the aggregate reduction is 10 % for fine and 30 % for coarse aggregates from
the nominal mix design Class AA with a ratio of 1:1.5:3 and the water-cement ratio is 0.5. The mix design was used for
the specimens RC-1, RC-3 and RC-5. The design mix has 19.10 % rubber tire crumbs, 18.18 % cement, 24.54 % sand
and 38.18 % gravel. They were cured for 7, 14, 21 and 28 days. This mix proportion was used for all the specimens for
compressive strength, water absorption and sorptivity test.
Figure 8 Aggregate reduction: 20% fine and 50% coarse
Figure 8 shows the first mix design wherein the aggregate reduction is 20 % for fine and 50 % for coarse aggregates from
the nominal mix design Class AA with a ratio of 1:1.5:3 and the water-cement ratio is 0.5. This mix design was used for
the specimens RC-2, RC-4 and RC-6. The design mix has 32.73 % rubber tire crumbs, 18.18 % cement, 21.82 % sand
and 27.28 % gravel. They were cured for 7, 14, 21 and 28 days. This mix proportion was used for all the specimens for
compressive strength, water absorption and sorptivity test.
Figure 9 No reduction (Ordinary Concrete)

International Journal of Civil and Structural Engineering Research ISSN 2348-7607 (Online) Vol. 3, Issue 2, pp: (95-132), Month: October 2015 - March 2016, Available at: www.researchpublish.com
Page | 110 Research Publish Journals
Figure 9 shows the first mix design wherein there is no aggregate reduction. The nominal mix design used is Class AA
with a ratio of 1:1.5:3 and the water-cement ratio is 0.5. This mix design was used for the specimens OC which is the
controlled variable. The design mix has 18.18 % cement, 27.27 % sand and 54.55 % gravel. They were cured for 7, 14, 21
and 28 days. This mix proportion was used for all the specimens for compressive strength, water absorption and sorptivity
test.
5.6 Experiment Test Flow Chart
The flow chart shows the flow of the experiment.
Figure 10 Experiment Test Flow Chart
6. RESULTS AND DISCUSSION
6.1 Result of Slump Test:
Table 6 Slump Test Result
SPECIMEN Slump Result
RC-1 80 mm
RC-2 55 mm
RC-3 75 mm
RC-4 49 mm
RC-5 68 mm
RC-6 44 mm
OC 100 mm
Slump test measures the consistency of the concrete in that specific batch. This test was performed to check the
consistency of freshly made concrete. Consistency is a term very closely related to workability. It is a term which
describes the state of fresh concrete. It refers to the ease with which the concrete flows. It is used to indicate the degree of
wetness. Workability of concrete is mainly affected by consistency i.e. wetter mixes will be more workable than drier
mixes, but concrete of the same consistency may vary in workability. It is also used to determine consistency between

International Journal of Civil and Structural Engineering Research ISSN 2348-7607 (Online) Vol. 3, Issue 2, pp: (95-132), Month: October 2015 - March 2016, Available at: www.researchpublish.com
Page | 111 Research Publish Journals
individual batches. The result of the slump test is acceptable due to the incorporation of rubber. Due to incorporation of
recycled rubber tire crumbs in large amount, the workability of concrete on RC-2, RC-3 and RC-5 was is lower since
rubber has a low moisture absorption.
6.2 Result of Compressive Strength Test
There are three specimens made in this experiment, the cylindrical specimen with a diameter of 6 inches, and a height of
12 inches for the compressive strength test, the cube specimen with edges of 4 inches for the water absorption test and
lastly, the cylindrical specimen with a diameter of 4 inches and a height of 2 inches for the rate of absorption test. These
specimens were named RC-1, RC-2, RC-3, RC-4, RC-5, RC-6 which were the independent variable and OC as the
controlled variable for comparison purposes. The cement contents of these design mixes are shown in table 5. The
proponents used the nominal mix design Class AA in this study with a cement, sand and gravel ratio of 1:1.5:3. RC-1,
RC-3 and RC-5 has 10% fine aggregate reduction and 30% coarse aggregate reduction while RC-2, RC-4 and RC-6 has
20% fine aggregate reduction and 50% coarse aggregate reduction.
The compressive strength test was done to investigate whether the strength of the mix design that will be used in making
a waterproof concrete can be used for structural or non-bearing elements of a structure due to the fact that from previous
studies wherein rubber is used as partial replacement for aggregate, its compressive strength decreases as the replacement
of aggregates increases. 1. The results for the compressive strength test of the different design mixes for different number
of days are tabulated below and summarized graphically in Fig. 14.
Table 7. 7 Days – Compressive Strength
Specimen Weight (g) Diameter
(mm)
Length
(mm)
Maximum
Load (N)
Compressive Strength Typical
Fracture
Patterns Mpa
Psi
RC-1 10350 150.2 305 40600 2.29 330 2
RC-2 10350 150.2 305 32190 1.82 400 2
RC-3 11015 150.7 305 49230 2.76 570 2
RC-4 10665 150.6 305 44180 2.48 260 3
RC-5 11515 150.7 305 62360 3.5 360 2
RC-6 11250 150.6 305 61080 3.43 500 3
OC 12755 150.7 305 142470 7.99 1160 2
Table 8. 14 Days – Compressive Strength
Specimen Weight (g) Diameter
(mm)
Length
(mm)
Maximum
Load (N)
Compressive Strength Typical
Fracture
Patterns Mpa
Psi
RC-1 11890 150.7 305 97050 5.44 790 2
RC-2 10200 150.6 305 36510 2.05 300 2
RC-3 11250 150.8 305 116440 6.52 950 5
RC-4 10570 151.4 305 44120 2.45 360 2
RC-5 12540 151.7 305 156870 8.68 1260 2
RC-6 11095 150.1 305 81930 4.63 670 3
OC 12970 151.6 305 348140 19.29 2800 3

International Journal of Civil and Structural Engineering Research ISSN 2348-7607 (Online) Vol. 3, Issue 2, pp: (95-132), Month: October 2015 - March 2016, Available at: www.researchpublish.com
Page | 112 Research Publish Journals
Table 9. 21 Days – Compressive Strength
Specimen Weight
(g)
Diameter
(mm)
Length
(mm)
Maximum
Load (N)
Compressive Strength Typical
Fracture
Patterns Mpa
Psi
RC-1 11000 150.1 305 54560 3.08 450 5
RC-2 10050 150.1 305 15580 0.89 130 2
RC-3 10450 150.9 305 69560 3.89 560 6
RC-4 10030 150.1 305 31440 1.78 260 5
RC-5 12530 150.3 305 161100 9.08 1320 6
RC-6 11835 150.4 305 91580 5.15 750 6
OC 12365 150.4 305 165490 9.32 1350 5
Table 10. 28 Days – Compressive Strength
Specimen Weight
(g)
Diameter
(mm) Length (mm)
Maximum
Load (N)
Compressive Strength Typical
Fracture
Patterns Mpa
Psi
RC-1 11795 150 305 109820 6.21 900 3
RC-2 10125 150.1 305 45330 2.56 370 3
RC-3 11380 151.3 305 128540 7.15 1040 3
RC-4 10580 151.7 305 610610 3.8 490 3
RC-5 12125 151.6 305 148750 8.24 1190 3
RC-6 11235 151.2 305 87840 4.89 710 2
OC 12780 158.8 305 337580 18.65 2700 3
The specimens for the compressive strength of concrete test were cured for 7, 14, 21 and 28 days. The result shows that
as the reduction of fine aggregate and coarse aggregate increases, the compressive strength of concrete drastically
decreases
Figure 14 Summary of Compressive Strength Results

International Journal of Civil and Structural Engineering Research ISSN 2348-7607 (Online) Vol. 3, Issue 2, pp: (95-132), Month: October 2015 - March 2016, Available at: www.researchpublish.com
Page | 113 Research Publish Journals
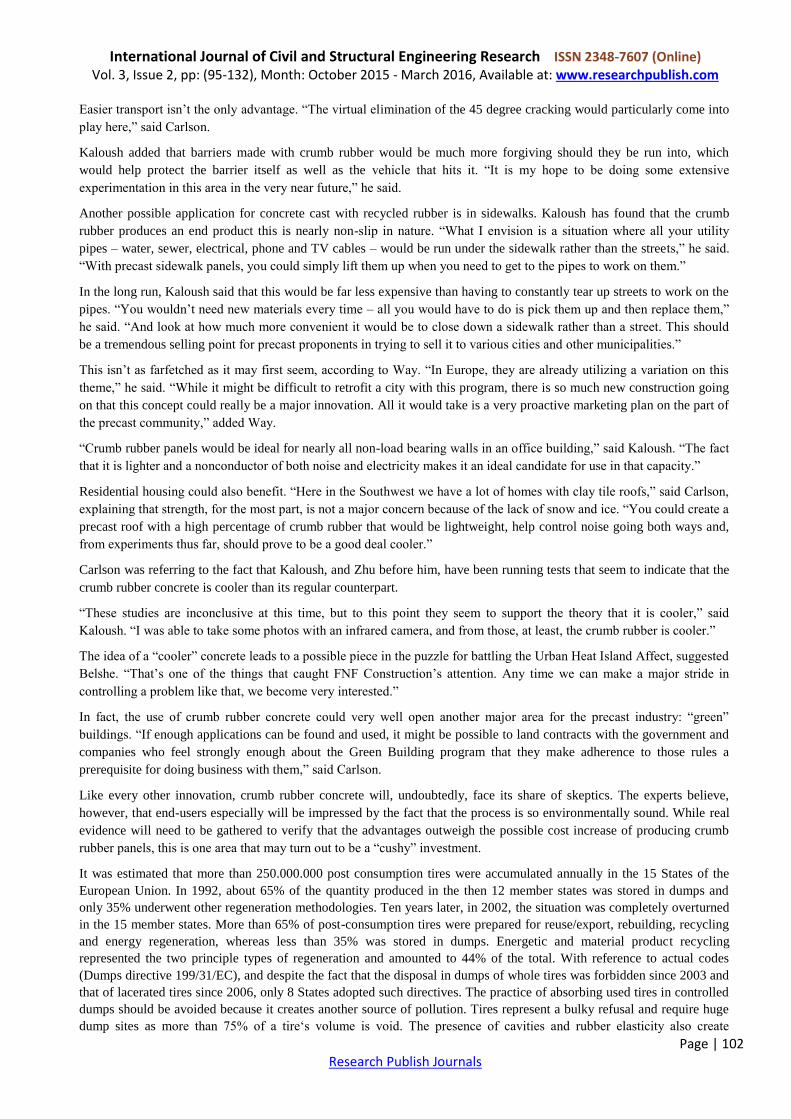
6.3 Results of Water Absorption Test
The results of the water absorption tests on the different specimens of design mixes are tabulated in Tables 11-14 which
can be found in Appendices 11-14. These results show that concrete incorporated with rubber tire crumbs has a lower
water absorption than ordinary concrete mix. The specimen with the lowest water absorption was the RC-2 design mix
which had a water absorption rate of 7.21%. Fig 15 compares RC-2 and Commercial Concrete in terms of their rates of
water absorption while Fig. 18 depicts a graphic summary of the rates of absorption of the different mixes.
Figure 15 Comparison of Water Absorption Rate of RC-2 with Commercial Concrete

International Journal of Civil and Structural Engineering Research ISSN 2348-7607 (Online) Vol. 3, Issue 2, pp: (95-132), Month: October 2015 - March 2016, Available at: www.researchpublish.com
Page | 114 Research Publish Journals
Figure 17 Oven Dried Mass Trial 1
6.4 Results of Water Sorptivity Test:
The performance of concrete subjected to many aggressive environments is a function, to a large extent, of the
penetrability of the pore system. In unsaturated concrete, the rate of ingress of water or other liquids is largely controlled
by absorption due to capillary rise. This test method is based on that developed by Hall3 who called the phenomenon
―water sorptivity‖. The results of the Water Sorptivity Tests on the Different Specimens of design mixes are tabulated in
Tables 15-35 which can be found in Appendices 15-35 . The results from the three trials show that the mixture of RC-2
and RC-4 (with 32.73% rubber tire crumbs) had the smallest sorptivity aside from having the smallest absorption which
was probably due to the fact that it had a finer sieve that prevented air voids and made the concrete more compacted
which is essential in waterproofing. The results also showed that Ordinary Concrete had a higher rate of absorption than
specimens incorporated with rubber tire crumbs and that the rate of absorption of the specimen progressed significantly
from the start up to the 24th
hour and slightly increased on the following days since the specimen‘s voids were occupied
already. Water ponding in Ordinary Concrete was visible on the 6th
hour of the test wherein the water occupied almost
25% of the specimen it was fully occupied on the 24th
hour of the experiment while in specimens incorporated with
rubber tire crumbs, water ponding was visible on the 3rd
day of the experiment and became fully saturated on the 4th
day.
The results show that RC-2 had the lowest rate of absorption among the mixes incorporated with rubber tire crumbs.
Hence, Rubber concrete has a potential of reducing concrete‘s water absorption as well as permeability.

International Journal of Civil and Structural Engineering Research ISSN 2348-7607 (Online) Vol. 3, Issue 2, pp: (95-132), Month: October 2015 - March 2016, Available at: www.researchpublish.com
Page | 115 Research Publish Journals
TRIAL 1
Figure 18 Trial 1 Summary of Rate of Absorption with respect to Time
Figure 19 Trial 2 Summary of Rate of Absorption with respect to Time

International Journal of Civil and Structural Engineering Research ISSN 2348-7607 (Online) Vol. 3, Issue 2, pp: (95-132), Month: October 2015 - March 2016, Available at: www.researchpublish.com
Page | 116 Research Publish Journals
Figure 20 Trial 3 Summary of Rate of Absorption with respect to Time
Figure 22 Mass before complete Sealing

International Journal of Civil and Structural Engineering Research ISSN 2348-7607 (Online) Vol. 3, Issue 2, pp: (95-132), Month: October 2015 - March 2016, Available at: www.researchpublish.com
Page | 117 Research Publish Journals
Figure 23 Mass before Complete Sealing
Figure 24 Water ponding at 3 hours
Figure 25 Water ponding at 24 hours
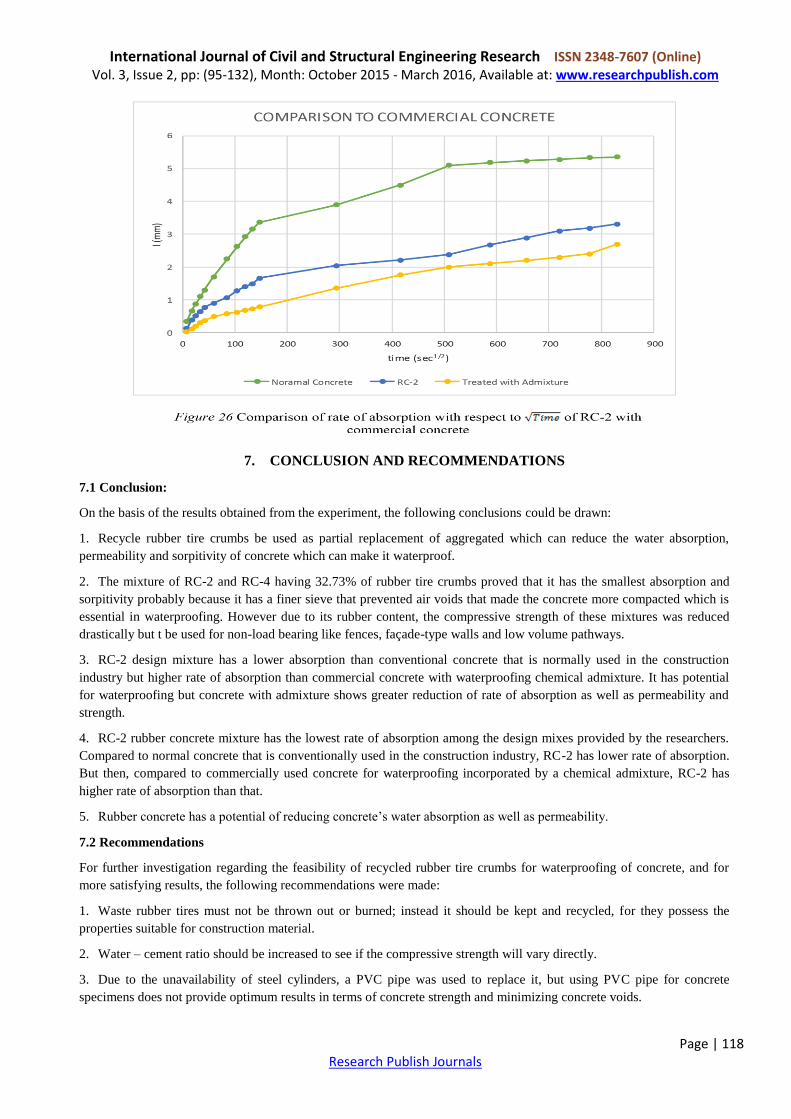
International Journal of Civil and Structural Engineering Research ISSN 2348-7607 (Online) Vol. 3, Issue 2, pp: (95-132), Month: October 2015 - March 2016, Available at: www.researchpublish.com
Page | 118 Research Publish Journals
7. CONCLUSION AND RECOMMENDATIONS
7.1 Conclusion:
On the basis of the results obtained from the experiment, the following conclusions could be drawn:
1. Recycle rubber tire crumbs be used as partial replacement of aggregated which can reduce the water absorption,
permeability and sorpitivity of concrete which can make it waterproof.
2. The mixture of RC-2 and RC-4 having 32.73% of rubber tire crumbs proved that it has the smallest absorption and
sorpitivity probably because it has a finer sieve that prevented air voids that made the concrete more compacted which is
essential in waterproofing. However due to its rubber content, the compressive strength of these mixtures was reduced
drastically but t be used for non-load bearing like fences, façade-type walls and low volume pathways.
3. RC-2 design mixture has a lower absorption than conventional concrete that is normally used in the construction
industry but higher rate of absorption than commercial concrete with waterproofing chemical admixture. It has potential
for waterproofing but concrete with admixture shows greater reduction of rate of absorption as well as permeability and
strength.
4. RC-2 rubber concrete mixture has the lowest rate of absorption among the design mixes provided by the researchers.
Compared to normal concrete that is conventionally used in the construction industry, RC-2 has lower rate of absorption.
But then, compared to commercially used concrete for waterproofing incorporated by a chemical admixture, RC-2 has
higher rate of absorption than that.
5. Rubber concrete has a potential of reducing concrete‘s water absorption as well as permeability.
7.2 Recommendations
For further investigation regarding the feasibility of recycled rubber tire crumbs for waterproofing of concrete, and for
more satisfying results, the following recommendations were made:
1. Waste rubber tires must not be thrown out or burned; instead it should be kept and recycled, for they possess the
properties suitable for construction material.
2. Water – cement ratio should be increased to see if the compressive strength will vary directly.
3. Due to the unavailability of steel cylinders, a PVC pipe was used to replace it, but using PVC pipe for concrete
specimens does not provide optimum results in terms of concrete strength and minimizing concrete voids.

International Journal of Civil and Structural Engineering Research ISSN 2348-7607 (Online) Vol. 3, Issue 2, pp: (95-132), Month: October 2015 - March 2016, Available at: www.researchpublish.com
Page | 119 Research Publish Journals
4. When placing the rubber concrete specimen to concrete molds, a strict implementation of the Standard Tamping
Procedure must be observed to prevent concrete voids which is essential in reducing water absorption and permeability
rate.
5. A previous experiment showed that replacing more than 20% of fine aggregates in a concrete mixture will drastically
reduce its compressive strength and this was the basis in reducing the fine aggregates in this experiment. However, the
30% and 50% reduction on coarse aggregates were provided by the authors and it is recommended for future studies to
try to increase the reduction of coarse aggregates to 5% to 15% and see if the mixture can still attain sufficient strength
good enough for non-bearing structures.
6. The best mix proportion suited for reducing concrete‘s water absorption and permeability which in turn makes a
concrete waterproof is the RC-2 mix which contains 32.73% Class A rubber tire crumbs of, 18.18% cement, 21.82% sand
and 27.28% gravel.
7. The mix proportion that can be used for non-bearing structure is RC-5 mix which has 19.10% Class C rubber tire
crumbs, 18.18% cement, 24.54% sand and 38.18% gravel.
8. A higher percentage of rubber and higher water content is recommended for further study. This is because at higher
percentage of rubber with lesser water content, consistency mix is impossible to attain.
ACKNOWLEDGEMENT
The authors wish to acknowledge the invaluable editorial and secretarial assistance of Dr. Roger D. Posadas, Mrs.
Merlyn Rubin Posadas, and Mrs. Gloria Dumale of the Research and Innovation Center of LPU-Cavite.
REFERENCES
[1] Abdul K. (2011, June). Influence of Concrete Mix Proportions and Curing Regimes on Density, Absorption, and
Voids in Hardened Concrete.
[2] Advincula, E., Esplago, C., Olaso, F. (2004, March). CE Research Journal. Utilization of Waste Tire Rubber as
Binder Modifier for Bituminous Road Construction. 15-18
[3] American Society for Testing and Materials [ASTM], C1585. (2004). Standard Test Method for Measurement of
Rate of Absorption of Water by Hydraulic-Cement Concretes. Philadelphia: Author.
[4] American Society for Testing and Materials [ASTM], C192. (2004). Standard Practice for Making and Curing
Concrete Test Specimens in the Laboratory. Philadelphia: Author.
[5] American Society for Testing and Materials [ASTM], C39. (2004). Standard Test Method for Compressive Strength
of Cylindrical Concrete Specimens. Philadelphia: Author.
[6] American Society for Testing and Materials [ASTM], D5603. (2001). Standard Classification for Rubber
Compounding Materials—Recycled Vulcanizate Particulate Rubber. Philadelphia: Author.
[7] American Society for Testing and Materials [ASTM], D5644.(2001). Standard Test Methods for Rubber
Compounding Materials—Determination of Particle Size Distribution of Recycled Vulcanizate Particulate Rubber.
Philadelphia: Author.
[8] American Society for Testing and Materials [ASTM], C642. (1997). Standard Test Method for Density, Absorption,
and Voids in Hardened Concrete. Philadelphia: Author.
[9] Byrami M, Auckland Uniservices Limited, (2006, October). Rate of Absorption of Water by Litecrete Lightweight
Concrete and Normal Concrete.
[10] Devadas, M. (2003, June). Reinforced Concrete Construction. Tata McGraw-Hill Education
[11] Gillesania, D. (2013). Simplified Reinforced Concrete Design 2010 NSCP. Cebu DGPrint, Inc.
[12] Mangubat, P., Calapiz, I., Eder, A., Mantala Jr., M., Salendro, E. (2008, June). Licean Journal of Social Science.
Feasibility of Waste Rubber Dust as a Concrete Aggregate, 1(2). 1-20

International Journal of Civil and Structural Engineering Research ISSN 2348-7607 (Online) Vol. 3, Issue 2, pp: (95-132), Month: October 2015 - March 2016, Available at: www.researchpublish.com
Page | 120 Research Publish Journals
[13] Mojica, M. (2005, November) Bureau of Agricultural Research Chronicle. 100 Years of Rubber in the Philippines;
Some Glimpses 6(11). 1-7
[14] Patel, N. V. (2009, August). Sorptivity Testing To Assess Durability of Concrete Against Freeze-Thaw Cycling
National Structural Code of the Philippines (NSCP 2010)
ONLINE REFERENCES:
[15] Allen, F. (2010, March. Crumb Rubber Concrete. Retrieved from http://precast.org/tag/crumb-rubber-concrete/
[16] Howes, K., & McDonald, J. (2006). Waterproof Concrete. Retrieved from http://www.waterproof-concrete.co.uk/
[17] Qiang, Z., Fang, C., Hua, Z., Ming, L., & Peng, N. (2008, August). Use of Concrete Admixtures to Produce
―Waterproof‖ Concrete– Asia Results. Retrieved from http://cipremier.com/100033056
[18] Recycling Research Institute. Crumb Rubber Overview from http://www.scraptirenews.com/crumb.php
[19] Sgobba, S., Marano, G., Borsa, M., & Molfetta, M. (2010, June). Use of rubber particles from recycled tires as
concrete aggregate for engineering applications. Retrieved
https://www.academia.edu/839680/Use_of_Rubber_Particles_from_Recycled_Tires_as_Concrete_Aggregate_for_E
ngineering_Applications
APPENDIX - A
Table 11. Water Absorption Test Result-Trial 1
Name of Specimen Oven Dry Mass
(kg)
Dry Mass (kg)
Water Absorption
(%)
RC-1 1.8655 1.996 7.02
RC-2 1.715 1.803 5.13
RC-3 1.947 2.095 7.60
RC-4 2.017 2.131 5.65
RC-5 1.863 2.020 8.43
RC-6 2.058 2.196 6.71
OC 2.323 2.60 11.94
Table 12. Water Absorption Test Result-Trial 2
Name of Specimen Oven Dry Mass
(kg)
Dry Mass (kg)
Water Absorption
(%)
RC-1 1.793 1.916 6.86
RC-2 1.627 1.707 4.92
RC-3 1.872 2.012 7.48
RC-4 1.937 2.039 5.27
RC-5 1.843 1.995 8.25
RC-6 2.002 2.129 6.34
OC 2.242 2.503 11.64

International Journal of Civil and Structural Engineering Research ISSN 2348-7607 (Online) Vol. 3, Issue 2, pp: (95-132), Month: October 2015 - March 2016, Available at: www.researchpublish.com
Page | 121 Research Publish Journals
Table 13. Water Absorption Test Result-Trial 3
Name of Specimen Oven Dry Mass (kg) Dry Mass (kg) Water Absorption (%)
RC-1 1.728 1.862 7.75
RC-2 1.78 1.882 5.73
RC-3 1.781 1.939 8.87
RC-4 1.855 1.993 7.44
RC-5 1.84 2.020 9.78
RC-6 1.715 1.854 8.10
OC 2.134 2.42 13.42
Table 14. Average Rate of Water Absorption
Name of Specimen
RC-1 7.21
RC-2 5.26
RC-3 7.98
RC-4 6.12
RC-5 8.82
RC-6 7.05
OC 12.33
Based on the result, concrete incorporated with rubber tire crumbs has a lower water absorption than an ordinary concrete
mix, and the specimen with the lowest water absorption is the RC-2 design mix which has a water absorption rate of
7.21%
Table 15. Water Sorptivity Test Result of RC-1(Trial 1)
RC-2 Time
(seconds)1/2
Initial Mass
(g) Mass 2 mt 1
1 min 7.75 775 776 1 0.127
5 min 17.32 775 778 3 0.382
10 min 24.49 775 779 4 0.509
20 min 34.64 775 780 5 0.637
30 min 42.43 775 781 6 0.764
60 min 60.00 775 782 7 0.891
2hours 84.85 775 784 9 1.146
3 hours 103.92 775 786 11 1.401
4 hours 120.00 775 786 11 1.401
5 hours 134.16 775 788 13 1.655
6 hours 146.97 775 789 14 1.783
1 day 293.94 775 794 19 2.419
2 days 415.69 775 799 24 3.056
3 days 509.12 775 801 26 3.310
4 days 587.88 775 804 29 3.692
5 days 657.27 775 804 29 3.692
6 days 720.00 775 806 31 3.947
7 days 777.69 775 807 32 4.074
8 days 831.38 775 808 33 4.202
International Journal of Civil and Structural Engineering Research ISSN 2348-7607 (Online) Vol. 3, Issue 2, pp: (95-132), Month: October 2015 - March 2016, Available at: www.researchpublish.com
Page | 122 Research Publish Journals
Table 16 Water Sorptivity Test Result of RC-2 (Trial 1)
RC-2 Time
(seconds)1/2
Initial Mass
(g) Mass 2 mt 1
1 min 7.75 746 747 1 0.127
5 min 17.32 746 749 3 0.382
10 min 24.49 746 750 4 0.509
20 min 34.64 746 751 5 0.637
30 min 42.43 746 752 6 0.764
60 min 60.00 746 753 7 0.891
2 hours 84.85 746 754 9 1.019
3 hours 103.92 746 755 10 1.146
4 hours 120.00 746 756 10 1.273
5 hours 134.16 746 756 11 1.273
6 hours 146.97 746 757 14 1.401
1 day 293.94 746 761 19 1.910
2 days 415.69 746 762 15 2.037
3 days 509.12 746 764 16 2.292
4 days 587.88 746 768 18 2.801
5 days 657.27 746 770 22 3.056
6 days 720.00 746 772 24 3.310
7 days 777.69 746 772 26 3.310
8 days 831.38 746 773 27 3.438
Table 17 Water Sorptivity Test Result of RC-3 (Trial 1)
RC-3 Time
(seconds)1/2
Initial Mass
(g) Mass 2 mt 1
1 min 7.75 764 765 1 0.127
5 min 17.32 764 767 3 0.382
10 min 24.49 764 769 5 0.637
20 min 34.64 764 769 5 0.637
30 min 42.43 764 770 6 0.764
60 min 60.00 764 771 7 0.891
2 hours 84.85 764 773 9 1.146
3 hours 103.92 764 775 11 1.401
4 hours 120.00 764 776 12 1.528
5 hours 134.16 764 777 13 1.655
6 hours 146.97 764 778 14 1.783
1 day 293.94 764 784 20 2.546
2 days 415.69 764 788 24 3.056
3 days 509.12 764 791 27 3.438
4 days 587.88 764 793 29 3.692
5 days 657.27 764 796 32 4.074
6 days 720.00 764 797 33 4.202
7 days 777.69 764 799 35 4.456
8 days 831.38 764 802 38 4.838

International Journal of Civil and Structural Engineering Research ISSN 2348-7607 (Online) Vol. 3, Issue 2, pp: (95-132), Month: October 2015 - March 2016, Available at: www.researchpublish.com
Page | 123 Research Publish Journals
Table 18 Water Sorptivity Test Result of RC-4 (Trial 1)
RC-4 Time
(seconds)1/2
Initial Mass
(g) Mass 2 mt 1
1 min 7.75 774 775 1 0.127
5 min 17.32 774 776 2 0.255
10 min 24.49 774 778 4 0.509
20 min 34.64 774 779 5 0.637
30 min 42.43 774 779 5 0.637
60 min 60.00 774 782 8 1.019
2 hours 84.85 774 785 11 1.401
3 hours 103.92 774 787 13 1.655
4 hours 120.00 774 787 13 1.655
5 hours 134.16 774 789 15 1.910
6 hours 146.97 774 790 16 2.037
1 day 293.94 774 795 21 2.674
2 days 415.69 774 797 23 2.928
3 days 509.12 774 799 25 3.183
4 days 587.88 774 799 25 3.183
5 days 657.27 774 801 27 3.438
6 days 720.00 774 802 28 3.565
7 days 777.69 774 803 29 3.692
8 days 831.38 774 804 30 3.820
Table 19 Water Sorptivity Test Result of RC-5 (Trial 1)
RC-5 Time
(seconds)1/2
Initial Mass
(g) Mass 2 mt 1
1 min 7.75 862 863 1 0.127
5 min 17.32 862 864 2 0.255
10 min 24.49 862 866 4 0.509
20 min 34.64 862 868 6 0.764
30 min 42.43 862 868 6 0.764
60 min 60.00 862 870 8 1.019
2 hours 84.85 862 872 10 1.273
3 hours 103.92 862 873 11 1.401
4 hours 120.00 862 874 12 1.528
5 hours 134.16 862 876 14 1.783
6 hours 146.97 862 879 17 2.165
1 day 293.94 862 883 21 2.674
2 days 415.69 862 889 27 3.438
3 days 509.12 862 892 30 3.820
4 days 587.88 862 894 32 4.074
5 days 657.27 862 896 34 4.329
6 days 720.00 862 897 35 4.456
7 days 777.69 862 899 37 4.711
8 days 831.38 862 899 37 4.711

International Journal of Civil and Structural Engineering Research ISSN 2348-7607 (Online) Vol. 3, Issue 2, pp: (95-132), Month: October 2015 - March 2016, Available at: www.researchpublish.com
Page | 124 Research Publish Journals
Table 20 Water Sorptivity Test Result of RC-6 (Trial 1)
RC-6 Time
(seconds)1/2
Initial Mass
(g) Mass 2 mt 1
1 min 7.75 748 749 1 0.127
5 min 17.32 748 750 2 0.255
10 min 24.49 748 752 4 0.509
20 min 34.64 748 753 5 0.637
30 min 42.43 748 754 6 0.764
60 min 60.00 748 755 7 0.891
2 hours 84.85 748 757 9 1.146
3 hours 103.92 748 759 11 1.401
4 hours 120.00 748 760 12 1.528
5 hours 134.16 748 761 13 1.655
6 hours 146.97 748 764 16 2.037
1 day 293.94 748 768 20 2.546
2 days 415.69 748 772 24 3.056
3 days 509.12 748 776 28 3.565
4 days 587.88 748 778 30 3.820
5 days 657.27 748 780 32 4.074
6 days 720.00 748 782 34 4.329
7 days 777.69 748 784 36 4.584
8 days 831.38 748 784 36 4.584
Table 21 Water Sorptivity Test Result of OC (Trial 1)
OC Time (seconds)1/2
Initial Mass (g) Mass 2 mt 1
1 min 7.75 1022 1023 1 0.127
5 min 17.32 1022 1026 4 0.509
10 min 24.49 1022 1028 6 0.764
20 min 34.64 1022 1031 9 1.146
30 min 42.43 1022 1034 12 1.528
60 min 60.00 1022 1037 15 1.910
2 hours 84.85 1022 1039 17 2.165
3 hours 103.92 1022 1041 19 2.419
4 hours 120.00 1022 1043 21 2.674
5 hours 134.16 1022 1045 23 2.928
6 hours 146.97 1022 1046 24 3.056
1 day 293.94 1022 1052 30 3.820
2 days 415.69 1022 1055 33 4.202
3 days 509.12 1022 1057 35 4.456
4 days 587.88 1022 1059 37 4.711
5 days 657.27 1022 1061 39 4.966
6 days 720.00 1022 1061 39 4.966
7 days 777.69 1022 1062 40 5.093
8 days 831.38 1022 1063 41 5.220

International Journal of Civil and Structural Engineering Research ISSN 2348-7607 (Online) Vol. 3, Issue 2, pp: (95-132), Month: October 2015 - March 2016, Available at: www.researchpublish.com
Page | 125 Research Publish Journals
Table 22 Water Sorptivity Test Result of RC-1 (Trial 2)
RC-1 Time
(seconds)1/2
Initial Mass
(g) Mass 2 mt 1
1 min 7.75 775 776 1 0.127
5 min 17.32 775 779 4 0.509
10 min 24.49 775 781 6 0.764
20 min 34.64 775 783 8 1.019
30 min 42.43 775 781 6 0.764
60 min 60.00 775 782 7 0.891
2 hours 84.85 775 784 9 1.146
3 hours 103.92 775 786 11 1.401
4 hours 120.00 775 787 12 1.528
5 hours 134.16 775 788 13 1.628
6 hours 146.97 775 789 14 1.783
1 day 293.94 775 795 20 2.546
2 days 415.69 775 799 24 3.056
3 days 509.12 775 802 27 3.438
4 days 587.88 775 804 29 3.692
5 days 657.27 775 805 30 3.820
6 days 720.00 775 808 33 4.202
7 days 777.69 775 810 35 4.456
8 days 831.38 775 812 37 4.711
Table 23 Water Sorptivity Test Result of RC-2 (Trial 2)
RC-2 Time (seconds)1/2
Initial Mass (g) Mass 2 mt 1
1 min 7.75 709 710 1 0.127
5 min 17.32 709 713 4 0.509
10 min 24.49 709 714 5 0.637
20 min 34.64 709 715 6 0.764
30 min 42.43 709 716 7 0.891
60 min 60.00 709 717 8 1.019
2 hours 84.85 709 718 9 1.149
3 hours 103.92 709 720 11 1.401
4 hours 120.00 709 721 12 1.528
5 hours 134.16 709 722 13 1.655
6 hours 146.97 709 724 15 1.910
1 day 293.94 709 725 16 2.037
2 days 415.69 709 727 18 2.292
3 days 509.12 709 728 19 2.419
4 days 587.88 709 729 20 2.546
5 days 657.27 709 730 21 2.674
6 days 720.00 709 732 23 2.928
7 days 777.69 709 733 24 3.056
8 days 831.38 709 734 25 3.183

International Journal of Civil and Structural Engineering Research ISSN 2348-7607 (Online) Vol. 3, Issue 2, pp: (95-132), Month: October 2015 - March 2016, Available at: www.researchpublish.com
Page | 126 Research Publish Journals
Table 24 Water Sorptivity Test Result of RC-3 (Trial 2)
RC-3 Time (seconds)1/2
Initial Mass (g) Mass 2 mt 1
1 min 7.75 818 819 1 0.127
5 min 17.32 818 821 3 0.382
10 min 24.49 818 822 4 0.509
20 min 34.64 818 823 5 0.637
30 min 42.43 818 824 6 0.764
60 min 60.00 818 825 7 0.891
2 hours 84.85 818 827 9 1.146
3 hours 103.92 818 829 11 1.404
4 hours 120.00 818 830 12 1.528
5 hours 134.16 818 831 13 1.655
6 hours 146.97 818 832 14 1.783
1 day 293.94 818 838 20 2.546
2 days 415.69 818 842 24 3.056
3 days 509.12 818 845 27 3.438
4 days 587.88 818 847 29 3.692
5 days 657.27 818 851 33 4.202
6 days 720.00 818 853 35 4.456
7 days 777.69 818 854 36 4.584
8 days 831.38 818 856 38 4.838
Table 25 Water Sorptivity Test Result of RC-4 (Trial 2)
RC-4 Time (seconds)1/2
Initial Mass (g) Mass 2 mt 1
1 min 7.75 715 716 1 0.127
5 min 17.32 715 717 2 0.255
10 min 24.49 715 718 3 0.382
20 min 34.64 715 719 4 0.509
30 min 42.43 715 720 5 0.637
60 min 60.00 715 721 6 0.764
2 hours 84.85 715 723 8 1.019
3 hours 103.92 715 725 10 1.73
4 hours 120.00 715 726 11 1.401
5 hours 134.16 715 727 12 1.528
6 hours 146.97 715 728 13 1.655
1 day 293.94 715 732 17 2.165
2 days 415.69 715 733 18 2.292
3 days 509.12 715 735 20 2.546
4 days 587.88 715 736 21 2.674
5 days 657.27 715 737 22 2.801
6 days 720.00 715 739 24 3.056
7 days 777.69 715 741 26 3.310
8 days 831.38 715 742 27 3.438

International Journal of Civil and Structural Engineering Research ISSN 2348-7607 (Online) Vol. 3, Issue 2, pp: (95-132), Month: October 2015 - March 2016, Available at: www.researchpublish.com
Page | 127 Research Publish Journals
Table 26 Water Sorptivity Test Result of RC-5 (Trial 2)
RC-5 Time (seconds)1/2
Initial Mass (g) Mass 2 mt 1
1 min 7.75 908 909 1 0.127
5 min 17.32 908 910 2 0.255
10 min 24.49 908 912 4 0.509
20 min 34.64 908 913 5 0.637
30 min 42.43 908 914 6 0.764
60 min 60.00 908 915 7 0.891
2 hours 84.85 908 917 9 1.146
3 hours 103.92 908 919 11 1.401
4 hours 120.00 908 920 12 1.528
5 hours 134.16 908 921 13 1.655
6 hours 146.97 908 922 14 1.783
1 day 293.94 908 928 20 2.546
2 days 415.69 908 932 24 3.056
3 days 509.12 908 935 27 3.438
4 days 587.88 908 937 29 3.692
5 days 657.27 908 941 33 4.202
6 days 720.00 908 942 34 4.329
7 days 777.69 908 943 35 4.456
8 days 831.38 908 943 35 4.456
Table 27 Water Sorptivity Test Result of RC-6 (Trial 1)
RC-6 Time (seconds)1/2
Initial Mass (g) Mass 2 mt 1
1 min 7.75 849 850 1 0.127
5 min 17.32 849 851 2 0.255
10 min 24.49 849 853 4 0.509
20 min 34.64 849 854 5 0.637
30 min 42.43 849 855 6 0.764
60 min 60.00 849 856 7 0.891
2 hours 84.85 849 857 8 1.019
3 hours 103.92 849 858 9 1.146
4 hours 120.00 849 860 11 1.401
5 hours 134.16 849 864 15 1.910
6 hours 146.97 849 865 16 2.037
1 day 293.94 849 871 22 2.801
2 days 415.69 849 875 26 3.310
3 days 509.12 849 878 29 3.692
4 days 587.88 849 880 31 3.947
5 days 657.27 849 884 35 4.456
6 days 720.00 849 885 36 4.584
7 days 777.69 849 886 37 4.711
8 days 831.38 849 888 39 49.66

International Journal of Civil and Structural Engineering Research ISSN 2348-7607 (Online) Vol. 3, Issue 2, pp: (95-132), Month: October 2015 - March 2016, Available at: www.researchpublish.com
Page | 128 Research Publish Journals
Table 28 Water Sorptivity Test Result of OC (Trial 2)
OC Time (seconds)1/2
Initial Mass (g) Mass 2 mt 1
1 min 7.75 1035 1036 1 0.127
5 min 17.32 1035 1038 3 0.382
10 min 24.49 1035 1040 5 0.637
20 min 34.64 1035 1044 9 1.146
30 min 42.43 1035 1046 11 1.401
60 min 60.00 1035 1049 14 1.783
2 hours 84.85 1035 1053 18 2.292
3 hours 103.92 1035 1054 19 2.419
4 hours 120.00 1035 1057 22 2.801
5 hours 134.16 1035 1060 25 3.183
6 hours 146.97 1035 1064 29 3.692
1 day 293.94 1035 1079 44 5.602
2 days 415.69 1035 1083 48 6.112
3 days 509.12 1035 1084 49 6.239
4 days 587.88 1035 1085 50 6.366
5 days 657.27 1035 1085 50 6.366
6 days 720.00 1035 1087 52 6.621
7 days 777.69 1035 1088 53 6.748
8 days 831.38 1035 1089 54 6.875
Table 29 Water Sorptivity Test Result of RC-1 (Trial 3)
RC-1 Time (seconds)1/2
Initial Mass (g) Mass 2 mt 1
1 min 7.75 824 825 1 0.127
5 min 17.32 824 827 3 0.382
10 min 24.49 824 828 4 0.509
20 min 34.64 824 829 5 0.637
30 min 42.43 824 830 6 0.764
60 min 60.00 824 831 7 0.891
2 hours 84.85 824 833 9 1.146
3 hours 103.92 84 835 11 1.401
4 hours 120.00 824 836 12 1.528
5 hours 134.16 824 837 13 1.655
6 hours 146.97 824 838 14 1.783
1 day 293.94 824 844 20 2.546
2 days 415.69 824 848 24 3.056
3 days 509.12 824 851 27 3.438
4 days 587.88 824 853 29 3.692
5 days 657.27 824 856 32 4.074
6 days 720.00 824 858 34 4.329
7 days 777.69 824 859 35 4.456
8 days 831.38 824 861 37 4.711

International Journal of Civil and Structural Engineering Research ISSN 2348-7607 (Online) Vol. 3, Issue 2, pp: (95-132), Month: October 2015 - March 2016, Available at: www.researchpublish.com
Page | 129 Research Publish Journals
Table 30 Water Sorptivity Test Result of RC-2 (Trial 3)
RC-2 Time (seconds)1/2
Initial Mass (g) Mass 2 mt 1
1 min 7.75 749 750 1 0.127
5 min 17.32 749 751 2 0.255
10 min 24.49 749 752 3 0.382
20 min 34.64 749 753 4 0.509
30 min 42.43 749 754 5 0.637
60 min 60.00 749 755 6 0.764
2 hours 84.85 749 757 8 1.019
3 hours 103.92 749 759 10 1.273
4 hours 120.00 749 760 11 1.401
5 hours 134.16 749 761 12 1.528
6 hours 146.97 749 762 13 1.655
1 day 293.94 749 766 17 2.165
2 days 415.69 749 767 18 2.292
3 days 509.12 749 768 19 2.419
4 days 587.88 749 770 21 2.674
5 days 657.27 749 772 23 2.928
6 days 720.00 749 773 24 3.056
7 days 777.69 749 774 25 3.183
8 days 831.38 749 775 26 3.310
Table 31 Water Sorptivity Test Result of RC-3 (Trial 3)
RC-3 Time (seconds)1/2
Initial Mass (g) Mass 2 mt 1
1 min 7.75 772 773 1 0.127
5 min 17.32 772 775 3 0.382
10 min 24.49 772 776 4 0.509
20 min 34.64 772 777 5 0.637
30 min 42.43 772 778 6 0.764
60 min 60.00 772 779 7 0.891
2 hours 84.85 772 781 9 1.146
3 hours 103.92 772 783 11 1.401
4 hours 120.00 772 784 12 1.528
5 hours 134.16 772 785 13 1.655
6 hours 146.97 772 786 14 1.783
1 day 293.94 772 792 20 2.546
2 days 415.69 772 796 24 3.056
3 days 509.12 772 799 27 3.438
4 days 587.88 772 801 29 3.692
5 days 657.27 772 805 33 4.202
6 days 720.00 772 807 35 4.456
7 days 777.69 772 808 36 4.584
8 days 831.38 772 809 37 4.711

International Journal of Civil and Structural Engineering Research ISSN 2348-7607 (Online) Vol. 3, Issue 2, pp: (95-132), Month: October 2015 - March 2016, Available at: www.researchpublish.com
Page | 130 Research Publish Journals
Table 32 Water Sorptivity Test Result of RC-4 (Trial 3)
RC-4 Time (seconds)1/2
Initial Mass (g) Mass 2 mt 1
1 min 7.75 809 810 1 0.127
5 min 17.32 809 811 2 0.255
10 min 24.49 809 812 3 0.382
20 min 34.64 809 813 4 0.509
30 min 42.43 809 814 5 0.637
60 min 60.00 809 816 7 0.891
2 hours 84.85 809 819 10 1.273
3 hours 103.92 809 820 11 1.401
4 hours 120.00 809 822 13 1.655
5 hours 134.16 809 823 14 1.783
6 hours 146.97 809 824 15 1.910
1 day 293.94 809 828 19 2.419
2 days 415.69 809 832 23 2.928
3 days 509.12 809 834 25 3.183
4 days 587.88 809 835 26 3.310
5 days 657.27 809 836 27 3.438
6 days 720.00 809 836 287 3.438
7 days 777.69 809 838 29 3.692
8 days 831.38 809 839 30 3.820
Table 33 Water Sorptivity Test Result of RC-5 (Trial 3)
RC-5 Time (seconds)1/2
Initial Mass (g) Mass 2 mt 1
1 min 7.75 860 861 1 0.127
5 min 17.32 860 863 3 0.382
10 min 24.49 860 864 4 0.509
20 min 34.64 860 865 5 0.637
30 min 42.43 860 866 6 0.764
60 min 60.00 860 867 7 0.891
2 hours 84.85 860 869 9 1.146
3 hours 103.92 860 871 11 1.401
4 hours 120.00 860 872 12 1.528
5 hours 134.16 860 873 13 1.655
6 hours 146.97 860 874 14 1.783
1 day 293.94 860 880 20 2.546
2 days 415.69 860 884 24 3.056
3 days 509.12 860 887 27 3.438
4 days 587.88 860 889 29 3.692
5 days 657.27 860 893 33 4.202
6 days 720.00 860 896 36 4.584
7 days 777.69 860 897 37 4.711
8 days 831.38 860 898 38 4.838

International Journal of Civil and Structural Engineering Research ISSN 2348-7607 (Online) Vol. 3, Issue 2, pp: (95-132), Month: October 2015 - March 2016, Available at: www.researchpublish.com
Page | 131 Research Publish Journals
Table 34 Water Sorptivity Test Result of RC-6 (Trial 3)
RC-6 Time (seconds)1/2
Initial Mass (g) Mass 2 mt 1
1 min 7.75 788 78 1 0.127
5 min 17.32 788 791 3 0.382
10 min 24.49 788 792 4 0.509
20 min 34.64 788 793 5 0.637
30 min 42.43 788 794 6 0.764
60 min 60.00 788 795 7 0.891
2 hours 84.85 788 797 9 1.146
3 hours 103.92 788 799 11 1.401
4 hours 120.00 788 800 12 1.528
5 hours 134.16 788 801 13 1.655
6 hours 146.97 788 802 14 1.783
1 day 293.94 788 808 20 2.546
2 days 415.69 788 812 24 3.056
3 days 509.12 788 815 27 3.438
4 days 587.88 788 817 29 3.692
5 days 657.27 788 821 33 4.202
6 days 720.00 788 824 36 4.584
7 days 777.69 788 826 38 4.838
8 days 831.38 788 829 41 5.220
Table 35 Water Sorptivity Test Result of OC (Trial 3)
OC Time (seconds)1/2
Initial Mass (g) Mass 2 mt 1
1 min 7.75 1076 1077 1 0.127
5 min 17.32 1076 1079 3 0.382
10 min 24.49 1076 1083 7 0.891
20 min 34.64 1076 1085 9 1.146
30 min 42.43 1076 1087 11 1.401
60 min 60.00 1076 1092 16 2.037
2 hours 84.85 1076 1096 20 2.546
3 hours 103.92 1076 1099 23 2.928
4 hours 120.00 1076 1101 25 3.183
5 hours 134.16 1076 1103 27 3.438
6 hours 146.97 1076 1105 29 3.692
1 day 293.94 1076 1116 40 5.093
2 days 415.69 1076 1120 44 5.602
3 days 509.12 1076 1124 48 6.112
4 days 587.88 1076 1126 50 6.366
5 days 657.27 1076 1126 50 6.366
6 days 720.00 1076 1127 51 6.494
7 days 777.69 1076 1128 52 6.621
8 days 831.38 1076 1128 52 6.621
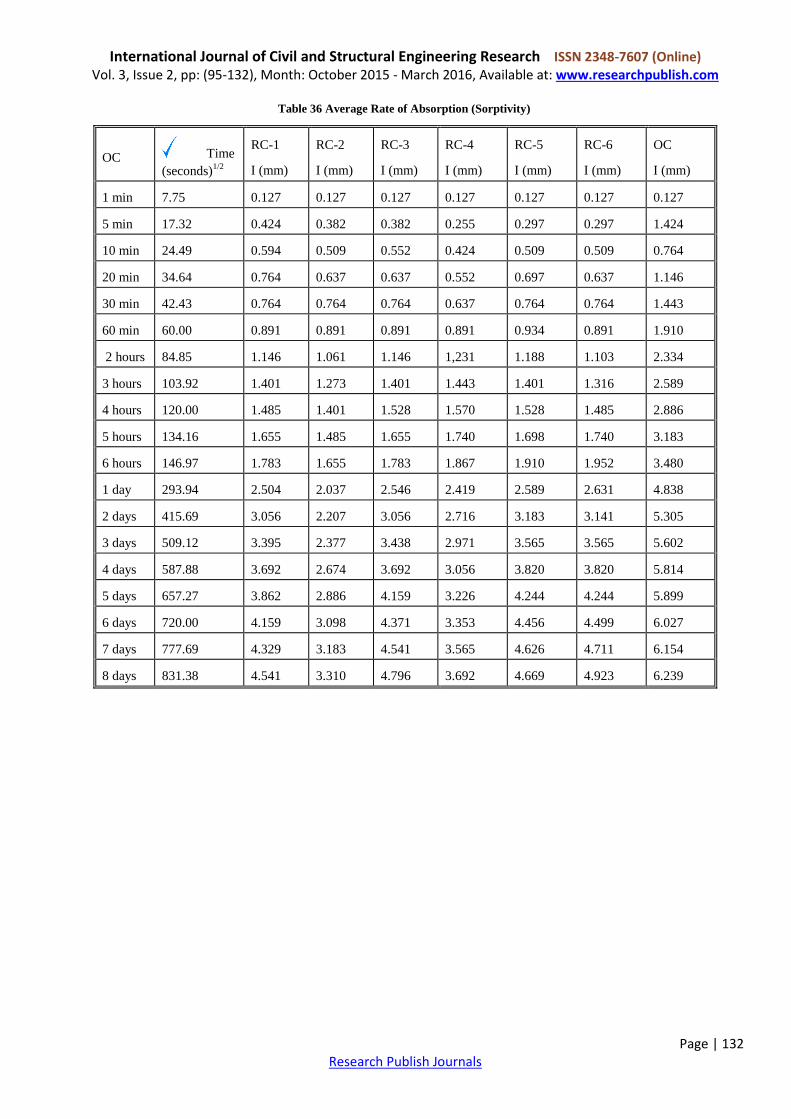
International Journal of Civil and Structural Engineering Research ISSN 2348-7607 (Online) Vol. 3, Issue 2, pp: (95-132), Month: October 2015 - March 2016, Available at: www.researchpublish.com
Page | 132 Research Publish Journals
Table 36 Average Rate of Absorption (Sorptivity)
OC Time
(seconds)1/2
RC-1
I (mm)
RC-2
I (mm)
RC-3
I (mm)
RC-4
I (mm)
RC-5
I (mm)
RC-6
I (mm)
OC
I (mm)
1 min 7.75 0.127 0.127 0.127 0.127 0.127 0.127 0.127
5 min 17.32 0.424 0.382 0.382 0.255 0.297 0.297 1.424
10 min 24.49 0.594 0.509 0.552 0.424 0.509 0.509 0.764
20 min 34.64 0.764 0.637 0.637 0.552 0.697 0.637 1.146
30 min 42.43 0.764 0.764 0.764 0.637 0.764 0.764 1.443
60 min 60.00 0.891 0.891 0.891 0.891 0.934 0.891 1.910
2 hours 84.85 1.146 1.061 1.146 1,231 1.188 1.103 2.334
3 hours 103.92 1.401 1.273 1.401 1.443 1.401 1.316 2.589
4 hours 120.00 1.485 1.401 1.528 1.570 1.528 1.485 2.886
5 hours 134.16 1.655 1.485 1.655 1.740 1.698 1.740 3.183
6 hours 146.97 1.783 1.655 1.783 1.867 1.910 1.952 3.480
1 day 293.94 2.504 2.037 2.546 2.419 2.589 2.631 4.838
2 days 415.69 3.056 2.207 3.056 2.716 3.183 3.141 5.305
3 days 509.12 3.395 2.377 3.438 2.971 3.565 3.565 5.602
4 days 587.88 3.692 2.674 3.692 3.056 3.820 3.820 5.814
5 days 657.27 3.862 2.886 4.159 3.226 4.244 4.244 5.899
6 days 720.00 4.159 3.098 4.371 3.353 4.456 4.499 6.027
7 days 777.69 4.329 3.183 4.541 3.565 4.626 4.711 6.154
8 days 831.38 4.541 3.310 4.796 3.692 4.669 4.923 6.239