u.s. market overview - tuna2018.infofish.orgtuna2018.infofish.org/images/presentation/day2/15. dave...
TRANSCRIPT

U.S. Market Overview
U.S. Total Seafood

Total Retail Seafood dollars have grown from $9.8 in 2011 to $11.9 billion in 2017.
Fresh and Frozen account for a combined 80% of the sales while Shelf-Stable seafood
sales account for 20%
3 Note: Fresh does not reflect Food Service/restaurants - $9.4B market in N. America

U.S. Frozen Seafood

5
Total frozen seafood sales generated $5.35 billion in the last year. This represents an increase of $213 million (+4.1%) versus year ago. Shrimp now represents more
than half of the total category.

6
The percent of US households consuming frozen seafood varies widely by species.
70% of households buy one or more species. The top four include Shrimp (47%),
Pollock (24%), Tilapia (20%) and Salmon (16%). Frozen Tuna represents almost 2%

U.S. Frozen Tuna

8
With just below 2% of households purchasing, U.S. sales of frozen tuna (through
retail channels) have nearly doubled since 2011- from $19.4MM to $37.3MM in
the latest 52 Week Period

The typical US household demographic of frozen tuna purchasers tends to be Urban,
mid-to-high income young adults as well as Boomers and suburban small families.
•9
Source: IRI Shopper Sights
2018
% Target
US HHs
%
Volume
Sales
% HH
Buying
Dollars
per 100
HH Index
Top 10
O54 Striving Single Scene 2.7% 7.9% 2.9% 312
G25 Urban Edge 1.6% 2.9% 2.3% 205
P58 Heritage Heights 0.5% 0.8% 1.6% 201
L41 Booming and Consuming 1.0% 2.0% 3.5% 201
O53 Colleges and Cafes 0.9% 1.4% 3.7% 189
A04 Picture Perfect Families 0.7% 1.3% 3.1% 181
E19 Full Pockets Empty Nests 1.5% 2.4% 2.2% 162
A05 Couples with Clout 0.8% 1.2% 3.2% 155
O52 Urban Ambition 1.3% 2.1% 2.4% 154
D17 Cul de Sac Diversity 0.7% 1.1% 2.3% 151
Bottom 5
S70 Tight Money 0.2% 0.1% 0.7% 40
K38 Gotham Blend 1.3% 0.4% 0.9% 37
Q65 Senior Discounts 1.6% 0.5% 1.1% 34
N48 Rural Southern Bliss 1.5% 0.5% 0.9% 32
S69 Urban Survivors 1.6% 0.3% 0.8% 21
TOTAL US Households 100.0% 100.0% 1.8% 100
Frozen Tuna - IRI Household Clusters

In relation to shelf-stable tuna, the U.S. Consumers of frozen tuna are closely aligned
with more premium ambient solutions like canned albacore and tuna pouches
•10
FROZEN
TUNA
POUCH
TUNA
CANNED
ALBACORE
CANNED
LIGHT
TUNA
FROZEN
TUNA
POUCH
TUNA
CANNED
ALBACORE
CANNED
LIGHT
TUNA
1 Person HH 72 90 94 87
2 Person HH 136 98 115 102 Race - White 108 103 105 99
3 Person HH 90 110 100 105 Race - African American 65 101 88 105
4 Person HH 100 112 90 103 Race - Asian 115 67 69 74
5+ Person HH 78 99 84 113 Race - Other / Unknown 73 90 89 113
Income lt $15K 35 79 82 112
Income $15-24.9K 42 93 94 112 Yngr Millennial: HH born 1990+ 101 84 50 93
Income $25-34.9K 68 91 89 112 Older Millennial: HH born 1981-89 110 108 73 93
Income $35-49.9K 79 98 97 109 Gen X: HH born 1965-80 110 110 90 99
Income $50-69.9K 97 110 99 105 Yngr Boomers: HH born 1956-64 111 102 112 106
Income $70-99.9K 133 108 104 94 Older Boomers: HH born 1946-55 95 92 121 104
Income ge $100K 142 104 114 82 Seniors: HH born b4 1946 61 78 130 101
IRI PANEL - Total US - All Outlets
BUYER INDEX - 52 Weeks Ending Dec-31-2017

U.S. Shelf Stable Seafood

12
Shelf Stable seafood accounted for $2.6 billion in sales over the last 52-weeks.
Tuna purchases represent nearly three-quarters of the total category sales.

•13
Most segments of Shelf Stable Seafood posted increases vs. the prior year. Core canned
tuna products increased (Albacore +2% and Light Tuna +1%), with Pouch Tuna,
Sardines and Ready To Eat Kits generating increases of 17%, 15% and 6% respectively

14
.
71.5
40.8
27.3 16.8 13.7 11.5
7.2 5.1 3.9 2.8 2.5 2.2 1.9 1.7 1.3
Percent of US Households Purchase by Shelf-Stable Seafood Segment
Source: IRI Panel - 52-Weeks Ending 3-25-18
U.S. household consumption of shelf-stable seafood is 71.5% in total. Canned light
tuna is purchased by 41% of households followed by canned albacore (27%), Pouch
Tuna (17%), Salmon (14%) and Sardines (12%)

15
Dollar Share Case Volume Share
Shelf Stable Tuna
Dollar and Volume Share By Type
Light tuna is the largest shelf stable tuna segment, contributing 39.4% of the dollars
sold and 54.2% of the tonnage. Albacore, follows with 36.6% of dollars and 31% of
volume sales. Pouch and RTE Kits are the smallest segments, but the fastest growing.
Source: IRI

16
Annual Shelf Stable Tuna dollar sales have rebounded back near the level of 2014.
Overall case volume sales have eroded slowly – with cans down 3.7 million
cases (-12.4%) offset by a +1.3 million case gain for pouches and kits (+40%).

17
StarKist is the leading brand of Tuna in the U.S. market, accounting for 42% of the
category dollars. Bumble Bee ranks #2 with 25%, followed by Chicken of the Sea (15%)

18
On a volume basis, Starkist accounts for 37% of Tuna sales, followed by Bumble Bee
(23%) and Chicken of the Sea (17%)

19
The number of households purchasing canned tuna declined over the last 5 years by
4 percentage points. The largest decline was canned light tuna, whereas the percent
of households purchasing Tuna Pouches and Ready-To-Eat Kits is increasing.
20
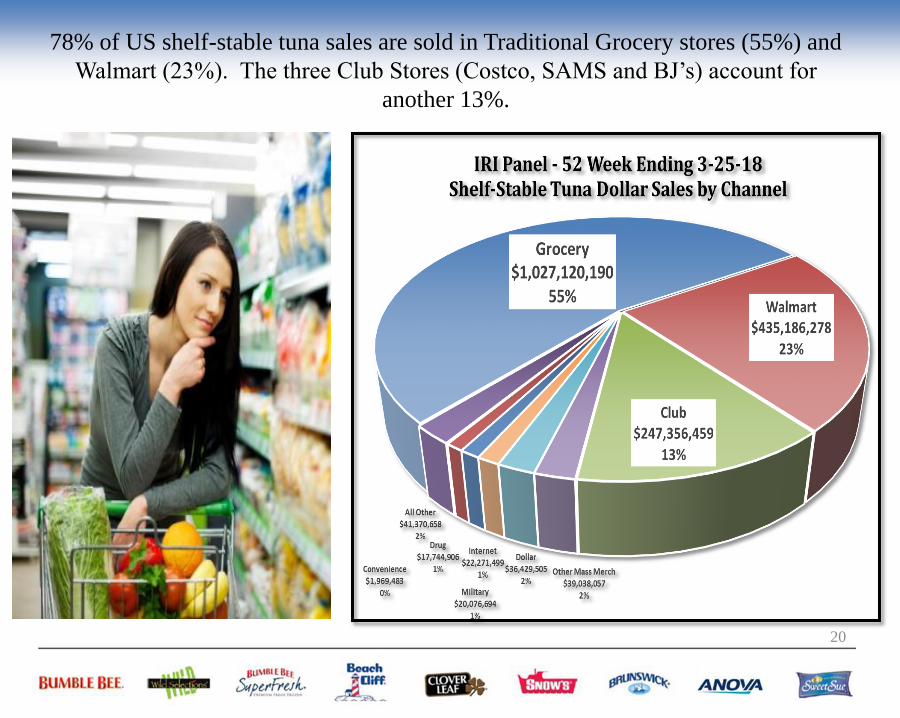
78% of US shelf-stable tuna sales are sold in Traditional Grocery stores (55%) and
Walmart (23%). The three Club Stores (Costco, SAMS and BJ’s) account for
another 13%.

We believe that canned and pouch Tuna is positioned for growth given the incredible
health benefits, it’s an affordable lean protein and convenient for a quick meal or snack
Consumer Trends Continue To Be Favorable For Tuna
• Consumer trends support growth opportunities
– Boomers and Millennials alike seeking “better for you” and cleaner
product options – that taste delicious
– Convenience is a critical factor in product offerings
especially snacking and on-the-go solutions
– Consumers with “fish forward” attitudes and behaviors
• Shelf Stable Tuna fits consumer needs
– Protein is “hot” today
– Healthy, nutritious and convenient
– Low in fat, calories and cholesterol
– High in Omega-3 EPA/DHA and excellent source of protein
– Linked to reduction in heart disease, Alzheimer’s, strokes
– Easy to prepare – Affordable “go to source” of lean protein
21

22
Net Effects Report
Key Opinion Leaders
RDs, MDs, Scientists
Health Care Providers
OBGYN, Peds, Nurses
Stakeholders
Engagement & Accountability
Media
Traditional and Non-Traditional
Medical
Institutions & Associations
Consumers
Pregnant/Nursing Moms
There are multiple industry and NGO initiatives underway in the U.S. to educate
and amplify the message about the health benefits of seafood across a diverse
spectrum of stakeholders
Leverage The Positive Science And Reach Key Targets
•23
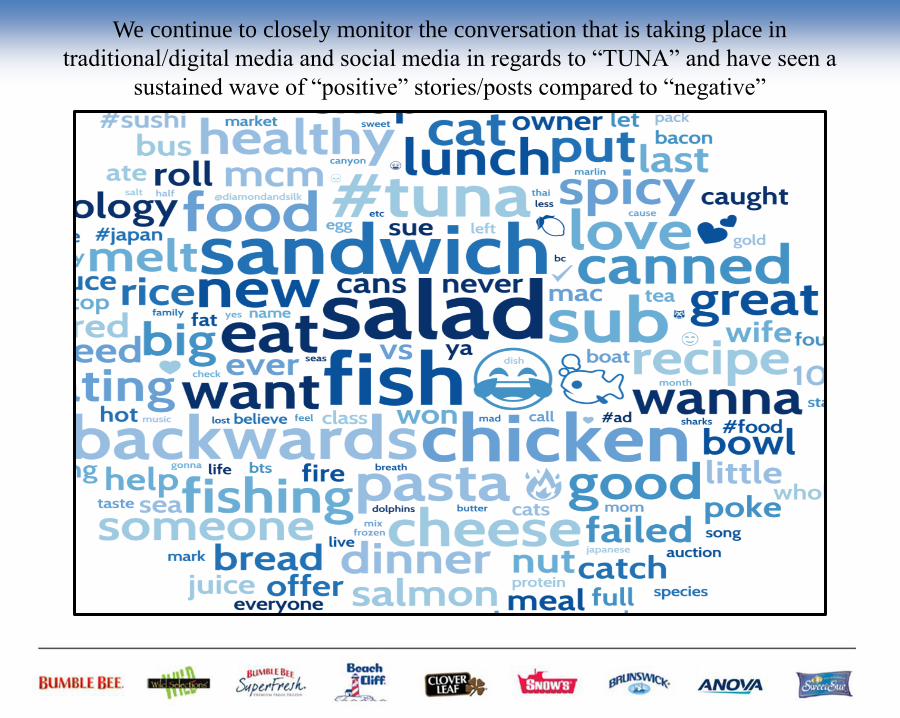
We continue to closely monitor the conversation that is taking place in
traditional/digital media and social media in regards to “TUNA” and have seen a
sustained wave of “positive” stories/posts compared to “negative”

Industry Commitment
• ISSF expects the tuna industry to demonstrate
and deepen its commitment to sustainable
fishing and responsible seafood sourcing
• From bycatch mitigation to product traceability,
ISSF participating companies have committed
to conforming to conservation measures and
other commitments designed to drive positive
change—and to do so transparently through
third-party audits
• Tuna vessels of all gear types can join ISSF’s
ProActive Register (PVR), an online
database, and be audited on their compliance
with select ISSF sustainability measures.
ISSF participating
tuna companies,
representing 75% of the
canned tuna industry, have
each committed to comply
with ISSF’s conservation
measures.
Finally, progress continues with the great work being conducted by ISSF

ISSF is currently in the process of rolling out their strategic goals for the next five
years – 2018 through 2022

ISSF is encouraged with increased participation and compliance among Tuna
companies with conservations measures - and also with the growth of vessel
registrations on the Proactive Vessel Registry (PVR). At the end of 2017, 966
vessels were registered,

Thank You And
Enjoy The Conference!