u.s drought highlights since october 2004
DESCRIPTION
U.S Drought Highlights Since October 2004. Douglas Le Comte NOAA/CPC 30 th Annual Climate Diagnostics and Prediction Workshop October 24-28, 2005. Outline. Drought Highlights —Southwest Alleviation, Northwest Development, and Midwest Summer Development Drought Forecasts —How are we doing?. - PowerPoint PPT PresentationTRANSCRIPT

U.S Drought Highlights Since U.S Drought Highlights Since October 2004October 2004
Douglas Le ComteDouglas Le Comte
NOAA/CPCNOAA/CPC
3030thth Annual Climate Diagnostics and Prediction Workshop Annual Climate Diagnostics and Prediction Workshop
October 24-28, 2005October 24-28, 2005

OutlineOutline
• Drought HighlightsDrought Highlights—Southwest Alleviation, —Southwest Alleviation,
Northwest Development, and Midwest Summer DevelopmentNorthwest Development, and Midwest Summer Development
• Drought ForecastsDrought Forecasts—How are we doing?—How are we doing?

What A Difference A Season Made in the What A Difference A Season Made in the West!West!

October vs April DroughtOctober vs April Drought

Water Year PrecipitationWater Year Precipitation
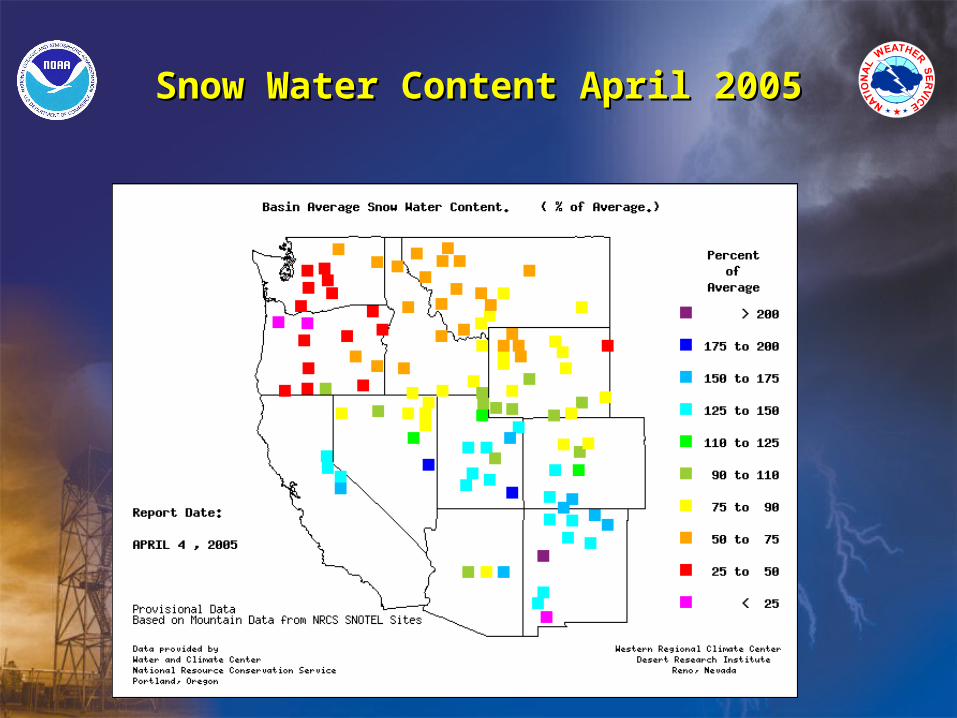
Snow Water Content April 2005Snow Water Content April 2005

Impressive Snowpack on Snowbird Impressive Snowpack on Snowbird November 7, 2004November 7, 2004
A pretty good omen that the 2004-05 snow seasonwould be extraordinary!

Southwest U.S. April-October PMDI Change vs Nino 3.4 SSTA
y = 0.9125x - 0.1103
R2 = 0.1269
-6.00
-5.00
-4.00
-3.00
-2.00
-1.00
0.00
1.00
2.00
3.00
4.00
5.00
6.00
-2.5 -2
-1.5 -1
-0.5 0
0.5 1
1.5 2
2.5 3
Nino 3.4 SSTA deg C
PM
DI C
han
ge
Nino 3.4 SST Anom Dec-Feb Linear (Nino 3.4 SST Anom Dec-Feb)
WETTER
WARMER SSTs
Although El Nino’s are generallyassociated with improved droughtconditions in the U.S. Southwest,this is by no means assured. The bestodds for improvement come withstronger events (SST anomaliesover +1.5 deg. C).
EL NINO’S and SOUTHWESTERN DROUGHTEL NINO’S and SOUTHWESTERN DROUGHT
Expected rangeof SSTs

Streamflow Forecasts April 1, 2005Streamflow Forecasts April 1, 2005

Spring-Summer ChangesSpring-Summer Changes

April vs July 2005April vs July 2005
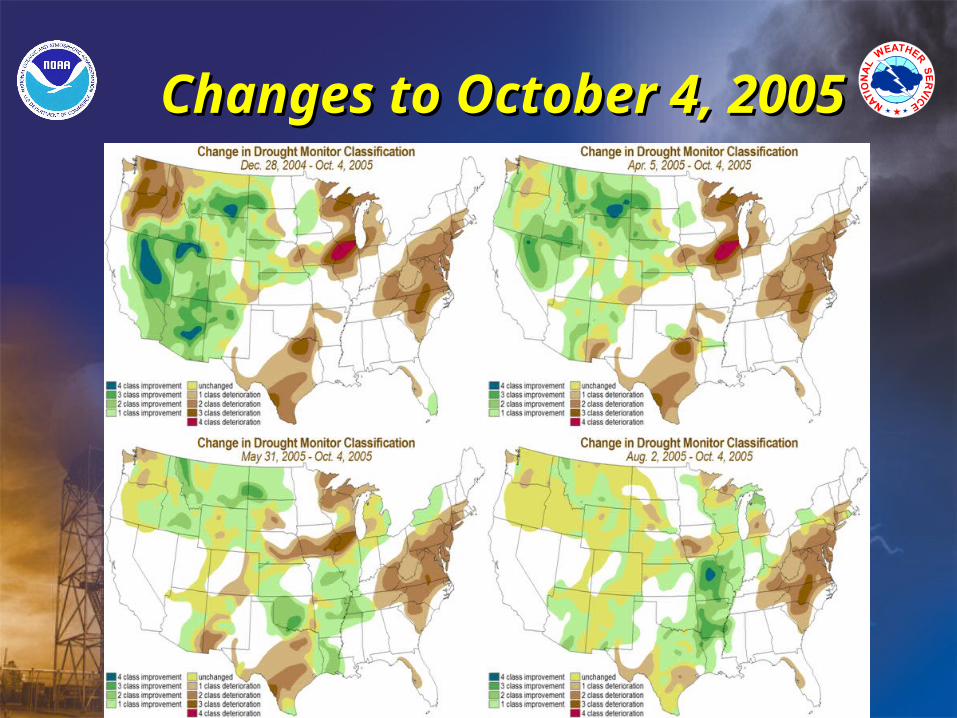
Changes to October 4, 2005Changes to October 4, 2005

August vs October 2005August vs October 2005

October 4 vs October 11 2005October 4 vs October 11 2005

The Seasonal Drought OutlooksThe Seasonal Drought Outlooks

Selected Drought Outlook ToolsSelected Drought Outlook Tools
• 2-Week Soil Moisture2-Week Soil Moisture
• Seasonal Constructed Analog Soil ForecastsSeasonal Constructed Analog Soil Forecasts
• NCDC Palmer Drought Amelioration Probability MapsNCDC Palmer Drought Amelioration Probability Maps

CPC 2-Wk Soil Moisture ForecastCPC 2-Wk Soil Moisture Forecasthttp://www.cpc.ncep.noaa.gov/soilmst/cas.shtml

Constructed Analog Soil Moisture USAConstructed Analog Soil Moisture USA
http://www.cpc.ncep.noaa.gov/soilmst/cas.shtml
Observed
Forecast

NCDC Drought Amelioration ProbabilitiesNCDC Drought Amelioration Probabilities

How Are We Doing?How Are We Doing?

How Did We Do With the Western Drought?How Did We Do With the Western Drought?
Too cautiousin September!
Finally gotit right in Dec!

Time Series of Verification ScoresTime Series of Verification Scores
Drought Outlook Verification Score
0
10
20
30
40
50
60
70
80
90
100
Jul'03
Sep'03
Nov'03
Jan'04
Mar'04
May'04
Jul'04
Sep'04
Nov'04
Jan'05
Mar'05
Date of Forecast
Pe
rce
nt
of
Are
a C
orr
ec
t
Percent of Area Correct Persistence Score MEAN SCORE MEAN Persistence
Mean Pct Correct 59%Mean Persistence Score 45%

Selected Future ImprovementsSelected Future Improvements
• Better seasonal temp/precip forecasts thanks to Better seasonal temp/precip forecasts thanks to new consolidation toolnew consolidation tool
• Better seasonal soil moisture forecasts from Better seasonal soil moisture forecasts from NLDAS projects (Univ. of WA, Princeton, NCEP)NLDAS projects (Univ. of WA, Princeton, NCEP)
• Research leading to improved understanding of Research leading to improved understanding of the underlying causes of drought (e.g., air-sea and the underlying causes of drought (e.g., air-sea and ground-air interactions)ground-air interactions)

Parting WisdomParting Wisdom
• ““If you’re going to predict, predict often. If you’re going to predict, predict often. As long as you keep updating your As long as you keep updating your prediction, people forget your last prediction, people forget your last prediction.”prediction.”
Milton FriedmanMilton Friedman