u.s and india follow the next share after china in the chemical intermediates market growth
DESCRIPTION
Chemical intermediate is an essential element for the production of basic everyday requirements such as textiles, soaps, polyvinyl chloride (PVC) and other plastics. These intermediate chemicals exist in all forms, for example- Caustic Soda is a solid , Ethylene Dichloride is a Solvent, and Vinyl Chloride Monomer is in Gaseous state. The basic reasons for the consistent increase in usage of chemical intermediate is growth in industries like petrochemicals, organic, inorganic, dyes, paints, agrochemicals, pharmaceuticals etc.TRANSCRIPT

IndustryARC
GLOBAL CHEMICAL INTERMEDIATES MARKET
(2014 – 2020)
By Type (Reagents, Solvents, Building blocks, Protective groups and others,); By
application (Pharmaceutical, Petrochemical, Lubricants, Agriculture, and others), By
Form and By Geography

Table of Contents
1. Chemical Intermediates– Market Overview
2. Executive Summary
3. Chemical Intermediates-Market Landscape
3.1. Market Share Analysis
3.2. Comparative Analysis
3.2.1. Product Benchmarking
3.2.2. End user profiling
3.2.3. Top 5 Financials Analysis
4. Chemical Intermediates – Market Forces
4.1. Market Drivers
4.2. Market Constraints
4.3. Market Challenges
4.4. Attractiveness of the Chemical Intermediates Industry
4.4.1. Power of Suppliers
4.4.2. Power of Customers
4.4.3. Threat of New entrants
4.4.4. Threat of Substitution
4.4.5. Degree of Competition
5. Chemical Intermediates – Strategic Analysis
5.1. Value Chain Analysis
5.2. Pricing Analysis
5.3. Opportunities Analysis
5.4. Product/Market Life Cycle Analysis
5.5. Suppliers and Distributors

6. Chemical Intermediate Market- By Types
6.1 Reagents
6.2 Solvents
6.3 Building Blocks
6.4 Protective groups
6.5 Others
7. Chemical Intermediates Market – By Application
7.1 Pharmaceutical
7.2 Petrochemical
7.3 Agriculture
7.4 Construction
7.5 Waste recyclers for their industrial operations
7.6 Plastics
7.8 Lubricants
7.9 Coatings
7.10 Personal care emollients
7.11 Additive
7.12. Others (Emulsifiers, Plasticizers, Silicon compounds)
8. Chemical intermediate Market- by Form
8.1. Solid
8.2. Liquid (Solvents, alcohols, etc.)
8.3. Gaseous (Monomers, etc.)
9. Chemical Intermediates market- By Geography
9.1 Introduction
9.2 Americas

9.2.1 North America
9.2.2 Brazil
9.2.3 Argentina
9.2.4 Mexico
9.2.5 Others
9.3 Europe
9.3.1 U.K.
9.3.2 France
9.3.3 Germany
9.3.4 Italy
9.3.5 Others
9.4 APAC
9.4.1 China
9.4.2 India
9.4.3 Japan
9.4.4 Australia
9.4.5 Others
9.5 ROW
10. Market Entropy
10.1. New Product Launches
10.2. M&As, Collaborations, JVs and Partnerships
11. Company Profile
12.1 The Dow chemical Company
12.2 BASF SE
12.3 Saudi Basic Industries Corporation (SABIC)
12.4 Stepan company
12.5 DSM Pharmaceuticals, Inc
12.6 INVISTA
12.7 INEOS Group Limited
12.8 Evonik Industries
12.9 Akzo Nobel N.V.
12.10 China Petrochemical Corporation (Sinopec)
12.11 SI Group
12.12 ABR Organic ltd.
12.13 Bodal Chemical ltd.
12.14 Ambuja Intermediates ltd.
12.15 Exxon Mobil Corporation
12.16 Amines & Plasticizers Limited (APL)
12.17 American Pacific (AMPAC)
12.18 Aceto chem private limited.
12. Appendix
12.1.Abbreviations
12.2.Sources
12.3.Research Methodology
12.4.Bibliography
12.5.Compilation of Expert Insights
12.6.Disclaimer

LIST OF TABLES Table 1 Global Chemical intermediates Market Pricing Analysis, By Type ($)
Table 2 Global Chemical intermediate Market Revenue, By Type, 2014-2020 ($M)
Table 3 Global Chemical intermediate Market Volume, By Type, 2014-2020 (Kilo Tons)
Table 4 Global Chemical intermediate Market Revenue, By Application, 2014-2020 ($M)
Table 5 Global Chemical intermediate Market Volume, By Application, 2014-2020 (Kilo Tons)
Table 6 Global Chemical intermediate Market Revenue, By Existence, 2014-2020($M)
Table 7 Global Chemical intermediate Market Revenue, By Existence, 2014-2020(kilo Tons)
Table 8 Global Chemical intermediate Market Revenue, By Geography, 2014-2020 ($M)
Table 9 Global Chemical intermediate Market Volume, By Geography, 2014-2020 (Kilo Tons)
Table 10 Global Reagent Market Revenue, By Application, 2014-2020 ($M)
Table 11 Global Reagent market Volume, By Application, 2014-2020 (Kilo Tons)
Table 12 Global Solvent market By Application, 2014-2020 ($M)
Table 13 Global Solvent Market Volume, By Application, 2014-2020 (Kilo Tons)
Table 14 Global Building blocks Revenue, By Application, 2014-2020 ($M)
Table 15 Global Building blocks Market Volume, By Application, 2014-2020 (Kilo Tons)
Table 16 Global Protective Groups Market Revenue, By Application, 2014-2020 ($M)
Table 17 Global Other Chemical intermediate Market Revenue, By Application, 2014-2020
($M)
Table 18 Global Other Chemical intermediate Market Volume, By Application, 2014-2020
(Kilo Tons)
Table 19 Americas Chemical intermediate Market Revenue, By Type, 2014-2020 ($M)
Table 20 Americas Chemical intermediate Market Volume, By Type, 2014-2020 (Kilo Tons)
Table 21 Americas Chemical intermediate Market Revenue, By Application, 2014-2020 ($M)
Table 22 Americas Chemical intermediate Market Volume, By Application, 2014-2020 (Kilo
Tons)
Table 23 Americas Chemical intermediate Market Revenue, By Country, 2014-2020 ($M)
Table 24 Americas Chemical intermediate Market Volume, By Country, 2014-2020 (Kilo Tons)
Table 25 APAC Chemical intermediate Market Revenue, By Type, 2014-2020 ($M)
Table 26 APAC Chemical intermediate Market Volume, By Type, 2014-2020 (Kilo Tons)
Table 27 APAC Chemical intermediate Market Revenue, By Application, 2014-2020 ($M)
Table 28 APAC Chemical intermediate Market Volume, By Application, 2014-2020 (Kilo Tons)
Table 29 APAC Chemical intermediate Market Revenue, By Country, 2014-2020 ($M)
Table 30 APAC Chemical intermediate Market Volume, By Country, 2014-2020 (Kilo Tons)

Table 31 Europe Chemical intermediate Market Revenue, By Type, 2014-2020 ($M)
Table 32 Europe Chemical intermediate Market Volume, By Type, 2014-2020 (Kilo Tons)
Table 33 Europe Chemical intermediate Market Revenue, By Application, 2014-2020 ($M)
Table 34 Europe Chemical intermediate Market Volume, By Application, 2014-2020 (Kilo
Tons)
Table 35 Europe Chemical intermediate Market Revenue, By Country, 2014-2020 ($M)
Table 36 Europe Chemical intermediate Market Volume, By Country, 2014-2020 (Kilo Tons)
Table 37 RoW Chemical intermediate Market Revenue, By Type, 2014-2020 ($M)
Table 38 RoW Chemical intermediate Market Volume, By Type, 2014-2020 (Kilo Tons)
Table 39 RoW Chemical intermediate Market Revenue, By Application, 2014-2020 ($M)
Table 40 RoW Chemical intermediate Market Volume, By Application, 2014-2020 (Kilo Tons)
Table 41 RoW Chemical intermediate Revenue, By Country, 2014-2020 ($M)
Table 42 RoW Chemical intermediate Market Volume, By Country, 2014-2020 (Kilo Tons)
Table 43 Global Reagents market revenue , By Geography, 2014-2020 ($M)
Table 44 Global Reagents Market Volume, By Geography, 2014-2020 (Kilo Tons)
Table 45 Global Solvent Market Revenue, By Geography, 2014-2020 ($M)
Table 46 Global Solvent Market Volume, By Geography, 2014-2020 (Kilo Tons)
Table 47 Global Building blocks Market Revenue, By Geography, 2014-2020 ($M)
Table 48 Global Building blocks Market Volume, By Geography, 2014-2020 (Kilo Tons)
Table 49 Global Protective group Market Revenue, By Geography, 2014-2020 ($M)
Table 50 Global Protective group Market Volume, By Geography, 2014-2020 (Kilo Tons)
Table 51 M&A, Product Launches, 2010-2015

LIST OF FIGURES Figure 1 Global chemical intermediate Market, By Geography, 2014 - 2020 ($M)
Figure 2 Segmentation of Global chemical intermediate Market
Figure 3 Global Industrial chemical intermediate Competitive Share Analysis, 2014(%)
Figure 4 Global Industrial chemical intermediate, By Type, 2014 (%)
Figure 5 Global Industrial chemical intermediate, By Application, 2014 (%)
Figure 6 Global Industrial chemical intermediate Market Share, By Geography, 2014 (%)
Figure 7 Americas Industrial chemical intermediate Market Share, By Country, 2014 (%)
Figure 8 Europe Industrial chemical intermediate Market Share, By Country, 2014 (%)
Figure 9 APAC Industrial chemical intermediate Market Share, By Country, 2014 (%)
Figure 10 RoW Industrial chemical intermediate Market Share, By Country, 2014 (%)
Figure 11 Global Industrial chemical intermediate Market Recent Developments, By Year, 2012-
2015

REPORT SCOPE
Chemical intermediates are generally produced through synthetic process to generate a desirable
product such as reagent, solvent, building blocks, protective group and some others, which are
actively used.in further reactions. Industries like pharmaceuticals, petrochemical, organic, agro
chemical; textiles etc. are the key users of these intermediates.
Chemical intermediates are a vital constituent of the petrochemical industry which holds a huge
scope if the quality and supply is taken care of. Along with it, it is highly applicable in
pharmaceuticals, lubricants, coatings, special additives, mining, personal care emollients,
thermoplastics etc. and some are used for nylon, spandex and polyester production. The report
study includes the demand of this particular market on a global and regional scale for a six-year
period of 2014-2020, both in terms of volume (kilo tons) and revenue ($ million).
This report gives detailed information about the product value chain right from the raw materials
i.e. the chemicals used for reaction to the final chemical intermediate produced and its
applications. The market is evaluated based on the key attributes such as the power in the hands
of producers and consumers, analysis on the degree of competition, and threats from substitutes
and new entrants.
The Report also include a detailed study of chemical intermediate types such as reagents,
solvents, building blocks, protective groups and others.The report gives a profound data about
the company overview, financial overview, business strategies, SWOT analysis and recent
developments of some of the major manufacturers of chemical intermediates like The Dow
Chemical Company, BASF India Ltd, INVISTA, INEOS, Ambuja Intermediates Limited, Saudi
Basic Industries Corporation (SABIC) etc..
Stakeholders The following are the key stakeholders in the Chemical intermediates:
Manufacturers
Pharmaceutical industry
Distributors
Regulatory Institution
R & D Departments
End user industries
Raw material suppliers

EXECUTIVE SUMMARY
Chemical intermediate is an essential element for the production of basic everyday requirements
such as textiles, soaps, polyvinyl chloride (PVC) and other plastics. These intermediate chemicals
exist in all forms, for example- Caustic Soda is a solid , Ethylene Dichloride is a Solvent, and
Vinyl Chloride Monomer is in Gaseous state. The basic reasons for the consistent increase in
usage of chemical intermediate is growth in industries like petrochemicals, organic, inorganic,
dyes, paints, agrochemicals, pharmaceuticals etc.
Chemical intermediate is highly admissible in Petrochemical industry. Mono-ethylene glycol is a
major form of glycol used in this industry which crossed a market size of $1.22 million by 2013
and is expected to grow constantly for the next 5 years. Some major companies producing
mono-ethylene glycol are RIL, IPCL, India Glycols limited etc. Linear Alkyl benzene is also an
important type of chemical intermediate having a market size of around $180.33 million in 2013
globally and it is constantly growing.
Sample Table: Chemical Intermediate Market Revenue, By Product Type,
2014-2020 ($M)
Product Type 2014 2015 2016 2017 2018 2019 2020 CAGR (2015 - 2020) %
Reagents xx xx xx xx xx xx xx xx%
Solvents xx xx xx xx xx xx xx xx%
Building blocks xx xx xx xx xx xx xx xx%
Protective Groups xx xx xx xx xx xx xx xx%
Others xx xx xx xx xx xx xx xx%
Total xx xx xx xx xx xx xx xx%
Source: IndustryARC Analysis, Expert Insights
The above table shows the types of chemical intermediates and its revenue contribution. They
are generally classified as reagents, solvents, building blocks, protective groups and others. The
use of Mono-ethylene glycol, a type of solvent is expected to exhibit a growth of 14% in the
production of basic petrochemicals and downstream petro based products for the next 5 years.

SAMPLE TABLE: Global Mono-ethylene Glycol consumption, by country in
the year 2014 (%)
Source: IndustryARC Analysis, Expert Insights
These are some of the major countries contributing to the world consumption of Mono-ethylene
Glycol. This graphs clearly shows that china is a major user of chemical intermediates, followed
by US and India.
China
US
India
Western Europe
Japan
Taiwan
Mexico
Central Europe
Others

KEY MARKET INSIGHTS
Demand in pharmaceutical and petrochemical industry is the major key driver for
chemical intermediate.
BASF has forethought to increase the production of 1,4-butanediol (BDO) chemical
intermediate by 10% at its Geismar manufacturing facility in Louisiana, US.
Among whole chemical intermediate market, lactic acid and mono-ethylene glycol are
the major intermediate which accounts 40% share of the global chemical intermediate
capacity and is equivalent to approx. 2.94 million metric tons.
Intermediates and polymers are expected to dominate the chemical intermediate market
by 2018.
Production of chemical intermediate between 2014 and 2018 is expected to yield 11%
CAGR.
RESEARCH METHODOLOGY
The quantitative and qualitative data collected for the chemical intermediate market report is
from a combination of secondary and primary sources. Research interviews were conducted with
senior executives and/or managers of leading gear oil solution providers. These Key Opinion
Leaders (KOLs) were then provided a questionnaire to gather quantitative and qualitative inputs
on their operations, performance, strategies and views on the overall market, including key
developments and technology trends. Data from interviews is consolidated, checked for
consistency and accuracy, and the final market numbers are again validated by experts. The
global market was split by products, application and geography based on different factors like
primary and secondary sources, understanding of the number of companies operating in each
segment and also KOL insights.
We have used various secondary sources such as directories, articles, white papers, newsletters,
annual reports and paid databases such as OneSource, Hoovers and Factiva to identify and
collect information for extensive technical and commercial study of the industrial gear oil
market.
The key players in the market and its value chain were identified through secondary research and
their market opinions were also gathered in a similar way through telephonic interviews and
questionnaires. We have also studied the annual reports of these top market players. Interviews
with key opinion leaders such as directors, managers, and marketing personnel were used
extensively in understanding the need and emergence of the chemical intermediate
The following secondary sources were also used in the production of report and in triangulation
of data points.
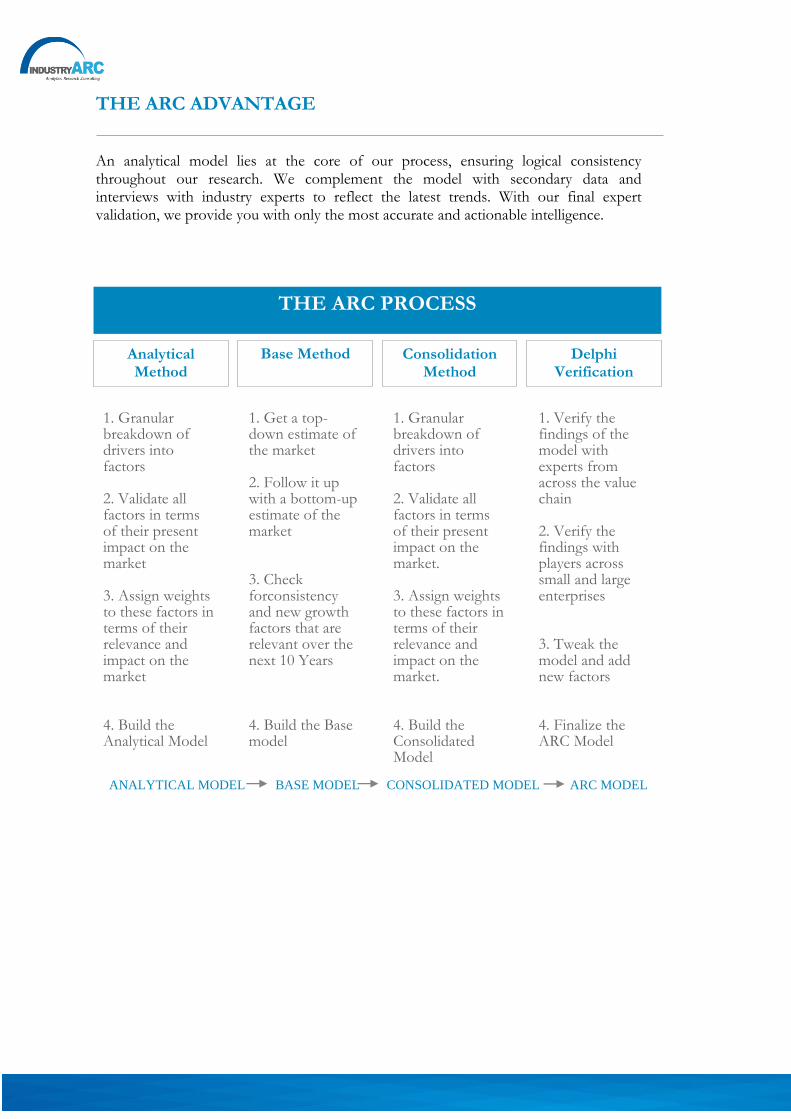
THE ARC ADVANTAGE
An analytical model lies at the core of our process, ensuring logical consistency throughout our research. We complement the model with secondary data and interviews with industry experts to reflect the latest trends. With our final expert validation, we provide you with only the most accurate and actionable intelligence.
THE ARC PROCESS
ANALYTICAL MODEL BASE MODEL CONSOLIDATED MODEL ARC MODEL
Analytical Method
Base Method Consolidation Method
Delphi Verification
1. Granular breakdown of drivers into factors 2. Validate all factors in terms of their present impact on the market 3. Assign weights to these factors in terms of their relevance and impact on the market 4. Build the Analytical Model
1. Get a top-down estimate of the market 2. Follow it up with a bottom-up estimate of the market 3. Check forconsistency and new growth factors that are relevant over the next 10 Years 4. Build the Base model
1. Granular breakdown of drivers into factors 2. Validate all factors in terms of their present impact on the market. 3. Assign weights to these factors in terms of their relevance and impact on the market. 4. Build the Consolidated Model
1. Verify the findings of the model with experts from across the value chain 2. Verify the findings with players across small and large enterprises 3. Tweak the model and add new factors 4. Finalize the ARC Model

ABOUT US
IndustryARC was started by a group of young, passionate professionals along with
extensively experienced industry veterans across various business segments. Our focus and
expertise is mainly in the field of analytics, market research and consulting. Our singular
goal is to provide accurate and affordable research to our clients.
Our research team has expertise in diverse fields like Automotive, Chemicals,Consumer
Product & Services, Electronics, Food & Beverages, Healthcare etc., However diverse the
expertise maybe, everyone in our team shares one common trait - we love data and we love
providing solutions to clients using that data even more! Seeing your business flourish
based on our solutions and strategy is what we love the most!
IndustryARC publishes more than 30 reports on an annual basis in the mentioned
Industries. Our reports are in-depth and high quality reports that can help decision makers
frame better strategies for their business requirements. These reports can be further
customized as per your needs.
Disclaimer:
The reports sold by IndustryARC are limited publications containing valuable
market information provided to a select group of customers in response to orders.
Our customers acknowledge and agree that any report bought from IndustryARC is
for their own internal use and not for general publication or disclosure to third
parties.
Our reports or part of the reports, information contained in the report, cannot be
shared or resold to any other third party.
Disclosure to third parties, usage of data in a public document, article or blog by the
customer can be done with prior permission taken from IndustryARC.
For information regarding permissions and sales, contact:

Copyright ©2014 IndustryARC All Rights Reserved. This document contains highly confidential information and is the sole property of IndustryARC. No part of it may be circulated, copied, quoted, or otherwise reproduced without the approval of IndustryARC.
IndustryARC
+1 614 - 588 - 8538