urea clearance tests - jcp.bmj.com · urine urea concentrations show the same corre-lation with the...
TRANSCRIPT

J. clin. Path. (1949), 2, 266.
UREA CLEARANCE TESTSBY
H. FAIRFIELD SMITHFrom the Rubber Research Instititute of Malaya, Kuala Lumiipur
(RECEIVED FOR PUBLICATION, JUNE 13, 1949)
CONTENTS
Introduction ... ... ... ... ... 266
1. The Van Slyke Urea Clearance Test ... 266
II. Observations on Prisoners of War in Siam 266
111. Comparison of Average Urea Concentra-. tions .. ... ... ... ... 268
This paper has its origin in work done in aprisoner of war hospital camp in Siam. Underthe prevailing condition of protein-starvation therethe Van Slyke formulae for calculating urea clear-ance as a percentage of normal were found to becompletely misleading. The only literature thenavailable was a handbook of laboratory methodsgiving the bare routine of the test without indicat-ing the source of factors in the formulae. There-fore an attempt was made to devise our ownstandards, including adjustment for the rate oftirine excretion. When eventually I was able toobtain copies of the principal papers by Van Slykeand his colleagues (Austin et al., 1921 ; McIntoshet al., 1928; Moller et al., 1928) it seemed ofinterest to compare our results with theirs.The initial objective was to see if the method
of adjustment for the rate of urine excretion usedin Siam, or a modification of it, might provide asingle generally applicable formula by which pro-cedure could be both simplified and unified inplace of the two in current use. This objectivewas achieved (see appendix), but in the course ofthe work I found myself forced to the conclusionthat the Van Slyke urea clearance test is useless inits present form.
I. The Van Slyke Urea Clearance TestThe Van Slyke urea clearance test is the ratio of
the amount of urea excreted per minute in urine to theconcentration of urea in blood compared with theratios observed in a sample of laboratory workersand since accepted in the textbooks as normal.
IV. Discussion of the Van Slyke Test ... ... 268
V. Methods of Deriving Efficient DiagnosticCriteria ... ... .. 269
VI. Summary
Appendix
... ... ... ... ... 271
... ... ... ... ... 272
Depending on the rate of urine excretion it is com-puted by one or other of two formulae.
C.=U-VV/B when V is less than about 2 (1).Cm=UVlB when V is greater than about 2 (2).
where V =volume of urine excreted in ml. perminute.U=concentration of urea in urine in mg. N per
ml.B=concentration of urea in blood in mg. N per
ml.(Different units have been used at different times in
the literature, but those quoted will be adhered tothroughout this paper.)
C. is called the "standard urea clearance at a urineexcretion rate of 1 ml. per minute."Cm is the " maximum clearance rate " observed at
high rates of urine excretion.The adjustment for the rate of urine excretion
derives from the observation that the amount of ureaexcreted (UV) is approximately proportional to %/Vwhen V is less than about 2 ml. per minute, and isconstant when V is greater than that. The acceptednormals are C.= 54 with a range from 34 to 75; Cm=75 with a range from 52 to 98. Observations outsidethese limits are supposed to indicate renal abnormali-ties.
II. Observations on Prisoners of War in SiamThe chemical aspects of the work in Siam and
the conditions under which it was done have beendescribed by Wilshaw (1947). Data are availablefor 65 men. Of these, 15, termed " normals," wereobserved as a check on what at first seemed theabnormal results being obtained for diagnosticpurposes. The other 50, " patients," were men
I
..4F
copyright. on 15 M
arch 2019 by guest. Protected by
http://jcp.bmj.com
/J C
lin Pathol: first published as 10.1136/jcp.2.4.266 on 1 N
ovember 1949. D
ownloaded from

UREA CLEARANCE TESTS
sent by medical officers for observation. Avail-able laboratory notes give clinical comments foronly three cases. The case with the lowest bloodurea level is recorded as one of renal colic fortwo years, and a case in the centre as renal colicfor two years, the left kidney being palpable.The case with the highest blood urea level hadblackwater fever; this man was observed again,five weeks later giving the point at y= 0.1,u= - 0.71. The majority of patients were sent for aprecautionary test of renal efficiency before opera-tion for removal of a kidney containing stones,but were not expected to be renally deficient.For each man we observed the volume of, and
concentration of, urea nitrogen in the urineexcreted during each of two successive hours, 10to 11 and 11 to 12 a.m. (by sun time 8 to 10 a.m.)after a breakfast of rice and weak tea at 8 a.m.(6 a.m. sun time). Only one sample of blood wastaken, about the middle of the two-hour period.The precise amounts of protein in the diets
are unknown to me, but were very low. Harvey(1946) quotes diets for a Singapore camp contain-ing 25 to 86 g. protein per day; amounts inSiam were roughly similar, but in this particularcamp probably did not sink to the lowest limitrecorded at Singapore. There was undoubtedlya good deal of variation. The group of normalsincluded some cooks who could never refrain fromhelping themselves to extra; some patients re-ceived supplementary diets; some men onlybought eggs with their available funds, and othersspent it all on tobacco; workers had more tospend than patients. (At that time an egg cost25 setangs. Men working for the Japanesereceived 25 setangs a day, camp workers 10 setangs,but non-working patients officially got nothing.)
Despite ersatz laboratory conditions the obser-vations are of the same order of accuracy as thoseof previously published work. (The variance ofdeviations of log U from its regression on V andB was, for the normal group, 0.00263 comparedwith a corresponding figure for the data ofMcIntosh et al. of 0.00243, or 0.00174 if dayson which urea was administered are omitted.Logarithms show variability proportional to themagnitude of the variate. Since the observationsrecorded here are on lower concentrations, obser-vations in units of mg. per ml. would appearmore accurate.
Urine urea concentrations show the same corre-lation with the volume of urine as was observedby Van Slyke et al. This can be described by aquadratic regression between the logarithms.Using this the urine urea concentration at any
given rate of excretion can be estimated withoutarbitrarily dividing the data into two parts as withVan Slyke's method of adjustment. (For normalconditions, not stimulated by drinking variablequantities of water, as in the cases of the prisonersor the children, Table I, a linear equation maybe sufficiently accurate.) Using the regressionevaluated for the patients the log urine-urea-concentration for each man has been calculated as
y=y+0.49 (v -0.174)+0.25 (v- 0.146)where y, v, and v2 are the averages of -the twoobservations per man of log U, log V, and (logV)2 respectively; 0.174 and 0.146 are the overallaverages of v and v2 for the 50 patients. Theeffect is to adjust for the rate of urine excretionto the point where greatest average accuracy isobtained, namely at v, =0.223 (V=1.67 ml. perminute).
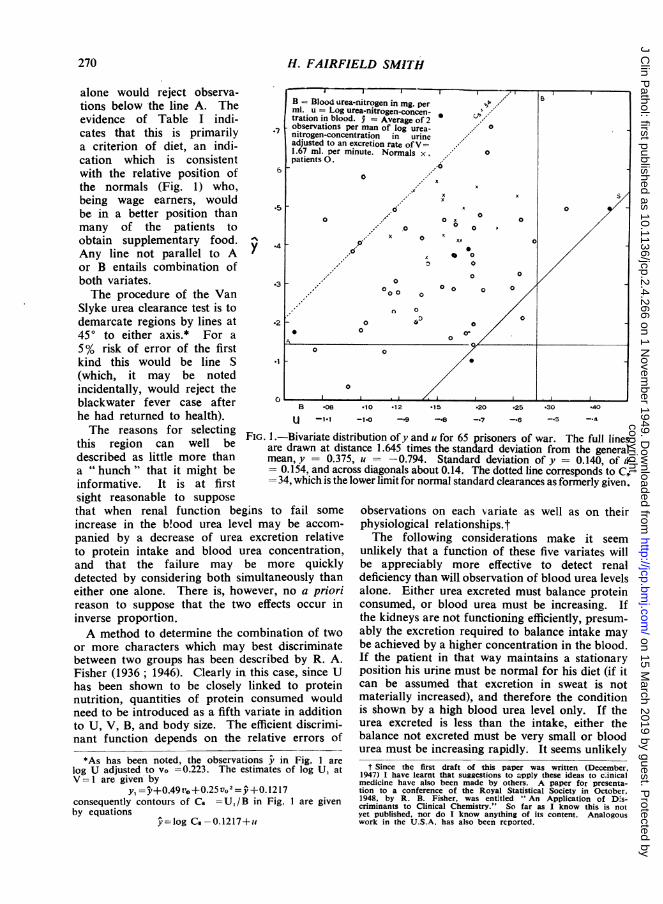
Since there was only one blood urea observa-tion per man the internal correlation of V and Bcannot be evaluated. Fig. 1 shows the bivariatedistribution of y (=log U at V=1.67) and u(=log B). Obviously in these data there is nocorrelation of urine and blood urea levels betweenindividuals.The frequency distribution of observations of
CS is:cg Cs 0.9 1.0 1.1 1.2 1.3 1.4 1.5 1.6 1.7
Co 7.9 10.0 12.6 15.8 20.0 25.1 31.6 39.8 50.1Frequency )between 3 8 8 14 16 8 5 3above values IIf there were among the patients a group ofrenal defectives, and if the clearance ratio coulddetect these, we could reasonably expect a minormode, or at least a longer tail, in the lower partof the range. These observations indicate a sym-metrical distribution such as would be shown bya homogeneous group. On an arithmetic scalethe tail would be at the upper instead of at thelower end.Our records from Siam show some 45 additional
observations on blood urea levels only, often withrepetitions. Some of these gave very high values(particularly one just before death), but as theydo not show anything unusual they need not bereported in detail. It is to be noted only thatthose exceeding 0.24 mg. urea-N per ml. didcorrelate closely with clinical observations.Although the evidence is incomplete there seemslittle doubt that patients represented in Fig. 1,with the possible exception of the one at B =0.34,were renally efficient. In the subsequent discus-sion they will be regarded as a sample of renallynormal men; the argument will not be impairedif a few were in fact diseased.
267
copyright. on 15 M
arch 2019 by guest. Protected by
http://jcp.bmj.com
/J C
lin Pathol: first published as 10.1136/jcp.2.4.266 on 1 N
ovember 1949. D
ownloaded from
H. FAIRFIELD SMITH
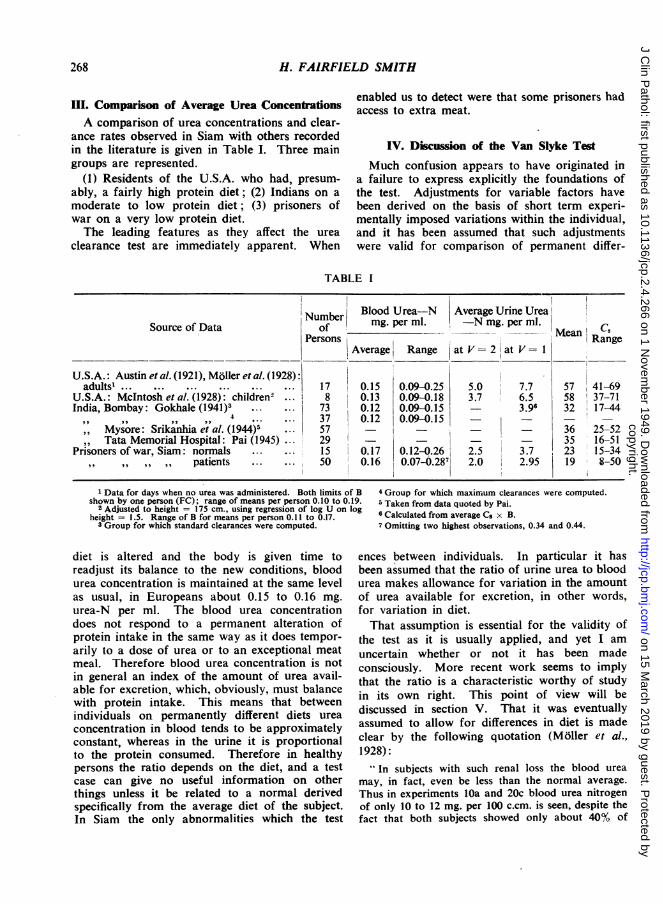
III. Comparison of Average Urea ConcentrationsA comparison of urea concentrations and clear-
ance rates observed in Siam with others recordedin the literature is given in Table I. Three maingroups are represented.
(1) Residents of the U.S.A. who had, presum-ably, a fairly high protein diet; (2) Indians on amoderate to low protein diet; (3) prisoners ofwar on a very low protein diet.The leading features as they affect the urea
clearance test are immediately apparent. When
enabled us to detect were that some prisoners hadaccess to extra meat.
IV. Discussion of the Van Slyke Test
Much confusion appears to have originated ina failure to express explicitly the foundations ofthe test. Adjustments for variable factors havebeen derived on the basis of short term experi-mentally imposed variations within the individual,and it has been assumed that such adjustmentswere valid for comparison of permanent differ-
BLE I
XNmber Blood Urea-N Average Urine UreaSource of Data umof mg. per ml. -N mg. per ml. CMean CPersons Average'iRange Range
Average Range |at V = 2 at V = I
U.S.A.: Austin et al. (1921), Moller et al. (1928):adults'. 17 0.15 0.09-0.25 5.0 7.7 57 41-69
U.S.A.: McIntosh et al. (1928): children2 ... 8 0.13 0.09-0.18 3.7 6.5 58 37-71India, Bombay: Gokhale (1941)3 ...1 73 0.12 0.09-0.15 3.96 32 17-44
4,,,,,, ,, 4 *-- *-- ~~37 0.12 0.09-0.15Mysore: Srikanhia et al. (1944)5 .0157 0 36 25-52Tata Memorial Hospital: Pai (1945) 29 - - 35 16-51
Prisoners of war, Siam: normals .15 0.17 0.12-0.26 2.5 3.7 23 15-34patients .50 0.16 0.07-0.287 2.0 2.95 19 8-50
1 Data for days when no urea was administered. Both limits ofshown by one person (FC); range of means per person 0.10 to 0.1'
2 Adjusted to height = 175 cm., using regression of log U on lcheight = 1.5. Range of B for means per person 0.11 to 0.17.
3 Group for which standard clearances were computed.
diet is altered and the body is given time toreadjust its balance to the new conditions, bloodurea concentration is maintained at the same levelas usual, in Europeans about 0.15 to 0.16 mg.urea-N per ml. The blood urea concentrationdoes not respond to a permanent alteration ofprotein intake in the same way as it does tempor-arily to a dose of urea or to an exceptional meatmeal. Therefore blood urea concentration is notin general an index of the amount of urea avail-able for excretion, which, obviously, must balancewith protein intake. This means that betweenindividuals on permanently different diets ureaconcentration in blood tends to be approximatelyconstant, whereas in the urine it is proportionalto the protein consumed. Therefore in healthypersons the ratio depends on the diet, and a testcase can give no useful information on otherthings unless it be related to a normal derivedspecifically from the average diet of the subject.In Siam the only abnormalities which the test
B 4 Group for which maximum clearances were computed.9 5 Taken from data quoted by Pai.g 6 Calculated from average Cs x B.
7 Omitting two highest observations, 0.34 and 0.44.
ences between individuals. In particular it hasbeen assumed that the ratio of urine urea to bloodurea makes allowance for variation in the amountof urea available for excretion, in other words,for variation in diet.That assumption is essential for the validity of
the test as it is usually applied, and yet I amuncertain whether or not it has been madeconsciously. More recent work seems to implythat the ratio is a characteristic worthy of studyin its own right. This point of view will bediscussed in section V. That it was eventuallyassumed to allow for differences in diet is madeclear by the following quotation (Moller et al.,1928):
- In subjects with such renal loss the blood ureamay, in fact, even be less than the normal average.Thus in experiments lOa and 20c blood urea nitrogenof only 10 to 12 mg. per 100 c.cm. is seen, despite thefact that both subjects showed only about 40% of
268
copyright. on 15 M
arch 2019 by guest. Protected by
http://jcp.bmj.com
/J C
lin Pathol: first published as 10.1136/jcp.2.4.266 on 1 N
ovember 1949. D
ownloaded from

UREA CLEARANCE TESTS
normal excreting power. Such results indicate theuncertainty attending interpretation of normal bloodurea values in nephritic patients if the urea excretionrate is not also taken into consideration. It has infact been common on our wards to find consistentlynormal blood ureas in nephritic patients who have lost40-60% of their renal function. Such patients arelikely, either by choice or direction, to take diets lowin protein; and if they consume half as much as agiven normal subject, other factors being equal, theywill show about normal blood urea content."
This implies that these men have normal bloodurea only because they are eating little protein,and that a normal man on their diet would havelower blood urea, so that the urine/ blood urearatio would be less affected than the urine ureaconcentration itself. Our observations show thata normal man eating little protein would showprecisely the same urea clearance as these patients.The test cannot differentiate between the two.A review in Nature (Srikanhia and Shamanna,
1945) of the Indian observations commented:" The figures of Gokhale and of Srikanhia and
Shamanna suggest that the Indian kidney has onlyabout two-thirds the efficiency of its Americancounterpart."The remark is typical of numerous others occur-
ring throughout the literature. The urea clearancerate having become established as a measure ofrenal efficiency it has become customary to write,without thought that the measure may be faulty," renal efficiency is low," when what is meant isthat " the ratio of urine urea to blood urea con-centration is low compared with the ratio observedin a small group of Americans." Our data showthat observations of an extremely low urea clear-ance rate (CQ = 10, or 18% of the accepted normal)may have nothing whatever to do with renalinefficiency. The kidneys of all groups recordedin Table I were correctly performing their func-tion of keeping excretion in balance with intakeand so were fully efficient. Differences in theirclearance rates measure only the protein diets ofthe subjects.
V. Methods of Deriving Efficient DiagnosticCriteria
The object of a clinical test is to discriminatebetween conditions of health and disease. Theremust be some criteria to which the results of atest can be referred in order to make a decision.In general there will be no hard and fast linebetween health and disease. In order to have alogical basis for deciding the levels at which
criteria should be set and for knowing just whatsubsequent tests may mean, it is necessary to con-sider the probability of a wrong diagnosis. Thecriteria should depend on some decision as to therelative seriousness of considering a persondiseased when he is in fact healthy, or vice versa.The probability of the former can be assessedwhen the frequency distribution of the observa-tion is known for a normal population similar inall respects to a population to be tested, exceptfor occurrence of abnormalities of the kind beingsought (Neyman's error of the first kind). Theprobability of the reverse will depend on how farthe diseased condition is removed from normality,and consequently can only be assessed for specifieddegrees of abnormality (Neyman's error of thesecond kind).
If only one characteristic is observed theproblem is merely to fix the point on a singlescale where the probabilities of either error arereasonably balanced. But when two or morecharacters are observed we have a choice ofnumerous types of region which may be demar-cated with equal probability of an error of thefirst kind. We have to consider which of theseregions will maximize the power of the test todiscern the abnormality in question.To illustrate: let us assume that the 65 obser-
vations depicted in Fig. 1 form a representativesample of urea concentrations in urine and inblood for renally normal persons in the campwhere they were observed. Suppose we decideto accept a 5 % risk of an error of the first kind,that is of declaring a person abnormal when heis not. The problem is to demarcate a region ofFig. 1 containing 5% of the normal populationin which an abnormal observation is likely to lie.To do this we also require evidence of the region(or regions) in which abnormal observations mayoccur. It has been noted that all the patientsdefinitely diagnosed as renally defective had bloodurea (N) greater than 0.24 mg. per ml. There-fore the only line we can reasonably draw onpresent evidence is the vertical line B. (Thecriterion for its position is that it is 1.6 timesthe standard deviation of u from the general mean,that is at a point estimated to mark off the upper5% of the population on the hypothesis that it isnormally distributed.) On that criterion the testis based on blood urea concentration alone with-out consideration of U (or O). In the absence ofmore comprehensive evidence it is at least areasonable criterion, since a high blood urea levelis undoubtedly direct indication of disease. Acriterion based on the urine urea concentration
269
copyright. on 15 M
arch 2019 by guest. Protected by
http://jcp.bmj.com
/J C
lin Pathol: first published as 10.1136/jcp.2.4.266 on 1 N
ovember 1949. D
ownloaded from
H. FAIRFIELD SMITH
alone would reject observa-tions below the line A. The B Blood urevidence of Table I indi- ration in bloc
7observationscates that this is primarily * nitrogen-conca criterion of diet, an midi-adjue. peracation which is consistent patients 0.with the relative position of 6the normals (Fig. 1) who,being wage earners, wouldbe in a better position than *many of the patients toobtain supplementary food. 4Any line not parallel to A 1or B entails combination ofboth variates. .3The procedure of the Van
Slyke urea clearance test is todemarcate regions by lines at .2450 to either axis.* For a5% risk of error of the first
Ao
kind this would be line S .1(which, it may be notedincidentally, would reject theblackwater fever case after Bhe had returned to health). U -1.1The reasons for selecting FIG. I .-Bivariate dis
this region can well be are drawn at disdescribed as little more than mean, y = 0.3ia " hunch " that it might be 0.154, and aciinformative. It is at first 34, which is thesight reasonable to supposethat when renal function begins to fail someincrease in the bWood urea level may be accom-panied by a decrease of urea excretion relativeto protein intake and blood urea concentration,and that the failure may be more quicklydetected by considering both simultaneously thaneither one alone. There is, however, no a priorireason to suppose that the two effects occur ininverse proportion.A method to determine the combination of two
or more characters which may best discriminatebetween two groups has been described by R. A.Fisher (1936 ; 1946). Clearly in this case, since Uhas been shown to be closely linked to proteinnutrition, quantities of protein consumed wouldneed to be introduced as a fifth variate in additionto U, V, B, and body size. The efficient discrimi-nant function depends on the relative errors of
*10 *12 *15 -20 -25 -30
-1*0 --9 -.8 -.7 -.6 -.5
-.40
stribution ofy and u for 65 prisoners of war. The full linesstance 1.645 times the standard deviation from the general75, u = - 0.794. Standard deviation of y = 0.140, of uross diagonals about 0.14. The dotted line corresponds to C5e lower limit for normal standard clearances as formerly given.
observations on each variate as well as on theirphysiological relationships.tThe following considerations make it seem
unlikely that a function of these five variates willbe appreciably more effective to detect renaldeficiency than will observation of blood urea levelsalone. Either urea excreted must balance proteinconsumed, or blood urea must be increasing. Ifthe kidneys are not functioning efficiently, presum-ably the excretion required to balance intake maybe achieved by a higher concentration in the blood.If the patient in that way maintains a stationaryposition his urine must be normal for his diet (if itcan be assumed that excretion in sweat is notmaterially increased), and therefore the conditionis shown by a high blood urea level only. If theurea excreted is less than the intake, either thebalance not excreted must be very small or bloodurea must be increasing rapidly. It seems unlikely
t Since the first draft of this paper was written (December,1947) I have learnt that suggestions to apply these ideas to cinicalmedicine have also been made by others. A paper for presenta-tion to a conference of the Royal Statistical Society in October,1948, by R. B. Fisher, was entitled " An Application of D.s-criminants to Clinical Chemistry." So far as I know this is notyet published, nor do I know anything of its content. Analogouswork in the U.S.A. has also been reported.
rea-nitrogen in mg. perCurea-nitrogen.concen-lod. 9 = Average of 2per man of log urea-lentration in urinen excretion rate ofVminute. Normals x.
x
x
,o 0 x
0
,, x o xx
,d' ax
0
00 o
n 0
000 ~~~ol0~~~~
0
o
*As has been noted, the observations y in Fig. I arelog U adjusted to vo =0.223. The estimates of log U, atV = 1 are given by
y, 5t+0.49v0+O.25vo2 =+0.1217consequently contours of C8 =U,/B in Fig. 1 are givenby equations
y-log Cs.-0.1217+u
-"
270
copyright. on 15 M
arch 2019 by guest. Protected by
http://jcp.bmj.com
/J C
lin Pathol: first published as 10.1136/jcp.2.4.266 on 1 N
ovember 1949. D
ownloaded from

UREA CLEARANCE TESTS
that determinations of urea in urine may besufficiently accurate to detect the first of theseconditions. In the second no refinement on obser-vation of blood urea alone is likely to be required.Nevertheless the possibilities merit further investi-gation.
Addis proposed observation of the clearance ratiowhen supplementary urea was administered, and thisis the test chiefly considered by Cope (1934). We hadno means in Siam of artificially increasing blood ureaconcentrations and are not in this paper concerned withcircumstances thus created except as they affectinterpretation of the data of Moller et al. Presum-ably diet would not affect the response of normalsubjects to extra urea; and, if it can be shown thatrenally defective individuals react differently, this testmight be of some use when referred to observationson the same individual " at rest " rather than to fixedstandards.Some observations by Van Slyke (1947) suggest that
observation of the slope and curvature of the regres-sion of log U on log V at low urination rates might beinformative. This will, however, be very susceptible todiffering abilities to evacuate more or less completely,and artificial methods might have to be used.A more important defect in the procedure used
to set criteria for the urea clearance test is illus-trated by Fig. 1. The limits accepted as normalwere simply the highest and lowest ratios observedin a casual sample of 18 subjects who seem tohave been mostly workers in the laboratory. Oursample of 15 normals (about the same size ofsample) was drawn in a similar way, being workersnearly all from one hut. Following the same pro-cedure our lower criterion would have been givenby a line through the point D and parallel to S.This would have resulted in classing 27% of ourpatients as renally deficient, which would havebeen manifestly erroneous. The reasonable ex-planation is that workers probably had better foodthan many patients. Analogous differences occurbetween the original laboratory sample of VanSlyke et al. and patients subsequently tested who,being suspected of renal defect, would often havebeen given protein-low diet. The lower criterionderived in that way, and since 1928 accepted asthe dividing line for test purposes, is shown bythe dotted line in Fig. 1. It would condemn 95%of those we observed, including all the normals,as renally defective.The moral is that observations from which a
clinical criterion is to be derived must be properlyrepresentative of the population to which the testis to be applied. Furthermore, in order accuratelyto assess the probability of error the sample mustbe large, say, 500 to 1,000 persons. Confidencelimits derived from the t test of small sample
theory are not satisfactory for setting controllimits (Deming and Birge, 1938). The labourrequired will be small compared to the waste inapplying tests whose reliability is unknown andundefined. It should be noted too that the essentialrequirement is observations on a large number ofpersons, not many observations on a few. Singleobservations per person would serve, but dupli-cates would be preferable to control gross acci-dental errors, and to obtain estimates of samplingvariance within and between persons, say Ve andVp. The error variance of a mean of n observa-tions on one individual is then given by V, -Ve In; and the efficient number of observationsto make in any given circumstances will dependon balancing the cost of n observations againstvalue of consequent accuracy.*
VI. SummaryObservations on prisoners of war in Siam show
that when diet contains little protein the bloodurea concentration is still maintained at normallevels while urea excreted in urine is greatlyreduced, as of course it must be to balance withthe amount of protein consumed. Underlyingthe Van Slyke urea clearance test is the assumptionthat, by observing the ratio of urea in urine to itsconcentration in blood, allowance is made for theeffect of diet on urine urea. That assumption isshown to be false. Consequently the urea clear-ance test as generally used without reference todiet is not a trustworthy measure of "renalefficiency" and may be completely misleading.Men with efficient kidneys were observed to havea " standard urea clearance " as low as 10, or 18%of the accepted normal.The reasoning which led to setting misleading
criteria for this test is discussed. It seems thatobservations on urine urea are unlikely to beof much use in testing for renal efficiency,but the possibilities should be further investigated.Methods for doing so and for deriving efficientcriteria for clinical tests in general are indicated.
The observations on prisoners of war were madein the pathology laboratory of the camp at NakomPatom, Siam, from January to July, 1945, by MajorA. T. H. Marsden, R.A.M.C., pathologist, Malayan
* Mr. B. G. Greenberg, research graduate in medical statistics,Institute of Statistics of the University of North Carolina, whokindly read the first draft of this paper, points out that sequentialtesting might profitably be used in clinical tests. This means thatthe probability of error is assessed after each observation. If thefirst observation indicates reasonable certainty it is accepted asfinal, but if it leaves more than the permissible margin of doubtthen further observations are made until an answer is obtainedat the required confidence level. (The theory is expounded inseveral papers by Barnard and others and in Sequential Analysisof Statistical Data.)
271
copyright. on 15 M
arch 2019 by guest. Protected by
http://jcp.bmj.com
/J C
lin Pathol: first published as 10.1136/jcp.2.4.266 on 1 N
ovember 1949. D
ownloaded from
H. FAIRFIELD SMITH
Medical Service, who was director of the laboratory,and by Major R. G. H. Wilshaw, chemist, Departmentof Agriculture, Malaya. The writer was at the timeworking in the laboratory as a biologist, but has beenconcerned with these data only as a statistician. I amindebted to the observers for putting their ingeniouslyobtained data at my disposal without restriction.
I should like further to record my appreciation ofthe courtesy shown by Professor G. R. Cameron, Dr.H. D. Barnes, and Dr. D. D. Van Slyke in discussingthis work with an interloper led by circumstances offate into a field not his own. Dr. Barnes brought tomy attention the Indian work, which has thereforebeen added since the original draft of this paper, andprovides welcome corroboration of work done underdifficulties which might otherwise have been suspectedof throwing doubt on their freedom from systematicerror.
Dr. Van Slyke has brought to my attention severalother papers on the effect of dietary protein and urinevolume on urea clearance (Cope, 1933; Van Slyke etal., 1934; Farr, 1936; Longley and Miller, 1942;Van Slyke, 1947). It may, however, be helpful to notethat most of them appear to deal with comparativelyshort periods on altered diets and to consider only theratio urine/blood ureas without attempting to followalterations in urine urea and in blood urea separately.It see:rs that an abrupt change of diet rapidly altersblood urea concentration which returns to normalonly gradually, hence the correlation between bloodurea and urine urea noted by Van Slyke, but notshown among the prisoners. The full effect ofaltered diets on the ratio is therefore not apparent inshort-term experiments. There is also a hint, in theobservations of Van Slyke and in those on theprisoners of war, that stimulus from temporarily in-creased blood urea (either by administration of ureaor by blackwater fever) may result in subsequentdepression of blood urea. If so, it adds another reasonfor regarding the orginal data of Van Slyke as un-suitable for determination of criteria to be used in atest without that stimulus. These points requirefurther investigation.
REFERENCESAustin, J. H., Stillman, E., and Van Slyke, D. D. (1921). J. biol.
Chem., 46, 91.Cope, C. L. (1933). J. clin. Invest., 12, 567.- (1934). Lancet, 2, 799.Deming, W. Edwards, and Birge, R. T. (1938). On the theory of
errors. Additional notes, 1938. Foreword to reprint by Grad.School, U.S.D.A.
Farr, L. E. (1936). J. clin. Invest., 15, 703.Fisher, R. A. (1936). Ann. Eugen., 7, 17.--(i946). Statistical Methods for Research Workers. 10th ed.
Oliver and Boyd, Edinburgh.Gokhale, S. K. (1941). Indian J. med. Res., 29, 627.Harvey, C. (1946). Med. J. Aust., 1, 769.Longley, L. P., and Miller, M. (1942). Amer. J. med. Sci., 203, 253.McIntosh, J. F., Moller, E., and Van Slyke, D. D. (1928): J. clin.
In vest., 6, 467.Moller, E., McIntosh, J. F., and Van Slyke, D. D. (1928a). Ibid., 6,
485.--- - (1928b). Ibid., 6, 427.Pai, M. L. (1945). Indian J. med. Res., 33, 259.Smith, H. Fairfield (1936). Ann. Eugen., 7, 240.Srikanhia, C., and Shamanna, D. (1944). Proc. Ind. Acad. Sci., 19,
121.--- (1945). Blood Urea Clearance of Indians, Nature, 155, 54.Van Slyke, D. D. (1947). J. clin. Invest., 26, 1159.
Rhoads, C. P., Hiller, A., and Alving, A. S. (1934). Amer. J.Physiol., 110, 387.
Wilshaw, R. G. H. (1947). Pharm. J., reprinted in Malayan Agric. J.,30, 27.
APPENDIXRelation Between Urea Concentration in Urine,Rate of Urine Excretion, Urea Concentration in
Blood, and Body SizeFrom statistical analysis of the data of Van Slyke
et al., and from observations of the prisoners of war,the following conclusions were reached.The relation of urea concentration in urine (U) to
the rate of urine excretion (V) may be described byan equation of the form
log U=A -log (a+V)or, more empirically, by
log U=a-0.48 log V-0.3 (log V)2Curvature shown by different individuals varies con-
siderably. The constants given are average valueswhich may serve sufficiently well, when the numberof observations on a person are too few to determinehis own characteristic curve, to estimate urine ureaconcentrations for comparison with others. Addingregression on body height, a convenient equation toestimate urine urea concentration (U) at any fixedurination rate (V.) and height (Ho) is
log U=log U+0.48 (log V -log Vo)+0.3 (log5Vlog2VO)-1.5 (log H-log Ho)
where U, V, and H are observed values.
The two curves used by Van Slyke et al. to estimateurine urea concentrations at fixed urination rates area reasonable approximation to the actual curve, butthe consequent partitioning of data into two partswhen such estimates are required is a nuisance andinefficient. Their " augmentation rate " is artificial.It does roughly indicate a point where the curveapproaches close to its asymptote and beyond whichit may be considered to be straight, but it is not asatisfactory statistic for comparison of different curves.The hypothesis of Moller, McIntosh, and Van Slyke
(1928a) that, at a given rate of urination, urine ureaconcentration is proportional to body size appears tobe justified. Their further opinion that no accuracyis gained by trying to estimate surface area fromweight as well as height is also confirmed. Theirprocedure for doing this is, however, circuitous andconfusing. It would simplify computations and showbetter exactly what is being done if adjustment werebased explicitly on height instead of on a supposititiousbody area.When the blood urea level is temporarily increased
by administration of urea or by a heavy meat meal.urine urea is increased nearly but not quite in propor-tion; actually in proportion to about the 0.85th powerof blood concentration. But for variations occurringwith normal diet the relationship appears to be lessclose. Between different persons on variable dietsthere is no appreciable correlation.
272
copyright. on 15 M
arch 2019 by guest. Protected by
http://jcp.bmj.com
/J C
lin Pathol: first published as 10.1136/jcp.2.4.266 on 1 N
ovember 1949. D
ownloaded from