urbanisation effect on the development of urban heat ......urbanisation and industrialisation is the...
TRANSCRIPT

International Journal of Scientific & Engineering Research Volume 8, Issue 9, September-2017 293 ISSN 2229-5518
IJSER © 2017 http://www.ijser.org
Urbanisation Effect on the Occurrence of Urban Heat Island over Kano Metropolis, Nigeria.
Tanko I. A, Suleiman Y. M, Yahaya T. I. and Kasim A. A.
Abstract - The Urban Heat Island (UHI) effect is a phenomenon of higher atmospheric and surface temperatures occurring in urban areas than in surrounding rural areas happening majorly as a result of urbanisation and industrialisation. The effect of urbanisation on the occurrence of UHI in Kano metropolis was investigated. Landsat images of the study area for the years of 1986, 1998, 2006 and 2016 sourced from the archives of the United States Geological Survey (USGS) were utilised in this study. Land Surface Temperature (LST) and Land Use/Land Cover (LULC) maps for the years of 1986, 1996, 2006 and 2016 were estimated using Model Maker in Earth Resource Development Assessment System (ERDAS) Imaging 14 software. The urban city centre exhibit higher surface temperatures compared to its sub-urban counterparts thus, indicating the presence of the Surface UHI over Kano Metropolis. Urbanisation accounted for 80.5% increment in the LST of Kano Metropolis, thus indicating a very strong positive relationship between urbanisation and UHI. Conclusively, urbanisation is identified as the major factor that leads to the occurrence of surface UHI in Kano Metropolis. Recommendations include afforestation programmes, adoption of green and cool roofing technologies, proper spacing between houses, and accommodation of green areas and open spaces and continuous monitoring of weather events.
Index Terms -Urbanisation, Urban Heat Island, Temperature, Atmospheric, Surface, Industrialisation
————————————————————
1 INTRODUCTION
Acatastrophic consequence and implication of
urbanisation and industrialisation is the Urban Heat Island (UHI) effect, which is a phenomenon of higher atmospheric and surface temperatures developing in urban areas when compared to the neighbouring sub-urban areas [1], [2]. Rising temperatures in urban centres usually result in hostile economic and environmental effects in their immediate neighbourhoods, at national levels and even on a global scale. At present, the temperature difference between urban and sub-urban areas are rising to several degrees with special urban, topographical and meteorological conditions [3]. The UHI effect is thus a thermal pollution caused by human activity and regarded as a very influential force in local climate change [4], [5].
Urban areas are observed to be considerably warmer than their surrounding sub-urban areas dominated by vegetation, even though they have equal exposure to solar energy. The reflection of solar energy in urban areas is intensified by the volume of concrete and other man-made materials used for buildings and road construction. These bulk of concrete with their dissimilar topographies act as good traps for sunlight during the day, and slowly
releasing such during the nights as infrared heat, thus producing the UHI phenomenon. Contrariwise, vegetated areas are mostly dominated by trees. It is estimated that a matured tree has a projection area (canopy) of about 50m2[6]. The 50m2 canopy has a high tendency of reducing the penetration of solar radiation. These trees absorb the sunlight and releases energy through long-wave emission more readily [7].
UHI phenomenon is confirmed by numerous studies to have a role in climatic change in most cities and is considered to be one of climatic phenomena that require more scrutiny as part of worldwide struggles to tackle climate change and environmental degradation [8], [9], [10]. This study thus investigated the effect of urbanisation on the occurrence of this UHI phenomenon over Kano Metropolis, a city that has recently been transformed from its traditional outlook and architecture to modern built-up environment characterized with increased heat that is quite alien to its people.
2 STUDY AREA
The study domain is Kano Metropolis, Nigeria, located between latitudes 11°55′N and 12°3′N and longitudes 8°27′E to 8°36′E with an elevation of 472m above sea level. The estimated area of Kano metropolis increased from 122.7km2 in 1962 to 154.6km2 in 1981, an increase of about 25% based on the average expansion rate of 2km2 per annum [11]. Since then, Kano Metropolis has witnessed rapid growth covering 196.4km2 in 1986, and 337.9km2 in 2005. The Metropolis was projected to cover about 499km2 in 2015 [12]. Kano Metropolis is a conurbation of eight Local Government Areas around the main city which includes; Dala, Fagge, Kano Municipal, Nassarawa, Tarauni, Kumbotso, Gwale and Ungogo. It registered a
———————————————— • Tanko I. A. is currently pursuing a masters degree program in Applied
Meteorology at the Federal University of Technology, Minna, Niger State, Nigeria. PH- +2347035892195. E-mail: [email protected]
• Suleiman Y.M and YahayaT.I arePhd degree holders and are currently Senior Lecturers at the Department of Geography, Federal University of Technology, Minna, Niger State.
• Kasim A. A. is a masters degree holder in Remote Sensing and GIS and currently a GIS Expert at Hexagon Geospatial Technology Services Limited, Kano State, Nigeria.
IJSER

International Journal of Scientific & Engineering Research Volume 8, Issue 9, September-2017 294 ISSN 2229-5518
IJSER © 2017 http://www.ijser.org
population of approximately 10 million people in the year 2006 National Population Census [13]. The city is the trade nerve center of West Africa and a major industrial center of Northern Nigeria. The state is bordered by Jigawa State in the north-east, Katsina State in the north-west, Bauchi in the south-east and Kaduna State is on the south-west boundary. The Kano metropolis, being one of the fastest growing cities as well as the country’s centre of commerce was chosen as the target area for this study considering some of its characteristics such as the high rate of urbanisation, concentration of secondary and tertiary economic activities, huge number of vehicle population as well as fuel consumption and combustion, extensive artificial surfaces and low vegetation cover. All these combine to exacerbate the UHI intensity within the city. Figure 1 shows the administrative boundary of Kano state and the Kano metropolis.
Fig. 1: The Study Area (Kano Metropolis, Kano State, Nigeria)
Source: Hexagon Geospatial Technology Services Limited (2017).
3 LITERATURE REVIEW
Urbanisation is the main anthropogenic process accounting for drastic changes in the nature of surface and atmospheric
features of a region. The distinctive biophysical features of the urban areas might be expected to be the main causes which worsen the effects of climate change, making the climate of urban areas to act more strangely [14], resulting in LST differences between urban and sub-urban areas. [15] noted that buildings in urban areas play a vital role in reducing wind speed, thus the combined factors of reducing wind speed and cloud cover aid in making the UHI more pronounced and magnified.
[16]conducted an evaluation of the effect of LULC change on the surface temperature of Lokoja town, Nigeria. The study incorporated remote sensing and GIS in identifying LULC types in Lokoja, including their temporal transformation and association with surface temperatures from the Landsat ETM imageries of 1987 and 2001 respectively. Bands 2, 3 and 4 of the acquired imageries were enhanced using histogram equalisation and rectified to a common Universal Traverse Mercator (UTM0 coordinate system (World Geodetic System 1984 (WGS84)). Other methods such as Digital Number (DN) conversion to radiance, conversion from radiance to reflectance (surface albedo), NDVI formula, emissivity, mean atmospheric temperature and surface temperature were used to analyse the data. The results indicated that; vegetation cover reduced, the built-up area increased in size, and the surface temperature also increased. These changes were responsible for the rise in mean surface temperature from 38.39°C in 1987 to 42.61°C in 2001. The study showed that there have been changing patterns among the various LULC types within the study period. Furthermore, the study suggested that if the rate of decline in vegetation cover is not checked, Lokoja may witness continuous increase in its surface temperature as the cooling effect of vegetation cover will be lost to impervious surfaces that litter the urban site. The author also suggested that policies that will help provide more vegetation cover should be adopted in curbing the effect of UHI on the environment and quality of health of the residents [16].
[17] investigated the application of Landsat - ETM in the study of UHI in Enugu and the work was titled; Assessment of UHI and Possible Adaptations in Enugu Urban using Landsat – ETM. The study employed the Normalised Difference method to estimate LST, and the results showed that LST correlated positively with concentration of urban structures, population density and human activities. Temperature gradients were also observed at the CBD in the downtown areas and progressively lowered to the suburbs. The study further suggested the use of high density green cover, reflective roofing materials and lightening of pavements as
IJSER

International Journal of Scientific & Engineering Research Volume 8, Issue 9, September-2017 295 ISSN 2229-5518
IJSER © 2017 http://www.ijser.org
adaptive/mitigating measures against UHI in Enugu Urban [17].
4 MATERIALS AND METHODS
The investigation of the Surface UHI in the study area was carried out using Earth Resource Development Assessment System (ERDAS) Imaging 14 application software. Land Surface Temperature (LST) Maps for the years 1986, 1998, 2006, and 2016 were estimated using Model Maker in ERDAS Imaging 14 software. In doing these, thermal bands of Landsat 5, 7 and 8 for the years 1986, 1998, 2006 and 2016 were inputted into ERDAS working environment, and the tabular information for gain and bias obtained from the Landsat meta-data file were also inputted. The Digital Numbers (DN) values for each image were converted to radiance, and radiance was also converted to reflectance. Emissivity was also estimated from reflectance, and subsequently the emissivity corrected surface temperature was also derived and this served as part of atmospheric correction.
The formula for estimating the Land Surface Temperature (LST) was then inputted and the final output was the LST map for each of the selected years. The temperature image was then exported as image (.IMG) file and imported into ArcGIS 10.1 software and was re-classified. Thus equations utilised include;
Lλ = Gain × DN + bias (1)
Where: Lλ = the normalised atmospheric reflectance at a particular wavelength, DN = Digital numbers of the Landsat images
Lλ = Grescale × Qcal + Brescale (2)
Where: Lλ = Spectral radiance at the sensor’s aperture [W/ (m2srμm)],Qcal = Quantised calibrated pixel value (DN), Grescale= Band-specific rescaling gain factor [W/ (m2srμm))/DN], Brescale= Band-specific rescaling bias factor [W/ (m2srμm)]
ρλ = π• Lλ•d2 ESUN λ• cosƟs
(3)
Where; ρλ = Planetary TOA reflectance (unitless), π = Mathematical constant approximately equal to 3.14159 (unitless),Lλ = Spectral radiance at the sensor’s aperture [W/ (m2srμm)], d = Earth-sun distance (astronomical units),ESUNλ = Mean exo-atmospheric solar irradiance [W/ m2lam)], Ɵs = Solar zenith angle (degrees)
LST = 𝐾𝐾2
𝐼𝐼𝐼𝐼 (𝐾𝐾1+𝐸𝐸𝐿𝐿𝐿𝐿 +1)
(4)
Where: LST = Land Surface Temperature (Kelvin), K2 = Calibration constant 2 (Kelvin), K1 = Calibration constant 1
[W/ (m2srμm)], Lλ = Spectral radiance at the sensor’s aperture [W/ (m2srμm)], E = Emissivity corrected reflectance, In = Natural Logarithm
4.1 Land Use Land Cover Analysis
This was carried ot using ERDAS 14 imaging software Model Maker. Bands 1, 2, 3, 4, 5 and 7 (for Landsat 5 and 7), and bands 2, 3, 4, 5, 6, and 7 (for Landsat 8) were stacked together to form a single image for each of the years under study. Supervised classification was used to classify the images in order to make terrestrial materials identifiable based on their spectral signatures and characteristics. In this case, the Maximum Likelihood Algorithm was used and is represented as:
P (𝜔𝜔) = ∑ 𝑃𝑃 (𝑀𝑀𝑖𝑖=1 𝜔𝜔/𝑖𝑖) 𝑃𝑃 (𝑖𝑖) (5)
Where: M = Number of classes, P (𝜔𝜔) = Normalisation constant to ensure that ∑ 𝑃𝑃 (𝑀𝑀
𝑖𝑖=1 𝑖𝑖/𝜔𝜔) sums up to 1, 𝑃𝑃 (𝜔𝜔/𝑖𝑖)= Likelihood function, P (i) = Priori information, that is the probability that class ‘i’ occur in the study area.
Afterwards, stacked optical bands were inputted into the ERDAS imaging environment from which the study area was sub-set from the larger scene (image). The study area was then displayed in false colour composite to ease identification and interpretation of terrestrial materials. For Landsat 8, (4, 3, 2 colour combinations were used), while for Landsat 7 and 5 (3, 2, 1 colour combination were used) to ease identification of the terrestrial materials. Next, spectral signature editor window was initiated for collecting the different regions of interest namely; built-up areas, vegetation, water bodies and bare-soil.
Their various files were saved in appropriate locations and the supervised classification window was initiated using the study area image as input image for the classification. The signature files were imported and the Maximum Likelihood Classification Algorithm was selected, and this produced the LULC output images for each of the years under consideration (1986, 1998, 2006 and 2016). The image files were named and opened, after which the attribute table was added and the areal coverage of each region was computed.
4.2 Regression Analysis
A simple linear regression analysis was performed with built-up areas as independent variables and the estimated high LST values as dependent variables in order to assess the effect of urbanisation on the occurrence of the UHI phenomenon in the study area. The regression model is expressed as:
Y = a + bx (6)
IJSER

International Journal of Scientific & Engineering Research Volume 8, Issue 9, September-2017 296 ISSN 2229-5518
IJSER © 2017 http://www.ijser.org
b = (𝑁𝑁∑𝑋𝑋𝑋𝑋−(∑𝑋𝑋)(∑𝑋𝑋))(𝑁𝑁 ∑𝑋𝑋2−(∑𝑋𝑋)2
(7)
a = (∑𝑋𝑋−𝑏𝑏(∑𝑋𝑋))𝑁𝑁
(8)
Where: X and Y are the variables, b = the slope of regression line, a = the intercept point of the regression line and the y axis, N = number of values or elements, Y = second score, ∑𝑋𝑋𝑋𝑋= sum of the product of first and second score, ∑𝑋𝑋= sum of first scores, ∑𝑋𝑋 = sum of second scores, ∑𝑋𝑋2= sum of square of first squares.
5 RESULTS AND DISCUSSION
Figures 2, 3, 4 and 5 shows the LST distribution over Kano Metropolis for the years of 1986, 1998, 2006 and 2016 respectively. The LST maps reveal that surface temperature over Kano Metropolis has gradually been on the increase from 1986 to 2016. Also, the high temperature values are gradually dominating the land cover of the Metropolis and more concentrated in the urban city centre than in the sub-urban city centre.
Fig. 2: LST of Kano Metropolis in 1986
Fig. 3: LST of Kano Metropolis in 1998
Fig. 4: LST of Kano Metropolis in 2006
Fig. 5: LST of Kano Metropolis in 2016
Table 1 indicates the spatio-temporal areal coverage of the different LST classes in Kano Metropolis from 1986 to 2016.
Table 1: Spatio-temporal Distribution of LST in Kano Metropolis (1986-2016) Temperature Range (°C)
1986 (Km2)
1998 (Km2)
2006 (Km2)
2016 (Km2)
Change (Km2)
11 – 15.9 0 0 0.13 0 -0.13 16 – 20.9 0.91 0 1.40 0 -0.91 21 - 25.9 1.37 0 59.91 0.13 -1.24 26 – 30.9 67.08 0.05 76.92 0.16 -66.92 31 - 35.9 431.16 29.53 56.18 7.33 -423.83 36 – 40.9 0.23 426.57 304.30 276.79 276.56 41 – 45.9 0 43.36 1.11 215.67 215.67 TOTAL 499.95 499.95 499.95 499.95 Source: [18]
Figures 6, 7, 8 and 9 shows the LULC distribution over Kano Metropolis for the years of 1986, 1998, 2006 and 2016 respectively. A careful observation into the LST maps indicate that over the years, the proportion of built-up areas
IJSER
International Journal of Scientific & Engineering Research Volume 8, Issue 9, September-2017 297 ISSN 2229-5518
IJSER © 2017 http://www.ijser.org
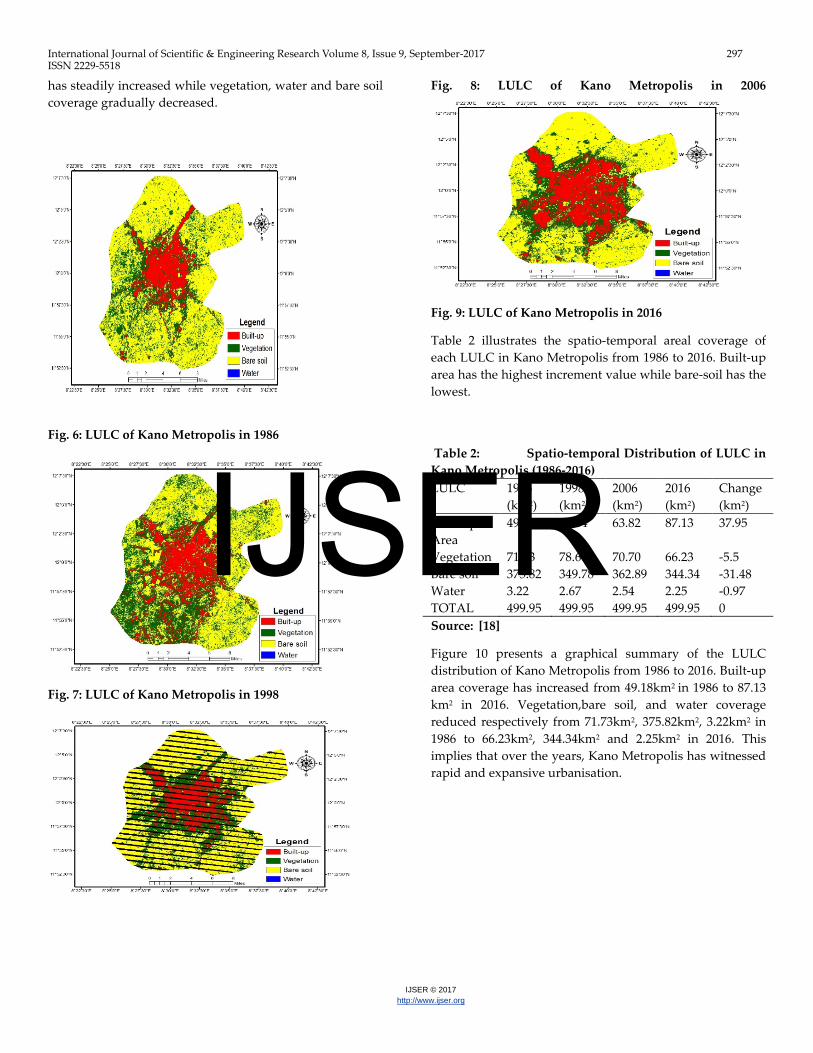
has steadily increased while vegetation, water and bare soil coverage gradually decreased.
Fig. 6: LULC of Kano Metropolis in 1986
Fig. 7: LULC of Kano Metropolis in 1998
Fig. 8: LULC of Kano Metropolis in 2006
Fig. 9: LULC of Kano Metropolis in 2016
Table 2 illustrates the spatio-temporal areal coverage of each LULC in Kano Metropolis from 1986 to 2016. Built-up area has the highest increment value while bare-soil has the lowest.
Table 2: Spatio-temporal Distribution of LULC in Kano Metropolis (1986-2016) LULC 1986
(km2) 1998 (km2)
2006 (km2)
2016 (km2)
Change (km2)
Built-up Area
49.18 68.84 63.82 87.13 37.95
Vegetation 71.73 78.66 70.70 66.23 -5.5 Bare soil 375.82 349.78 362.89 344.34 -31.48 Water 3.22 2.67 2.54 2.25 -0.97 TOTAL 499.95 499.95 499.95 499.95 0 Source: [18]
Figure 10 presents a graphical summary of the LULC distribution of Kano Metropolis from 1986 to 2016. Built-up area coverage has increased from 49.18km2 in 1986 to 87.13 km2 in 2016. Vegetation,bare soil, and water coverage reduced respectively from 71.73km2, 375.82km2, 3.22km2 in 1986 to 66.23km2, 344.34km2 and 2.25km2 in 2016. This implies that over the years, Kano Metropolis has witnessed rapid and expansive urbanisation.
IJSER

International Journal of Scientific & Engineering Research Volume 8, Issue 9, September-2017 298 ISSN 2229-5518
IJSER © 2017 http://www.ijser.org
Fig. 10: Summarised LULC Cover over Kano Metropolis (1986 – 2016)
Table 3 showed the summary of the Simple Linear Regression Model. The coefficient of determination (R-square) was given as 0.805 indicating a strong positive correlation between the built-up areas and the high LST values recorded. This implies that about 80.5% of the high LST is accounted by the changes and development occurring in the built-up areas, while the remaining 19.95% resulted from other factors that have the capacity of instigating high LST such as; high population density, deforestation, industrial emissions and other natural causes. Thus, urbanisation is identified as key in exercising strong effects on the occurrence of UHI over Kano Metropolis.
Table 3: Simple Linear Regression Model for High LST Model R R
Square Adjusted R Square
Std. error of the estimate
1 0.897a 0.805 0.707 2.09688 a. Dependent Variable: High LST
b. Predictors: (Constant), Built-up area
Source: [18].
6 CONCLUSION AND RECOMMENDATIONS
The estimated LST maps revealed that surface temperatures in Kano Metropolis has been on the increase from 1986 to 2016. The high LST dominate the surface of the Metropolis especially within the urban city centre and thus, developed into the Urban Heat Island.
The estimated LULC maps indicated that Kano Metropolis steadily witnessed rapid urbanisation as built-up areas increased from 1986 to 2016, vegetation, soil and water coverage reduced and giving up their spaces to built-up areas which is a strong indicator of urbanisation.
Urbanisation therefore is the major player in the occurrence of these Heat Islands over Kano Metropolis.
Recommendations includes;
1. The need for communities to embark on afforestation programmes to strengthen green lands that will provide cooling effects to the surfaces and atmosphere and thus limit the effect of UHI.
2. Technologies such as the green and cool roofing technologies be accommodated into building designs since they have high albedos and low heat absorbance.
3. Urbanisation is a process that cannot be halted hence, urban managers and planners should embark on re-designing cities in such a way that a lot of parks, gardens, orchards, and open spaces will be accommodated into the city physical plans. These provisions will allow for the free flow and passage of air as well as provision of shades that will contribute to city cooling.
REFERENCES
[1] Gluch R., Quattrochi D. A., &Luvall, J. C. (2006). A Multiscale Approach to Urban Thermal Analysis. Remote Sensing of Environment, 104: 123-132.
[2] Voogt, J. A., &Oke, T. R. (2003). Thermal Remote Sensing of Urban area. Remote Sensing of Environment, 86, 370 – 384.
[3] Dash, P. (2005). Land Surface Temperature and Emissivity Retrieval from Satellite Measurements. Journal of Environmental Science, 1 (1), 85-90.
[4] Luber, G., &McGeehin, M. (2008). Climate Change and Extreme Heat Events. American Journal of Preventive Medicine, 35, 492 – 435.
[5] Zheng, B. J., Myint, S. W., & Fan, C. (2014). Spatial Configuration of Anthropogenic Land Cover Impacts on Urban Warming. Landscape and Urban Planning, 130, 104 – 111
[6] Huang, J., Akbari, H., &Taha, H. (1990). The Wind Shielding and Shading Effects of Trees on Residential Heating and Cooling Requirements. Winter Meeting, American Society Heating, Refrigerating and Air-Conditioning Engineers. Atlanta, Georgia.
49.1
8
68.8
4
63.8
2
87.1
3
71.7
3
78.6
6
70.7
66.2
3
375.
82
349.
78
362.
89
344.
34
3.22
2.67
2.54
2.25
1 9 8 6 1 9 9 8 2 0 0 6 2 0 1 6
AREA
L CO
VERA
GE
(KM
2 )
YEARS
Built-up Area Vegetation Bare-soil Water
IJSER

International Journal of Scientific & Engineering Research Volume 8, Issue 9, September-2017 299 ISSN 2229-5518
IJSER © 2017 http://www.ijser.org
[7] Rose, L. A. &Devadas, M. D. (2009). Analysis of Surface Temperature and Land Use/Land Cover Types using Remote Sensing Imagery – A case in Chennai City, India. Seventh International Conference on Urban Climate, Yokohama, Japan.
[8] Comrie, A. C. (2000). Mapping a Wind-modified Urban Heat Island in Tucson, Arizona (with Comments on Integrating Research and Undergraduate Learning). Bulletin American Meteorological Society, 81, 2417-2431.
[9] Weng, Q. (2003). Fractal Analysis of Satellite-detected Urban Heat Island Effect. Photogrammetry Engineering and Remote Sensing Journal, 69, 555-566.
[10] Gaffin, R. S., Rosenzweig, C., Khanbilvardi, R., Parshall, L., Mahani, S., Glickman, H., Goldberg, R., Blake, R., Slosberg, R. B., & Hillel, D. (2008). Variations in New York City’s Urban Heat Island Strength over Time and Space. Theoretical and Applied Climatology, 94, 1-11.
[11] Na’Abba, I. S. (2002). Transformation of the Kabuga Housing Estate. Unpublished MSc Land Administration Dissertation, Department of Geography, Bayero University, Kano.
[12] Ayila, A. E., Oluseyi, F. O., &Anas, B. Y. (2014). Statistical Analysis of Urban Growth in Kano Metropolis, Nigeria. International Journal of Environmental Monitoring and Analysis, 2 (1): 50 – 56.
[13] NPC (National Population Commission). (2006). National and State Population and Housing Tables. 2006 Census Priority Tables, 1(1).
[14] Fortuniak, K. (2009). Global Environmental Change and Urban Climate in Central European Cities. International Conference on Climate Change, the Environmental and Socioeconomic Response in the Southern Baltic Region, Szczecin,24(11), 1395-1421.
[15] Pompeii II, W. C. (2010). Assessment of the Urban Heat Island (UHI) for the Borough of Shippensburg, Pennsylvania. Master’s thesis in Shippensburg University, Shippensburg, Pennsylvania.
[16] Oluseyi, I. O., Fanan U., &Magaji, J. Y. (2009). An Evaluation of the Effects of Land Use/Land Cover Change on the Surface Temperature of Lokoja Town, Nigeria. African Journal of Environmental Science and Technology, 3 (3), 86 – 90.
[17] Adinna E.N., Christian E.I., &Okolie T. (2009). Assessment of Urban Heat Island and Possible Adaptations in Enugu Urban Using Landsat-ETM. Journal of Geography and Regional Planning, 2 (2), 30-36.
[18] Tanko, I. A. (2017). The Effect of Urbanisation on the Occurrence of Urban Heat Island in Kano Metropolis, Nigeria. Unpublished Masters of Technology thesis, Department of Geography, Federal University of Technology, Minna,
.
IJSER