modelling informal urban growth under rapid urbanisation - eldorado
TRANSCRIPT
Modelling informal urban growth under rapid urbanisation
A CA-based land-use simulation model for the city of Dar es Salaam, Tanzania
by Alexandra Hill and Christian Lindner

Modelling informal urban growth
under rapid urbanisation
A CA-based land-use simulation model
for the city of Dar es Salaam, Tanzania
Doctoral thesis
by
Dipl.-Ing. Alexandra Hill
and
Dipl.-Ing. Christian Lindner
submitted to TU Dortmund University, Faculty of Spatial Planning
for the award of a Dr.-Ing. degree
Doctoral committee
Prof. Dr. Volker Kreibich
Prof. Dr. Dr. Walburga Rödding
Prof. Dr. Wilbard J. Kombe
June 2010


i
Abstract
Dar es Salaam in Tanzania is one of the fastest growing urban agglomerations in Africa and projected to become a megacity (i.e., a city with more than 5 mio. inhabitants) by 2025. Rapid urban growth under poverty has outstripped the capacities of planning authorities to cope with the enormous pace of urban expansion. As a consequence informal settlements absorb almost all urban settlers leading to rapid urban sprawl into the unplanned periphery. But still only little is known about the drivers and mechanisms of ongoing urbanisation processes and the means of intervention. The need for well balanced and informed decisions becomes evident and calls inter alia for support of urban planning by geo-information technology and so-called decision support systems. This thesis approaches these needs by designing a land-use simulation model for the city of Dar es Salaam.
Particularly in developing countries urban modelling inevitably comprises the challenge of setting up an appropriate database. Public authorities in Dar es Salaam lack precise and up-to-date information and were unable to contribute to the database needed for the modelling work particularly since multi-temporal information was required. Basic datasets which have been provided by another research institution were extended and updated to serve as the database required by the analysis and modelling work.
The model presented is based on standard GIS software and designed along the principles of Cellular Automata (CA) which are particularly suitable to capture neighbourhood dynamics and likewise do not demand for a highly sophisticated database. Population projections by the UN Population Division have been used to determine future demand for informal residential land. The model simulates its allocation based on variables which represent major drivers of informal urban growth: natural conditions, accessibility and local-scale dynamics, i.e., so-called neighbourhood effects. These drivers have been proven to be adequate to explain and project urban growth during the process of model calibration and validation based on regression analyses.
The model has been employed to project land-use patterns until 2022 as a baseline scenario. In accordance with recent local urban planning and development discourse the impact of transport infrastructure projects on the distribution of future urban growth has been simulated in four scenario settings. The results have been analysed with reference to the baseline scenario to compare the characteristics of likely urban futures.
The application of the model demonstrates the considerable potential of urban growth modelling for the situation in Dar es Salaam and its transferability to cities facing similar conditions. It provides a valuable laboratory to test the drivers and mechanisms of urban growth and the associated means of intervention. During field work interim results have proven that the model is able to establish and maintain a discourse among planners and other stakeholders thus mitigating one of the major weaknesses of urban development planning - the lack of cooperation and coordination. This is an essential first step for strategic intervention into informal urban development processes given the limited resources at hand and to support planning authorities in Dar es Salaam to cope with future urban development in a pro-active manner.

ii

iii
Acknowledgements
This doctoral thesis has substantially benefitted from contributions of various persons and institutions. In the following their support, comments, and advice being of particular relevance during the time of writing this thesis shall be acknowledged.
First of all the three members of the doctoral committee shall be mentioned here. Professor Volker Kreibich inspired this work in various respects from the beginning on. Throughout the whole process he was unhesitating to discuss every issue of uncertainty that the authors directed to him. Professor Walburga Rödding’s fundamental expertise on systems theory and modelling contributed critical advice on shaping the chosen modelling approach and refocusing on the core research aims. Moreover, she encouraged the authors to conduct this study while working as research assistants at the School of Spatial Planning at TU Dortmund University. The authors are also grateful that Professor Kombe as the external examiner provided considerable advice on informal structures and mechanisms in Dar es Salaam throughout the early stages of this research. Besides theoretical considerations he familiarised the authors with the informal urban reality in Dar es Salaam.
Among the various persons who provided support two persons deserve outstanding appreciation. The first one is Rolf Moeckel who accompanied the authors and their work as a colleague and friend. He provided valuable feedback from the beginning to the very end of this work particularly but not solely on modelling issues and, thus, endorsed this thesis significantly. The second person is Daniel Msangi who added essential information and local knowledge on Dar es Salaam and was always supportive when desktop research in Germany reached its limits.
Furthermore, Klaus Spiekermann and Professor Michael Wegener discussed interim results with the authors and gave valuable advice. Colleagues at IRPUD supported our work mainly by data-related work. Here, Meinhard Lemke, Annerose Rummel-Kajewski, and Michael Höweler have to be mentioned in particular. Nadine Mägdefrau, Christian Lamker, Johann Martins, and Daniel Tries facilitated this work in many ways. Professor Stefan Greiving in his function as Head of Research Department at IRPUD has provided support by taking some workload from the authors during the final phase of this study.
The work at hand would have not been implementable without support from ITC, Enschede. ITC provided a comprehensive set of data on Dar es Salaam which constituted the basis for accomplishing this work. Richard Sliuzas, Sherif Amer, Mark Brussel shall be mentioned in particular.
The team of SBAZ (Statistisches Beratungs- und Analyse-Zentrum der Technischen Universität Dortmund) gave profound assistance during the theoretical and practical advancement of the methodological framework considering model calibration and validation. As representative for the team Alexander Sommer shall be mentioned here explicitly.
The work at hand was initiated in the context of the research project “Trunk Infrastructure and Urban Growth - Managing Rapid Urbanisation in Poverty in Dar es

iv
Salaam, Tanzania” funded by BMBF from 2005 to 2008. The full research team consisted of Timo Basteck, Tanja Hühner, Prof. Volker Kreibich, Jasmin Metzler, Wolfgang Scholz, and Professor Hans-Peter Tietz and supported the authors to study the processes of informal urban dynamics in Dar es Salaam. Also the Dar es Salaam research team from Ardhi University shall be mentioned here, particularly John Lupala, Aldo Lupala, and Ally Hassan Namangaya.
Last but not least our families supported us throughout the whole process. We would like to thank them for their empathy and thoughtfulness.
Dankeschön! Thank you! Asanteni sana!

v
Table of Contents
II -- RREESSEEAARRCCHH DDEESSIIGGNN ............................................................................................. 1
1. Problem statement ............................................................................................... 3
2. Guiding questions and research aims .................................................................. 4
3. Methodology and structure of this book .............................................................. 5
IIII -- TTHHEEOORREETTIICCAALL FFRRAAMMEEWWOORRKK ................................................................................. 9
4. Informal urbanisation processes in developing countries ................................ 11
4.1. Developing countries and urbanisation ............................................................... 11
4.1.1. Population growth ......................................................................................... 11
4.1.2. Urbanisation in Africa ................................................................................... 13
4.1.3. Specific challenges in developing countries – urbanisation under poverty ............................................................................................................ 16
4.2. Informality ............................................................................................................... 16
4.2.1. Informal economy ......................................................................................... 17
4.2.2. Informal transport ......................................................................................... 19
4.2.3. Informal housing ........................................................................................... 21
4.2.4. Responses to informal urban developments ............................................. 26
4.2.5. Informality, regulation, and welfare ............................................................ 28
4.3. Emergence of megacities and development challenges .................................... 31
4.4. Megacities research ............................................................................................... 37
4.4.1. Recent German megacities research initiatives ........................................ 38
4.4.2. Research project MEGACITIES: DAR ES SALAAM ...................................... 39
4.5. Interim conclusions ................................................................................................ 40
5. Urban modelling and systems theory ................................................................. 41
5.1. Systems theory ....................................................................................................... 41
5.2. Complex systems .................................................................................................... 43
5.3. About models .......................................................................................................... 45
5.4. Models as decision support tools in urban planning .......................................... 46
5.5. Modelling spatial phenomena ............................................................................... 49
5.5.1. Modelling and GIS ......................................................................................... 49
5.5.2. Data structures and representation models .............................................. 51
5.5.3. Spatio-temporal modelling .......................................................................... 54
5.6. Cellular automata: modelling cities as complex systems .................................. 56
vi
5.6.1. Modelling urban growth and urban dynamics ........................................... 56
5.6.2. CA modelling .................................................................................................. 59
5.7. CA basics ................................................................................................................. 61
5.7.1. Cells ................................................................................................................ 61
5.7.2. Cell states ...................................................................................................... 63
5.7.3. Neighbourhood effect .................................................................................. 64
5.7.4. Transition rules ............................................................................................. 65
5.8. Urban CA extensions .............................................................................................. 66
5.9. State of the art ........................................................................................................ 67
5.10. Interim conclusions ................................................................................................ 70
6. Urban theory and planning paradigms .............................................................. 72
6.1. Theories on urban structures and urban development ...................................... 72
6.1.1. Agglomeration theories ................................................................................ 72
6.1.2. Location theory ............................................................................................. 75
6.1.3. Spatial diffusion theory ................................................................................ 88
6.2. Planning paradigms ............................................................................................... 94
6.2.1. Changing planning paradigms ..................................................................... 94
6.2.2. Planning paradigms in Tanzania ................................................................. 96
6.3. Interim conclusions ................................................................................................ 97
IIIIII - INTRODUCING THE CASE OF DAR ES SALAAM ...................................................... 101
7. The national context ......................................................................................... 103
7.1. Tanzania ................................................................................................................ 103
7.2. National urban primacy of Dar es Salaam ......................................................... 105
8. Planning context ............................................................................................... 109
8.1. Legal and institutional framework ..................................................................... 109
8.2. Planning documents ............................................................................................ 111
8.3. Deficiencies of the regulatory framework and local governance failures ...... 113
9. Urban structure and development of Dar es Salaam ...................................... 117
9.1. Informal urbanisation processes ....................................................................... 117
9.1.1. Informal urban development challenges ................................................. 117
9.1.2. Informal settlers and informal land markets ........................................... 119
9.2. Spatial scope of the study ................................................................................... 122
9.3. Analysis of urban growth ..................................................................................... 123

vii
9.3.1. Land use and housing ................................................................................. 123
9.3.2. Road network and accessibility ................................................................. 130
9.3.3. Land form and terrain ................................................................................. 140
9.3.4. Population .................................................................................................... 142
10. Interim conclusions ........................................................................................ 147
IIVV -- MMOODDEELLLLIINNGG UURRBBAANN GGRROOWWTTHH .......................................................................... 149
11. Model development ........................................................................................ 151
11.1. Model database .................................................................................................... 151
11.2. Conceptualising the model .................................................................................. 153
11.2.1. Constraint areas .......................................................................................... 156
11.2.2. Cell suitability .............................................................................................. 157
11.3. Exogenous drivers and settlement area demand ............................................. 160
11.4. Transition potential and transition rules ........................................................... 164
11.5. Perturbation .......................................................................................................... 164
11.6. Technical implementation ................................................................................... 165
11.6.1. ArcGIS as basic modelling framework ...................................................... 165
11.6.2. A Python-driven model ............................................................................... 166
11.7. Data input and output, visualisation, and results assessment ....................... 167
12. Model calibration and validation ................................................................... 169
12.1. Coefficient estimation .......................................................................................... 169
12.2. Transition potential and transition rules ........................................................... 170
12.3. Calibration process and results .......................................................................... 171
12.4. Validation process and results ........................................................................... 177
13. Simulating urban futures ............................................................................... 183
13.1. Urban scenarios, urban planning, and the future ............................................. 183
13.2. Baseline scenario ................................................................................................. 184
13.3. Transport infrastructure scenarios .................................................................... 189
13.3.1. Scenario I: Bus rapid transit implementation .......................................... 191
13.3.2. Scenario II: Ring road construction ........................................................... 197
13.3.3. Scenario III: Kigamboni Bridge crossing Mzinga Creek ........................... 202
13.3.4. Scenario IV: Combined implementation of DART, ring road, and Kigamboni Bridge ........................................................................................ 207
13.4. Comparison of scenarios ..................................................................................... 212
14. Interim conclusions ........................................................................................ 214

viii
VV -- CCOONNCCLLUUSSIIOONNSS AANNDD TTHHEE WWAAYY FFOORRWWAARRDD .............................................................. 219
15. Integrated planning and development perspectives for the urban future of Dar es Salaam ................................................................................................... 221
16. Model discussion ........................................................................................... 225
17. Towards a practical urban decision support system ................................... 229
18. Further research needs ................................................................................. 231
VVII -- AANNNNEEXX ....................................................................................................... 235
19. List of abbreviations ...................................................................................... 237
20. List of figures ................................................................................................. 239
21. List of tables .................................................................................................. 244
22. References ..................................................................................................... 245

ix
"The future of humanity lies in cities."
Kofi A. Annan (Secretary-General of the United Nations (1997-2007), in a message to the Beijing 2000 World Major Cities Summit)

x

II -- RREESSEEAARRCCHH DDEESSIIGGNN
This block compiles the research design of this study introducing the problem statement including the spatial phenomenon under study and its framing global trends. Subsequently, the guiding research questions and the methodological approach of this work are presented as well as how this book is organised.
“Globalization is making the 21st century the century of the cities. The challenge is how to make cities a better place for the majority of the people.”
Anna Kajumulo Tibaijuka (Under-Secretary-General of the United Nations and Executive Director of the United Nations Human Settlements Programme (UN-HABITAT))

Problem statement
2

Problem statement
3
1. Problem statement
The foregoing quotation underlines one of the most fundamental and most radical changes recently experienced by humanity: global urbanisation. With the beginning of the 21st century humanity entered the ‘Century of cities’ (Kofi Annan) since the majority of people worldwide are estimated to live in urban areas. During the time of writing this report the relation between urban and rural population assumedly has inverted and the majority of people now live in cities (see Figure 1).
Figure 1: Urban and rural populations of the world, 1950-2030
Source: Own Illustration; based on UN, 2007 and 2008b
UN figures further indicate that in the second half of the last century the number of people living in cities increased from 740 million to 2.9 billion. Accordingly, the degree of urbanisation increased from 30% to 47%. Further studies reveal that by the year 2030 an estimated 60% of the world’s total population will live in urban areas (United Nations (UN), 2004b). The urban population grows much faster than the rural with Africa showing the highest annual urban growth rates.
Because of the basic urbanisation trend in the last decades a number of so called megacities (cities with more than 5 or 8 or 10 million inhabitants; depending on the definition) emerged all around the world (Mertins, 1992; Fuchs et al., 1994; Bronger, 2004). The UN highlight that ”the developing world, where megacities will be the hallmark of future urbanisation, is experiencing extraordinary spurts of growth in its largest cities” (UN, 2007). For example, the number of people living in Lagos, Nigeria’s capital and the fastest growing megacity in the world, is expanding by more than 5% a

Guiding questions and research aims
4
year1. By 2020 all but 4 of the world’s megacities of at least 10 million inhabitants will have emerged in the developing world (UN-HABITAT, 2007; see also Chapter 4.3).
The city of Dar es Salaam is one of the large cities in sub-Saharan Africa experiencing rapid urban growth accompanied by poverty and little economic growth. Due to constraints in financial resources and personnel capacity local planning authorities in Dar es Salaam are barely able to respond to the enormous settlement pressure, including the ensuing demand for new plots. Thus, most of the growth is absorbed by informally developed settlements which are basically characterised by a comparatively low standard of shelter, the absence of planning regulations, surveying and a suitable and adequate provision of basic infrastructure. For Dar es Salaam it is estimated that about 70% (Kombe & Kreibich, 2006; A. Lupala, 2002; J. Lupala, 2002) to more than 80% (Kironde, 2006: 463) of the built-up city area are informally developed residential settlements as the majority of urban residents are too poor to participate in the formal land and housing market. The increasing level of poverty, rapid population growth and a lack of suitable housing policies have forced the majority of urban residents and rural migrants into informal land and housing markets. These unfavourable conditions have led to massive socio-economic and environmental problems such as uncontrolled urban sprawl, deterioration of open spaces and transport problems such as bad accessibility, road congestion and air pollution (Mbuligewe & Kassenga, 1997). The uncoordinated spatial development causes high planning pressure and the need for integrated and cooperative action in terms of supplying or supporting access to social and technical infrastructure to counteract economic and social problems.
Although many studies on megacities were conducted in the past years there is still specific knowledge missing as most of these studies had descriptive rather than explanatory character. The work at hand steps in when it comes to the issues of rapid urbanisation and the question how this spatial phenomenon can be modelled to reproduce the observed development phenomena and, thus, contribute to their understanding. As most of the development is of informal character residential location decisions are the backbone of urban change. But still, little is known about the drivers and mechanisms influencing these decision processes and what the influence of and at the same time also on urban structures is like. To contribute additional knowledge on this urban phenomenon a detailed research agenda will be sketched in the following subchapters.
2. Guiding questions and research aims
This study is dealing with the development of a computer-based simulation model to reproduce informal urban residential dynamics in Dar es Salaam, Tanzania. As a step towards a better understanding of the underlying processes the study aims to explore urban growth and to investigate the drivers of this development. Simultaneously, the model seeks to reproduce residential location decisions and the underlying mechanisms on an aggregate level in order to understand informal urban dynamics. It aims at 1 For example, yearly growth rates of about 6% mean a doubled population in 12 years and fivefold increase after 28 years.

Methodology and structure of this book
5
forecasting future trends and demonstrating the likely impacts of selected planning measures. A particular focus of this study is to explore the potential of transport infrastructure to guide future informal residential development decisions.
The central research questions related to the development of the model can be formulated as follows:
What are the (key) determinants of informal urban development in terms of informal residential location decisions?
How do these determinants work together and how can the dynamics be modelled?
What is the particular relevance of transport infrastructure for informal urban growth?
How can this simulation model be integrated into local practice to support sound planning processes and decision making?
Accordingly, the objective of this research is to develop a mathematical model being able to reproduce growth of informal residential areas in Dar es Salaam. Moreover, the way forward will elaborate on further working steps towards turning such expert system into a decision support tool for daily planning practice in Dar es Salaam to become a supportive instrument for a more coordinated planning approach.
3. Methodology and structure of this book
The structure of this volume follows the logic of the methodology applied. The methodological approach comprises basically five blocks as illustrated in Figure 2. At the beginning the overall problem of urban sprawl of informal settlements is introduced as well as the research framework and design. A review of relevant literature on theories of urban structure and development follows. The third block includes the exploration of the planning context in Dar es Salaam and the analysis of urban growth and its main drivers during the last decades. The next block comprises the various steps of the urban modelling process: model development, calibration, validation and simulation of scenarios. The final section elaborates conclusions and action recommendations towards a functional urban decision support system.

Methodology and structure of this book
6
Figure 2: Methodology
Source: Own illustration
The following paragraphs provide a deeper insight into the various working steps and their interrelations. The introduction block (which this section is part of) starts off with a description of the phenomenon under study. Urban sprawl of informal settlements is a widespread phenomenon in large cities of the developing world but still there is little knowledge about its underlying driving forces and mechanisms. Elaborating on these knowledge gaps the guiding questions and the research aims are sketched to highlight the focus of this work.
The second main block establishes the theoretical framework for this work giving an overview on the relevant theories in the context of informal urbanisation, spatial modelling and location theories. Since urbanisation and urban growth are very complex spatial processes this step is crucial to provide an appropriate theoretical framework comprising the relevant aspects of the main theoretical approaches forming the basis for the modelling work to be undertaken.
First, a chapter elaborates on informal urbanisation processes focussing on developing countries. This chapter includes information on population growth and trends of urbanisation in Africa. Moreover, it introduces selected informal activities which are related to urban development like the informal economy, informal transport and the informal housing sector. Subsequently, it gives an overview on the issue of megacities and megacities research and on one specific research project from which the work at hand originates.

Methodology and structure of this book
7
In the next chapter urban modelling and system theory are introduced comprising the role of models as decision support tools in spatial planning, the basics of cell-based modelling and Geoinformation Technology (GIT). Adding to the theoretical framework a subchapter on Geographic Information Systems (GIS) provides the necessary background information on GIS data models in general, the GIS based modelling of spatial phenomena and the specifications of raster-based GIS in comparison to vector-based GIS since both types are employed during this research. Last but not least an in-depth presentation of the basic principles and features of CA follows which is the modelling approach used for this work. The theory and history of CA as one technique to model and simulate spatial phenomena are introduced. This includes the design principles of CA, the special role of local-scale dynamics for this type of simulation, the underlying transition rules determining cell transition, and the current state of the art with a special emphasis on CA application in urban environments.
The next chapter deals with urban theory giving insights into location decisions and urban dynamics based on location theories, diffusion theories and agglomeration theories. In the context of urban development and modelling diffusion as a spatial process takes a very important role and has to be recognised when working on urban growth models. This applies in the same way for agglomeration and allocation theories as the main approaches to explore and explain urbanisation processes and the complex relationships between the spatial entities considered. Moreover, relevant gaps in existing theories for urban structures in developing countries are elaborated.
Subsequently, the authors explain their view on planning paradigms in the context of development of planning paradigms. A special focus is laid on specific trends in Tanzania. The block is completed by a concluding chapter synthesising the most relevant information for the further modelling work.
The third block is concerned with the case of Dar es Salaam, Tanzania. After having established the theoretical framework, a portrait of the city of Dar es Salaam provides an introduction to the case the model is developed for. This includes information on the city’s position in the nation-wide context of Tanzania, as well as an introduction to the specific planning context establishing the legal and institutional framework, planning documents and the shortcomings of spatial planning particularly highlighting deficiencies of the regulatory framework and local governance failures. Furthermore, the city’s urban structure and development and its specifics when it comes to informal urbanisation are illustrated. Due to the quantitative part of these analyses firstly the study area to be examined is delineated. Based on this, the city’s growth patterns and trends as major input for the subsequent modelling work are analysed. An in-depth analysis of the city development between 1982 and 2002 is carried out.
The fourth block describes the development and application of a CA for the case of Dar es Salaam. Based on the knowledge and findings of the previous working steps, e.g., the analysis of development patterns of the city in the past decades, a concept for a CA model integrated into a GIS is established. The factors relevant to the simulation model are introduced giving an overview of the assumptions made, and after that introducing

Methodology and structure of this book
8
the factors to be incorporated into the model as well as the exogenous factors of land-use development. The procedure applied for calculating the transition potential is explained and subsequently transition rules determining land-use change in the model. Finally, the view is directed to the practical implementation of the CA model based on the GIS software employed.
Subsequently, the process of model calibration and validation is described. In order to calibrate the model to accurately simulate the city development of Dar es Salaam historical datasets and the approach of binary logistic regression are used. The subchapter also discusses the dichotomy of heuristic methods and econometrics. Methods to evaluate the degree of fit of the simulation results are introduced and applied.
To complete the model work future urban development in terms of a baseline scenario as well as four transport scenarios are introduced allowing for the simulation of urban development alternatives until the year 2022. The simulation results of the different alternatives are compared to the baseline scenario in order to demonstrate the impacts of transport projects on urban development and the results of this analysis are discussed.
In the final section of this volume conclusions from this work are drawn and the way forward is sketched. General and emerging perspectives for an integrated planning and development for the future of Dar es Salaam are elaborated. Moreover, the model benefits and shortcomings are discussed and the way forward towards the practical establishment of the model as an urban decision support system is sketched. Finally, further research needs are addressed.

Methodology and structure of this book
9
IIII -- TTHHEEOORREETTIICCAALL FFRRAAMMEEWWOORRKK
This block introduces the theoretical foundations enabling the authors to approach the research questions of this study. At the beginning urbanisation processes in developing countries as the broader context of the phenomenon under study are highlighted. Subsequently, a special focus is directed to informality as a main driver of urban change whereas informal economy, informal transport, and informal housing are amended by some thoughts on responses of the formal sectors aiming to increase welfare. The next subchapter presents issues on megacities and current trends in megacities research in particular.
The succeeding chapter pictures selected aspects of urban modelling and systems theory giving special attention to their relevance for spatial planning and sound decision-making. The modelling approach of CA is elaborated in more detail as it constitutes the approach applied in this work. The next chapter presents relevant urban theory introducing drivers and mechanism of urban dynamics and location decision. The following chapter demonstrates changing planning paradigms emphasising trends in Tanzania.
“The economic, social and political future of developing countries will to a large degree depend on the functionality of their large cities. Being engines of economic growth, they
need to run efficiently, smoothly and reliably. Their power depends not least on the quality of their spatial structure which has a strong influence on the costs of transportation and
for the provision of trunk infrastructure like piped water, sewage and drainage. A functional urban layout is also highly supportive for public health and the protection of
the natural environment”
(Kombe & Kreibich, 2006: xiii).

Methodology and structure of this book
10

Informal urbanisation processes in developing countries
11
4. Informal urbanisation processes in developing countries
This chapter provides an introduction to the theoretical framework of informal urbanisation processes in developing countries. For this reason the overall framing condition of rapid urbanisation under poverty is sketched and resulting informal urban development processes are described. The authors present three areas of informal activities which are of specific relevance for urban structures, urban development and urban living: informal economy, informal transport and informal housing. The interlinkages between these sectors are highlighted as well as past responses and the general role of public intervention in terms of market regulation. Furthermore, the field of megacities research is presented including its development, recent focal points and selected research gaps which the work at hand uses as a starting point.
4.1. Developing countries and urbanisation
4.1.1. Population growth
Mankind has experienced rapid population growth in the past and global population is projected to further increase. However, development patterns differ globally in terms of growth distribution. The UN estimation for the total world population in 2005 was 6.5 billion inhabitants. This meant an additional number of 380 million people since 2000 and a yearly global gain of 76 million inhabitants. According to the UN in 2050 the world population is projected to reach 9.1 billion and will then be 2.6 billion people more than in 2005. This projected increase is equivalent to the recent total number of inhabitants of China and India taken together. Future population growth is highly dependent on future fertility rates. The above mentioned projection as a medium variant assumes that the average fertility rate will decline from today’s 2.6 children per women to 2.05 children in 2050. Different projections illustrate the effects of fertility with the low projection estimating 7.6 billion in 2050 (assuming that the fertility path is half a child lower than in the medium variant) and the high projection calculating 10.6 billion people (assuming that the fertility rate is half a child above the one assumed for the medium variant - just roughly like it is today (UN, 2005: vi.).
Recent urban development processes in developing countries differ from trends of development in developed countries. Whereas for example many big European cities experience processes of stagnation or even population decline, most cities in the developing world gain population at very rapid rates. Thus, the distribution of population gains is highly irregular. 51 countries including Germany are assumed to have less population in 2050 than they have now. In general, countries categorised as being more developed experience stagnation of population. In contrast, the least developed countries’ population figures are projected to double until 2040 (see Figure 3).

Informal urbanisation processes in developing countries
12
Figure 3: Population dynamics by development groups, 1950 to 2050
Source: UN, 2005: vii
The average annual rates of change of the population decline throughout all groups of countries. But the level is still the highest in the least developed countries with an average value of about 2.4 at the moment (see Figure 4). “While the population at the global level continues to increase, that of the more developed regions as a whole is hardly changing and virtually all population growth is occurring in the less developed regions. Especially rapid population growth characterizes the group of 50 least developed countries” (UN, 2005: v). Tanzania belongs to the last group classified by the UN as one the 50 least developed countries.
Figure 4: Average annual rate of change of the population of the world and major development groups, 1950-2050
Source: UN, 2005: 2

Informal urbanisation processes in developing countries
13
4.1.2. Urbanisation in Africa
In the second half of the 1990s Rakodi argued that “by now it is almost a truism that the planet’s future is an urban one and the largest and fastest-growing cities are primarily in developing countries” (1997b: 1). One decade later, evidence of the increasing patterns of urban growth suggest that it is no longer “almost a truism” as the majority of people worldwide are estimated to live in urban areas since 2007. Urban growth as a complex process is a result of a combination of manifold “factors: geographical location, natural population growth, rural-to-urban migration, infrastructure development, national policies, corporate strategies, and other major political, social and economic forces, including globalization” (UN-HABITAT, 2008b: xi). In Africa urbanisation recently has gained additional momentum due to climate change and armed riots in rural areas (Le Monde Diplomatique, 2009: 138).
Social change in Africa is most evidently through the rapid growth of urban population and urban settlement areas and the increase in the total number of cities. In 1900, only a few cities existed in Africa. By 1950, at the beginning of the main decolonisation period, only about 13% of Africa’s total population lived in urban areas. Cairo and Alexandria with a population of more than 1 million inhabitants, and Johannesburg with a population of 915,000 inhabitants were considered to be the largest cities in Africa. The next large cities with more than 400,000 people were Casablanca, Cape Town, Durban, The East Rand, Tunis, Algier, and Ibadan (Rakodi, 1997b: 26). The beginning of the 1960s saw the urbanisation rate in Africa increase to 18.3%. Whereas the southern and northern parts of Africa showed an urbanisation rate of 42% and 30% respectively, the eastern parts showed by far the lowest levels of urbanisation with a growth rate of 7.4%. In 1980 an estimated 23% of the total African population was living in urban areas. According to several authors, the steady increase in the level of urbanisation in Africa from 1990 to 2000 resulted in 340 million inhabitants living in urban areas. This accounted for 43% of the total African population (Rakodi, 1997b: 26; UN-HABITAT, 2002; Vorlaufer, 2004: 664).
Urbanisation in developing countries is largely fuelled by rural-to-urban migration and increasingly natural growth of the urban population. Whereas the rates of natural increase steadily rose until the mid 1990s, reaching 2.5% per annum for Africa in the early 1960s, 2.6% later in the decade, and 2.7% per annum in the early 1970s, the total urban growth rate was almost double (UN, 1993). It is estimated that two thirds of the urban population lived in developing countries in 2007. According to investigations published by the UN in 2008, urban population increases much faster than that in rural areas. Africa in particular displays the highest urban growth rates in the whole world, growing by 3.4% each year (average between 2000 and 2005). The annual growth rates of about 3.4% translate into a burgeoning population whose numerical figures are projected to double within 23 years.
The rapid growth rates of many cities in developing countries are pushing urbanisation rates to unprecedented extents. East Africa held the leading position between 1950 and 1995 with average annual growth rates of 5.6 to 6.5% (always referring to 5 year periods) whereas the overall African growth figures varied from 4.5 to 4.9%. Few countries such
Informal urbanisation processes in developing countries
14
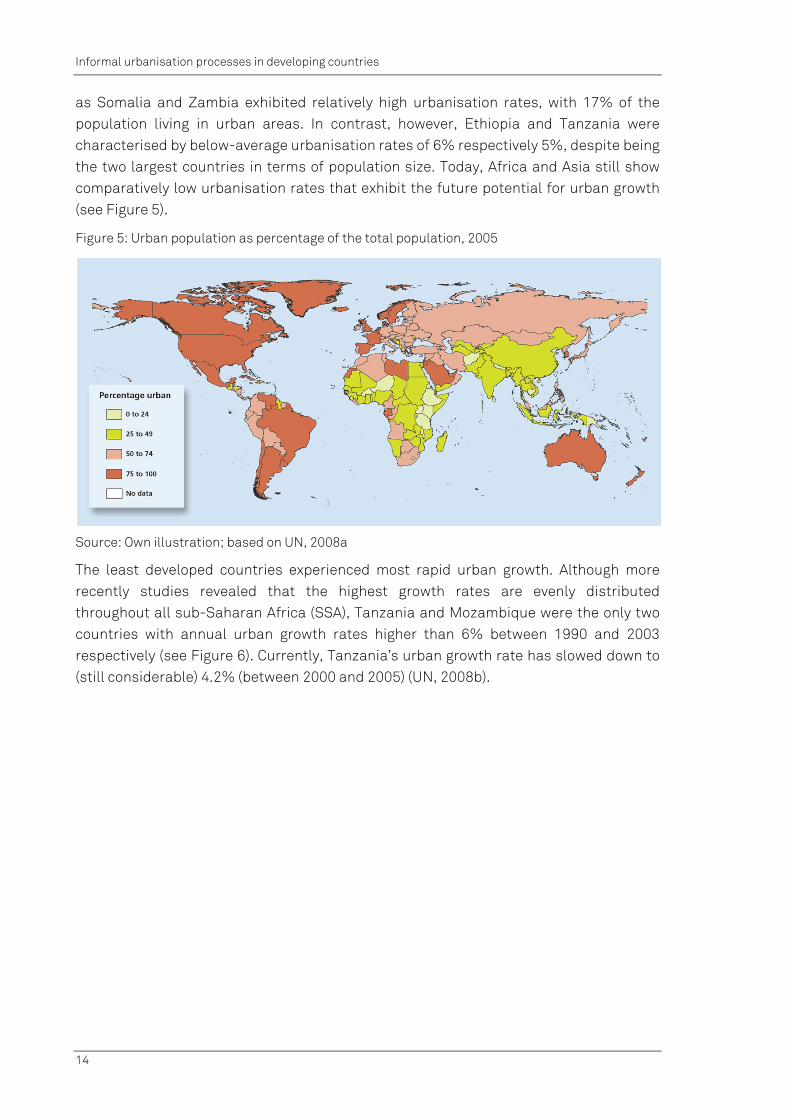
as Somalia and Zambia exhibited relatively high urbanisation rates, with 17% of the population living in urban areas. In contrast, however, Ethiopia and Tanzania were characterised by below-average urbanisation rates of 6% respectively 5%, despite being the two largest countries in terms of population size. Today, Africa and Asia still show comparatively low urbanisation rates that exhibit the future potential for urban growth (see Figure 5).
Figure 5: Urban population as percentage of the total population, 2005
Source: Own illustration; based on UN, 2008a
The least developed countries experienced most rapid urban growth. Although more recently studies revealed that the highest growth rates are evenly distributed throughout all sub-Saharan Africa (SSA), Tanzania and Mozambique were the only two countries with annual urban growth rates higher than 6% between 1990 and 2003 respectively (see Figure 6). Currently, Tanzania’s urban growth rate has slowed down to (still considerable) 4.2% (between 2000 and 2005) (UN, 2008b).

Informal urbanisation processes in developing countries
15
Figure 6: Average annual growth rates (in %) of the urban population, 1990-2003
Source: Le Monde Diplomatique, 2006: 35
Due to the huge population base in developing countries, an explosive growth is underway in large or capital cities. In the 1960s and 1970s, there were numerous big cities like Kinshasa and Lagos, Abidjan, Conakry, Tripolis and Dar es Salaam all of which exhibited growth rates higher than 10% (Rakodi, 1997b: 34). According to scholars, this rate decreased by more than half at the beginning of this decade. Between 2000 and 2005, the city of Dar es Salaam experienced an annual growth rate of 4.7%, whereas it is projected that for the period between 2010 and 2015 urban growth rate will reduce to 3.2%. Nevertheless, Dar es Salaam still belongs to the most rapidly growing cities in Africa, only exceeded by Lagos, Nigeria, and Kumasi, Ghana (with annual growth rates of 5.1% and 4,9% respectively between 2000 and 2005) (UN, 2006a).
In future, Africa is projected to be the only continent where population growth will take place in both urban and rural areas. The UN project an increase in urban growth for all continents between 2003 and 2030. Rural growth is only assumed for Africa (24.6%) and Oceania (20.1%) for the aforementioned timeframe. Africa is projected to have a growth of 127.4% in urban areas, followed by Asia which will experience a growth rate of 79.7% (own calculations; based on UN, 2004b). Currently, studies reveal that small and intermediate cities display the highest dynamics indicated by their relative growth figures.
Larger cities in particular struggle to adequately meet the daily needs of an enormous number of new inhabitants. Rakodi (2005: 47) argues that SSA towns and cities are often portrayed as being in crisis. The challenges they face include rapid population growth, unaccompanied by industrialisation or economic growth, lack of economic dynamism, governance failures, severe infrastructure and service deficiencies, inadequate land administration, poverty and social breakdown. However, urban centres continue to grow and people make their livelihoods despite the severity of these challenges, a
Informal urbanisation processes in developing countries
16
phenomenon requiring a closer look. Social change in Africa is driven by and at the same time is a driver itself of rapid growth of urban population and settlement areas, including the increase in the total number of cities. Nevertheless, the actual dimensions and dynamics of these urbanisation processes are difficult to quantify, as data are often not available or comparable due to differences in data definition (Vorlaufer, 2004: 663).
4.1.3. Specific challenges in developing countries – urbanisation under poverty
Rapid urbanisation in developing countries is not only a delayed replica of development processes of today’s developed countries during their time of industrialisation and the accordant rapid growth. Its pace in the last decades is hardly comparable with industrialisation periods of the past because the figures are twice as high. During European industrialisation, natural population growth played a less important role since the main driver of population growth in urban agglomerations was rural-urban migration due to the agricultural and industrial revolutions. In developing countries, urban growth processes observable today are determined both by natural growth and migration processes. Cities in general exhibit lower mortality rates and because of their young demographic structures, moreover, show high birth rates. And due to the fact that for Africa even the rural parts are projected to gain population the future rural-urban migration potential may even increase. One of the arising problems and concurrently one main difference is that the cities cannot offer employment opportunities to the new inhabitants like for instance the European cities could during industrialisation. Nonetheless, urbanisation in developing countries focuses on big cities like metropolises and megacities (Heineberg, 2006: 34 f; Taubmann, 1985; Schrand, 1992; Bähr, 1993).
According to the International Monetary Fund (IMF) the African economy grew by 5.4% in 2005 and 2006. Nevertheless, growth in SSA remains below the levels observed in other developing regions. In addition, growth has not had an apparent impact on poverty, and only a few countries in the region might achieve the first Millennium Development Goal (MDG) of reducing extreme poverty by 50% by 2015. This disappointing performance has its roots in the slow and uneven growth of decent job opportunities (ILO, 2007: 3; citing ECA, 2005 and IMF, 2006).
In Tanzania 57.8% of the people live below the poverty line of US$ 1 per day and 89.9% live on less than 2 US$ a day (UNDP, 2007: 2040). Kombe and Kreibich take these two facts together saying that “in sub-Saharan Africa poverty is urbanising” (Kombe & Kreibich, 2006: xiii). This process poses enormous challenges for urban governments to take care of supplying people with adequate housing and building land. At the same time authorities have only few resources to improve and maintain infrastructure and services. Accordingly, the housing, health and environmental conditions are often very poor in informal settlements (World Bank, 2002: 7).
4.2. Informality
Urban informality comprises a broad range of informal activities. The emergence of informality can have manifold reasons. For example informality arises if formal activities

Informal urbanisation processes in developing countries
17
are too expensive for the poor to be conducted within the legal framework. Moreover, restrictions in access to the formal markets (e.g., defined by the legal framework or by high costs related for instance to transportation) or an insufficient fulfilment of market demands (e.g., delivery of designated housing land) can entail informality. Informality is reinforced where the state is not able to accomplish the applicable law. Nevertheless, there is a difference between informality and illegality since informal activities are not necessarily illegal. In fact, some informal activities like building a house, providing services or founding an economic enterprise rather contribute to achieve central concerns of a democratic legal system (de Soto, 1992: 44). The failure of the state can be caused by insufficient financial and personnel public capacities, an inadequate legal framework or administrative system, the behaviour of public services, etc. which result in an insufficient capability to respond to public demands like public housing or supply of surveyed and serviced plots. Those demands become subject to the informal market in form of informal enterprises, informal transport services, informal land markets to name just a few. To provide an overview on the role and problems arising with informal activities, three types of informal activities which basically frame urban poverty in the context of this work will be introduced: informal economy, informal transport and informal housing.
4.2.1. Informal economy
The informal economy includes informal enterprises which are businesses that operate in the informal sector of market economies. Older theories understood informal economic activities as a phenomenon which just occurred as an interim solution only for that period when labour force that migrates from the rural agricultural sector to urban areas cannot find a job in the formal industrial sector at once. However, studies in the 1970s showed that this phenomenon was no interim solution for migrants but an own type of employment in developing countries which often lasted lifelong and showed specific characteristics. Keith Hart introduced the term ’informal sector‘ in 1973 in the context of research in Accra, Ghana (Hart, 1973).
In the majority of SSA cities the formal economy with its regular wage employment opportunities participates only with a small proportion to the total urban employment, usually with a rate of 5-10% (except South Africa with a rate of about 25%) (ILO, 1992). Reliable data and comparable definitions are lacking and, thus, make it hard to come up with regional estimates. It is assumed that around three-quarters of activities in the urban economies of Africa are informal in nature (ILO, 2006). “In other words, 75 to 94 per cent of the active population is either unemployed or ekes out a living in the rural or informal economy where they work in precarious economic activities, without any social protection – often in an unsafe working environment” (ILO, 2003: 1). In some countries, like Tanzania, formal employment in the private sector is stagnant ever since the mid 1960s causing a situation where, particularly in cities, the public sector is the most important source of formal employment (Therkildsen, 1991; 252; Rogerson, 1997: 344). Contrarily, the informal sector in many SSA countries represents a highly dynamic and rapidly growing sector of African urban economy. For the 1990s ILO estimated that the

Informal urbanisation processes in developing countries
18
informal economy would generate about 93% of all additional jobs in urban Africa (ILO-JASPA, 1992: 39).
The informal economy consists of many different activities, including home-based work, street vendors, entrepreneurs who employ other workers, self-employed and casual workers whose work is seasonal or who work in outsourced industries covering both self-employment in informal enterprises and wage employment in informal jobs. In Africa, more than in any other region, self-employment comprises a greater share of informal employment (outside of agriculture) than wage employment (ILO, 2007: 65). Therefore, being part of the informal economy does not always mean being self-employed. ILO studies showed that a considerable proportion of the workforce, exemplarily two thirds for Abidjan, work for wages rather than profit (ILO, 1992: 39 f).
Most of these enterprises consist of very small ’survivalist‘ activities operated mainly by the urban poor of the community. “They exist alongside more substantial, competitive small enterprises which generate greater returns for their owners. These differences will have a great bearing on the extent to which enterprise activities allow their owners to escape from poverty and achieve a decent standard of living” (ILO, 2005: 241). An estimated 60% of those earning a living in the informal economy are self-employed, whereas in some African countries this figure rises to over 90% (ILO, 2002: 20). Thus, the micro-entrepreneur is often the only person working for the ’enterprise‘ which is often not perceived by its owners as a ’bona fide enterprise‘ (ILO, 2005: 241). Any increase in the enterprise’s productivity will depend only on the actions of the entrepreneur himself or herself (possibly with the aid of family members) and will convert directly into household income. Critical decisions for poor households concern the division of their gains between consumption, savings and re-investment in their enterprise (ILO, 2005: 241). “The majority of slum dwellers in developing country cities earn their living from informal sector activities located either within or outside slum areas, and many informal sector entrepreneurs whose operations are located within slums have clienteles extending to the rest of the city. (...) The informal sector is the dominant livelihood source in slums” (UN-HABITAT, 2003: xxvi).
Rogerson (1996; 1997: 347) basically distinguishes two types of informal enterprises: (i) survivalist enterprises and (ii) growth enterprises. The first category includes a set of activities undertaken by people who would be unable to have regular wage employment or access to an economic sector of their choice in the formal sector. In general these activities generate only very little income, require only little capital investment and training skills take place under poverty and are characterised by “’he desperate attempt to survive’. The second category of growth enterprises comprises very small businesses with up to four paid employees which “usually lack all the trappings of formality, in terms of business licenses, formal premises, operating permits, and accounting procedures, and most have only limited capital base as well as rudimentary business skills among their operators” (Rogerson, 1997: 347). Nevertheless, they might have the potential to develop to a larger maybe also formal-scale enterprise. But as this is only relevant for a small amount of the total enterprises Manning and Mashigo (1993: 16) describe informal growth processes as “growth through replication, or ‘extensive’ growth

Informal urbanisation processes in developing countries
19
rather than growth through ‘intensification’ or capital/skill/technology upgrading”. Often the two categories of the formal and informal economies mix up what is called the ‘informalisation of formal enterprises’ by Rogerson (1997). This is associated with an expansion of subcontracting and outwork in situations where big enterprises seek to bypass regulations of their formal economic enterprise (like employment protection or labour security) establishing business linkages to informal sector enterprises or employees.
Improvement strategies aiming at increased productivity and market access for workers and producers in the informal economy are at the core of many poverty reduction initiatives in Africa. Promoting decent work in the informal economy requires an integrated approach that includes access to mainstream business services and programmes and respect for fundamental rights and provision of social protection (ILO, 2007: 6). To meet the targets of the MDGs by 2015, a number of key challenges have to be addressed in Africa. Some of them are of course of global nature, but many are very specific to the continent, and “those that have a direct bearing on African countries’ labour markets stand out: the weakness of the public and private sectors, the huge size of the urban informal economy and the lack of modernization and/or transformation of the rural sector. Ensuring that Africa’s most valuable resource, the honest hard work of its women and men, is fully utilized and fairly rewarded places great responsibility on the roles and functions of African employers’ and workers’ organizations and ministries of labour, employment and social affairs” (ILO, 2007: 5).
The extent of informal economic activities (and a similar argumentation accounts for informal transport and housing activities) also has enormous implications for public authorities and urban governance for example due to the reduced tax revenues and the associated consequences like for example constrained financial capacities for the provision of basic infrastructure services, security and safety.
4.2.2. Informal transport
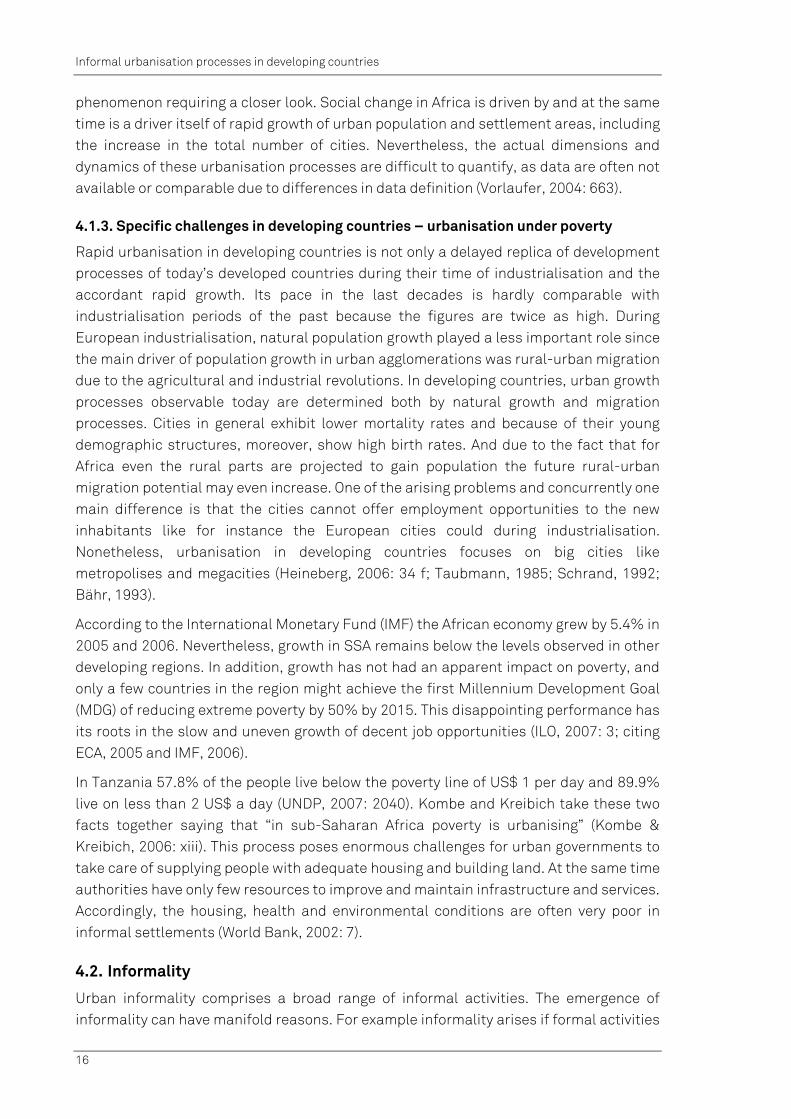
In parallel to informal activities in the economic and housing sectors informal activities can be observed in (parts of) the public transport system. As the public transport sector constitutes the cornerstone of mobility in most urban areas of the developing world the contribution of the informal sector to the functioning of the cities cannot be neglected. In general, the emergence of informal transportation activities follows the urban expansion providing services to areas which experience growth or just start to change from vacant areas into areas of residential or other urban uses. Thus, informal transport routes are often the basic supplier of transport services for informal settlers whereas the formal public transport network often only serves the formal residential areas (de Soto, 1992: 113). There is evidence that in many African cities privately-run taxis or minibuses have become important modes of transport sometimes even being the actual backbone of the transport system – examples are ’matatus‘ in Nairobi or ’dalla dallas’ in Dar es Salaam (Lee-Smith, 1989; Kulaba, 1989) or ‘emergency taxis’ in Harare and ’zola budds‘ in South Africa (Potts, 1997: 481). In addition, bicycle taxis have established in Dar es Salaam which service those areas where dalla dalla buses do not operate. Bicycle
Informal urbanisation processes in developing countries
20
taxis pick up passengers at dalla dalla routes and are very flexible concerning the destinations of clients (see Figure 7).
Figure 7: Examples for informal transport modes in Dar es Salaam: dalla dalla buses (left) and bicycle taxis (right)
Source: Own photographs, 2007
In many SSA countries, after independence public transport was classically a public monopoly either run as a parastatal bus company or a local government function. Soon, the public transport systems exhibited incapacities caused by “shortages of foreign exchange for parts and new buses and poor management. Increasingly, the public monopoly has been supplemented or replaced (legally or illegally) by private operators, a trend that increased its momentum with economic liberalization” (Rakodi, 1997d: 579), despite the fact that often public authorities were reluctant to permit these facilities. For example in Tanzania dalla dallas are officially allowed since 1983 (Stren, 1989).
This trend resulted in an improved situation but was soon inverted as the public sector was not able to provide and maintain a suitable road network. Based on findings for Lagos, Abiodun (1997: 209) gives three reasons for problems of public authorities to provide efficient transportation systems:
Institutional problems as the biggest problem result from uncoordinated involvement and responsibilities of various institutions when it comes to the supply of infrastructure and services.
Technical problems are caused basically by the inherent physical characteristics of many areas concerning for example drainage.
Social problems are related to a low level of traffic discipline when it comes to the observance of traffic laws and regulations.
The combination of institutional and technical problems leads to a patchy road network and bad road conditions (particularly in those areas that are serviced by the informal transport sector only). Insufficient maintenance of the vehicle fleet, speedy driving to increase narrow profit margins, and driving commissions deteriorate the reputation of informal transportation services. Moreover, transportation prices are high and many of

Informal urbanisation processes in developing countries
21
the urban poor even cannot afford these services so that an early start and a long walk by feet to work are the usual strategy to many urban poor (Potts, 1997: 481).
Today, in Dar es Salaam large parts of the operation of dalla dallas are regulated by the Transport Authority and, thus, no longer informal. The Transport Authority issues licenses, designates and allocates routes, inspects and approves vehicles to be appropriate for public transport. Many dalla dalla operators, therefore, pay a variety of taxes to the central and local governments. Concluding, for Dar es Salaam the informal transport sector is constituted by unlicensed dalla dallas, bicycle taxis, and push karts.
As transport services basically follow the emergence of informal settlement, no matter what the road conditions are like, the existence of roads is a fundamental variable to be considered when modelling informal residential location decisions.
4.2.3. Informal housing
As many urban residents are poor they cannot afford to participate in the formal housing market. Some of them even cannot afford housing at all. Therefore, most of population growth is “absorbed into informal settlements” (World Bank, 2002: 7). Regarding the urban poor housing is one of the key challenges for urban and regional planning in developing countries. Sliuzas highlights the fact that “both land and housing are topics for public sector concern and regulation, and both therefore receive considerable attention from organisations involved in urban planning and management” (2004: 37). But due to its capacity and resource constraints the public sector cannot keep pace with the demand and, thus, informal settlements have been the dominant sector in housing supply in the last decades in most African countries. In 2005, 922 million people lived on the African continent, 36% of them in urban areas which corresponds to 349 million urban dwellers in Africa2. 51% of the urban dwellers lived in so called slums3. In Tanzania, 66% of the inhabitants lived in slums according to the UN which are called ’mabanda‘ in Kiswahili. Slums emerge due to some basic shaping forces like income inequality, lack of economic growth and immigration basically due to rural urban migration leading to urban poverty which in combination with a lack of affordable housing breeds the formation of slums (see Figure 8).
2 Share of urban population: Proportion of the midyear de facto population living in areas classified as urban according to the criteria used by each country or area (UN, 2008c). 3 Percentage living in slums: Proportion of the urban population living in slum areas at midyear 2005. Slum households are identified by UN-HABITAT as urban households lacking one or more of the following: durable housing; sufficient living area; access to an improved water source; access to improved sanitation; or secure tenure. Source: United Nations Human Settlements Programme (UN-HABITAT), Global Urban Observatory calculations, Report on Progress on the MDGs, Target 7, Nairobi, Kenya, 2007.

Informal urbanisation processes in developing countries
22
Figure 8: Inequality, poverty and slum formation
Source: UN-HABITAT, 2003: 17
“The expansion of informal settlements reflects the gap between demand for land and its provision by the public sector and the private formal sector, unable or unwilling to provide housing for the poor. It can thus be viewed as a response on the part of poor households excluded from urban housing markets and who cannot afford to pay formal market rents to reside in cities. In Africa and Asia, these exclusion processes are fuelled by rural-urban migration and urban population growth” (Durand-Lasserve & Selod, 2007: 6). Rakodi stresses that “access to land is the single most important component in housing production” (1997c: 393) which has been stressed by the findings of the Dar es Salaam Megacities research project where interviews with residents of informal settlements showed that the most important criteria for choosing to settle in an informal settlement is the availability of affordable land (Kreibich et al., 2008).
”Slums are a physical and spatial manifestation of urban poverty and intra-city inequality. However, slums do not accommodate all of the urban poor, nor are all slum dwellers always poor” (UN-HABITAT, 2003: xxvi). Gilbert (2007: 699) describes the term ‘slum’ as being popular “to describe ‘bad’ shelter. It is used at varying scales: anything from a house to a large settlement can be classified as a slum providing that it is perceived to be substandard and is occupied by the poor”. The demarcation of slums is difficult as definitions vary from country to country inter alia depending on the national standards and the degree of development. Nevertheless, UN-HABITAT gives a worldwide definition of a slum (referring to a UN Expert Group Meeting (EGM) held in Nairobi in 2002) for future international usage. This is supplemented by a set of indicators plus thresholds to make this definition operational. Accordingly, a slum is areas that combine the following characteristics (restricted to the physical and legal characteristics of the settlement, and excluding the more difficult social dimensions):
inadequate access to safe water,
inadequate access to sanitation and other infrastructure,
poor structural quality of housing,

Informal urbanisation processes in developing countries
23
overcrowding,
insecure residential status (UN-HABITAT, 2003: 12), and
spatial disorder.
Excursus: Slums and informal settlements
There is a broad variety of different terms all around the world to describe mostly the same phenomenon: Slums, informal settlements, illegal settlements, squatters, squatter settlements, favelas or ghettos just to name a few. Surprisingly the term ‘slum’ has experienced a revival in recent scientific debate. This is basically due to the “Cities Without Slums” initiative by the World Bank and UNCHS (Habitat) (World Bank and UNCHS (Habitat), 2000) which has been endorsed internationally and, thus, at the highest political level as a “challenging vision with specific actions and concrete targets to improve the living conditions of the world’s most vulnerable and marginalized urban residents” (Gilbert, 2007: 697). The goals of that initiative were documented in the book “The Challenge of Slums” (UN-HABITAT, 2003). Gilbert blames the initiative to have “resuscitated an old and dangerous term from the habitat vocabulary. The use of the word ‘slum’ will recreate many of the myths about poor people that years of careful research have discredited. The UN has employed the word in order to publicise the seriousness of urban problems and to improve its ability to attract funding with which to tackle the issue. But in using such an emotive word the UN risks opening a Pandora’s box. The campaign implies that cities can actually rid themselves of slums, an idea that is wholly unachievable.” (Gilbert, 2007: 697). Nevertheless since then, the term slum has been used to describe the main focus of some famous books: “Planet of slums” (Davis, 2006), “Slumming India: A chronicle of slums and their saviours” (Verma, 2003) or “Welcome to the Bangkok slaughterhouse: the battle for human dignity in Bangkok’s bleakest slums” (Maier, 2005). However, in the context of this work the term ‘informal settlement’ will be used synonymously to the term ‘slum’ but without any inherent connotation. Nevertheless, the authors prefer the term ‘informal settlement’ particularly for the context of Dar es Salaam, as in Tanzania there are very few slums in the strict sense and the term ‘mbanda’ is not used at all.
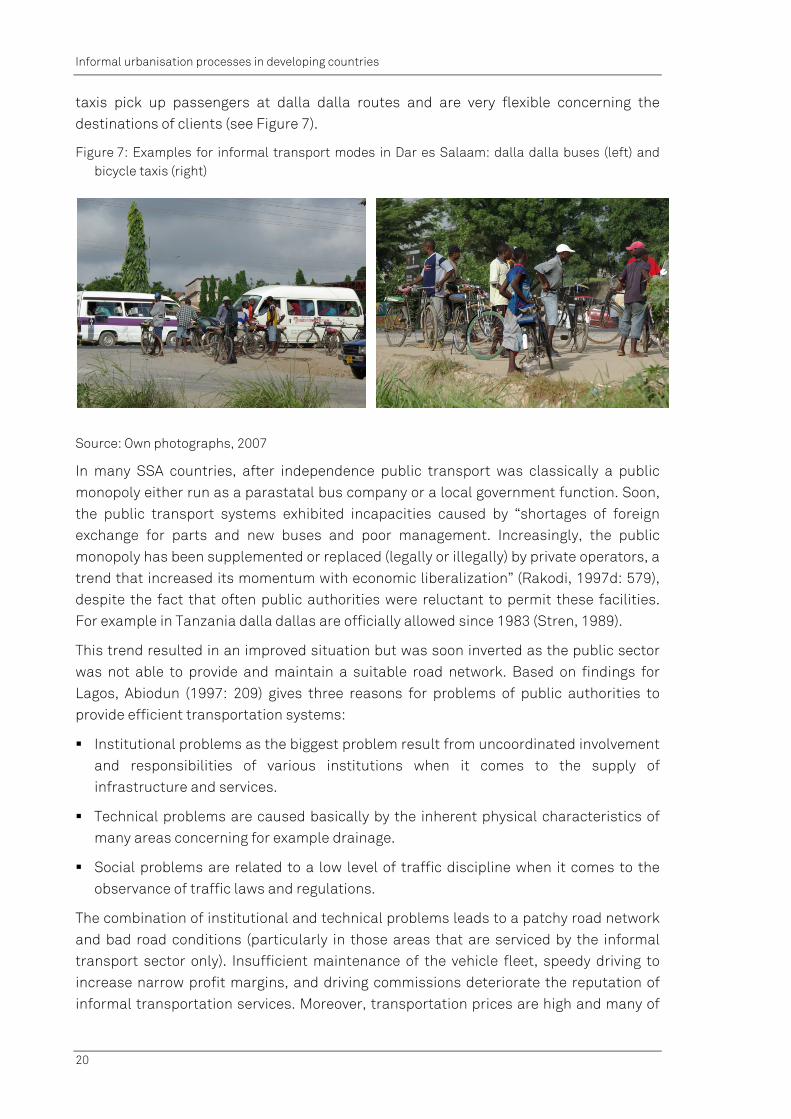
Tenure informality is a key element of informal settlements. “Land tenure designates the rights individuals and communities have with regard to land, namely the right to occupy, to use, to develop, to inherit, and to transfer land. Land tenure should thus primarily be viewed as a social relation involving a complex set of rules that governs land use and land ownership” (Durand-Lasserve & Selod, 2007: 4). The practice in developing countries is often based on a mixture of different laws and ownership patterns that coexist and form a so called continuum in land tenure rights (see Figure 9) embracing a broad variety of land tenure categories ranging from totally informal types to full ownership (Durand-Lasserve & Selod, 2007: 4).
Informal urbanisation processes in developing countries
24
Figure 9: Continuum in land tenure right
Source: Durand-Lasserve & Selod, 2007: 5
Durand-Lasserve and Selod (2007: 6) basically distinguish two types of informal settlement development:
Unauthorised commercial land developments, and
squatter settlements.
The first type of informal development often takes place on privately owned land which is subdivided illegally (usually by informal developers) and subsequently sold as plots. The subdivision is illegal because it either violates zoning or planning regulations or the required permission for the subdivision of land was not obtained. Squatter settlements can emerge on either private or public land where the land is basically occupied against the will of the land owner. Other distinctions between cases of informal settlements can be drawn considering “the primary tenure rights on the land which is informally occupied. It is important to distinguish public land (whether public or private domain of the State and of local governments) from land privately owned by individuals and institutions, and from communal or customary-owned land (on which the use and allocation of land is under the control of a community” (ibid.).
The chronological process of transforming vacant or agricultural land into residential land is inverted for informal settlements compared to formal settlements (see Figure 10). Whereas in formal procedures the normal course of events in general starts with the acquisition of the title of ownership, subsequently followed by the provision of services like roads, water and electricity afterwards buildings are constructed and finally the inhabitants move in. The informal procedure completely inverts the order of these steps as it starts with the invasion of the plots by the informal settlers. At that point of time the plot basically is not equipped with any services or urban fabric and invaders

Informal urbanisation processes in developing countries
25
basically construct simple huts or directly start to work on buildings. This situation might last for decades before the provision with technical infrastructure for basic services starts and utility providers decide to supply services or the residents find alternative ways to supply themselves. However, the attainment of ownership titles might mark the end of a long process in the informal housing sector (de Soto, 1992: 48 ff).
Figure 10: Procedures of formal and informal housing supply
Source: Own illustration; based on de Soto, 1992: 48 ff
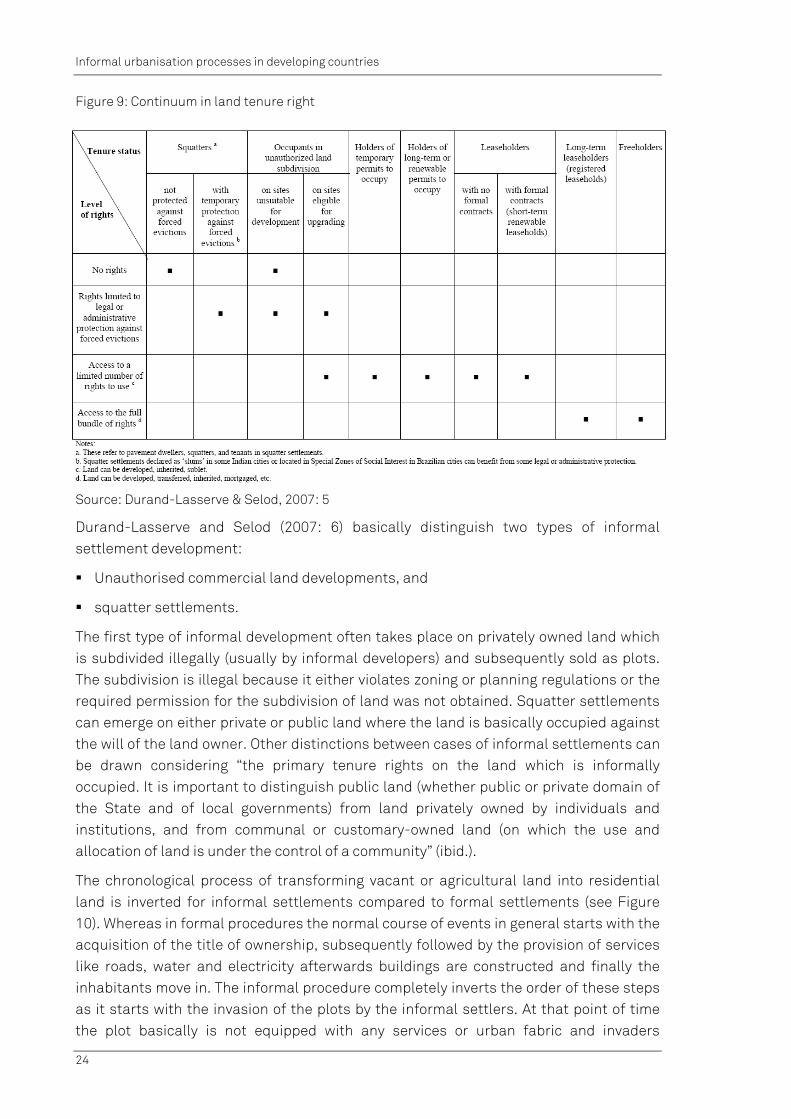
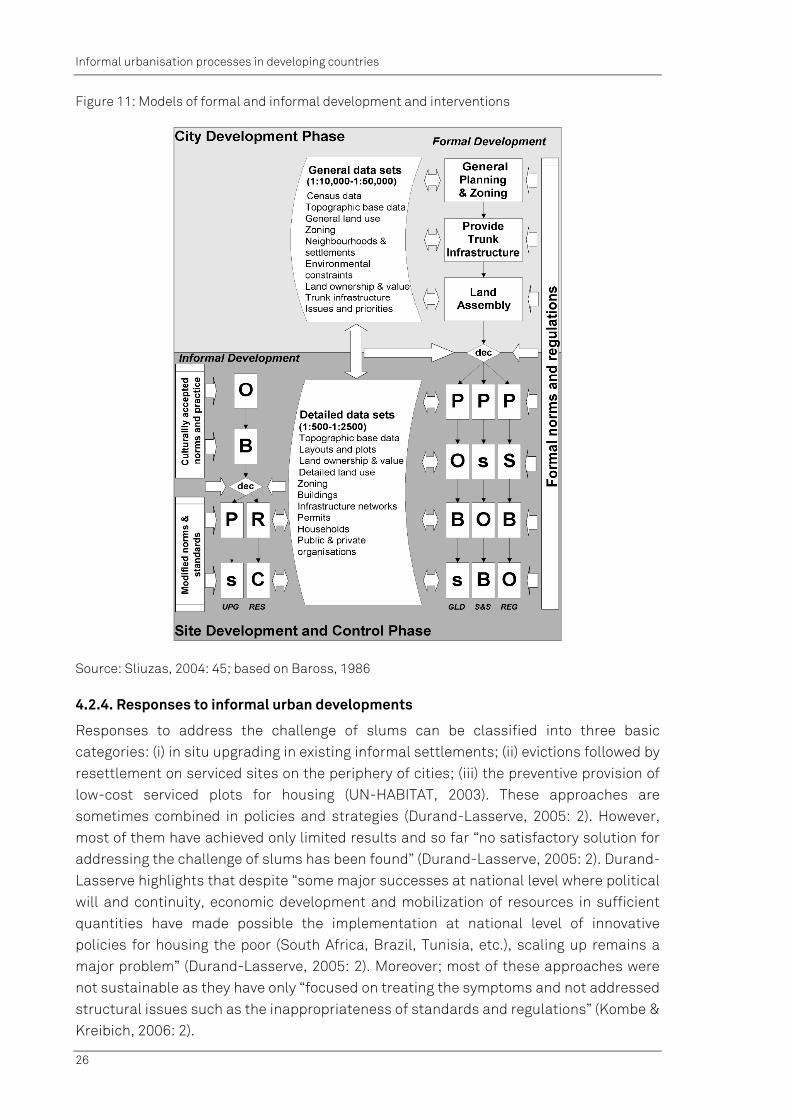
In order to describe the four steps of informal housing development Sliuzas (2004) refers to the formal PSBO model (Baross, 1986). This model divides the formal urban development process into two phases: city development phase and site development phase. The city development phase includes land-use zoning, trunk infrastructure provision and land assembly to prepare the land for actual site development. The subsequent site development phase includes the four steps abbreviated as PSBO: (P) detailed planning of subdivision layouts and land-use allocation on the plot level; (S) provision of minor infrastructure and services; (B) building of required structures; and (O) (land) occupation by the users (Sliuzas, 2004: 39 f). This sequence defines the regular procedure but can also vary as can be seen in Figure 11. For example the Guided Land Development approach (GLD) changes the sequence to POBs, the Sites and Services approach (S&S) transforms it into PsOB.
For the informal development Baross defines the procedure to be OBPs representing settlement upgrading processes (UPG). Sliuzas has extended this overview of procedures by adding a OBRC sequence representing resettlement schemes (RES) whereas R stands for resettlement and C for clearance (2004: 45).
Informal urbanisation processes in developing countries
26
Figure 11: Models of formal and informal development and interventions
Source: Sliuzas, 2004: 45; based on Baross, 1986
4.2.4. Responses to informal urban developments
Responses to address the challenge of slums can be classified into three basic categories: (i) in situ upgrading in existing informal settlements; (ii) evictions followed by resettlement on serviced sites on the periphery of cities; (iii) the preventive provision of low-cost serviced plots for housing (UN-HABITAT, 2003). These approaches are sometimes combined in policies and strategies (Durand-Lasserve, 2005: 2). However, most of them have achieved only limited results and so far “no satisfactory solution for addressing the challenge of slums has been found” (Durand-Lasserve, 2005: 2). Durand-Lasserve highlights that despite “some major successes at national level where political will and continuity, economic development and mobilization of resources in sufficient quantities have made possible the implementation at national level of innovative policies for housing the poor (South Africa, Brazil, Tunisia, etc.), scaling up remains a major problem” (Durand-Lasserve, 2005: 2). Moreover; most of these approaches were not sustainable as they have only “focused on treating the symptoms and not addressed structural issues such as the inappropriateness of standards and regulations” (Kombe & Kreibich, 2006: 2).

Informal urbanisation processes in developing countries
27
The negative image of informal settlements and the revival of the term slum have been discussed above. There was a general shift observable during the last decades which directed efforts into another direction. “National approaches to slums, and to informal settlements in particular, have generally shifted from negative policies such as forced eviction, benign neglect and involuntary resettlement, to more positive policies such as self-help and in situ upgrading, enabling and rights-based policies. Informal settlements (...) are increasingly seen by public decision-makers as places of opportunity, as ‘slums of hope’ rather than ‘slums of despair’” (UN-HABITAT, 2003: xxvi). Accordingly, later strategies aimed at improving the living conditions of slum dwellers rather than attempts to get rid of them. This shift in official policy was inter alia due to a change of scientific and public bodies’ attitudes and the recognition that informal housing contributes to the provision of housing for the urban poor when the formal housing system fails. An understanding emerged that “investment in city-wide infrastructure is a precondition for successful and affordable slum upgrading, as the lack of it is one strong mechanism by which the urban poor are excluded, and also by which improved slum housing remains unaffordable for them. At the core of efforts to improve the environmental habitability of slums and to enhance economically productive activities is the provision of basic infrastructure, especially water and sanitation, but also including electricity, access roads, footpaths and waste management. Experience has shown the need for significant investment in city-wide trunk infrastructure by the public sector” (UN-HABITAT, 2003: xxviii). However, in many developing countries the liberalisation of land markets and land titling programmes originally aiming at economic development and poverty reduction (World Bank, 2003) “are increasing the market pressure on urban low-income settlements, and this in a global context where resources generated by economic growth are rarely allocated to housing and resettlement projects for the low-income groups” (Durand-Lasserve, 2005: 2).
There have been a lot of policies and initiatives undertaken - also in Dar es Salaam - in the last decades to react to the development of informal settlements: slum upgrading, slum clearances or the mobilisation of more resources to increase the supply of surveyed and serviced plots. In the 1960s the growth of informal settlements was countered with slum clearances. Its objective was to get rid of the eyesores of squatter housing by demolishing the building stock and improve housing for the poor by developing high-standard housing on the cleared sites. In the 1970s the ‘Sites and Services and Squatter Upgrading’ (SSU) Programme was initiated by the World Bank and directed to countries in Asia, Latin America, and Africa. These housing strategies were accompanied by a more general shift in development aid policy as the “recognition of urban bias in spatial investment and non-spatial policies by the 1970s led to an overreaction. Aid flows switched almost entirely to rural development, with the partial exception of those from the World Bank and USAID” (Rakodi, 1997b: 55). A more recent example is the ‘Cities without Slums’ initiative by the World Bank and UNCHS which is part of the ‘Cities Alliance’ (World Bank & UNCHS (Habitat), 2000) (for more examples and further details see Kombe & Kreibich, 2006).

Informal urbanisation processes in developing countries
28
Some of the strategies were part of a more integrated development approach as they were developed or applied in a greater planning framework such as the preparation of Dar es Salaam masterplans (the latest dates back to 1979) or the introduction of the ‘Environmental Planning and Management’ (EPM) approach to manage the city’s development the outcomes of which include the re-organisation of traffic routes, formalisation of the informal sector, introduction of squatter/unplanned upgrading schemes and the ‘Sustainable Dar es Salaam Project’ (SDP) which proposes the establishment of satellite towns (URP, 2006: 3).
Recently, an initiative on the formalisation and regulation of informal settlements was established which deals with adjudication, demarcation, spatial planning, and issuance of licenses and eventually titles. In the long run, this programme might restraint informal subdivision and transactions and may, thus, prevent excessive densification in informal settlements.
4.2.5. Informality, regulation, and welfare
Rapid urban growth under poverty raises enormous challenges towards a sustainable development of urban systems. In the developing world responses to these challenges are normally inadequate and weak due to the lack of capacities of public bodies and dysfunctional urban economies. The formal land markets do not reach the majority of the urban population. The urban poor are still excluded as land prices in the formal sector are too high to be affordable under the given framework conditions (in particular the conditions of access) and, additionally, the total amount of supplied plots is far too low to satisfy the demand. Public authorities cannot fulfil their basic duty to counter market failures and the related negative externalities in order to promote welfare particularly enabling the urban poor to benefit from public goods and services.
Thus, in order to make their living in the urban environment settlers rely on and participate in the informal sector. This includes the supply with building plots for erecting houses, informal transportation as well as informal businesses in order to cope with the daily challenges of urban life. These activities are normally survivalist in orientation and crucial in order to meet service and supply shortages. Unfortunately, these survival strategies are rarely optimal or sustainable as they frequently cause negative impacts on the urban system for example concerning health or environmental issues. In this concern, sanitation and water supply (see Figure 12) are two crucial aspects (Potts, 1997: 482).

Informal urbanisation processes in developing countries
29
Figure 12: Examples for informal water supply in Dar es Salaam: water kiosk in the informal settlement of Matangini (left), water truck (middle) and water vendors selling tapped water in little plastic bag along the roads (right)
Source: Own photographs, 2006
In addition, these survival strategies are often linked with an extra cost-inefficiency as the supply with services via the informal sector is normally more expensive than via the public sector. Although the urban poor might know about this fact they do not have the financial resources that are needed at a specific point in time to be able to access the formal markets. Thus, they are forced to pay more for informal services after having entered the informal land or housing market. Studies have shown that, in the end, the urban poor often pay the same amount of money in total or even more (when summing up their expenditures for housing and basic services on the informal market over an assumed period of twenty or thirty years) than urban citizens who participate in the formal land and housing market and use public infrastructure and services (see Figure 13).

Informal urbanisation processes in developing countries
30
Figure 13: The costs of being beyond the utility
Source: UNDP, 2006: 52
It has to be mentioned that the urban poor seem to be captured in poverty as the framing conditions do not allow them to save money. Informal activities force them to spend more money than others to fulfil their needs. There is a need to put more focus on the overarching framework to get rid of the burdens that separate the urban poor from the formal markets. Rajack highlights the importance of the land market, the credit market, infrastructure bottlenecks, and the need to use policies to target specific constraints. He suggests not to suppress market indicators like land prices through land policies but rather to let them guide land use. In his understanding redistribution should be realised by demand-side subsidies (Rajack, 2008). In contrast to all the shortcomings as described above the authors would also like to stress the fact that the informal sectors and the urban poor do have a recognisable power and impact on the form and character of a city. Gulyani and Talukdar presented evidence from research in Nairobi, Kenya’s capital, that the amount of money that informal dwellers spend to rent their homes sums up to US$ 31 million and, thus, is higher than the city budget for investment, operations and maintenance (Gulyani & Talukdar, 2007).
However, the urban poor are largely excluded from the positive effects of urban economies of scale and at the same time they are above-average exposed to negative

Informal urbanisation processes in developing countries
31
externalities like air pollution, diseases, and environmental hazards. In conclusion, governments, local authorities, and other stakeholders involved in urban management should intervene into the market processes in a regulating or steering manner. To counter the externalities arising from market mechanism these stakeholders have to establish supportive framing conditions for the informal sectors enabling the urban poor to contribute to and participate in urban welfare, too. If the state is too weak to make informality dispensable, it may accept and legalise informal activities and support the informal sector to contribute its part to meet market demands.
4.3. Emergence of megacities and development challenges
The 21st century is said to be the century of cities. Thus, cities will be of major importance for the global future. There exist various approaches to a delineation and classification of cities. Some of them merely focus on population figures, others basically on economic functions which they fulfil in a global context. A brief introduction to some approaches to classify cities according to their size in terms of population or functions shall be given and some of the approaches dealing with urban classifications will be briefly introduced. The focus will be put on so called metropolises and megacities in order to put the spatial phenomena which are observable in Dar es Salaam into a broader scientific context. Additionally, problems and challenges associated with the phenomenon of rapid urban growth in developing countries will be sketched to illustrate the specific characteristics of urban dynamics accompanied by poverty.
Around 1700 there existed about 70 large cities all over the world of which 60 were located in the southern hemisphere and only 10 in the northern one, i.e., Europe. This dominance lasted until 1800. Industrialisation fostered urban development in Europe and other parts of the northern hemisphere leading to equilibrium between both sides of the globe already around 1850. Until 1900 Northern America and other new economies had emerged resulting in a clear dominance of urban concentration in the Northern hemisphere. Due to decelerate growth in the developed countries and an increased growth in the cities of the south in 1970 this ratio had inverted again: with more than 1,000 cities the southern hemisphere. This number further increased to 1,500 in 1990 and 2,000 in 2000 (Ribbeck, 2005: 13 f).
Because of the basic urbanisation trend in the last decades a number of megacities emerged all around the world. In 1950 only one megacity with more than 10 million inhabitants existed: New York with 12.3 million inhabitants. In 1975 the number had increased to five, in 2000 there were already 19 megacities, and for 2015 the number is assumed to be 22 (UN, 2006a). The figures for the total number and size of megacities vary due to the constraints of reliable information on population figures particularly in developing countries and due to the applied urban delineation methods. However, UN estimations assume high growth rates for megacities in developing countries leading to the emergence of more cities with 5 or 10 million inhabitants. Figure 14 illustrates the large cities of Africa giving the number of inhabitants in 2007 and population projections for 2025.

Informal urbanisation processes in developing countries
32
Figure 14: Large cities in Africa in 2007 and 2020
Source: Le Monde Diplomatique, 2009: 139
Today, megacities (with more than 10 million inhabitants) are home to almost 10% of the global urban population. Their pace of growth in the past has been slower than that of cities with 5-10 million people. Bronger assesses the phenomenon which he calls ‘megapolisation’ as one that is very young in terms of global history and so far unknown and unpredictable concerning its dynamics (Bronger, 1989: 4). During the last decade these processes have aggravated all around the world and the broad field of scientific discussions and publications and its dynamics reflect this. Heineberg adds that before World War II the phenomenon of megacities was restricted to the industrialised or developed countries but today it can mainly be found in developing countries with most megacities being located in Newly Industrialising Countries (NICs) (Heineberg, 2006: 339).

Informal urbanisation processes in developing countries
33
Figure 15: Number of megacities (more than 5 million inhabitants) in developed and developing countries in 1900, 1950 and 2000.
Source: Own illustration; based on Bronger, 2004: 38
Megacities as an urban category are characterised by some type of dualism. “Urbanization as a social phenomenon and the physical transformation of living space has become one of the most radical processes of global change. The megacities formed as a result of globalization are now beginning to put their stamp on global ecological, economic, social and indeed political change. On the one hand the established world metropolises, like the new megacities, with their concentration of political power, human capabilities and capital, are hubs of globalization with major potential. On the other hand it is precisely the megacities, due to their susceptibility to natural disasters, ecological overload, supply problems and the threats posed by poverty, disease and violence, which have become the risk areas of global change” (Federal Foreign Office, 2006: 3).
These facts already point at one of the problems concerning the exploration of megacities in the scientific debate. Due to high dynamics of urbanisation worldwide the understanding of what can be called a megacity has changed in the last decades and will also change in the future. Thus, the evolution of defining a megacity reflects the need for adaptation from time to time (Zlotnik, 2004: 48; Schwentker, 2006: 10 f). So far, there has not been any commonly accepted definition. However, some of the approaches to develop a definition of what is to be called a megacity will be presented in the following.
Back in the 1970s Jacobson and Prakash recognised the fact that global development in the last decades was characterised by urbanisation and in particular by an intensified emergence of large urban agglomerations. Thus, in a publication dealing with East and South-East Asia they proposed a classification that accounted for the observed urbanisation trends and further differentiated large urban agglomerations. The
25
11
0 1
34
0
5
10
15
20
25
30
35
40
1900 1950 2000
num
ber o
f meg
acit
ies
yeardeveloped countries developing countries
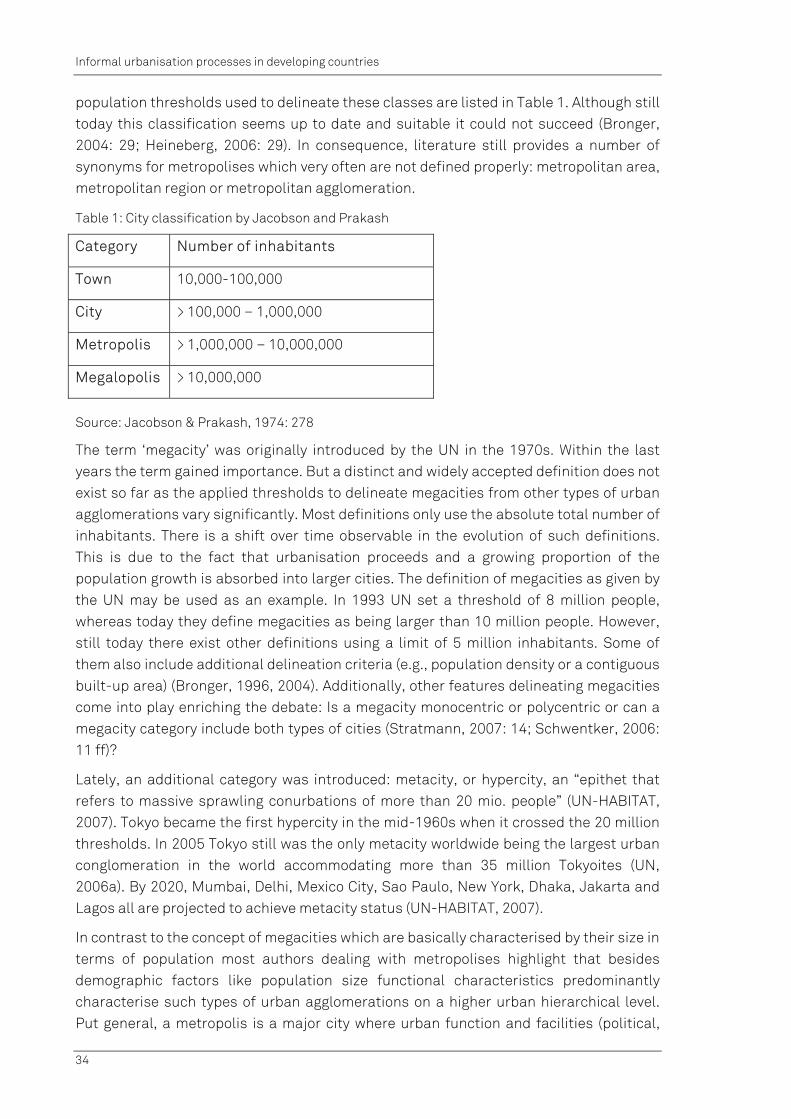
Informal urbanisation processes in developing countries
34
population thresholds used to delineate these classes are listed in Table 1. Although still today this classification seems up to date and suitable it could not succeed (Bronger, 2004: 29; Heineberg, 2006: 29). In consequence, literature still provides a number of synonyms for metropolises which very often are not defined properly: metropolitan area, metropolitan region or metropolitan agglomeration.
Table 1: City classification by Jacobson and Prakash
Category Number of inhabitants
Town 10,000-100,000
City > 100,000 – 1,000,000
Metropolis > 1,000,000 – 10,000,000
Megalopolis > 10,000,000
Source: Jacobson & Prakash, 1974: 278
The term ‘megacity’ was originally introduced by the UN in the 1970s. Within the last years the term gained importance. But a distinct and widely accepted definition does not exist so far as the applied thresholds to delineate megacities from other types of urban agglomerations vary significantly. Most definitions only use the absolute total number of inhabitants. There is a shift over time observable in the evolution of such definitions. This is due to the fact that urbanisation proceeds and a growing proportion of the population growth is absorbed into larger cities. The definition of megacities as given by the UN may be used as an example. In 1993 UN set a threshold of 8 million people, whereas today they define megacities as being larger than 10 million people. However, still today there exist other definitions using a limit of 5 million inhabitants. Some of them also include additional delineation criteria (e.g., population density or a contiguous built-up area) (Bronger, 1996, 2004). Additionally, other features delineating megacities come into play enriching the debate: Is a megacity monocentric or polycentric or can a megacity category include both types of cities (Stratmann, 2007: 14; Schwentker, 2006: 11 ff)?
Lately, an additional category was introduced: metacity, or hypercity, an “epithet that refers to massive sprawling conurbations of more than 20 mio. people” (UN-HABITAT, 2007). Tokyo became the first hypercity in the mid-1960s when it crossed the 20 million thresholds. In 2005 Tokyo still was the only metacity worldwide being the largest urban conglomeration in the world accommodating more than 35 million Tokyoites (UN, 2006a). By 2020, Mumbai, Delhi, Mexico City, Sao Paulo, New York, Dhaka, Jakarta and Lagos all are projected to achieve metacity status (UN-HABITAT, 2007).
In contrast to the concept of megacities which are basically characterised by their size in terms of population most authors dealing with metropolises highlight that besides demographic factors like population size functional characteristics predominantly characterise such types of urban agglomerations on a higher urban hierarchical level. Put general, a metropolis is a major city where urban function and facilities (political,
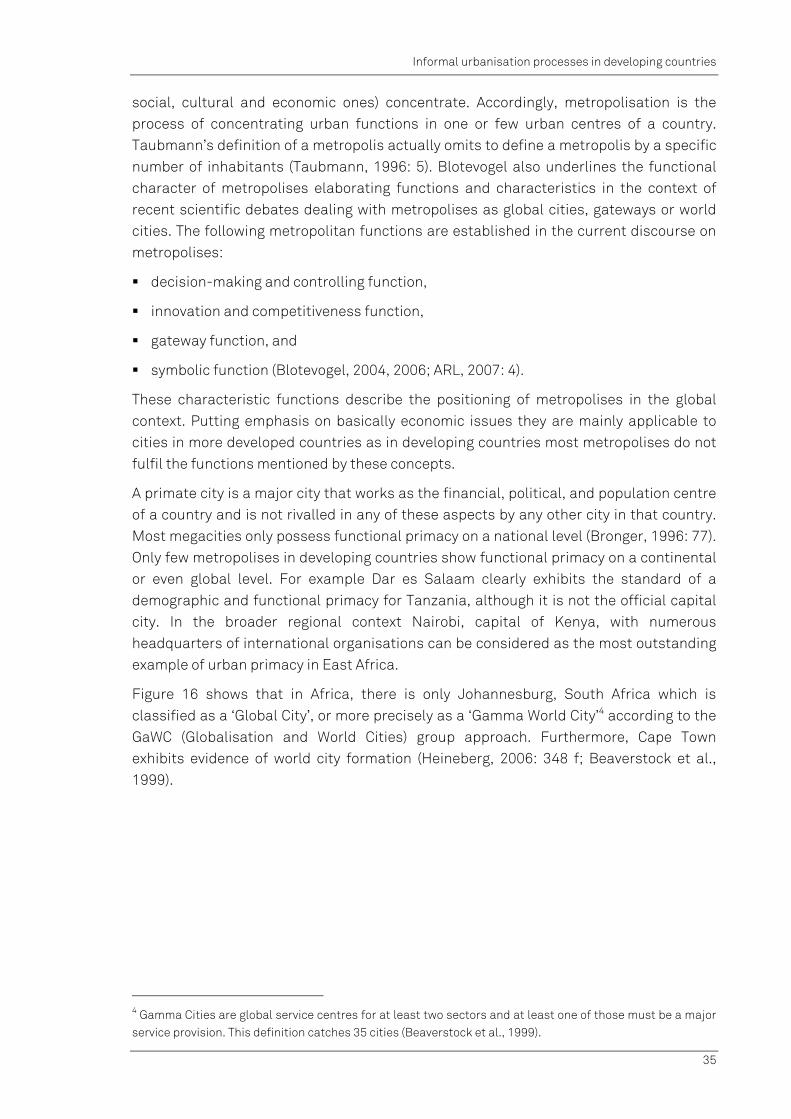
Informal urbanisation processes in developing countries
35
social, cultural and economic ones) concentrate. Accordingly, metropolisation is the process of concentrating urban functions in one or few urban centres of a country. Taubmann’s definition of a metropolis actually omits to define a metropolis by a specific number of inhabitants (Taubmann, 1996: 5). Blotevogel also underlines the functional character of metropolises elaborating functions and characteristics in the context of recent scientific debates dealing with metropolises as global cities, gateways or world cities. The following metropolitan functions are established in the current discourse on metropolises:
decision-making and controlling function,
innovation and competitiveness function,
gateway function, and
symbolic function (Blotevogel, 2004, 2006; ARL, 2007: 4).
These characteristic functions describe the positioning of metropolises in the global context. Putting emphasis on basically economic issues they are mainly applicable to cities in more developed countries as in developing countries most metropolises do not fulfil the functions mentioned by these concepts.
A primate city is a major city that works as the financial, political, and population centre of a country and is not rivalled in any of these aspects by any other city in that country. Most megacities only possess functional primacy on a national level (Bronger, 1996: 77). Only few metropolises in developing countries show functional primacy on a continental or even global level. For example Dar es Salaam clearly exhibits the standard of a demographic and functional primacy for Tanzania, although it is not the official capital city. In the broader regional context Nairobi, capital of Kenya, with numerous headquarters of international organisations can be considered as the most outstanding example of urban primacy in East Africa.
Figure 16 shows that in Africa, there is only Johannesburg, South Africa which is classified as a ‘Global City’, or more precisely as a ‘Gamma World City’4 according to the GaWC (Globalisation and World Cities) group approach. Furthermore, Cape Town exhibits evidence of world city formation (Heineberg, 2006: 348 f; Beaverstock et al., 1999).
4 Gamma Cities are global service centres for at least two sectors and at least one of those must be a major service provision. This definition catches 35 cities (Beaverstock et al., 1999).

Informal urbanisation processes in developing countries
36
Figure 16: Classification and distribution of Global Cities (above) and cities with developing tendencies towards Global Cities (below) according to GaWC group approach
Source: Heineberg, 2006: 349
Mertins (2009: 12) concluded that first of all bare population figures in a worldwide comparison do not give much evidence on the political and economic power of a city. Secondly he highlights that in an international context the megacities of the developed countries still play the most important role. Thirdly, he argues that the functionalities of large megacities in developing countries unfold only limited relevance restricted to the specific national or subcontinental level. Nevertheless, the bare population figures characterise megacities all around the world as places of challenge concerning sustainable urban future.
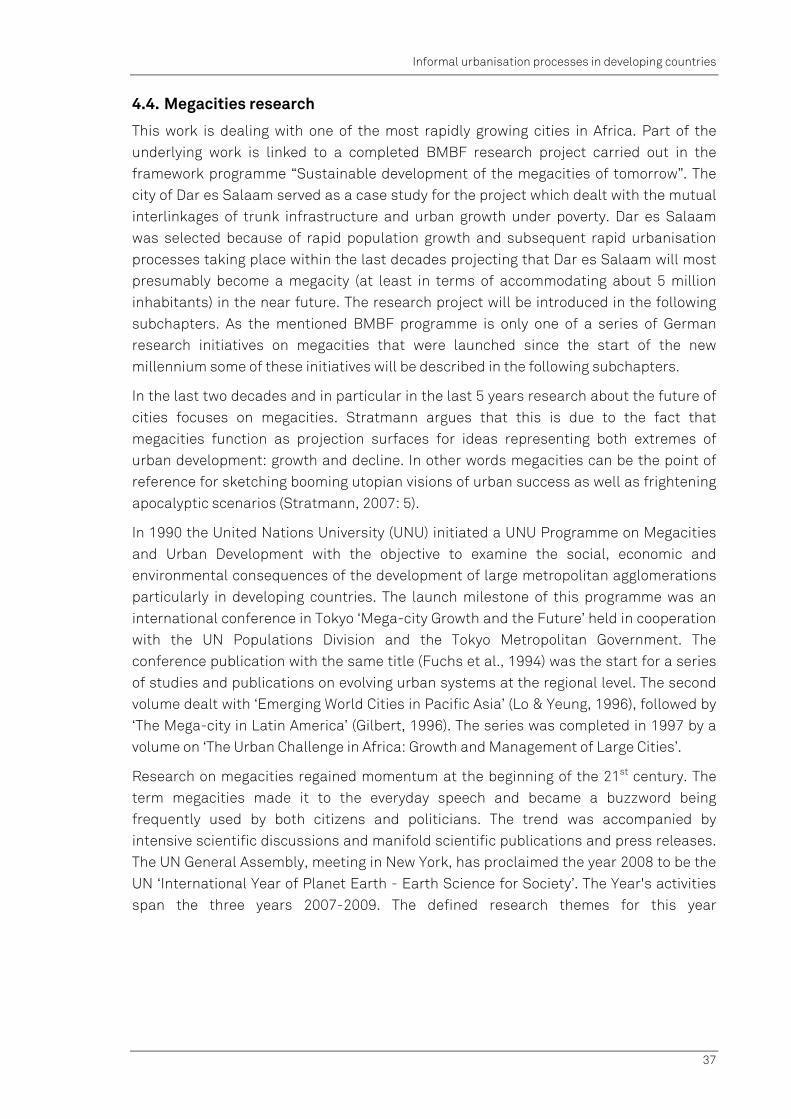
Informal urbanisation processes in developing countries
37
4.4. Megacities research
This work is dealing with one of the most rapidly growing cities in Africa. Part of the underlying work is linked to a completed BMBF research project carried out in the framework programme “Sustainable development of the megacities of tomorrow”. The city of Dar es Salaam served as a case study for the project which dealt with the mutual interlinkages of trunk infrastructure and urban growth under poverty. Dar es Salaam was selected because of rapid population growth and subsequent rapid urbanisation processes taking place within the last decades projecting that Dar es Salaam will most presumably become a megacity (at least in terms of accommodating about 5 million inhabitants) in the near future. The research project will be introduced in the following subchapters. As the mentioned BMBF programme is only one of a series of German research initiatives on megacities that were launched since the start of the new millennium some of these initiatives will be described in the following subchapters.
In the last two decades and in particular in the last 5 years research about the future of cities focuses on megacities. Stratmann argues that this is due to the fact that megacities function as projection surfaces for ideas representing both extremes of urban development: growth and decline. In other words megacities can be the point of reference for sketching booming utopian visions of urban success as well as frightening apocalyptic scenarios (Stratmann, 2007: 5).
In 1990 the United Nations University (UNU) initiated a UNU Programme on Megacities and Urban Development with the objective to examine the social, economic and environmental consequences of the development of large metropolitan agglomerations particularly in developing countries. The launch milestone of this programme was an international conference in Tokyo ‘Mega-city Growth and the Future’ held in cooperation with the UN Populations Division and the Tokyo Metropolitan Government. The conference publication with the same title (Fuchs et al., 1994) was the start for a series of studies and publications on evolving urban systems at the regional level. The second volume dealt with ‘Emerging World Cities in Pacific Asia’ (Lo & Yeung, 1996), followed by ‘The Mega-city in Latin America’ (Gilbert, 1996). The series was completed in 1997 by a volume on ‘The Urban Challenge in Africa: Growth and Management of Large Cities’.
Research on megacities regained momentum at the beginning of the 21st century. The term megacities made it to the everyday speech and became a buzzword being frequently used by both citizens and politicians. The trend was accompanied by intensive scientific discussions and manifold scientific publications and press releases. The UN General Assembly, meeting in New York, has proclaimed the year 2008 to be the UN ‘International Year of Planet Earth - Earth Science for Society’. The Year's activities span the three years 2007-2009. The defined research themes for this year

Informal urbanisation processes in developing countries
38
encompassed the topic megacities5. In Germany, this fact can be underlined by the launch of a number of research initiatives on megacities in 2005 which will be introduced in the following chapter.
4.4.1. Recent German megacities research initiatives
In Germany research took up the issue of megacities again in the last years with the following coordinated research initiatives:
German Research Foundation (DFG): Megacities-Megachallenge – Informal dynamics of global change (2005-2010),
Helmholtz Association: The megacity as risk habitat - Strategies for sustainable development of megacities and urban agglomerations (2005-2013), and
Federal Ministry of Education and Research (BMBF): Research for sustainable development of the megacities of tomorrow (2005-2013).
The DFG priority programme introduces a focus on informal development regulation into megacities research. Because of the highly complex nature of process dynamics in megacities, the eleven research projects concentrate on two megacities (Pearl River Delta (Guangzhou, Shenzhen, Hong Kong) in China and Dhaka in Bangladesh). Four main problem areas are subject to this research:
the loss of planning control and governability and the influence of new forms of governance,
the dominance and differentiation of urban economies,
the complexity and dynamics of material and resource flows, and
the multilayered dynamics of settlement development.
The aim of the programme is to develop theoretical approaches and models which are applicable for a general explanation of informal processes and structures in megacities linking social and natural sciences (website DFG; website Universität Köln; Stratmann, 2007: 82 ff).
The programme of the Helmholtz Association on megacities as risk habitats is intended to contribute to the understanding of the complex urban processes, their interactions and the feedback mechanisms characterising the systems of megacities. It aims to develop strategies to facilitate ‘urban change’ towards a more sustainable development. These strategies will focus on the management of the corresponding characteristic, interrelated and reinforcing risks that presently pose a threat to sustainable development in large agglomerations of the south. Thus, the research programme focuses on Latin American cases aiming to:
5 The research themes are: Megacities: going deeper, building safer; Groundwater: reservoir for a thirsty planet?; Hazards: minimizing risk, maximizing awareness; Earth and Health: building a safer environment; Climate change: the ‘stone tape’; Resources: sustainable power for sustainable development; Deep Earth: from crust to core; Ocean: abyss of time; Soil: Earth’s living skin; Earth and Life: origins of diversity (website ESFS).

Informal urbanisation processes in developing countries
39
identify and assess characteristic sustainability risks of megacities and large agglomerations with appropriate and locally adapted indicators,
generate insights into the driving factors behind these risks and their interdependencies,
design strategies, tools and instruments for risk management (mitigation and prevention) as key aids towards a more sustainable urban development,
develop implementation solutions that take into account the institutional, cultural, political, economic, and social aspects in megacities, and, thus, have a chance of implementation, and
build a platform for continuous learning and application to integrate academic research and practice (Helmholtz Association, 2005: 12).
The BMBF research programme ‘Sustainable development of the megacities of tomorrow’ aims at the formulation and implementation of exemplary integrated planning and management concepts for sustainable urban management in selected newly industrialising and developing countries. It primarily focuses on cities that are on their way to become megacities in the future. It considers rapidly growing large cities to offer the potential of adopting sustainable development paths. The programme aims at an integrated, action-oriented and participatory approach considering ecological, economic and social factors into a coherent concept. Project consortia should include local partners (both scientific institutions and domestic industry) to prepare the implementation of pilot projects in the megacities being dealt with. The emphasis is put on ‘prevention and therapy’ instead of just ‘diagnosis’ (website Emerging Megacities).
4.4.2. Research project MEGACITIES: DAR ES SALAAM
As part of the BMBF research programme on future megacities the research project ‘Trunk Infrastructure and Urban Growth – Managing Rapid Urbanisation in Poverty in Dar es Salaam, Tanzania’ investigated the mutual links between trunk infrastructure supply and informal urban development. The intention was to identify access points for strategic interventions into rapid urban growth under poverty. The project work was based on the following assumptions:
In the absence of effective mechanisms to implement urban development plans, informal settlements are the main vehicles of urban growth. Their location is partly determined by the availability of trunk infrastructure in combination with land market mechanisms.
The utility agencies providing trunk infrastructure (roads, piped water, sewage, drainage and electric power) are not co-ordinating their activities with each other and with the urban planning authorities. The potential to guide informal urban growth with infrastructure provision is, therefore, not utilised.
The disjointed planning and provision of trunk infrastructure prevents economies of scale and increases the unit costs of utility supply.

Informal urbanisation processes in developing countries
40
The lack of co-ordination between infrastructure provision and urban growth forces informal settlers to access utilities at extra costs often illegally, and in an unhealthy and unsafe manner.
The co-ordinated provision of trunk infrastructure can direct informal urban growth into suitable locations and at favourable unit costs.
Given this contextual framework the authors were responsible for the development of an urban simulation model representing the drivers and mechanisms of informal urban land-use changes in Dar es Salaam which is also subject of the research presented in this volume.
4.5. Interim conclusions
The aim of this work is to contribute to the understanding of large cities and in particular of the urban development dynamics that take place. Considering preceding argumentations the authors agree with the statement that megacities will be focal points for the future of cities and, thus, are relevant to be considered by respective research. Furthermore, there is evidence that Dar es Salaam is one of the most rapidly growing urban centres on the African continent.
Kraas and Mertins (2008) in a recent article on megacities in developing countries highlight four development trends that need to be tackled: vulnerability, poverty, informality and governability. Urban planning is an approach that can influence all these issues, best implemented in a holistic and integrated way. Planning can guide citizens to less vulnerable locations for their shelter. The work at hand tries to contribute to this goal by adding knowledge about the determinants and mechanisms of informal residential land-use change as an important component of urban development in one of the fastest growing cities in Africa. As urban growth is basically accompanied by poverty, the study will focus on informal settlement development processes being the core of urban development processes in rapidly growing poor urban environments with weak power of urban authorities and limited planning opportunities. It will provide a tool to support local authorities in charge of urban planning and eventually contribute to make cities around the world more liveable and sustainable places.

Urban modelling and systems theory
41
5. Urban modelling and systems theory
As described above this study aims to contribute to a better understanding of informal urban growth processes in rapidly growing cities in developing countries by investigating informal urban dynamics in Dar es Salaam. For this purpose the authors utilise the understanding of systems theory to develop a model representing informal residential location decisions that as an aggregate constitute urban change on the city level.
The following chapters will introduce the basic ideas of systems theory and urban modelling. The decision for the application of the particular modelling approach of CA in this study will be presented as well as its fundamental assumptions and mechanisms.
5.1. Systems theory
The understanding and modelling of cities as complex systems is based on the general system theory approach. This perspective of science was established in the mid 20th century when some “very clever minds of the twentieth century devoted a large proportion of their intellectual resources to thinking about transitioning from a static to a dynamic vision of natural phenomena” (Benenson & Torrens, 2004: 48) marking a “paradigm change of scientific mindset” (ibid.: 47). Ludwig von Bertalanffy was the key player in this process. It was him who finally introduced the term system theory and together with the economist Kenneth Boulding, the physiologist Ralph Gerard, and the biomathematician Anatol Rapoport he founded general systems research (Laszlo, 1972: v). They established the “project of a Society for General System Theory (...) at the Annual Meeting of the American Association for the Advancement of Science in 1954. The name was later changed into the less pretentious “Society for General Systems Research” (von Bertalanffy, 1968: 15). This caused that towards “the end of the 1960s, the ‘steady state’ paradigm exhibited signs of cracking. A number of important examples accumulated, examples in which the system’s behavior appeared to be more complex than convergence to a steady state” (Benenson & Torrens, 2004: 57).
Ackoff summed up the central points of the development of system theory in 1959 as follows: “In the last two decades we have witnessed the emergence of the ‘system’ as a key concept in scientific research. Systems, of course, have been studied for centuries, but something new has been added. (...) The tendency to study systems as an entity rather than as a conglomeration of parts is consistent with the tendency in contemporary science no longer to isolate phenomena in narrowly confined contexts, but rather to open interaction for examination and to examine larger and larger slices of nature. Under the banner of systems research (and its many synonyms) we have also witnessed a convergence of many more specialized contemporary scientific developments” (Ackoff, 1959: 145). The system theory approach offered “a common view of natural systems across all levels of organization and observation, from social and psychological to atomic and molecular” (Benenson & Torrens, 2004: 47). There had been “some philosophic speculation” (Batty, 2007b: 5) before about the idea that there might be general theory concerning the common structure and behaviour of phenomena that belong to different disciplines. But at the early 20th century in biological and engineering

Urban modelling and systems theory
42
sciences enough momentum had been made to bring this quest forward. Many of the observed processes included the transmission of information rather than material and the notion shaped that there might be a general theory applicable. Independently from the material composition of such system they had the same structure and functioning principles. It came to the fore at that time that the knowledge about the same structure and functioning of very different systems could be shared and that it was nontrivial (Benenson & Torrens, 2004: 48). “The system movement is an ‘interdisciplinary discipline’; a speciality traversing traditional specialities, and an open avenue towards general theory, linking and integrating the fragmented pieces of contemporary scientific thought” (Laszlo, 1972: 5). System movement picked up this understanding as “system theory stands for, namely (...) higher generality than that in the special sciences” (von Bertalanffy, 1968: 14).
Much of the basic work was done in disciplines like physics and chemistry but it was Norbert Wiener who broadened up the focus of work and introduced ‘cybernetics’ (Wiener, 1948, 1961). Wiener’s cybernetics were developed in the context of “recent developments of computer technology, information theory, and self-regulating machines. (...) Wiener carried the cybernetic, feedback and information concepts far beyond the fields of technology and generalized it in the biological and social realms” (von Bertalanffy, 1968: 15 f). Wiener’s approach of cybernetics gained enormous popularity in science, technology and general publicity. This was due to Wiener’s proclamation of the ‘Second Industrial Revolution’. Cybernetics as the theory of control mechanisms that can be observed both in technology and nature is founded on the concepts of information and feedback. It is part of a general theory of systems as cybernetic systems are a special case of systems showing self-regulation (von Bertalanffy, 1968: 17).
The objective of system theory to study systems as an entity rather than a conglomeration of parts is underlined by the popular quotation “the whole is greater than the sum of the parts” (von Bertalanffy, 1968: 18). This neglects that additivity is given in systems. Additivity is only given if interrelations are of linear character, then “an equation describing the behavior of the total is of the same form as the equations describing the behavior of the parts” (von Bertalanffy, 1968: 19). In contrast, systems in the sense of general system theory can be circumscribed by the existence of ‘strong interactions’ (Rapoport, 1966) or interactions which are ‘nontrivial’ (Simon, 1965). Batty highlighted this fact saying that the “system structure ‘emerged’ from the parts but that this was not simply a process of adding up the bits to get the whole” (Batty, 2007b: 7). Accordingly, system theory follows a holistic approach. Laszlo argues “that the systems movement (...) represents a new paradigm of contemporary scientific thought. It has unity through diversity (...); it is an interdisciplinary discipline, and an integrator of diverse fields of knowledge in diverse cultural and geographical locations. It is pursued on different levels, but with a remarkable consensus of basic commitments” (Laszlo, 1972: 11).
Of course cities can be understood as systems where – depending on the scrutiny – for example individuals interact which others spatially or economically. “Cities were
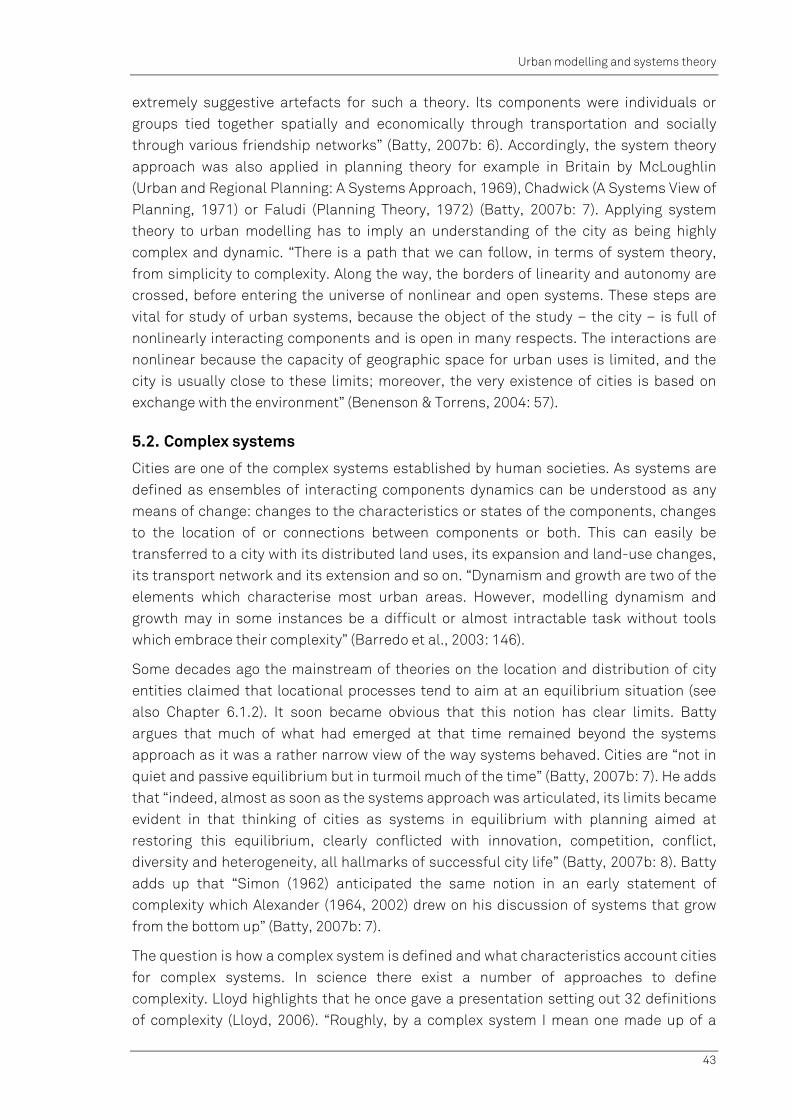
Urban modelling and systems theory
43
extremely suggestive artefacts for such a theory. Its components were individuals or groups tied together spatially and economically through transportation and socially through various friendship networks” (Batty, 2007b: 6). Accordingly, the system theory approach was also applied in planning theory for example in Britain by McLoughlin (Urban and Regional Planning: A Systems Approach, 1969), Chadwick (A Systems View of Planning, 1971) or Faludi (Planning Theory, 1972) (Batty, 2007b: 7). Applying system theory to urban modelling has to imply an understanding of the city as being highly complex and dynamic. “There is a path that we can follow, in terms of system theory, from simplicity to complexity. Along the way, the borders of linearity and autonomy are crossed, before entering the universe of nonlinear and open systems. These steps are vital for study of urban systems, because the object of the study – the city – is full of nonlinearly interacting components and is open in many respects. The interactions are nonlinear because the capacity of geographic space for urban uses is limited, and the city is usually close to these limits; moreover, the very existence of cities is based on exchange with the environment” (Benenson & Torrens, 2004: 57).
5.2. Complex systems
Cities are one of the complex systems established by human societies. As systems are defined as ensembles of interacting components dynamics can be understood as any means of change: changes to the characteristics or states of the components, changes to the location of or connections between components or both. This can easily be transferred to a city with its distributed land uses, its expansion and land-use changes, its transport network and its extension and so on. “Dynamism and growth are two of the elements which characterise most urban areas. However, modelling dynamism and growth may in some instances be a difficult or almost intractable task without tools which embrace their complexity” (Barredo et al., 2003: 146).
Some decades ago the mainstream of theories on the location and distribution of city entities claimed that locational processes tend to aim at an equilibrium situation (see also Chapter 6.1.2). It soon became obvious that this notion has clear limits. Batty argues that much of what had emerged at that time remained beyond the systems approach as it was a rather narrow view of the way systems behaved. Cities are “not in quiet and passive equilibrium but in turmoil much of the time” (Batty, 2007b: 7). He adds that “indeed, almost as soon as the systems approach was articulated, its limits became evident in that thinking of cities as systems in equilibrium with planning aimed at restoring this equilibrium, clearly conflicted with innovation, competition, conflict, diversity and heterogeneity, all hallmarks of successful city life” (Batty, 2007b: 8). Batty adds up that “Simon (1962) anticipated the same notion in an early statement of complexity which Alexander (1964, 2002) drew on his discussion of systems that grow from the bottom up” (Batty, 2007b: 7).
The question is how a complex system is defined and what characteristics account cities for complex systems. In science there exist a number of approaches to define complexity. Lloyd highlights that he once gave a presentation setting out 32 definitions of complexity (Lloyd, 2006). “Roughly, by a complex system I mean one made up of a

Urban modelling and systems theory
44
large number of parts that interact in a nonsimple way. In such systems, the whole is more than the sum of the parts, not in an ultimate, metaphysical sense, but in the important pragmatic sense that, given the properties of the parts and the laws of their interaction, it is not a trivial matter to infer the properties of the whole” (Simon, 1962: 468). “Put very generally, to become complex, a system should exhibit properties that are beyond convergence to a globally stable equilibrium. In this milieu, simple systems, i.e. systems that always tend to a steady state, are very ‘convenient’ regarding their reaction to environmental changes, because the effects of external factors and internal properties of the system become separable. (...) Put plainly, behavior of simple systems is always ’controllable‘” (Benenson & Torrens, 2004: 57).
Soon the question how complexity is organised came up. Jane Jacobs and her famous 1961 opus ”Death and Life of Great American Cities” brought forward the argument that the mechanistic way of top down planning destroyed the vibrancy and diversity of urban life. She followed Weaver’s (1948) characterisation of science as dealing with three types of problems: problems of simplicity, problems of disorganised complexity, and problems of organised complexity and claimed that cities had to be handled as problems of organised complexity, the subject of the life sciences (Batty, 2007b: 7 f). Organised complexity, from Weaver's perspective, resides in nothing else than the non-random, or correlated interaction between the parts. “They are all problems which involve dealing simultaneously with a sizable number of factors which are interrelated into an organic whole” (Weaver, 1948). The coordinated system manifests properties not carried or dictated by individual parts. The organised aspect of this form of complexity vis a vis other systems than the subject system can be said to be self-emergent. “It is very well known that if system rules are non-linear and the system is open, then emergence and self-maintenance of entities at above-automata levels become feasible” (Benenson & Torrens, 2005: 361).
Most cities are characterised by a permanent alteration reflecting for example demographic, economic or technological changes. “Almost all cities are undergoing continual growth, change, decline, and restructuring - usually simultaneously” (White & Engelen, 1993: 1176). Moreover, cities show the typical features of complex systems. Torrens (2000a) and Torrens and O’Sullivan (2001) have shown that cities exhibit several of the characteristics of complexity: fractal dimensionality, self-similarity, self-organisation, and emergence. Barredo et al. summed it up in a similar way: “Cities can be understood as complex systems considering their intrinsic characteristics of emergence, self-organising, self-similarity and non-linear behaviour of land use dynamics” (Barredo et al., 2003: 145). The latter points back to the issue of additivity as described above and the question what the whole - being more than the sum of the parts - may be. “Studying cities as complex systems the critical point is that the sum of the parts corresponds to urban morphology whilst the whole is represented by urban pattern dynamics. From this perspective, dynamics become the keyword in order to study cities from a holistic perspective” (Barredo et al., 2003: 149).
Very simple models can produce surprisingly complex behaviour. Cities are complex emergent systems, where a small number of rules applied at local level are capable of

Urban modelling and systems theory
45
generating surprising complexity in aggregate form (Barredo et al., 2003: 149; Torrens, 2000a). “The use of tools designed for systems that show the aforementioned characteristics will help us to get a better knowledge of the drivers behind urban land use dynamics. Furthermore, these tools can support the development of models for urban land use scenario generation” (Barredo et al., 2003: 145).
CA as a cooperative product of the science of complexity and the computational revolution (Couclelis, 1988) are models which deal with complex systems. CA have been defined as very simple dynamic spatial systems and despite their simplicity some classes of CA are capable of ‘universal computation’ (Wolfram, 1984a, 1984b, 1988) which implies that “some types of CA can mimic or reproduce behaviours with high level of complexity, such as of physical, biological or social complex systems. CA have a remarkable potential for modelling complex spatio-temporal processes, and very simple CA can produce surprisingly complex forms through a set of basic rules” (Barredo et al., 2003: 150). An understanding of CA leads to the conclusion that the description of complex systems need not be themselves complex, let alone ‘complicated’ (May, 1976; Couclelis, 1988). Any modification of a CA model must be approached with care due to the fact that “CA exist, as it were, on the edge of chaos. Launching enthusiastically into dramatic modification of models, without a full appreciation of the system dynamic implications, may produce simulations that we do not fully understand“ (Torrens & O’Sullivan, 2001: 165). Accordingly, the model conception should be held as simple as possible, but at the same time precise and powerful enough as to illustrate the functioning principles of the system.
5.3. About models
A model is defined as a theoretical and simplified abstraction of some part of reality. It simplifies that part of reality which shall be examined and, thus, reduces the complexity of the reality neglecting those features which are not relevant for the observed phenomenon. By that a model aims to highlight the main features and linkages and serves to understand underlying mechanisms. One specific type of abstract models uses mathematical descriptions to reproduce processes observed in real life. These models are normally referred to as mathematical models. “Because it is less ambiguous, a mathematical model is a description which has greater clarity than most verbal models” (Lee, 1973: 8). As these mathematical models especially if dealing with the complexity of cities often need a high number of repetitive calculations, they are executed with the aid of computers.
To examine the system which is being modelled a delineation between the system and its environment is required. With abstract models of a given reality functional relationships and basic processes of urban change can be captured. However, the subset of the reality which is to be modelled has to be selected very carefully as the selection has a decisive impact on the output of the model. Forrester defined a simulation model as “a theory describing the structure and interrelationships of a system” (Forrester, 1969: 112). The basic purposes of a model can be listed as follows: description, explanation, forecasting, and decision support (Rödding, 2001: 26).
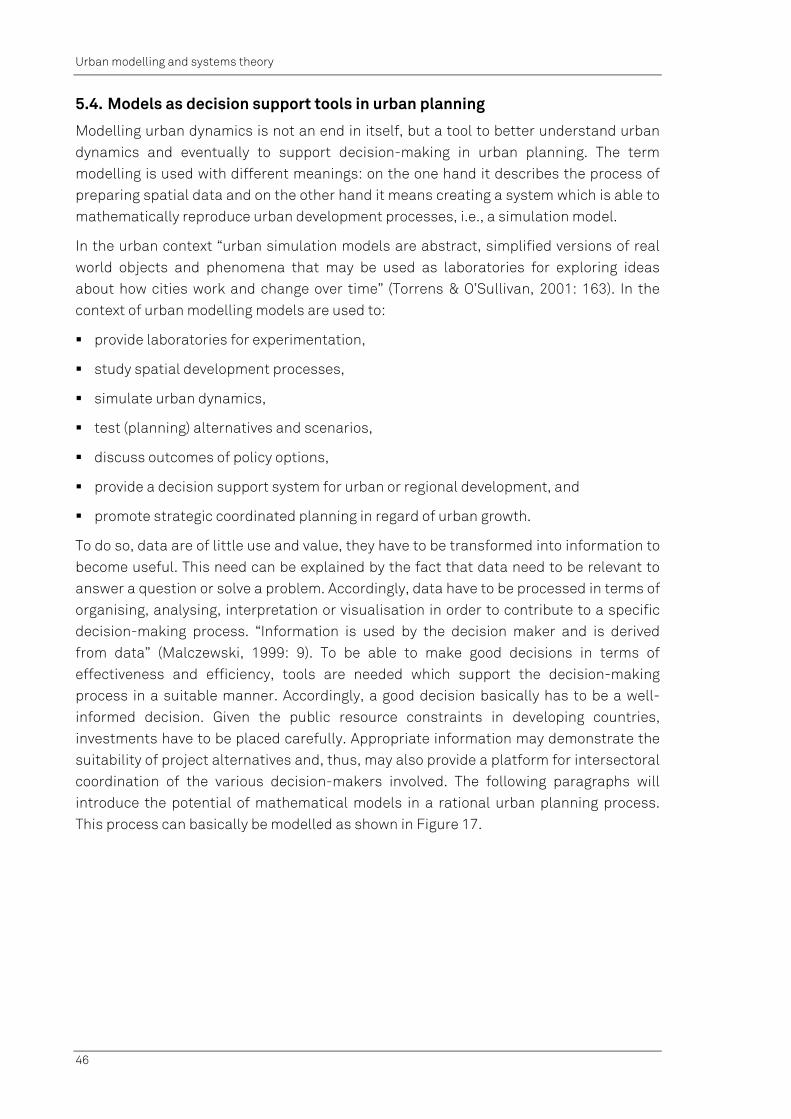
Urban modelling and systems theory
46
5.4. Models as decision support tools in urban planning
Modelling urban dynamics is not an end in itself, but a tool to better understand urban dynamics and eventually to support decision-making in urban planning. The term modelling is used with different meanings: on the one hand it describes the process of preparing spatial data and on the other hand it means creating a system which is able to mathematically reproduce urban development processes, i.e., a simulation model.
In the urban context “urban simulation models are abstract, simplified versions of real world objects and phenomena that may be used as laboratories for exploring ideas about how cities work and change over time” (Torrens & O’Sullivan, 2001: 163). In the context of urban modelling models are used to:
provide laboratories for experimentation,
study spatial development processes,
simulate urban dynamics,
test (planning) alternatives and scenarios,
discuss outcomes of policy options,
provide a decision support system for urban or regional development, and
promote strategic coordinated planning in regard of urban growth.
To do so, data are of little use and value, they have to be transformed into information to become useful. This need can be explained by the fact that data need to be relevant to answer a question or solve a problem. Accordingly, data have to be processed in terms of organising, analysing, interpretation or visualisation in order to contribute to a specific decision-making process. “Information is used by the decision maker and is derived from data” (Malczewski, 1999: 9). To be able to make good decisions in terms of effectiveness and efficiency, tools are needed which support the decision-making process in a suitable manner. Accordingly, a good decision basically has to be a well-informed decision. Given the public resource constraints in developing countries, investments have to be placed carefully. Appropriate information may demonstrate the suitability of project alternatives and, thus, may also provide a platform for intersectoral coordination of the various decision-makers involved. The following paragraphs will introduce the potential of mathematical models in a rational urban planning process. This process can basically be modelled as shown in Figure 17.
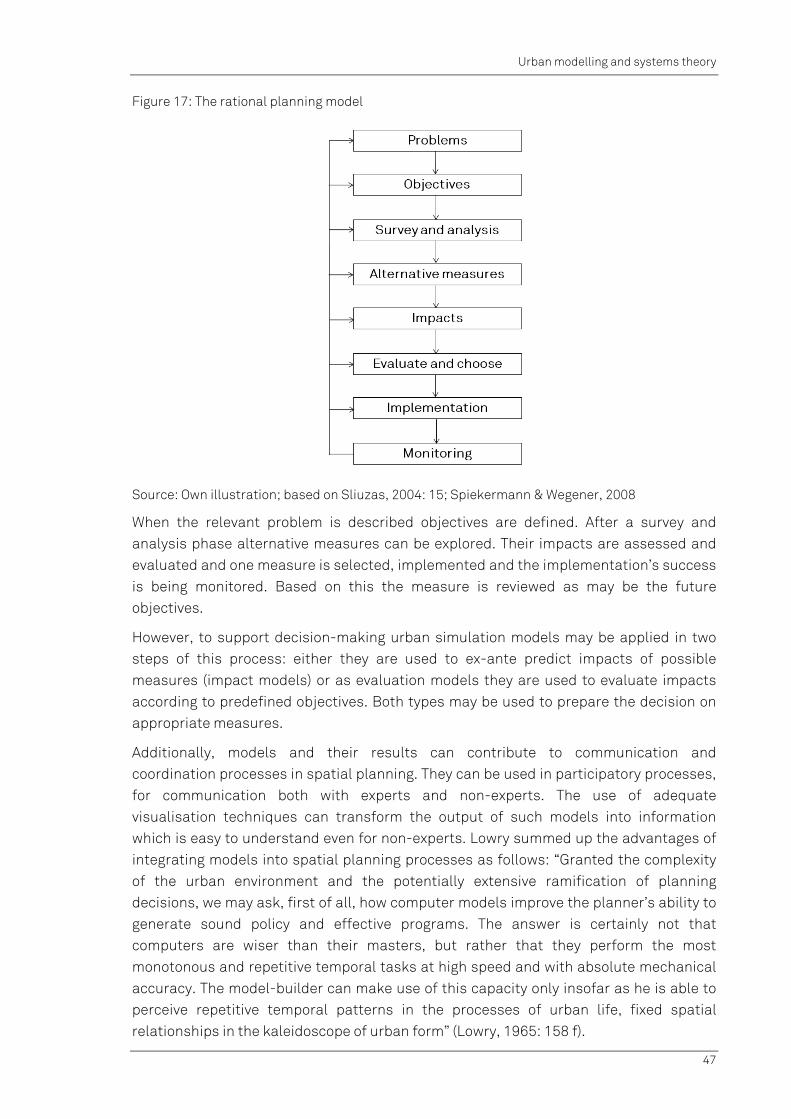
Urban modelling and systems theory
47
Figure 17: The rational planning model
Source: Own illustration; based on Sliuzas, 2004: 15; Spiekermann & Wegener, 2008
When the relevant problem is described objectives are defined. After a survey and analysis phase alternative measures can be explored. Their impacts are assessed and evaluated and one measure is selected, implemented and the implementation’s success is being monitored. Based on this the measure is reviewed as may be the future objectives.
However, to support decision-making urban simulation models may be applied in two steps of this process: either they are used to ex-ante predict impacts of possible measures (impact models) or as evaluation models they are used to evaluate impacts according to predefined objectives. Both types may be used to prepare the decision on appropriate measures.
Additionally, models and their results can contribute to communication and coordination processes in spatial planning. They can be used in participatory processes, for communication both with experts and non-experts. The use of adequate visualisation techniques can transform the output of such models into information which is easy to understand even for non-experts. Lowry summed up the advantages of integrating models into spatial planning processes as follows: “Granted the complexity of the urban environment and the potentially extensive ramification of planning decisions, we may ask, first of all, how computer models improve the planner’s ability to generate sound policy and effective programs. The answer is certainly not that computers are wiser than their masters, but rather that they perform the most monotonous and repetitive temporal tasks at high speed and with absolute mechanical accuracy. The model-builder can make use of this capacity only insofar as he is able to perceive repetitive temporal patterns in the processes of urban life, fixed spatial relationships in the kaleidoscope of urban form” (Lowry, 1965: 158 f).
Urban modelling and systems theory
48
Urban simulation models do not only aim at exploring and better understanding urban dynamics but many of the operative models also forecast future states of urban systems modelling future urban development and perspectives. As the “future orientation of planning is unique to the field’s identity (...). The very substance of urban planning is founded in time” (Myers & Kitsuse, 2000: 225) so that urban planning and urban models have to be discussed jointly. Couclelis has argued that connecting these two spheres could “amplify the positive synergies between the two domains and enhance the ability of spatial planning to prepare for the future” (2005: 1353). Both statements of what planning and urban models are all about are at least true in theory but in reality there is a continuing gap between planning theory and practice.
Harris (1989) distinguishes four main functions of planning: operational, managerial, strategic, and communicative. Operational functions include the day-to-day activities of planning authorities. Managerial functions are directly or indirectly connected with the goal of optimising the use of resources. Strategic planning functions are represented in integrated land-use and transportation planning. Communicative functions as a vital part of practically all forms of land-use planning can range from an informal exchange of information over the telephone to the development of the most elaborate computer-aided systems to facilitate public debate (Harris, 1989; Couclelis, 1991; Couclelis, 2005). Strategies are judged to be “the most fundamental aspect of plans (...) because strategies directly account for actions, outcomes, intentions, and uncertainty. Strategies address most completely the difficulties created by interdependence, indivisibility, irreversibility, and imperfect foresight'' (Hopkins, 2001: 6).
Thus, the sound claim for a more strategic planning has been revitalised during recent years by various scientists (e.g., Albrechts, 2004; Friedman, 2004; Salet & Faludi, 2000). Albrechts argues that throughout the manifold efforts underway in Europe towards a more strategic planning for cities, city-regions and regions the motivations are varied but “the objectives have typically been to articulate a more coherent spatial logic for land-use regulation, for resource protection, for action orientation, for a more open type of governance, for introducing sustainability, and for investments in regeneration and infrastructure” (2004: 749).
Planning and modelling practices exhibit a clear separation as “earlier hopes of creating a stronger, more scientific urban land-use planning practice through integration with models did not materialize” (Couclelis, 2005: 1355). Hall went a step further stating that planning practitioners have “lapsed into an increasingly untheoretical, unreflective, pragmatic, even visceral style of planning” (1996: 394). In this context Couclelis (2005) demands that appropriate urban models have to be developed that are suitable to step into the place when it comes to support this strategic function of planning.

Urban modelling and systems theory
49
5.5. Modelling spatial phenomena
5.5.1. Modelling and GIS
During the past decade Geographic Information Systems (GIS) have become the key computer-based technology for handling spatial data, spatial analysis, and modelling. The fields of GIS application have become very heterogeneous and range from biology over geography to facility management, etc. Thus, there is a variety of GIS software available either equipped with specific features for solving specific tasks in a given application context or designed as ‘all-in-one’ solutions with all-embracing capabilities as regards data formats, analysis, modelling and output capabilities. The following chapters will focus on the specific application context of this research providing a specific introduction to important features of common GIS as related to the simulation model to be developed.
GIS can be defined as computerised systems for entry, analysis and presentation of georeferenced data (de By, 2000: 25). One of the core features characterising this branch of computer systems are the capabilities to handle spatial and non-spatial data. This data may be derived from various sources including surveying, remote sensing, e.g., satellite / aerial imagery and photogrammetry, Global Positioning System (GPS), public census, manual digitising and scanning (Kainz et al., 2000: 72). Once GIS data needed for a certain task are acquired, appropriately processed, and stored in a database spatial analyses can be performed and desired information can be extracted and visualised (see Figure 18).
Figure 18: Computer-based modelling of geographic phenomena
Source: Own illustration; based on Kainz & de By, 2000: 37
For a GIS project the process of data entry and preparation forms a crucial stage with respect to the overall tasks to be accomplished by the system. Only if the process of modelling space (and time) is tackled appropriately the GIS will be capable to solve the analysis and presentation tasks required. Basically, this modelling process deals with representing in GIS “some part of the real world as it is, as it was, or perhaps as we think it should be” (de By, 2000: 27) or as it might be in the future. Therefore, data have to be structured to enable processing and storage in the computer system (Molenaar, 1998:

Urban modelling and systems theory
50
7). The process creating representations for data on geographic phenomena for the use in a GIS is commonly referred to as spatial data modelling.
Modelling the real world at the first stage inevitably involves the task of abstraction. The process of reducing complexity by identifying relevant and irrelevant features is commonly referred to as abstraction. Data modelling needs abstraction simply because the real world is too complex and, thus, cannot be represented completely (de By, 2000: 27). The need for abstraction becomes immediately evident following Solow: “Simplifying assumptions are not an excrescence on model-building; they are its essence. Lewis Carroll once remarked that a map on the scale of one-to-one would serve no purpose. And the philosopher of science Russell Hanson noted that if you progressed from a five-inch balsa wood model of a Spitfire airplane to a 15-inch model without moving parts, to a half-scale model, to a full-size entirely accurate one, you would end up not with a model of a Spitfire but with a Spitfire” (Solow, 1973: 267). The decision at the stage of spatial data modelling concerning which features shall be represented can only be answered through the notion of their relevance. Modelling urban dynamics abstraction becomes crucial not only to the input data used but also to designing the model itself.
Stachowiak (1965) identifies three common characteristics of models:
Illustration: Models may represent either natural or artificial objects (that can be models themselves).
Simplification: The model-building process intends a reduction of complexity by identifying relevant and irrelevant features.
Subjective pragmatism: The reduction and simplification of the real world underlies subjective decisions. Depending on different persons, situations and subjects a system may be transferred into differing models (Stachowiak, 1965: 438).
Molenaar distinguishes between four different levels of modelling in the context of data modelling namely spatial modelling, conceptual modelling, logical data modelling and physical data modelling (see Figure 19). While the term physical data modelling describes the process of mapping data onto computer structures, the task of logical data modelling means the organisation of data in data storage structures, e.g., relational database management system (RDBMS). Conceptual modelling involves the task of formalising spatio-temporal data, i.e., deciding on the entities relevant for a particular application, their abstract representation, their description and their relationships (Molenaar, 1998: 7). For most GIS applications several types of spatial entities, their interrelationships and behaviour play an important role which constitutes the task of developing a spatial comprehension of the real world, i.e., spatial modelling (Ott & Swiaczny, 2001: 25).

Urban modelling and systems theory
51
Figure 19: Levels of data modelling
Source: Own illustration; based on Molenaar, 1998: 7
Molenaar further declares these different modelling levels to be subject to different domains namely computer sciences, geo-information theory and the application disciplines such as spatial planning (Molenaar, 1998: 8).
Therefore, the subsequent paragraphs will focus on the fields of spatial and conceptual modelling. In the present research context the task of modelling geographic information is confined mainly to the levels of spatial and conceptual modelling as the authors clearly belong to the application disciplines.
5.5.2. Data structures and representation models
During the process of data modelling the question of an accurate representation of real world features is depending on the issue of relevance on the one hand and on the constraints imposed by GIS technology on the other hand (Ott & Swiaczny, 2001: 22). This is mainly related to the problem of how to represent spatial phenomena in a GIS. In a common GIS two basic components can be discriminated which are used together to describe geographic phenomena: the geometric (spatial) and the thematic (or attributive) information (Molenaar, 1998: 4). There exist different approaches how to structure and represent real world geographic phenomena which can roughly be reduced to two different basic abstractions: fields and objects (see Figure 20). Each approach has its specific advantages and disadvantages and, thus, its particular field of application as concerns the types of geographic phenomena to be represented.
Urban modelling and systems theory
52
Figure 20: Two basic structures for spatial data
Source: Own illustration; based on Molenaar, 1998: 4
In the field approach the earth’s surface is considered as a spatio (-temporal) continuum (Molenaar, 1998: 5). Thus, a field is a geographic phenomenon that has a value ‘everywhere’ in the study space (Kainz & de By, 2000: 40). These attribute values are considered to be position dependent. The representation of such a field in a geo-database requires that the continuum is discretised in the form of points or finite cells often in a regular grid or raster format.
The object approach assumes that terrain features or objects can be defined which each have a location or position and a shape and several non-geometric characteristics. Geographic objects may only occur at certain locations in the study area and exhibit distinct (crisp) boundaries. These objects are represented in an information system by means of an identifier to which the thematic data and the geometric data are linked (Molenaar, 1998: 5).
In many modern GIS software packages both abstractions are supported by raster and vector data formats (see Figure 21). In raster data spatial information is stored in rows and columns of a distinct size which depends on the spatial resolution of the dataset. Space is divided into a cellular structure by regular tessellation and a value is assigned to each cell (Kainz & de By, 2000: 48). The square cell tessellation of space is the most common one and is referred to as raster or grid format in most GIS software packages6,7. Raster formats are best suited for the storage of continuous data that are data that can be measured on a continuum or scale like elevation or rainfall for instance (geographic fields). Raster formats may also be used to handle discrete data which hold classified, categorical or descriptive information like land-use data for instance (geographic objects). However, for discrete data the raster format is associated with intrinsic
6 Other sorts of regular tessellations types exist using for instance triangular or hexagonal cells. 7 Kainz & de By (2000) point out that strictly speaking a grid is an equally spaced collection of points which have some attribute value assigned but are often considered synonymous with raster cells.
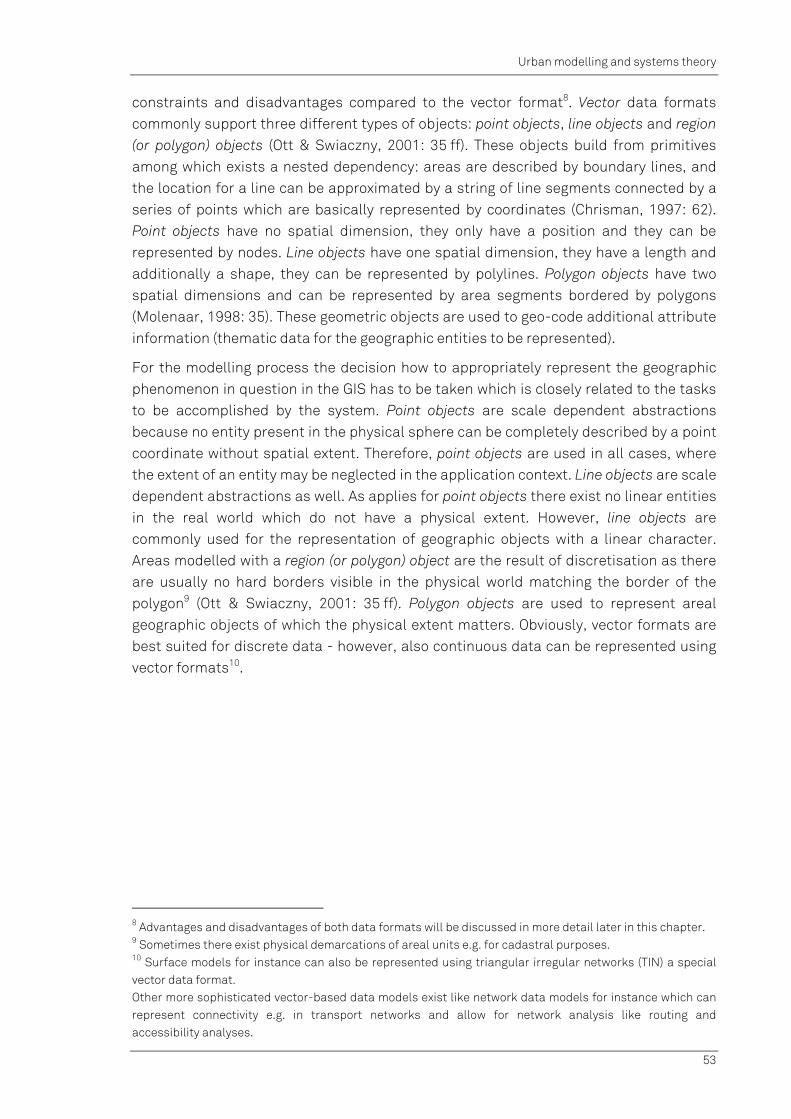
Urban modelling and systems theory
53
constraints and disadvantages compared to the vector format8. Vector data formats commonly support three different types of objects: point objects, line objects and region (or polygon) objects (Ott & Swiaczny, 2001: 35 ff). These objects build from primitives among which exists a nested dependency: areas are described by boundary lines, and the location for a line can be approximated by a string of line segments connected by a series of points which are basically represented by coordinates (Chrisman, 1997: 62). Point objects have no spatial dimension, they only have a position and they can be represented by nodes. Line objects have one spatial dimension, they have a length and additionally a shape, they can be represented by polylines. Polygon objects have two spatial dimensions and can be represented by area segments bordered by polygons (Molenaar, 1998: 35). These geometric objects are used to geo-code additional attribute information (thematic data for the geographic entities to be represented).
For the modelling process the decision how to appropriately represent the geographic phenomenon in question in the GIS has to be taken which is closely related to the tasks to be accomplished by the system. Point objects are scale dependent abstractions because no entity present in the physical sphere can be completely described by a point coordinate without spatial extent. Therefore, point objects are used in all cases, where the extent of an entity may be neglected in the application context. Line objects are scale dependent abstractions as well. As applies for point objects there exist no linear entities in the real world which do not have a physical extent. However, line objects are commonly used for the representation of geographic objects with a linear character. Areas modelled with a region (or polygon) object are the result of discretisation as there are usually no hard borders visible in the physical world matching the border of the polygon9 (Ott & Swiaczny, 2001: 35 ff). Polygon objects are used to represent areal geographic objects of which the physical extent matters. Obviously, vector formats are best suited for discrete data - however, also continuous data can be represented using vector formats10.
8 Advantages and disadvantages of both data formats will be discussed in more detail later in this chapter. 9 Sometimes there exist physical demarcations of areal units e.g. for cadastral purposes. 10 Surface models for instance can also be represented using triangular irregular networks (TIN) a special vector data format. Other more sophisticated vector-based data models exist like network data models for instance which can represent connectivity e.g. in transport networks and allow for network analysis like routing and accessibility analyses.

Urban modelling and systems theory
54
Figure 21: Two representations of land use
Source: Own illustration
The application context constitutes the decision criteria which data format to use for which task in a GIS particularly since both raster and vector format hold specific advantages and disadvantages11. At the end of the day, the selection of a suitable data model must be based on project goals, subject and scale of analysis as well as data availability and data quality (Ott & Swiaczny, 2001: 128). Raster formats tend to be storage space-intensive compared to vector formats and their accuracy is directly related to spatial resolution. Particularly for discrete spatial objects the vector format allows for a much more precise representation (see Figure 21). On the other hand the raster format holds considerable advantages particularly for specific spatial analyses and modelling of spatial processes associated with the discretisation of space in distinct units also leading to an efficient processing of data12. In this study, both raster and vector data will be used for the purpose of analysing, modelling and simulating spatial processes.
5.5.3. Spatio-temporal modelling
Time and space are concepts instinctively used to understand and conceive our environment (Ott & Swiaczny, 2001: 57). When dealing with spatial information it becomes immediately obvious that every spatial entity exhibits a time reference since almost all spatial phenomena are subject to change over time. Both time and space are inseparable components of any process analysis or simulation (Ott & Swiaczny, 2001: 140). This constitutes the task to integrate time into the modelling work.
In complete analogy to space, time can be understood as an a priori continuous and infinite dimension which must be reduced in complexity so that it can be stored in a GIS as finite and discrete data (Ott & Swiaczny, 2001: 55). In addition, time may be treated as linear or cyclical. When considering spatio-temporal aspects associated with computer-based storage and processing the issue of granularity such as the interval scale of time 11 In modern GIS software packages it is even possible to work with raster and vector datasets at the same time within the same application. 12 This comparison of advantages and disadvantages is by far not comprehensive. For a more detailed comparison see for instance Ott & Swiaczny, 2001, 126 ff.
vector representation raster representation

Urban modelling and systems theory
55
comes into play. In this context the shortest interval in the chosen time scale is referred to as a chronon. In practice the determination of an appropriate granularity depends on the scale of the time axis which is defined by the duration of periods to be measured. As with spatial information, for temporal information scale dependency matters as well (Ott & Swiaczny, 2001: 59).
In practice, different approaches have been developed to integrate temporal and spatial information. Ott and Swiaczny for instance mention the snapshot approach, the time-slice approach, the topology of time approach, the space-time composite approach, the amendment vector approach, entity-relationship models of temporal objects and the spatio-temporal object model (Ott & Swiaczny, 2001: 62 ff). An exhaustive discussion of these different concepts does not seem appropriate in this work. Thus, the following remarks are confined to the approach taken in this research work, the time-slice approach13.
A fundamental remark on the time slice approach is that it can only capture phenomena whose granularity of change approximates its exposure time (Langram, 1992: 38). For the given context of urban change, this feature does not impose major problems since changes in land use are generally processes which can be appropriately captured in common granularities of urban models, e.g., one year iterations. Nevertheless, the basic criticism on the time slice approach is relevant and it may occur that short-term urban change cannot be captured in the chosen time slice interval. The time slice approach transforms continuously changing spatial phenomena in discrete sections (see Figure 22). Thus, time is represented by a set of layers in which each layer contains spatial objects of the same category valid at a given time step. Temporal information may be integrated matching the changing spatial states of successive temporal layers, or a spatially invariant layer may be used to display different time slices of changing attribute data. Raster GIS exhibit a particular suitability for this kind of space-time integration since space is also discretised and, thus, operations to detect changes are easy to apply (Ott & Swiaczny, 2001: 61).
13 Literature review exhibits some inconsistencies in the common terminology. Other authors refer to the concept of time slices as the snapshot model (Kainz & de By, 2000: 63) or the sequent snapshot model (Langram, 1992: 38).
Urban modelling and systems theory
56
Figure 22: Space-time cube
Source: Ott & Swiaczny, 2001: 62
5.6. Cellular automata: modelling cities as complex systems
This chapter will introduce the modelling approach of CA which is the type of model chosen for developing the Dar es Salaam land-use model. The rapid growth rates of most large African cities and their uncontrolled sprawling development indicate the need for a more integrated approach to land-use planning guiding city growth into a more sustainable direction. Thus, the urban model to be developed may serve to evaluate, analyse, and predict future urban growth allowing for better decisions of public bodies and stakeholders.
The common approach to model urban systems is to define their main constituting entities and the underlying interrelationships. To model urban dynamics by representing the basic elements or atoms of the city there are two distinct but related approaches:
through cells which represent the physical and spatial structure of the city as locational objects (e.g., cellular automata) and
through agents which represent the human and social units that make the city work in form of socio-economic objects or activities (e.g., agent-based models).
For this study the approach of CA was selected for modelling urban dynamics. Thus, a thorough introduction to CA-based modelling will be presented in the following including a discussion on the particular advantages which led to the decision for a CA-type model as well as its disadvantages.
5.6.1. Modelling urban growth and urban dynamics
Urban modelling stresses the idea that urban change is a process that manifests itself in both time and space. Cities are no static, spatially ordered entities and „science is essentially concerned with causal relations; and causal relations cannot be expressed unless there is change” (Waddington,1968). “Some of the key problems of the 1950s and

Urban modelling and systems theory
57
1960s manifested themselves in terms of congestion and the need to ensure effective transport, and the first steps towards rudimentary simulation models were based on land use-transportation linked to the way populations created demand and supply for such uses were built with this image of the city as an interacting system in mind (Lowry, 1968)” (Batty, 2007b: 6). The development of dynamic urban models began with Forrester (1969) who “used ideas from system dynamics where feedback – positive and negative were central – to model inner cities and although his models were criticised for being non-spatial, he demonstrated the power of exponential and logistic growth” (Batty, 2007b: 10). Batty (2007a: 21 ff) mentions some drivers which are critical to understand how change takes place:
randomness,
historical accident,
physical determinism,
natural advantages, and
comparative advantage.
The relevance of these drivers might vary significantly, e.g., depending on the stage of development of an urban area, the given cultural and planning framework, and so forth.
One of the characteristics of urban dynamics is the mutual interaction between land use and transport. Theories on land use and transport interaction contribute to the explanation of the behaviour of private actors like households and firms. Land use and transport models understand their behaviour as responses to changes in urban land use and the transport system at the urban-regional level. This recognition led to the notion of 'land-use transport feedback cycle' (see Figure 23).
Figure 23: Basic principles of the ’land use transport feedback cycle'
Source: Wegener & Fürst, 1999: vii
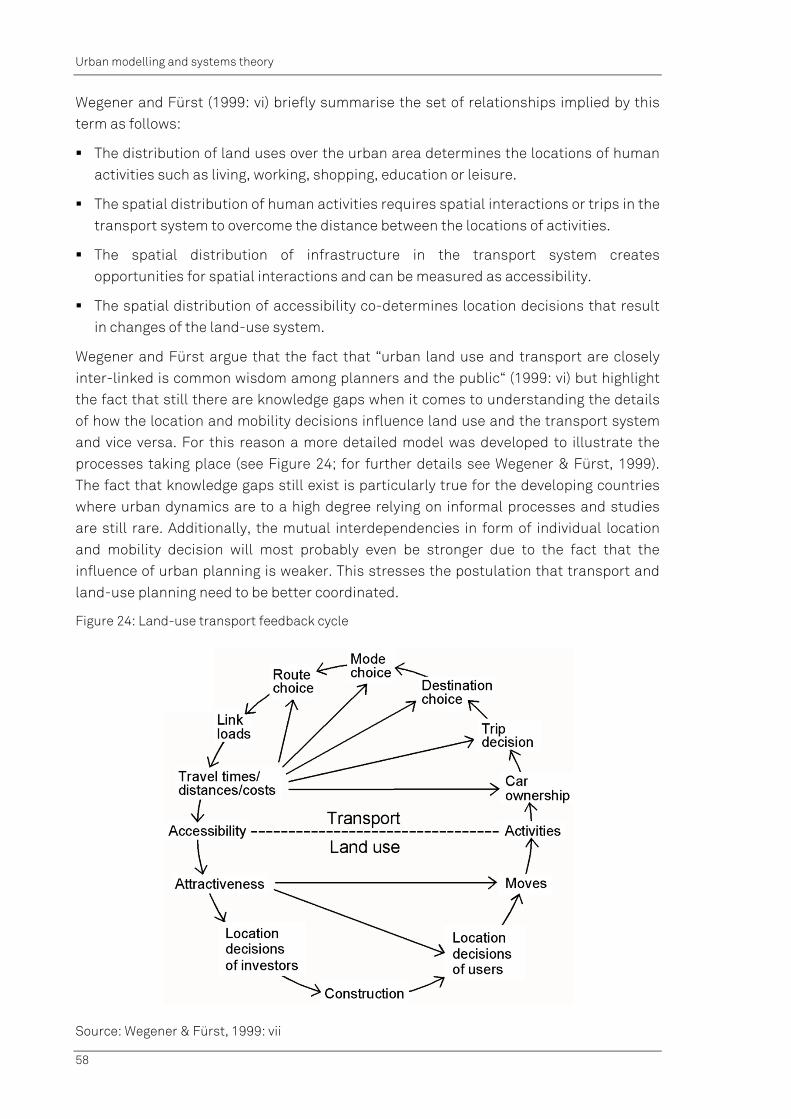
Urban modelling and systems theory
58
Wegener and Fürst (1999: vi) briefly summarise the set of relationships implied by this term as follows:
The distribution of land uses over the urban area determines the locations of human activities such as living, working, shopping, education or leisure.
The spatial distribution of human activities requires spatial interactions or trips in the transport system to overcome the distance between the locations of activities.
The spatial distribution of infrastructure in the transport system creates opportunities for spatial interactions and can be measured as accessibility.
The spatial distribution of accessibility co-determines location decisions that result in changes of the land-use system.
Wegener and Fürst argue that the fact that “urban land use and transport are closely inter-linked is common wisdom among planners and the public“ (1999: vi) but highlight the fact that still there are knowledge gaps when it comes to understanding the details of how the location and mobility decisions influence land use and the transport system and vice versa. For this reason a more detailed model was developed to illustrate the processes taking place (see Figure 24; for further details see Wegener & Fürst, 1999). The fact that knowledge gaps still exist is particularly true for the developing countries where urban dynamics are to a high degree relying on informal processes and studies are still rare. Additionally, the mutual interdependencies in form of individual location and mobility decision will most probably even be stronger due to the fact that the influence of urban planning is weaker. This stresses the postulation that transport and land-use planning need to be better coordinated.
Figure 24: Land-use transport feedback cycle
Source: Wegener & Fürst, 1999: vii
Urban modelling and systems theory
59
This cycle does not explicitly include spatial planning as an influencing factor. In fact, planning policies and planning measures of course do influence both sides of the cycle; land use and the transport system. Planning can influence the choices and behaviour of individuals in the fields as shown in Figure 24 to a varying degree through the establishment and organisation of the urban structures in terms of land uses and transport opportunities. This is particularly true for strong planning systems with high implementation security as found for example in Europe. However, in many developing countries the above sketched land use transport feedback cycle can be applied with only little consideration of planning interventions and their guiding mechanism. These interventions can be observed basically in the field of transport infrastructure
Land-use allocation and urban change particularly in developing countries is mainly driven by residential location decisions of private households. These decisions are influenced by several determinants that represent preferences and overall restrictions. They can be distinguished as follows:
environmental characteristics (e.g., slope),
local-scale neighbourhood characteristics (e.g., neighbouring land uses),
spatial characteristics of the cities (e.g., accessibility), and
urban and regional planning policies (Barredo et al., 2003: 146).
However, the relevance of the determinants might vary depending on the given economic and legal framework. For example, in growing cities in developing countries where the formal land development and regulation processes cannot cope with rapid urban growth due to limited capacities of local planning authorities, planning policies most probably will have a smaller influence than in countries with a weak planning system.
Modelling urban growth and urban dynamics has to account for the determinants and drivers of urban development. Only if these are accurately captured by the model the results being produced are meaningful and relevant. This includes the processes of selecting the relevant determinants, the model design and layout as well as model calibration. The combination of the different variables considered by such models is able to reproduce complex processes and patterns observable on the aggregate level.
5.6.2. CA modelling
The modelling approach used in the ‘Dar es Salaam Megacities Research Project’ is the technique of CA. The general technique of CA is not new, but its application in urban geography is quite young. CA were developed in the 1950s by the physicist Ulam. The idea was soon taken up by von Neumann (1966) to investigate the logical nature of self-reproducing systems. There were a few examples of geographical applications of CA published in the 1970s (Tobler, 1970, 1979; Albin, 1975; Nakajima, 1977). Research on CA has grown quickly since Wolfram in the early 1980s showed that these apparently simple systems can support very complex structures. He demonstrated that they “provide a useful technique for exploring a wide range of fundamental theoretical issues in dynamics and evolution” (White & Engelen, 1993: 1176). Even though “there are direct
Urban modelling and systems theory
60
analogies between land parcels and cells on the one hand and land-uses and states on the other” (Benenson & Torrens, 2005: 350), CA modelling only became popular in geography in the 1990s with pioneering applications in urban geography (Batty et al., 1997; O’Sullivan & Torrens, 2000). “The range of application of cellular automata to urban studies is impressive. CA models have been employed in the exploration of a wide variety of urban phenomena, from traffic simulation and regional-scale urbanization to land-use dynamics, polycentricity, historical urbanization, and urban development. CA models of sprawl, sociospatial dynamics, segregation, and gentrification have been developed, as have simulations of urban form, growth, and location” (Torrens & O’Sullivan, 2001: 163).
The popularity of urban CA models can partly be explained by weaknesses in the stock of urban models but also owes much to manifold advantageous properties of CA models (Torrens, 2000a: 33 ff). “CA models represent a significant improvement on previous generations of urban simulation models: spatiality, decentralization, affinity with new techniques for spatial analysis, attention to detail, linking function and form, dynamics, theory, simplicity, connection of micro and macro-approaches, and visualization” (Torrens, 2000a: 35). CA have many advantages when it comes to the modelling of urban phenomena: their decentralised approach, the link they provide to complexity theory, the connection of form with function and pattern with process, the relative ease with which model results can be visualised, their flexibility, their dynamic approach, and also their affinities with geographic information systems and remotely sensed data (Torrens, 2000a).
Perhaps, the most significant of their qualities, however, is their relative simplicity. “By mimicking how macroscale urban structures may emerge from the myriad interactions of simple elements, CA offer a framework for the exploration of complex adaptive systems. However, with CA, this principle innovative feature is also one of its greatest weaknesses. CA models are constrained by their simplicity, and their ability to represent real-world phenomena is often diluted by their abstract characteristics. (...) CA are not a one-tool solution for urban simulation...the ‘killer app’ for urban simulation still eludes us” (Torrens & O’Sullivan, 2001: 163). Its simplicity is one of its main advantages as even in complex systems a small number of rules applied at the individual or local level are able to generate a surprising complexity in aggregate form. “In terms of urban applications, automata lend themselves to specifications as city simulations with myriad states and transitions rules. However, to make sense, an individual automaton should be as simple as possible in terms of states, transition rules, and internal information” (Torrens & O’Sullivan, 2001).
A second specificity of the CA approach is the decentralised and very local concept of spatial interaction. “Because the system is discrete and iterative, and involves interactions only within local regions rather than between all pairs of cells, a cellular automaton is very efficient computationally. It is thus possible to work with grids containing tens of thousands of cells. The very fine spatial resolution that can be attained is an important advantage when modelling land-use dynamics, especially for planning applications, as spatial detail represents the actual local features that people
Urban modelling and systems theory
61
in a city experience - and that planners must deal with” (White et al., 1997: 323). To understand urban dynamics and model them with a CA, Tobler’s first law of geography is of major importance assuming that “everything is related to everything else, but near things are more related than distant things” (Tobler, 1970). This concept is directly taken up by (urban) CA and will be illustrated in more detail in the subsequent chapters on CA.
5.7. CA basics
The following subchapters present the basic principles of CA modelling. In general, an automaton is “a processing mechanism; a discrete entity, which has some form of input and output and internal states. It changes states over time according to a set of rules that take information from an automaton’s own state and various inputs from outside the automaton to determine a new state in a subsequent time step” (Benenson & Torrens, 2005: 349). A CA adds a spatial component as it combines a number of automata in the form of a lattice of regular cells whereas every cell represents a single automaton. In the context of urban applications the states represent land uses. Automata are discrete with respect to time, space, and cell states. The classical CA characteristics are as given in the following quotation: “At the most rudimentary level, a cellular automaton is an array or lattice of regular spaces or cells. At any given time, a particular cell is in one of a finite number of allowed states, and that state will change according to the states of the neighboring cells in the lattice according to a uniformly applied set of transition rules. Cells alter their states iteratively and synchronously through the repeated application of these rules. A CA is thus composed of four principle elements: a lattice, a set of allowed states, neighborhoods defined by the lattice, and transition rules. In addition we might consider a fifth, temporal component” (Torrens & O’Sullivan, 2001: 163). CA basically reproduce urban dynamics on a local-scale level assuming decentralised neighbourhood diffusion processes (influence of existing land uses in a defined neighbourhood area) as one of the main determinants of urban dynamics. Although CA models are by definition a very simple dynamic spatial system, they can produce surprisingly complex forms through a set of simple rules (White et al., 1999; May, 1976; Couclelis, 1988; Barredo et al., 2003).
Urban CA in the geographical context are not CA strictly speaking as the classical definition of CA “has been loosened by practice” (Ménard & Marceau, 2005: 693) Rather they are considered to be CA-based models because to make standard CA suitable for urban simulations significant changes are necessary. In doing so there seemed to be no “defining characteristics of standard CA that researchers, in their effort to make CA-based models more realistic, have not been able to discard” (Couclelis, 1997: 167). These modifications made the CA approach more suitable to reproduce urban phenomena. The following subchapters will give a broad overview of both CA basic characteristics and urban extensions to the classical CA modelling framework to represent all relevant basics of urban CA-based modelling.
5.7.1. Cells
CA modelling is a raster-based approach where the area to be considered by the model is divided into evenly spaced cells of appropriate size (e.g., 100 by 100 m). The

Urban modelling and systems theory
62
continuous urban space has to be transformed into a discrete system and into an array of homogenous cells. Each cell has a distinct location in the lattice and an id given by {i, i = 1, 2, 3, ...., N}, whereas i is the cell index and N the total number of cells. Each cell is considered to be an automaton and to behave independently from each other.
Cells as spatial entities manifest some adjacency or proximity to one another. They are commonly ordered on regular tessellations (see Figure 25) and their units are invariant to changes both in configuration and shape. The most commonly used tessellation is a regular 2-D tessellation such as a grid where the square cells are contiguous to one another.
Figure 25: Selection of regular cells types
Source: Own illustration
In contrast to the original approach to divide the space into regular grid cells, lately irregular cells were also introduced to CA models particularly in urban contexts. CA have been implemented on irregular networks, partitions given, e.g., by GIS-based coverage of land parcels or Voronoi tesselations (see 0; Benenson & Torrens, 2005: 350, referring to Semboloni, 2000; Shi & Pang, 2000; Benenson et al., 2002). This development is, nevertheless, in line with the concept of neighbourhood effects. There is no conceptual difference between irregular and regular CA.

Urban modelling and systems theory
63
Figure 26: Selected cell delineation types on (A) a regular grid with von Neumann and Moore neighbourhood, (B) a two-dimensional network, (C) a Voronoi partition an a two-dimensional urban space, based on property coverage
Source: Benenson & Torrens, 2005: 351
5.7.2. Cell states
CA models feature a specific cell state for each cell at a specific time. Each cell can only take one state at a time whereas a definite set of states defines the outcome of the system. In a simple model cells may only adopt one out of two possible states, e.g., each cell can either be alive or dead, active or inactive, occupied or empty, developed or undeveloped, on or off, etc. As indicated above cells may change their states by time. In CA models time is normally incorporated in terms of simulation runs (iterations) representing distinct time intervals like one year per iteration. Thus, simulation runs may be run for a desired time frame and based on transition rules such models usually calculate cell states for each iteration between the given starting and end point of a simulation run.
In the context of urban modelling cell states usually represent land uses. Exemplary classes are residential and industrial areas, open spaces like vacant or agricultural areas, and infrastructure facilities. Line infrastructure, e.g., road or rail networks, may also be incorporated as vector components superimposed on the cellular urban space. In urban CA applications cell states may be divided up into different functions. The first type of function constitutes active land-use classes. These functions are highly

Urban modelling and systems theory
64
dynamic, and the demand for those areas is driven by exogenous factors defined by growth projections for the area (e.g., residential or industrial areas). The second group includes fixed functions which are assumed not to change during time or at least not during the observed time period. Examples for this type of states might be flood areas or swamps. Additionally, there are passive functions which are not driven by exogenous demand (e.g., scrublands or forest areas); accordingly their dynamics are only influenced by the dynamics of the other land uses. They either appear or disappear as a response to land being taken or abandoned by active functions (Barredo et al., 2003: 27).
5.7.3. Neighbourhood effect
One fundamental idea of CA is the notion that the state of a cell at any time is influenced by the states of the surrounding cells in the previous time step. These influencing surrounding cells constitute the so-called cell neighbourhood of the central cell. “In terms of space, neighborhood relationships are important for rendering CA as spatial systems” (Benenson & Torrens, 2005: 350). A neighbourhood is defined as the immediate adjacent set of cells that are ‘next’ to the cell in question. However, ‘next’ has to be defined in some precise manner. The neighbourhood approach underlines the main characteristic of CA: spatial interactivity and dynamics on a local scale. The factor that makes the system work like a nonlinear system is the iterative neighbourhood effect (Barredo et al., 2004: 70). Basic neighbourhood definitions for the regular cell space were introduced by Moore and von Neumann (see Figure 27). Besides these, there exists a variety of different delineations of cellular neighbourhoods depending on the specific model application.
Figure 27: Examples for local neighbourhoods in a rectangular grid
Source: Batty, 2007a: 77
Usually, neighbourhoods have an identical form for each automaton. In the neighbourhood, input information for the application of transition rules is collected. The neighbourhood effects can reproduce a kind of diffusion process which assumes that specific land uses have an attractive or repulsive effect on other land uses. In this context for example new residential areas are assumed to be more likely located close to

Urban modelling and systems theory
65
already existing residential areas inter alia because of social bounds and agglomeration effects.
The application of the same type of neighbourhood on various cell types leads to differing results concerning cell distance (measured as distance of cell centres). Figure 28 gives some examples of a Moore neighbourhood. It can be seen that in the hexagonal structure on the right hand site all cells in the Moore neighbourhood exhibit the same distance to the central cell whereas the left hand side figure of square cells features two distance classes: the group of diagonal neighbourhood cells show the same distance to the centre cell whereas the group of horizontally and vertically adjacent cells shows a fix distance which is slightly smaller than the distance of the other class. The rectangular structure in the middle exhibits three distance classes: The shortest distance can be found in the cells directly below and above the centre cell, followed by the cell adjacent on the left and right; the class of cells with the biggest distance are the cells located diagonal to the central cell. This gets important when various distance classes receive a weighting in the model.
Figure 28: Moore neighbourhood variations depending on different cell tessellations
Source: Own illustration
5.7.4. Transition rules
In CA modelling, changes of the cells’ states are determined by so-called transition rules, a set of distinct rules which define the process of change. Transition rules constitute one of the core features of CA models and allow these simple models to reproduce dynamic and complex processes.
The transition algorithms might consider external as well as internal conditions in terms of the model. The external conditions in general are demand functions representing growth figures, e.g., population development and the according growth of settlement area, respectively of single land-use classes. For example, the demand for residential land which is fed into the model externally as demand in ha (cells) for each iteration step based on population projections. It is allocated over the simulation area according to the cells’ transition potentials for residential land use which has been calculated before. Based on the respective internal factors included in the model, the so-called transition potential (one for each land-use type) is calculated for each cell. It ranks the cells by their probability to transform into other land uses. The transition rules change the cell states subject to the rule that the externally provided demands for each land-use class are met. “During each iteration all cells are ranked by their highest potential, and cell transitions begin with the highest ranked cell and proceed downwards until a sufficient

Urban modelling and systems theory
66
number of cells of a particular land-use type has been achieved” (Barredo et al., 2004: 71). The transition rules identify the amount of cells to be transformed for each land use, the cells to be considered, and direct the subsequent allocation procedure in a way that all land demand is satisfied and land-use conflicts are avoided.
5.8. Urban CA extensions
In an urban CA application the cells of the urban space exhibit specific properties relevant for urban development processes. Most of the cell properties are factors (determinants) which can be derived from the natural conditions or the urban environment. Some of these characteristics are fixed while others are subject to change over time. Taken these factors together the character of each cell is very specific. The determinants that adopt basic CA to the environment of urban simulation constituting the cell properties may be grouped into the following categories: suitability, accessibility, zoning status, perturbation, inertia effect, constraint areas, and exogenous factors. These can be found in most urban CA applications but may vary in definition and implementation.
Suitability represents the inherent capacity of a cell to support a particular activity or land use. Basically, cell suitability is influenced by given natural assets represented by a series of physical and environmental factors (which may vary from one context to another). They normally remain constant during the simulation. Urban development in terms of building activities is basically determined by terrain characteristics like slope or terrain roughness. Suitability is defined as a weighted sum or product of the series of influencing factors, for computational purposes, the values may be normalised to the range of 0-1. Often suitability calculations are generated in a GIS and imported into the cellular simulation environment.
The accessibility factor represents the importance of access to infrastructure services for various land uses for each cell, one for each land use type. Usually, this refers to transportation networks like roads or rail networks, but it may also refer to access to services like electricity, water, and sewage or social infrastructure like schools or hospitals. Some activities, like commerce, may require better transportational accessibility than others. Accessibility can be calculated in manifold ways: as a function of distance from the cell to the nearest point in the transport network, travel time to important locations, e.g., business districts, or accessibility potential, e.g, considering population distribution, to name just a few.
The zoning status constitutes a further cell property which may be considered in urban CA-based applications. It influences land-use allocation in a city, as it establishes the legal regulatory framework for future land use. According to its zoning status, each cell may or may not be transformed into a certain land use. The zoning status has to be derived from actual land-use plans, masterplans or regional planning schemes. In environments with a strong planning system characterised by a high level of plan implementation the influence of this determinant is much higher than in countries with weak planning systems and limited resources where the actual influence may tend towards zero.
Urban modelling and systems theory
67
The perturbation factor accounts for the fact that human decisions usually embrace some degree of unpredictability that is characteristic for most social and economic processes. Accordingly, Couclelis (1988) defined human systems as “terribly complex”. Urban modelling has to include this unpredictability. “From a practical point of view the related complexity of human systems could be modelled as some degree of stochasticity in a probabilistic schema. Therefore, it can be considered as a stochastic factor in urban modelling” (Barredo et al., 2003: 147).
The current land use of each cell constitutes another cell property as it may likely influence future transformations: if a cell is assigned to land use ‘planned residential’ it is not very likely that it would develop into an informal settlement. Therefore, a so-called inertia effect is included to increase the likelihood that a cell will remain in the cell state it currently has. It represents the implicit and monetary cost of changing one land use to another as once an activity has occupied a particular cell it will stick to it as long as possible due to the efforts made to implement this land use, e.g., constructing a building, etc. Due to different levels of efforts to implement a specific land use the weight of an inertia term can vary for different land uses. Practically, a positive weight of a cell on itself (zero-distance weight) represents an inertia effect which can be reflected and included in the neighbourhood effect.
Constraint areas define regions where no development is permitted to take place. Thus, these areas are excluded from land-use transformations. Constraint areas are mainly subject to natural limitations for urban development (for example river valleys and swamp areas). However, constraint areas might arise from environmental or planning policies and law, e.g., designated areas for forest protection or nature conservation in general. For the purpose of scenario development it is quite easy to extend or reduce the constraint areas as desired.
Land-use demand as an exogenous factor reflects the growth of the city itself rather than the local configurational dynamics. This is underlined by the fact that cell demands are usually generated outside the CA. It is subject to the framework that the number of cells in each state must be equal to the number demanded in that iteration. The demand for specific land uses is usually based on development projections for population or economic growth.
5.9. State of the art
While CA concepts have proven to be useful for urban applications, continuous dispute addressing some parts of their basic concepts and the related constraints to modelling urban phenomena has led to the introduction of new functionality in CA-based urban models all with the ultimate goal to increase realism of urban models (and, thus, inevitably increasing complexity) (see Figure 29). Recent developments in CA-based modelling of urban phenomena are predominantly characterised by attempts to increase the resolution of CA applications, e.g., to parcel level and at the same time to abandon the classical CA approach of partitioning space into regular lattices and instead enabling for irregular tessellations like Voronoi polygons or Delauny triangulation (Benenson & Torrens, 2005). Other attempts point into the direction of

Urban modelling and systems theory
68
coupling CA with other types of models like multi-agent systems in order to allow for models featuring the free movement of units, e.g., households within the study areas (Torrens & Nara, 2007). Furthermore, criticism on the iterative approach of standard CA in urban applications has led to proposals of introducing means accounting for asynchronous growth patterns (O’Sullivan & Torrens, 2000). While all these developments seem to be the logical consequences of the shortcomings of the CA approach they tend to sacrifice the main and most characteristic advantage of CA models: simplicity. When the applications of CA models are confined to land use most issues addressed by those modifications are less relevant.
Figure 29: Urban CA-based model variations
Source: O’Sullivan & Torrens, 2000: 7
On the side of technical CA implementation an ongoing debate about a closer integration of urban models with common GIS software tools traditionally in use by planners and geographers is observable (Stevens et al., 2007). This issue is usually addressed as a ‘tight-coupling’ of spatial models and GIS. The motives for such proposals comprise the relief from some of the aforementioned limitations as well as the convenience to concentrate on the “model logic rather than developing an entire stand-alone modelling approach” (Stevens et al., 2007: 761). Since modern GIS provide many functionalities useful for modelling spatial processes and at the same time frameworks and interfaces to develop custom applications obviously they hold considerable potential for serving as a basis for development of spatial models (Benenson & Torrens, 2005). This way, model developers may build upon, integrate and extend the functionality already supplied with the chosen software package allowing for a much more efficient development focussing on the model logic to be implemented (Stevens et al., 2007).

Urban modelling and systems theory
69
Despite the successful establishment of CA in urban contexts applications for growing agglomerations in developing countries emerged much later. Even to date there exist rather few cases of successful urban models in the developing world, particularly given the numerous urban growth models developed for European and most notably American metropolises (Frakias & Seto, 2007). This situation however is quite surprising given the fact that the most rapidly growing cities calling for action based on informed decisions exist in the developing world. There, particularly CA-based models with their inherent simple way to deal with complexity and their comparably modest input data requirements offer a good basis to build upon particularly in typically data-poor environments. This has been at least one important factor for the authors to focus on the application of a CA-based model in the context of this work.
One of the few studies concerned with the application of an urban CA in the African context has been presented by Barredo et al. in 2004. It has demonstrated a quite sophisticated CA model application for the city of Lagos, Nigeria. It was developed out of the European Commission’s project Monitoring Land Use Dynamics in Europe (MOLAND). For the purpose of urban modelling the agglomeration area of Lagos was divided up into cells of 100 by 100 m. Each cell has been assigned to one land use out of a total of 21 land-use classes: 5 classes belong to the group of fixed states, 7 classes to the group of passive states, and 8 to active states plus a transition state class. The fixed states are assumed not to participate in land-use changes at all but may influence adjacent land uses if they fall into their cell neighbourhoods. The passive states are subject to change over time but are not driven by exogenous demand functions. While the active classes are constituted by those land use transformations driven by exogenous demand as a response to the growth of the urban area. The extensive number of land uses employed in the model is one unique feature in comparisons with other CA models. As the core feature of CA-based models, the model considers a distance weighted circular neighbourhood radius of 800 m around each cell in order to calculate the neighbourhood effect. As stated by the authors, this can be assumed to be the neighbourhood size as commonly perceived by urban dwellers. The neighbourhood effect is calculated separately for each land-use class. Furthermore, accessibility contributes to the cells’ transition potential. This is calculated separately for individual land-use classes. To account for physical, ecological and environmental conditions in each cell a composite suitability measure is taken into account by the model. Additionally, the model utilises the cell zoning status based on existing planning designations in order to determine priority for any planned developments in the respective cell. In order to account for a certain degree of stochastic in the model a random perturbation has also been included. Overall land-use demand is being estimated based on exogenous factors such as population growth and economic development. The model has been calibrated based on a historic dataset for the period 1984-2000. In order to compare the outcomes of the simulation and the actual development visual comparisons as well as methods of spatial metrics have been employed. Once properly calibrated these measures have revealed a good fit of the model (Barredo et al., 2004).
Urban modelling and systems theory
70
Literature gives evidence that the project team had some difficulties with data availability impacting on the modelling work for the case of Lagos. For example, in the absence of appropriate data the suitability factor have not been included in the actual model. Furthermore, the zoning designations reflect an outdated masterplan from 1970 and, thus, can be assumed to have very limited relevance for current and future (simulated) urban development.
5.10. Interim conclusions
Models represent parts of reality in a simplified and abstract form. They are used for describing, explaining or predicting phenomena observable in reality. In the course of modelling, real life phenomena are subjected to abstraction in order to enable for an accurate and useful representation of all relevant elements and their interactions, e.g., in a computer system. Specialised software packages (such as GIS) provide the functionality needed to represent geographic phenomena allowing for preparation, storage and processing of derived data. With its capabilities to use different data types, modern GIS software constitutes a proper framework for the development of spatial simulation models.
One type of models used in science to model and simulate urban systems is the so-called CA. CA-based models represent the urban space as a lattice of cells and usually focus on land-use development as the observed phenomenon. CA-based models are absolutely suitable for modelling land-use development as the observed phenomenon in an environment that is characterised by rapid urban growth. By incorporating neighbourhood effects CA intrinsically account for dynamic parameters, thus, allowing for reproducing dynamic and complex processes, particularly those that are strongly influenced by local-scale factors. Since urban systems are characterised by considerable complexity on the aggregate level, the CA-based modelling approach aims at reproducing the outcomes of the underlying micro-level processes based on rather simple rules. Thus, such models have to accurately identify and integrate all relevant factors influencing such processes.
As the CA modelling paradigm is largely oriented towards simplicity such models do not require a highly sophisticated database - a feature which is of significant advantage considering the application in data-poor environments typically found in developing countries. Thus, CA-based models can be considered to be well-suited for modelling informal residential development.
Besides the scientific domain, spatial models are increasingly employed as decision support tools in urban planning in order to inform planners and decision makers. A prerequisite for an informed and coordinated planning and the development and implementation of policy strategies is good knowledge of the situation and the major trends and drivers of current urban development. Here, urban information and decision support systems come into play, allowing for cross-sector coordination, discussion and sound responses to the challenges posed by rapid urban growth. They are a tool to explore urban dynamics and their underlying mechanisms, but also to support urban planning in terms of information and communication processes. Furthermore, such

Urban modelling and systems theory
71
tools serve to illustrate and communicate possible urban futures and drivers of change. In doing so, spatial models can illustrate the needs for future planning and investment. They can be used to demonstrate the possible impacts of different planning measures and, thus, support participatory approaches in urban planning contributing to a more coordinated planning manner. The basis for creating and applying such models, however, is a sound understanding of systems theory and complex systems as well as urban development and planning processes.
So far cross-sectoral and coordinated planning is largely missing in Dar es Salaam which will be discussed subsequently (see Chapter 8). Accordingly, the model to be developed shall contribute to overcome planning obstacles pioneering the way forward towards a more coordinated urban future and, thus, sustainable development.
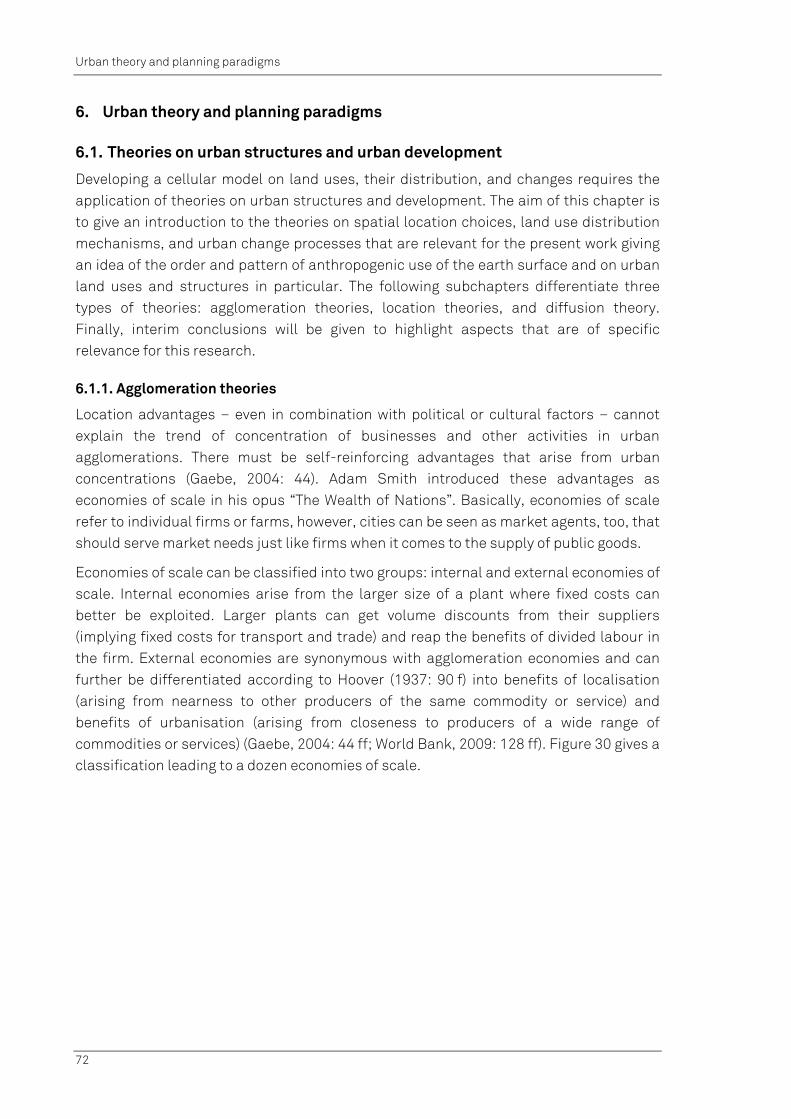
Urban theory and planning paradigms
72
6. Urban theory and planning paradigms
6.1. Theories on urban structures and urban development
Developing a cellular model on land uses, their distribution, and changes requires the application of theories on urban structures and development. The aim of this chapter is to give an introduction to the theories on spatial location choices, land use distribution mechanisms, and urban change processes that are relevant for the present work giving an idea of the order and pattern of anthropogenic use of the earth surface and on urban land uses and structures in particular. The following subchapters differentiate three types of theories: agglomeration theories, location theories, and diffusion theory. Finally, interim conclusions will be given to highlight aspects that are of specific relevance for this research.
6.1.1. Agglomeration theories
Location advantages – even in combination with political or cultural factors – cannot explain the trend of concentration of businesses and other activities in urban agglomerations. There must be self-reinforcing advantages that arise from urban concentrations (Gaebe, 2004: 44). Adam Smith introduced these advantages as economies of scale in his opus “The Wealth of Nations”. Basically, economies of scale refer to individual firms or farms, however, cities can be seen as market agents, too, that should serve market needs just like firms when it comes to the supply of public goods.
Economies of scale can be classified into two groups: internal and external economies of scale. Internal economies arise from the larger size of a plant where fixed costs can better be exploited. Larger plants can get volume discounts from their suppliers (implying fixed costs for transport and trade) and reap the benefits of divided labour in the firm. External economies are synonymous with agglomeration economies and can further be differentiated according to Hoover (1937: 90 f) into benefits of localisation (arising from nearness to other producers of the same commodity or service) and benefits of urbanisation (arising from closeness to producers of a wide range of commodities or services) (Gaebe, 2004: 44 ff; World Bank, 2009: 128 ff). Figure 30 gives a classification leading to a dozen economies of scale.
Urban theory and planning paradigms
73
Figure 30: A dozen economies of scale
Source: World Bank, 2009: 128
Localisation benefits related to the concentration of producers of the same branch are due to lower prices in terms of supply, production, and distribution. Additionally, it leads to higher competitiveness resulting from local and regional learning processes. Benefits mainly arise from vertical interactions between suppliers and customers. Interactions between various producers (horizontal relationships) are hardly detectable or only of indirect character via the labour market, infrastructure, institutions, etc. (Gaebe, 2004: 46).
Concentrations of firms of the same sector which are interconnected with each other horizontally and vertically and participate via division of labour in a joint production and activity network are called clusters (Porter, 1993). A famous example is Dongguan, Pearl River delta in China, a city that has experienced a tremendous change during the last thirty years transforming what used to be a collection of sleepy villages and small towns with about 400,000 inhabitants in 1978 into a city with 7 million inhabitants nowadays. “Since then it has rushed headlong into the world of increasing returns” (World Bank, 2009: 126) demonstrating the potentials of scale economies and how access to world markets helps exploit them.
Reasons for the concentration of heterogeneous activities (urbanisation benefits) arise from a high variety and density of activities. The high number of households and businesses leads to a high potential of purchasing power and demand. The importance of face-to-face contacts is high and they are not replaceable by electronic communication (Gaebe, 2004: 47).

Urban theory and planning paradigms
74
For the residential population urban benefits and the resulting location preferences (urban bias) present themselves basically in comparison to rural areas: a high level and diversity of job offers, various education and training opportunities, relative high income, broad variety of products, services, and cultural facilities on offer (Gaebe, 2004: 54). Particularly in developing countries, in addition the supply with health facilities has to be mentioned where the gap between the situation in rural and urban areas is wide. In the same context it also has to be mentioned that inhabitants participate in different ways from urbanisation economies. The urban poor in average benefit less from positive effects and at the same time suffer more from negative effects. Examples for negative economies of scale are negative environmental impacts like air pollution, polluted ground and surface waters, bad sanitation and hygienic situations, bad living conditions, and high costs for basic services in the informal sector (e.g., drinking water) (Gaebe, 2004: 56).
Figure 30 includes as number 12 of the dozen economies of scale the so called ’pure agglomeration economies of scale‘ which are particularly relevant for public authorities in the context of urban planning. Authorities are enabled to realise economies of scale when supplying public goods14 or infrastructure in more densely populated areas as per capita fixed costs of infrastructure supply can be lowered due to the higher number of people served by one unit of infrastructure. “A public good is supplied efficiently if the marginal cost is equal to the sum of the marginal benefits received by all individuals who consume the good. It is, however, extremely difficult for the supplier of the public good to know how much people benefit” (Kanemoto, 1989: 2). Urban density supports to supply public goods and infrastructure more efficiently. Unfortunately, public authorities in developing countries often cannot realise economies of scale nor their benefits. Most developing countries’ governments recently expressed their desire “to make major changes to the spatial distribution of their populations. Almost three-quarters of the developing country officials expressed a strong desire to implement policies to reduce migration into urban areas or to take actions to reverse rural-urban migration trends” (World Bank, 2009: 140; referring to UN, 2006b). Based on their incapacity to manage their big cities in an efficient and effective way these governments neglect their cities’ role as engines of economic growth and just emphasise the problems related with them. Despite of this official attitude people continue to be attracted by cities and this fact leads to the need for public goods and infrastructure being supplied by local or central governments. 14 “Public goods are goods that are consumed jointly by many individuals. A private good has the property that consumption is exclusive: if an individual eats an apple, nobody else can eat the apple. In the case of a public good, such as national defence, consumption of the good by one individual does not prevent others from consuming the good at the same time. As it turns out, it is difficult to achieve an efficient supply of a public good through the market, and most public goods are provided by the government. There are different degrees of publicness in different public goods. At one extreme is the pure public good which is consumed by all individuals in the economy simultaneously and which it is impossible to prevent anyone consuming once it is supplied. The classic example is national defence. Most public goods are not pure in this sense, however. In this book we consider public goods which are jointly consumed but only by those who live closer to the place of supply. Parks, street lighting, or sidewalks are typical of such local public goods” (Kanemoto, 2008: 1)
Urban theory and planning paradigms
75
In conclusion it has to be emphasised that individuals choose locations that maximise their utility and the basic mechanisms referring to land prices and transport costs account for both the developed and developing countries. However, under poverty as in developing countries this maximisation of utility is often replaced by pure survivalist strategies which maximise the utility in terms of short-term benefits only. This for example leads to different land-use patterns. For example the urban poor choose locations in more remote and informal areas due to the lower land prices neglecting the higher costs they have to pay iteratively for informal services like water supply.
6.1.2. Location theory
In his opus “Location and Land Use – Towards a General Theory of Land Rent” William Alonso (1964) starts as follows: “As cities have grown in importance, the various social sciences have become increasingly concerned with them. The internal structure of cities has proved to be a subject of extraordinary richness and of such complexity that only a modest beginning has been made towards its understanding” (Alonso, 1964: 1). Until today, there is no comprehensive theory explaining city development and city structure as a whole. Rather, different disciplines approach the subject analysing parts of their interest analytically (Holz, 1994: 17). As Heineberg (2006: 101) adds there is a diversity of interpretations and concepts even about these partial theories of city structure and development. Moreover, urban areas are highly dynamic and the underlying mechanism may change over time.
Location theory is dealing with the geographic location of economic, residential, and public activities. Location theory addresses the question which economic activities are located where and why. Location theory rests - like micro-economic theory generally - on the assumption that agents act in their own self-interest. Thus, firms choose locations that maximise their profits and individuals choose locations that maximise their utility. Adam Smith (1776: An Inquiry into the Nature and Causes of the Wealth of Nations) further introduced the idea of an invisible hand where the individual rational behaviour simultaneously produces the optimal solution for the whole society. Nevertheless, besides this traditional understanding there exist theories that also embrace a notion of the imperfect market and of irrational behaviour. Irrespective whether the emerging patterns can be judged good or bad, location decisions and the patterns emerging from them can be understood as a system of micromotives and macrobehavior (Schelling, 2006).
Location theory partly is based on theories on land values. Already back in 1776, Adam Smith mentioned that rent varied depending on the fertility and situation of land. But the most important early treatment of agricultural land value was presented at the beginning of the 19th century by David Ricardo (1817: On the Principles of Political Economy and Taxation). Though Ricardo focused his attention primarily on fertility differentials he also “recognized as well that land which is nearer the market bears lower transport costs on its produce than more distant land, and that this advantage also accrues to the landlords on form of rent as a result of competition among the
Urban theory and planning paradigms
76
farmers” (Alonso, 1964: 3). But Smith didn’t say anything about its valuation, neither did Ricardo offer any method for judging its value (Alonso, 1964: 4).
Johann Heinrich von Thünen is considered to be the founder of location theory as in 1826 he brought forward his famous theory of concentric rings of agricultural land uses. He was the first to ask whether spatial patterns appear because of the influence of economic forces. Up to then it was assumed that patterns in land uses were basically influenced by the characteristics of the soil. “The various agricultural land uses around a market place bid for the use of land, and land is assigned to the highest bidder in each case. The rent each crop can bid at each location will be the savings in transportation of its product that that site affords in contrast with a more distant site” (Alonso, 1964: 3). Given von Thünen’s assumptions and operating over his hypothetical space he argued that sites would distribute and agricultural land uses would “segregate into a spatially hierarchical structure” (Torrens, 2000b: 12).
In his theory von Thünen followed an analytical approach applying the concept of land rent and introducing a spatial differentiation of it. He fell back on Adam Smith’s (1776) definition of land rent from which says that land rent is the highest price a user is able to pay to the land owner. “According to Smith the lease a farmer has to pay is fixed by subtracting from the farmer’s turnover the costs for labour, purchases, and maintains to keep the farm running including an average personal income farmers in the neighbourhood make” (Moeckel, 2007: 36). Land rent referring to a specific good accordingly can be defined as a function of the market price for this good, its average production costs, its transport costs, and its optimum production output by the following form:
* tx)q-*AC-(pL(x)
whereas
L(x): land rent of the commodity at location x
p: market price for unit of the commodity,
AC*: average production costs per unit of commodity at the optimal production amount,
tx: transport costs of the commodity from the location of the production to the market, and
q*: yield per unit of land.
Therefore, land rent is influenced by the distance of the firm to the location of the market:
transport costs to move one unit of the commodity to the market,
change of the optimum output of units produced which decreases with growing distance, and
resulting changes of the average costs for producing one unit of the commodity (Maier & Tödtling, 2006: 124).

Urban theory and planning paradigms
77
Von Thünen’s model is highly generalised and based on a number of simplifying
assumptions. The basic assumptions of von Thünen’s model are:
an isolated state consisting of a uniform plain of unvarying soil quality without topographic features like mountains or rivers, etc.,
a dominating city in its centre where all consumers concentrate and all market activities take place,
equal transport costs and opportunities in all directions from the central city being proportional to distance, and
land owners and renters are assumed to act rationally so to maximise profits (Krugmann, 1996).
Land rent is the central element of von Thünen’s theory and explains which product is produced at which location. Each product has a specific production function. This is composed as illustrated in Figure 31 (above) by the following factors: market price, production costs, transport costs, and land rent. Market prices and production costs are equal for every producer. But transport costs vary: at the city centre the transport costs are zero but increase with increasing distance to the centre. The differences in increasing transport costs are related to the weight and perishability of the respective good. Accordingly, land rent decreases until at a specific distance its value reaches zero. At that point and at all more peripheral areas from the city centre the production of the good is no longer profitable for the farmer.
The varying land rent graphs of various goods form out a specific distribution of land uses according to where which product can bid for the highest land rent. As can be seen from Figure 31 (below) in the inner ring product A has the highest land rent and most probably this good will be cultivated in the concentric ring between the city centre and distance d1. At distance d1 there is a change as from there on product B shows the highest land rent and presumably will be cultivated until distance d2 where the production will shift to product C until d3 where land rent reaches a value of zero.

Urban theory and planning paradigms
78
Figure 31: Land rent as described by von Thünen
Source: Own illustration; based on von Thünen, 1826
Reality, of course, exhibits discrepancies to the simple land rent models due to the abstract assumptions. One basic driver of urban location decisions is obviously road infrastructure. The basic influence of roads on land prices can be seen from Figure 32 where land prices are illustrated in a three-dimensional way giving concern to road structures and important nodes in the network.
Figure 32: Land prices regarding distance to CBD and the road network
Source: Own illustration; based on Heineberg, 2006: 119

Urban theory and planning paradigms
79
Von Thünen himself illustrated this issue by means of integrating a river representing an important route of transport at that time for agricultural commodities (see Figure 33).
Figure 33: Von Thünen’s concentric rings of agricultural uses
Source: von Thünen, 1990: 272 f
Though von Thünen formulated his theory in the first half of the 19th century his theory still is very relevant. Many modern theories on the inner structure of cities build up on von Thünen’s theory. And although his assumptions and conclusions were deducted from agricultural land uses only, the basic mechanisms affect all land uses in general as they influence all economic decisions (Maier & Tödtling, 2006: 121). “Perhaps the most important features of von Thünen’s theory are its uncompromisingly ‘classical’ structure and the fact that it is an equilibrium theory. In other words it describes a static climax towards which the system will tend if no disturbances are applied; whilst it admits the possibility of change, such a change is simple and discontinuous” (McLoughlin, 1969: 60 f). Samuelson highlighted the relevance of von Thünen’s theory saying that he “belongs in the Pantheon with Leon Walras, John Stuart Mill, and Adam Smith. As Schumpeter would say, it is the inner ring of Valhalla they occupy” (Samuelson, 1983: 1482). Actually, the famous regional scientist Walter Isard (1956) has called von Thünen "the father of location theorists”.
For the rest of the 19th century, studies of location, especially exploring agricultural issues, seemed to be nearly absent, due to the fact that Western Europe was dominated by industrialisation and urban growth of unprecedented speed. Alfred Marshall in his 1890 opus “Principles of Economics” devoted one chapter to urban land values but concerned himself almost entirely with profit-making land uses, such as retail stores or manufacturing plants. He considers the advantages of the location of a site (situation value) as well as the size of a site in relation to the building upon it (Alonso, 1964: 4). Marshall states that “if land is cheap he [the entrepreneur] will take much of it; if it is

Urban theory and planning paradigms
80
dear he will take less and build high” (Marshall, 1916: 448). He draws the conclusion that “the industrial demand for land is in all respects parallel to the agricultural” (Marshall, 1916: 450). Accordingly, urban (Marshall did not include residential purposes) and agricultural users place bids for various sites referring to their respective location advantages.
In 1903, R. M. Hurd published his “Principles of City Land Values”. He outlines a theory for urban land which resembles von Thünen’s theory on agricultural land uses. He summarises the connectivity of value and closeness as follows: “Since value depends on economic rent, and rent on location, and location on convenience, and convenience on nearness, we may eliminate the intermediate steps and say that value depends on nearness” (Hurd, 1903: 13). Hurd also neglects residential land uses saying that “the basis of residence values is social and not economic - even though the land goes to the highest bidder” (Hurd, 1903: 77).
The beginning of the 20th century brought forward some new approaches. But location studies at that time still were clearly dominated by considerations on individual firms. “Towards the end of the century Launhardt applied geometric principles to the study of location of certain industries and Halford MacKinder (1902) provided development of ideas which were to be carried further still by Weber (1909)” (McLoughlin, 1969: 61). They all assumed the behaviour of firms and their respective entrepreneurs to be rational and responding to the forces of the market and of transport costs. Again the optimum location for a firm was given by an equilibrium point.
McLoughlin describes the following inter-war years as with a main focus of research shifting into two directions: land-use patterns and the hierarchical formation of urban centres. He points out that the patterns of different land uses making up urban areas was subjected to similar sorts of analysis as that used by von Thünen a hundred years before for agriculture. Alonso categorises the approaches at that time as follows: the ‘Land economists’, the ‘Ecologists’ and the class of ‘Other theories’ (Alonso, 1964: 6 ff). Robert M. Haig developed some principal tenets of land economics in 1926. The innovation in his theory laid down in “Towards an Understanding of the Metropolis” was his strong statement about the complementarity of rent and transport costs. He defines transportation as a device to overcome ‘Friction of space’. He argued that the better the transportation system gets, the less the friction. But site rentals and transport costs represent the costs of the remaining friction and their sum varies with the site. He derived an interesting hypothesis: “the layout of the metropolis (...) tends to be determined by a principle which may be termed the minimizing of the costs of friction” (Haig, 1926: 421 ff). Richard U. Ratcliff restated this in 1949 arguing that ”the perfect land market would produce a pattern of land uses in a community which would result in the minimum aggregate land value for the entire community. The most convenient arrangement results in the lowest aggregate transport costs; in terms of saving of transportation costs, the advantages of the more convenient sites are reduced”. Haig also gave some deliberations on residential land. “In choosing a residence purely as a consumption proposition one buys accessibility precisely as one buys clothes or food. He considers how much he wants the contacts furnished by the central location,

Urban theory and planning paradigms
81
weighing the ‘costs of friction’ involved - the various possible combinations of site rent, time value, and transport costs; he compares this want with his other desires and his resources, and he fits into his scale of consumption and buys” (Haig, 1926: 423). Alonso stressed the fact that neither Haig nor later writers explained how the minimisation of the individual leads to a minimisation of the aggregate (Alonso, 1964: 7).
In parallel to the development of literature in land economics literature in human ecology developed. The main representatives of the social ecology movements were located at the University of Chicago, Department for Sociology (Robert E. Park, William Thomas, Ernest W. Burgess, Louis Wirth). The ecologists understand the city as a body alive where most of the economic and cultural impulses come from the CBD. The free market drives the city’s development being characterised by the Darwinian ‘Survival of the fittest’. Their approach to patterns of location in cities assumes that the latter result from ecological competition between plant and animal species (Park et al., 1925). This approach later on was also labelled as ‘Urban geography’ or ‘Urban sociology’.
In the mid-1920s Burgess (1925) developed the concentric zone theory of urban land uses which was also based on bid rents. In contrast to von Thünen’s approach the one of Burgess is descriptive rather than analytical (Harvey, 1996). His theory is based on the examination of the historical development of Chicago through the 1890s and on the “assumption that a city grows by expanding outwards from a central area, radially, in concentric rings of development” (Torrens, 2000b: 13).
Figure 34: The concentric zone model of Burgess
Source: Heineberg, 2006: 111
As can be seen from Figure 34 Burgess distinguishes five zones in his theory:
central loop area: the focus for urban activities (CBD) also being the confluence of the city’s transportation infrastructures,
zone in transition: generally a manufacturing district mixed with some residential dwellings,

Urban theory and planning paradigms
82
zone of workingmen’s homes: this zone also comprises factories and is further characterised by a predominantly working class population living in older houses and areas generally lacking amenities,
residential zone: this ring includes newer and more spacious housing for the middle classes, and
the outer commuter zone: this band is dominated by better quality housing for upper class residents and boasts an environment of higher amenity (Torrens, 2000b: 13 f).
Another famous work of the ecologists was the one conducted by Parks, Burgess, and McKenzie (1925). They were the first to take land-use patterns as the starting point of their analysis. They argued that for this discipline “land values are the chief determining influence in the segregation of local areas and in the determination of the uses to which an areas is put” (Wirth, 1925: 203). “The ecologists view land values as a result of a bidding process by potential users, by which the pattern of location of land uses in the city is determined” (Alonso, 1964: 9). For example Quinn stated that “Land values (...) affect, as well as reflect, the struggle for location within the metropolis” (1950: 449).
Though the studies of Park and Burgess had some weaknesses (e.g., in terms of data selection and their assumption of “a somewhat blind response by communities to ecological ‘forces’” (McLoughlin, 1969: 62)) they brought into focus of interest the central fact of change. This issue was taken up again by Hoyt (1939) in his studies on the process of change in the pattern of residential urban areas. He based his thoughts about the dynamic process of urban growth and change on the ecological notions of competition, invasion, and succession (McLoughlin, 1969: 61 f).
The large body of literature which Alonso summed up as ‘Other theories’ is characterised by the recognition of the imperfections of the land market. It is “dealing with such matters as the very imperfect knowledge of the market by buyers and sellers, the legal complexities of the ownership and occupancy of land, the effects of zoning and taxation, and the permanence of structures, which tie down the land for long periods of time to given uses” (Alonso, 1964: 12).
The second new focus of research during that time as described by McLoughlin was laid on the centre of the city and the formation of systems of city centres. Walter Christaller and his classic work of a central place theory followed this direction (1933). From some basic economical relations Christaller deducted statements about the spatial distribution of locations for production and businesses (Maier & Tödtling, 2006: 139). His statements are based on basic assumptions concerning the character of the observed area, the behaviour of suppliers and consumers, and the type of market:
a boundless and homogeneous plain with an evenly distribution of transport network, of population, and factors of production; all individuals are equal regarding income, purchasing power and consumer needs; transportation costs are direct proportional to the distance,

Urban theory and planning paradigms
83
producers behave rationally in terms of benefit maximisation and consumers behave rationally regarding utility maximisation; all individuals are equally informed; each supplier only produces one good, and
the market is polypolistic, market prices are a datum for suppliers and consumers; by introducing the spatial dimension one premise of perfect markets is intentionally cancelled: the punctual local market; the number of suppliers has to be minimised; a specialisation of supply in single locations is prohibited (Schätzl, 1998).
Christaller defined a basic theory explaining size, number and spatial distribution of suppliers (Gaebe, 2004: 110). “In an elegant and rigorous statement, Christaller demonstrated how, under specified conditions, a nested hierarchy of central places would result, distributed in a hexagonal pattern of ‘service areas’” (McLoughlin, 1969: 62). Christaller’s theory not only accounts for a network of cities, it can also be applied to inner-city structures that form an inner-city hierarchy (Heineberg, 2006: 102).
Christaller defines market areas of specific products and delimits specific market ranges for products being defined by a distance where the effective total price of getting the good (production costs plus transport costs) is too high to cause any further demand (outer line of the concentric rings in Figure 35, part a). On the other side a business having fixed costs or spendings needs at least a minimum number of sales to be able to produce without deficits. This number of sales corresponds to a minimal market range where this minimum demand is generated. Accordingly, the lower market range can be delimited (inner dotted line of concentric rings in Figure 35, part a). Besides the production function of a good the size of the market ranges are influenced by the population density and by transport costs. These three parameters characterise both ranges of the market of a good and form out ideal market sizes (Maier & Tödtling, 2006: 139 ff). This ideal market sizes correspond to Figure 35, part c) when the businesses gain a benefit of zero. In contrast to this in part a) of the figure the black coloured areas are not appropriately supplied. New businesses may enter the market as there is still demand for that good. In part b) of the same figure it turns the other way around: as market ranges overlap significantly some of the businesses will have to shut down (in this example the business in the centre of the figure) as their market ranges are too small to reach their minimum quantities of sales.
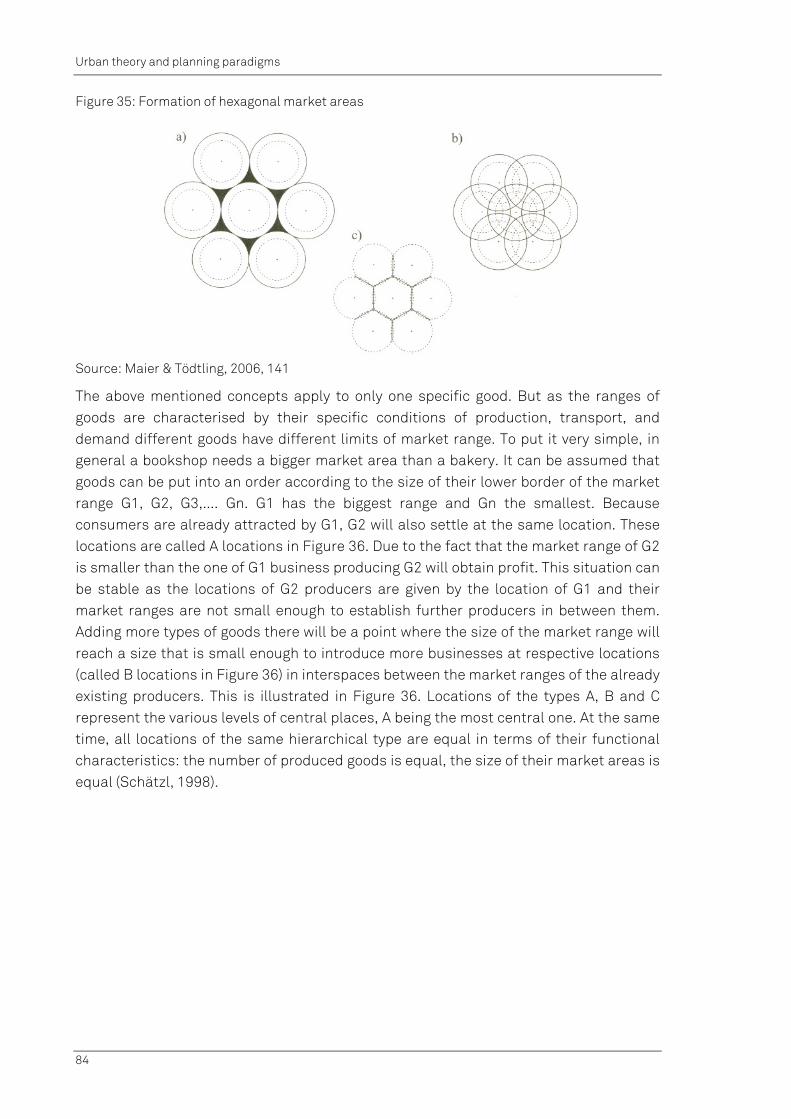
Urban theory and planning paradigms
84
Figure 35: Formation of hexagonal market areas
Source: Maier & Tödtling, 2006, 141
The above mentioned concepts apply to only one specific good. But as the ranges of goods are characterised by their specific conditions of production, transport, and demand different goods have different limits of market range. To put it very simple, in general a bookshop needs a bigger market area than a bakery. It can be assumed that goods can be put into an order according to the size of their lower border of the market range G1, G2, G3,.... Gn. G1 has the biggest range and Gn the smallest. Because consumers are already attracted by G1, G2 will also settle at the same location. These locations are called A locations in Figure 36. Due to the fact that the market range of G2 is smaller than the one of G1 business producing G2 will obtain profit. This situation can be stable as the locations of G2 producers are given by the location of G1 and their market ranges are not small enough to establish further producers in between them. Adding more types of goods there will be a point where the size of the market range will reach a size that is small enough to introduce more businesses at respective locations (called B locations in Figure 36) in interspaces between the market ranges of the already existing producers. This is illustrated in Figure 36. Locations of the types A, B and C represent the various levels of central places, A being the most central one. At the same time, all locations of the same hierarchical type are equal in terms of their functional characteristics: the number of produced goods is equal, the size of their market areas is equal (Schätzl, 1998).

Urban theory and planning paradigms
85
Figure 36: Network and overlapping of Christaller’s central places
Source: Own illustration; based on Heineberg, 2006: 88
Christaller’s theory has some weaknesses as to explain the actual formation of real phenomena due to its modelling assumptions. For example it neglects the interrelations both between the businesses themselves (localisation and agglomeration effects), between businesses and population, and the location preferences of the latter. Concentrations of businesses do not impact on the location of population although such concentrations might attract inhabitants because of good supply and job opportunities. Accordingly, his central places do not show the typical central or better to say urban character as should be assumed (Maier & Tödtling, 2006: 147 f). Moreover, Christaller’s concept was criticised as its two basic premises were too strict: he assumed the ‘homo economicus’ and secondly he assumed perfect market conditions. Thereby, he founded his theory on two premises that exhibit deficits as his idea of mankind is inadequate and additionally it excludes organisation structures which are not conform to the model of a market (Blotevogel, 1996: 13). However, the conceptual value of Christaller’s theory is undisputable. Von Böventer judged von Thünen’s theory as being one of the most inventive and most important publication dealing with economic interrelations in space of the 20th century (von Böventer, 1968: 102).
Whereas Christaller’s theory on central places suggested a static equilibrium of distribution there were others like for example Colby (1933) showing that “although such assumptions of equilibrium may be necessary for the study of the phenomena, these were in fact highly dynamic if not inherently unstable” (McLoughlin, 1969: 62). For example August Lösch in his opus “The economics of location” (1940: Die räumliche Ordnung der Wirtschaft) developed a theory of market networks, that further developed Christaller’s approach, but which could react more flexible to dynamic changes (Maier &

Urban theory and planning paradigms
86
Tödtling, 2006: 148). Following Christaller, Lösch developed hexagonal market areas of goods. But the system of market nets differs as only in the centre all products are produced. Accordingly, Lösch overlaid all market nets forming a common centre where all goods are produced. Afterwards, he rotated all market networks until the maximum number of production locations interfered with each other. At the same time the area could be dissembled into twelve areas whereof six were areas with higher concentration of location densities and six had a lower density (see Figure 37). Thus, there are sectors that show few cities and sectors which include many cities. At the borders of these sectors the main road networks emerge. Furthermore, a tendency can be observed that with growing distance to the main and central city the size of the assigned centres increases (Schätzl, 1998: 83 ff).
Figure 37: Market nets as described by Lösch
Source: Own illustration; based on Heineberg, 2006: 102
McLoughlin reports about the 1940s that in 1941 Ullman “advocated the extension of central place theory to the study of the size and spacing of cities and to the disposition of land uses within them. Later he and Harris (1945) produced a seminal study of the patterns of land-use distribution within cities, developing the earlier ‘concentric ring’ and ‘sector’ hypotheses into their ‘multiple nuclei’ theory. Hoover (1948) continued the development of work on the location of firms but extended it significantly to include treatment of locational change, competition for locations and the influence of public policies on locational choice” (McLoughlin, 1969: 63).
McLoughlin described the state of affairs at the end of the Second World War as being characterised by two great common factors that shaped all explanations of locational or spatial patterning of human activities:
the idea of an equilibrium condition, and
the assumption that all locational decisions were made rationally in order to maximise the benefit by selecting the (economically) optimal location (McLoughlin, 1969: 63).
The authors would like to stress their understanding of system dynamics emphasising that even the process of trying to reach an equilibrium state is not static system behaviour but rather a dynamic process itself. Therefore, it is not surprising that in the following years, there was a clear shift away from these assumptions towards a more

Urban theory and planning paradigms
87
dynamic understanding of city development. Change was understood as “endemic, the normal condition, equilibrium a useful way of describing short periods of time, a convenient abstraction” (Turvey, 1957). One “must strive to understand the environment as a changing back-cloth against which individual decisions are made, at the same time recognising that the effect of the subsequent action is to alter the back-cloth itself in complex ways!” (McLoughlin, 1969: 59).
The second assumption mentioned above, “the foundation of a whole world of economic and location theory, received a rude shaking in 1944 from von Neumann and Morgenstern” (McLoughlin, 1969: 64). They introduced two important notions into the theory of decision making: the state of information and the attitude towards risk of the decision maker. They linked the making of businesses to strategies in games and accordingly relied on and stimulated developments in the mathematics of probability at the same time (McLoughlin, 1969; 64 f).
McLoughlin described the situation at the start of the 1960s as “one of rapid evolution in the development of theories of human locational behaviour. Emphasis was clearly shifting rapidly away from the earlier static equilibrium notions which, whilst accepting the existence of changes in land use and demographic patterns, made little attempt to offer behavioural explanation. In its place we see change assuming a central position in its own right both in the sense of ceaseless regular and random interaction between activities via communication and transport and in the sense of the evolution of spatial configuration in response to sequences or chains of modifying actions made to the environment by individuals, firms and institutions” (McLoughlin, 1969: 67 f).
At this point in time Alonso merged the existing theories on agricultural land uses and his new theory on residential land to “a unified theory of land uses and land values” (Alonso, 1964: 2). He himself claimed that his “method is that of economics, and the concern ultimately geographic” (Alonso, 1964: v). Alonso’s theory “concerns the relation of land values to land uses within the city. The focus of attention will be on residential land” (Alonso, 1964: 2). He explains this emphasis as being due to the fact that most urban land is residential and that the theorists of urban land values and land uses had broadly neglected residential land use so far.
He commences his deliberations on this issue by sketching the abstract situation that an “individual who arrives in a city and wishes to buy some land to live upon will be faced with the double decision of how large a lot he should purchase and how close to the center of the city he should settle” (Alonso, 1964: 18). He purposefully simplified the individual to be a ‘Economic man’ for the analysis of his decision-making by abstracting the fact that in “reality he would also consider the apparent character and racial composition of the neighbourhood, the quality of the schools in the vicinity, how far away he would be from any relatives he might have in the city, and a thousand other factors” (ibid.). Additionally, the city is a simplified one, too.
The individual has a certain income at his disposal. This restriction of the budget describes his opportunities of choices as out of this budget he has to pay land costs, commuting costs and all other expenditures called composite good. He assumes that

Urban theory and planning paradigms
88
land prices decrease with increasing distance from the city centre while commuting costs will increase with increasing distance.
Alonso’s budget equation is given as follows:
tkqtPpy z z
where
y: income
pz: price of the composite good
z: quantity of the composite good
P(t):price of land at distance t from the centre of the city
q: quantity of land
k(t): commuting costs to distance t
t: distance from the centre of the city
This leads to a 3-dimensional shell-like surface diagram containing all possible combinations of the three variables (z, q and t) open to the consumer defining the so called locus of opportunities. In combination with an indifference curve representing the individual’s preferences the defined individual equilibrium will correspond to that opportunity which yields the individual greatest satisfaction (ibid.: 19 ff).
6.1.3. Spatial diffusion theory
Modelling urban development processes following a CA-based approach assumes spatial processes of urban change to take place in wave-like and decentralised manner in form of spatial diffusion. The term diffusion goes back to the Latin word diffugere which means to scatter. It is used to describe the action and the result of action “to spread, or to transmit and propagate in a uniform way” (website Hypergeo). In general, spatial diffusion is expected to be some phenomenon where the locational or distributional pattern changes over time.
An early scientific approach to diffusion phenomena in the context of physics was the analysis of movement of gasses between two vessels (Morrill et al., 1988: 16) where the system tries to bring the two concentrations to an equilibrium state where the degree of concentration is the same for the whole system. Besides physical science diffusion approaches were also developed in other scientific fields like for example mathematics, biological science, sociology, economics and spatial sciences.
Windhorst structures diffusion research in the spatial context which was in the early stages basically connected to the issue of space-related innovation diffusion, into four phases: ethnographical phase, cultural landscape genesis phase, model-oriented phase and (interdisciplinary) re-orientation (Windhorst, 1983: 5 ff). The first phase is mainly connected to Friedrich Ratzel, who in his in 1891 published work ‘Antropogeographie’ already mentioned some thoughts that are very close to some of the questions being
Urban theory and planning paradigms
89
examined in the later innovation and diffusion research. In a chapter about the spread of ethnographical characteristics he mentioned that the spread of ethnographical item is mostly connected to people and their movements. Additionally, some items apparently spread more quickly than others what is due to the fact that these items seem to be more necessary or liked by the people whereas on the other hand other things are neglected and forgotten if people don’t like them. Thus, this phase was very much related to the static capture of overlays of cultural elements and didn’t look at the dynamic processes of overlaying or the mechanisms of spread. A sociological approach in this phase was done by Tarde (1903) who introduced the future standard metaphor of the wavelike spread of an innovation. This phenomenon can easily be compared and visualised with a stone that is thrown into water. From the point where the stone hits the water waves appear radiating outwards becoming smaller and smaller (Windhorst, 1983: 5 f).
The second phase is titled cultural landscape genesis phase and comprises the period between 1920 and 1952. In this phase some first dynamic and processoral perspectives for the analysis of cultural changes were introduced. Hettner in 1927 picked up the thoughts of Ratzel and added a more dynamic point of view. One popular author of this phase that was characterised by the branch of ‘Kulturraumforschung’ (research on cultural areas) was Müller-Wille, who started to collect and analyse spatio-temporal processes of spread. Research on culture areas focused on issues like culture traits, culture origins, culture flows and culture borders. But is has to be summarised that these approaches were still far away from what was later on the subject of innovation and diffusion research. Thus, diffusion processes were not illustrated by consequently mapping its temporal distribution patterns (Windhorst, 1983: 7 ff).
Two sociological studies were very important for the next phase of innovation and diffusion research. One was a study conducted by the Swedish social scientist Svensson in 1942 under the title ‘Studies on the Relationship between Innovations and Traditions’. Analysing the distributional processes of innovation in settlements he continued to look at spatial aspects and tried to add quantitative analyses wherever possible considering data issues. The second influencing study was conducted by the American scientists Ryan and Gross who in 1943 published a contribution titled ‘The Diffusion of Hybrid Seed Corn in Two Iowa Communities’. They analysed the distribution process considering the temporal development and, furthermore, approached the question of whereby the adaptors were influenced in their decision to adopt the innovation and whether their behaviour changed during the time of applying the innovation (Windhorst, 1983: 11 f). The importance of these two studies is due to the fact that they basically influenced Torsten Hägerstrand’s work.
Hägerstrand marked the beginning of a model-oriented phase of innovation and diffusion research (1952-1974). He described the similarities and differences between his study and the Svensson one as follows: “The fundamental idea of this book can be said to be identical, except that twentieth-century sources are constantly used. A series of objects (...) are studied with an eye to the same questions considered by Svensson. However, a significant difference exists in that the main stress is not placed on the initial

Urban theory and planning paradigms
90
appearance of a change, as with Svensson, but rather in subsequent events: How does the adoption of an innovation become widespread once it has come into a ‘settlement’?” (Hägerstrand, 1967: 5). Hägerstrand was the first researcher to really consider spatial aspects and the approach of spatial diffusion in geography in his pioneering paper on innovation diffusion as a spatial process (1952). A book in Swedish followed in 1953 and was translated into English in 1967 (Hägerstrand 1953, 1967). Benenson and Torrens explicitly call the model of innovation the ‘Forerunner of geosimulation’ as the “model of innovation diffusion is now quite famous, but something important lies buried in that early work and is often missed; it is this: Hägerstrands model invokes geosimulation, and does this back in the 1950s! The simulation models he describes (...) are dynamic, of high resolution, and built in the fashion of general system theory, i.e. with consideration of phenomena as a result of collective processes subject to what we now call self-organization” (Benenson & Torrens, 2004: 77) ignoring “the dynamics of innovation as collective dynamics” (Benenson & Torrens, 2004: 78). This is due to the fact that until the 1950s geographic interpretations of urban systems were oriented towards optimality and, generally steady structures of equilibrium. Geographic theory followed the mainstream of natural sciences in the nineteenth century searching for theories on location to define an optimal spatial distribution of land uses, settlements, facilities, etc. This approach and understanding of location studies being studies of the equilibrium city (Benenson & Torrens, 2004: 73; see also Chapter 6.1.2) had its start more than 100 years earlier by Johann Heinrich von Thünen and his model of agricultural land uses called the Thünen rings (von Thünen, 1826). Further examples for this tradition deal with the central place theory (Weber, 1909; Christaller 1933), the equilibrium of urban land rent (Alonso, 1964) and the power distribution of settlement size (Allen, 1954; Clark, 1967) which is still a recent research topic (Gabaix, 1999; Blank & Solomon, 2000; Batty, 2001, Ioannides & Overman, 2003). Although the revolutionary contribution of Hägerstrand was also published in the 1950s it remained unclaimed for quite some while (Benenson & Torrens, 2004: 73)15.
Hägerstrand tried to explain more than just the recent status-quo of the phenomena. “When the purpose of the study is an understanding of the present but quickly changing world, it seems important to seek means of limiting the scope of the problem without casting overboard the essential aspect of time. If attention is directed to the process of change itself, the development of such means becomes possible” (Hägerstrand, 1967: 2). Hägerstrand conceptualised the adoption of innovation (he included the rotation of crops with pasturing and the improvement of natural grazing areas) mainly as a result of a learning process. The adopters in the Hägerstrand models were people which can either adopt the innovation or not. Adoption in this model occurs if the adopter has received enough information as to overcome his resistance of adoption. Information is transmitted in form of messages from adopters, who transmit from the moment of adoption. Neighbours receive these messages so that the ones who are closer to the
15 For a more comprehensive overview on the development of urban modelling the reader is referred to Benenson and Torrens (2004), for a more comprehensive review on location theory during the nineteenth and the first half of the twentieth century the reader is referred to (Haggett et al., 1977).

Urban theory and planning paradigms
91
sender are more likely to receive a message. If a receiver is already an adopter himself the message gets lost. If he is not he either adopts immediately or stores the message until accumulating enough information to adopt (Brown, 1968: 40). With the definition of neighbourhoods (or proximities) at special distances he introduced the so called ‘neighbourhood effect’ which assumes that most individuals have a spatially biased ‘field of information’ which is rich in information at areas that are proximate to their own home and poor in information in areas that are remote. This spatial bias leads to a spread of innovation that occurs gradually over space. Hägerstrand’s models already showed that there is a match between the phenomenon being diffused and the peoples’ needs (Morrill et al., 1988: 24). Thus, spatial diffusion can be described as “the process by which behaviour or characteristics of the landscape change as a result of what happens elsewhere earlier” (Morrill et al., 1988: 67). ‘Elsewhere’ in this context is understood as a neighbourhood around the viewed cell in which some kind of influence is observed. The size of the neighbourhood may vary depending on the phenomenon viewed. Moreover, the neighbourhood is not obligatory modelled as a homogenous area. In fact, the theory assumes that the degree of influence of the surrounding cells declines with increasing distance to the observed cell.
Besides this dynamic aspect that Hägerstrand introduced he also did pioneer work assuming that innovation diffusion is a collective dynamics phenomenon. Even “in the 1970s a view of geographic systems in a context of collectives of individual elements was far beyond the horizon of the general state of the scientific mindset in that period. In 1967, geography easily accepted the dynamic part of Hägerstrand’s work; it ignored a not less important part: the dynamics of innovation as collective dynamics” (Benenson & Torrens, 2004: 78).
Hägerstrand developed several models to find a suitable simulation whose results fit to the observed process in his model area. As he sought for quantitative results he defined a quite small area as his model area. This was due to the fact that at the time of his research it was “extremely laborious to process materials relating both to the indicators themselves and to relevant ecological variables” (Hägerstrand, 1967: 5). All models were implemented on a 9 by 9 cell grid each representing 5 by 5 km. An odd number of cells were used to be able to define one cell that could be designated as the geographic centre of the model area. It was assumed that the population of the model area was evenly distributed assigning 30 persons to each cell (Hägerstrand, 1967: 137). Model 1 assumed that all persons are informed about the innovation and that adoption occurs in a random order and at random places only. The results of Model 1 did not correspond with the experimental data. In Model 2 the assumed that individuals directly inform each other with respect to innovation. In the beginning only one person is informed about the innovation, acceptance or defeat occurs immediately and the information is forwarded further. Moreover, he introduced the ‘mean information field’ (see Figure 38) which describes the probability of contact at different distances and direction. Model 2 showed better results but was still not satisfactory. Model 3 assumed that there is delay in acceptance and further transfer of the information. The implementation accordingly needed the introduction of resistance. Individuals may receive information several times

Urban theory and planning paradigms
92
before adopting the innovation. Additionally, the accepted information is only forwarded after some constant time interval. Model 3 demonstrated some reasonable result matching quite well to the observed phenomenon (Benenson & Torrens, 2004: 78).
Figure 38: Mean information field probabilities (left) and numeric ranges (right)
Source: Hägerstrand, 1967
In the following years researchers carried forward research on diffusion processes in spatial contexts. “Locational patterns at any particular time are the result of several processes acting together through time and space. Especially important among these processes is spatial diffusion, usually studied from the viewpoint of a particular phenomenon” (Brown, 1968: iii). The territorial expansion of a city is one example for this kind of process and can well be described and simulated considering this understanding. Brown assumed six basic elements of a typical spatial diffusion situation:
an area or environment,
time which may be divided into successive intervals designated as t, t+1, etc.,
an item being diffused,
places in which the item is located in time t, termed places or nodes of origin,
places in which the item is located (for the first time) in time t+1, called places or nodes of destination, and
paths of movement, influence, or relationship between places of origin and places of destination (Brown, 1968: 9).
Moreover, he introduced two distinct types of spatial diffusion which may be mixed up in an actual situation: relocation-type diffusion and expansion-type diffusion (see Figure 39). On the one hand relocation-type diffusion occurs when the location of the phenomenon changes over time and the old location is abandoned. On the other hand expansion-type diffusion happens if new agents possessing the phenomenon are added to the situation. In the case of land use and urban growth this generally means additional settlement areas.
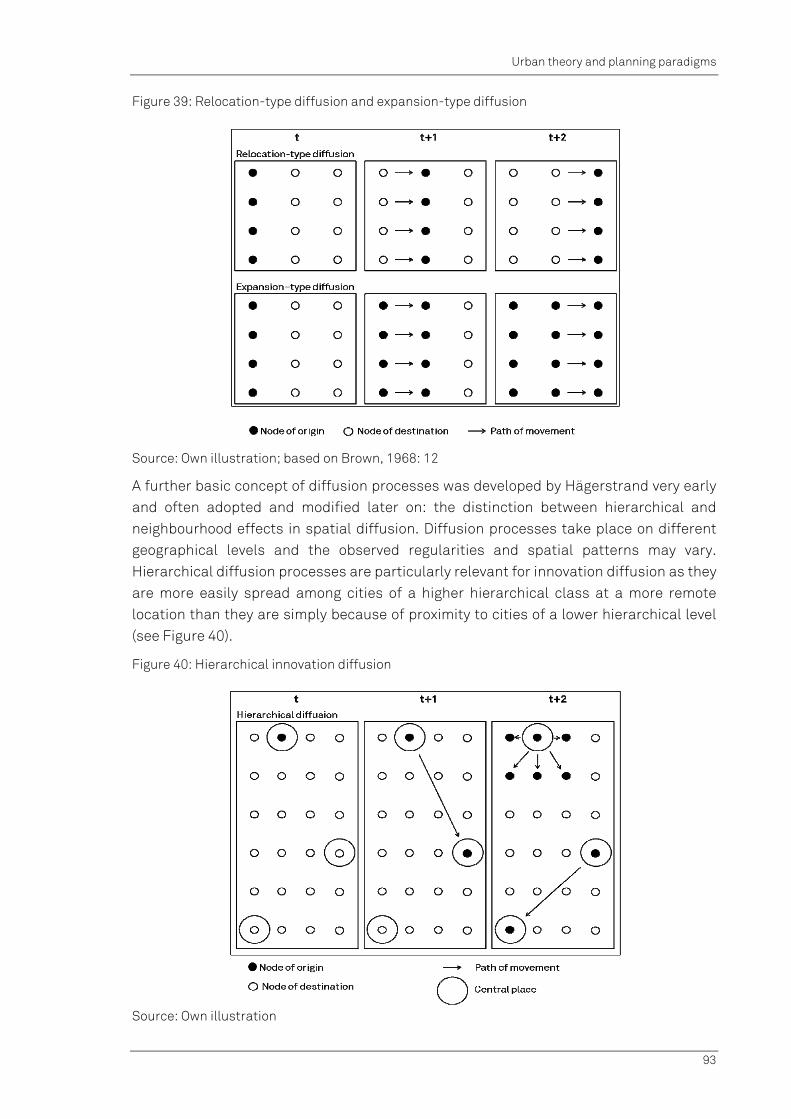
Urban theory and planning paradigms
93
Figure 39: Relocation-type diffusion and expansion-type diffusion
Source: Own illustration; based on Brown, 1968: 12
A further basic concept of diffusion processes was developed by Hägerstrand very early and often adopted and modified later on: the distinction between hierarchical and neighbourhood effects in spatial diffusion. Diffusion processes take place on different geographical levels and the observed regularities and spatial patterns may vary. Hierarchical diffusion processes are particularly relevant for innovation diffusion as they are more easily spread among cities of a higher hierarchical class at a more remote location than they are simply because of proximity to cities of a lower hierarchical level (see Figure 40).
Figure 40: Hierarchical innovation diffusion
Source: Own illustration

Urban theory and planning paradigms
94
A lot of further research followed up especially on the following issues: analysis and application of parts of the Hägerstrand model including the development of computational models to simulate the real world processes; the application of the models on real world diffusion processes; the application of the model on non-innovative processes like migration movement and the spread of ghettos; mathematical descriptions of diffusion processes in the context of the quantitative revolution (Windhorst, 1983: 17 f)16.
6.2. Planning paradigms
The following section gives a short introduction to the development of planning paradigms over the last decades with a special focus on developing countries and Tanzania in particular.
6.2.1. Changing planning paradigms
Spatial planning is embedded into a changing framework of specific attitudes of individuals and societies towards planning. This framework can be called planning paradigm (Kuhn, 1962/1981) or planning approach (Bunge, 1983, 1996) and defines the underlying way of thinking that influences our knowledge and actions (Kuhn, 1962/1981; Schönwandt & Voigt, 2005: 771). A planning paradigm influences what is being planned and how it is done in the context of urban and regional planning. Schönwandt and Voigt compare planning approaches to a pair of eyeglasses by which planners observe the real world. These glasses influence the understanding and perception of problems, the objectives, the repertoire of known methods and the background knowledge available (ibid: 770). An early essential contribution to the scientific debate on this topic was made by Kuhn. He argues that it is rather the specific planning paradigm of a scientist or planner than the real world outside that defines what is determined to be part of the system under study and in which way its entities behave and are interlinked (Kuhn, 1962/1981: 121). This leads to some type of map where specific details are brightened up referring to the focus and underlying paradigm of scientific research. Kuhn points out that science is not characterised by a steady growth of knowledge but in fact by a revolutionary process where the old paradigm is replaced by a new one that generally is contradictory. According to him this process can be distinguished into three phases:
“Normal” science: during this phase science is characterised by elaborating facts and details backing up a prevailing paradigm to which they are conform.
Crisis of paradigm: the more details are elaborated the more contradictions and inconsistencies arise arguing against the recent paradigm. The paradigm experiences a crisis leading to a need for change. As soon as a new paradigm emerges a revolution begins. At the beginning the representatives of both sides struggle for predominance.
Change of paradigm: the subsequent phase of change of the basic perspective can be assumed to be a scientific revolution (Kuhn, 1962/1981; Schönwandt & Voigt 2005: 771).
16 For further details and comprehensive references the reader is referred to Windhorst (1983).

Urban theory and planning paradigms
95
As an offspring of architecture planning emerged as an own discipline at the beginning of the 20th century concentrating on spatial development on a larger scale (Velibeyoglu, 1999). Urban planning is characterised as a holistic approach including fields such as housing, transport, workplace development, etc. Since then, there have been some considerable shifts in planning paradigms which can briefly be summed up as follows: until the post war period in the late 1960s planning was understood as ‘comprehensive planning’ which was an extremely deterministic, technocratic and positivistic approach basically influenced by civil engineering (Rode, 2006: 3). The idea was applied largely in form of big schemes or plans which at that time often were called ‘masterplan’. It was believed that a masterplan “when defined and implemented, could solve all key problems” (Rode, 2006: 3). Real life exhibited that these solutions often caused new problems due to knowledge gaps in form of incomplete information about existing and future development and interlinkages in between. In developing countries many plans were basically meant to confine unplanned development but never got implemented at all.
As a reaction in the 1970s the approach of ‘disjointed incrementalism’ was introduced. “This pragmatic planning approach of un-coordinated small steps focuses on specific problems and offers solutions within a realistic, short-term framework. Incrementalism aims to implement small but noticeable improvements, adjusts its goals to its means and is based on a selective, non-comprehensive analysis of concrete problems. The general intention was to promote new development and not to restrict it” (Rode, 2006: 4). At the same time another approach was advocated which in contradiction to the incremental approach was assumed to be able to respond to conflicts of interest. The collaborative or communicative approach understands the planner’s role as one of a mediator among involved stakeholders in a more participative planning process (Rode, 2006: 4). Following a system theory’s understanding Musto argued that feed-back loops and continuous interaction between planners and the environment were needed to replace the so far assumption of prevailing linearity of the subject-object sequence in urban planning (Musto, 1975; Rode, 2006: 4).
Friedmann highlights that the withdrawal of the nation state from the urban agenda is the most significant change in the recent past (Friedmann, 2005). “Cities are now asked to become entrepreneurial, work in partnership with the private sector and need to find ways to deal with the new responsibilities given to them. Eventually, this will lead to the development of a new planning paradigm, one that is applicable for different geographic and political contexts” (Rode, 2006: 2). This broader trend of deregulation and decentralisation which could be observed in recent times is based on a neoliberal understanding that planning was part of an overregulated welfare state which hinders economic dynamics. This leads to a streamlining of planning structures and eventually to a withdrawal of public involvement. Another branch of discussion starts from the assumption that planning deficits are mainly based on implementation inefficiency of public bodies and their forms of action and, thus, spatial planning needs more flexibility and has to involve a broader variety of stakeholders which are relevant for the implementation success (Danielzyk, 2004: 465).

Urban theory and planning paradigms
96
The above sketched changes in planning paradigms were accompanied by a shift in the understanding of the character of urban development and changes. Batty sums up the development as follows: “Fifty years ago, cities were first considered to be systems whose functioning was based on many interacting parts and whose form is manifested in a relatively coordinated hierarchy of these parts (or subsystems). Yet systems in these terms were conceived of as being centrally controlled. As the paradigm developed, there was a subtle shift to the notion that the order in many systems and their resulting hierarchies emerged from the way their parts or elements interacted from the bottom up rather than from any blueprint imposed from the top down. As complexity sciences developed they refreshed this systems paradigm with the focus changing from an analogy between cities as machines to one based on evolving biologies, whose form was the resultant of subtle and continuous changes in their genetic composition at the level of their most basic component parts. This shift in thinking is wider than cities per se. It is from thinking of the world in terms of its physics to one based on its biology, from top down to bottom up, from centralised to decentralised action, and from planned forms to those that evolve organically” (Batty, 2008: 150 f). From this, Batty deduces the question of “how control and management, planning and design which traditionally have been configured and treated from the top down might best be meshed with systems that grow and evolve from the bottom up” (Batty, 2008: 161).
6.2.2. Planning paradigms in Tanzania
Most of these shifts in planning paradigm could also be observed with some delay in developing countries as these paradigms were often imported from the former colonial countries applying the same methods and instruments. For example, masterplans were a common instrument in developing countries (see Chapter 7) but were problematic under the given framework as the power of public bodies was weak and implementation rare. Nnkya reports from research monitoring and promoting democratic change in planning practice in Tanzania that contrasting to the collaborative spatial and environmental planning approach, the expert-driven traditional planning or ‘command and control’ model (referring to Healey, 1996) has been in practice for almost half a century in Tanzania. “It is based on scientific knowledge and technical rationality and relies on legal and bureaucratic procedures to realise planning policies. In addition to the assumptions on consensus about issues at stake, required solutions, goals, programmes and actions, planning practice in Tanzania was, until recently, based on the notion of government as the ‘orchestrator’ of development, main investor and provider of infrastructure, services and employment. It was assumed that government would have resources and political will to guide and manage development as prescribed” (Nnkya, 2006: 4 f). Reality has proven that this assumption is broadly unfounded in developing countries the role of public authorities in urban development and planning is debilitated by constraints concerning financial and personnel capacities. Nevertheless, despite a lot of challenges, a more collaborative way of planning has also found its way to Tanzania and Nnkya observed that “the 1990s mark a historical turning point towards collaborative planning and hence may represent the beginning of an end to the
Urban theory and planning paradigms
97
entrenched techno-bureaucratic and prescriptive model of planning that has been in Tanzania since it was introduced by the colonial administration” (Nnkya, 2006: 2).
Developing countries are subject to an additional type of paradigm that influences urban planning and urban development: paradigms of transfer as the shortcoming of urban authorities accounted for development aid from developed countries. Kunzmann stresses that paradigms of transfer have also changed. “Throughout the history of globally practiced development aid, the paradigms of transfer changed – first from infrastructure and water to agricultural development, then from integrated rural to urban and squatter redevelopment and, more recently, from sustainable development to institution building. All this has been backed up by continuously changing development paradigms, reflecting the short-term fashions of academics, publishers and AID bureaucrats” (Kunzmann, 2005: 235). Unfortunately, again many of these strategies have proven unsuccessful, too.
The work at hand supports Batty’s understanding of urban development processes at least for developing countries assuming that urban development largely emerges bottom-up on a local scale. However, the authors assume that urban development is guided to a particular extent by planning measures in particular by infrastructure and services provision. In this context public interventions like the provision of road infrastructure or basic services are needed to overcome market failures when it comes to the provision of public goods to the poor.
For sound decisions to be taken local planners need to be well informed and in this context particularly need to recognise urban dynamics and likely impacts of planning actions. For example, the establishment of infrastructure projects, e.g., the construction of new roads, impacts on location decisions of settlers and, thus, influences urban dynamics and emerging patterns. Appropriate tools are required that allow planners to assess planning actions and to allow other stakeholders, both private and public, to get involved in the planning process and decision-making. This becomes particular relevant considering that the practical powers of public planning authorities are weak and, therefore, one of their main responsibilities is to facilitate a cross-sectoral coordination of relevant stakeholders involved in urban management and eventually to guide investment and development.
6.3. Interim conclusions
The above chapters have outlined the framework of theories which form the basis for this research in terms of how to model the observed spatial phenomenon of informal urban growth in Dar es Salaam. As there is no comprehensive and solid theory in place on informal residential location decisions the authors chose to explore solid theories which were basically established for the context of developed countries as a starting point for the selection of relevant determinants for the modelling work. The considered urban theory focuses inter alia on land values, transport costs, and distance to markets and neighbours to be relevant for location decisions and urban dynamics. Basically, these factors can be assumed to be relevant for Dar es Salaam, too, whereas the precise quantification of these factors to represent their influence in the observed dynamic

Urban theory and planning paradigms
98
urban processes remains unclear and, thus, calls for further research. Accordingly, the authors decided to set up a geodatabase that includes a rather broad set of indicators for quantitative analysis of their influence. This shall help to identify relevant factors and, thus, contribute a piece of knowledge on informal urban dynamics.
For the context of Dar es Salaam, the above mentioned theories exhibit some obvious shortcomings which shall be briefly concluded below to demonstrate the consequences for this study and the subsequent database compilation and modelling work. Dar es Salaam continuously experiences urban growth. One influencing factor is the attractiveness of the city in contrast to the rural parts of the country arising from agglomeration effects. Settlers move to Dar es Salaam to benefit, e.g., from access to jobs, infrastructure, and service facilities. Public bodies (at least in theory) can benefit from decreasing fixed costs for establishing infrastructure. Accordingly, agglomeration theory provides first insights into the drivers of urban growth in Dar es Salaam and location factors relevant for urban settlers to decide for a residential location.
Urban growth in Dar es Salaam is mainly driven by informal residential location decisions. Individual studies on location decisions in Dar es Salaam and other cities in developing countries have brought forward that informal mechanisms differ from those of formal markets in developed countries. This is basically due to imperfect markets in terms of two aspects: i) limited availability of information, and ii) financial restrictions of informal settlers. Financial restrictions make location strategies change from utility maximising to survivalist ones. The decisions of informal settlers tend to be more short-term-oriented following the principle of ‘shelter first’. Informal settlers often cannot consider trade-offs of different alternatives as the decision would include offsetting short-term and related long-term costs (e.g., different transport costs that arise from different locations). With limited financial resources and limited credit systems the only available option is to buy land at remote locations for low prices and to accept additional costs that occur in the long run. Nevertheless, informal settlers aim to optimise accessibility to relevant destinations. As they are highly dependent on public transport or walking they nevertheless tend to consider closeness to existing roads and main roads in particular. Moreover, in addition to the CBD as the classical centre of the city many of them strongly depend on informal sub-centres for their daily life.
The authors assume the second major difference to the above-sketched classical location theories in the fact that informal residential location decisions are restricted due to information availability. Formal land and housing market mechanisms constitute only a small proportion of all residential activities. The authors follow the understanding that the mechanisms of the informal markets exhibit a stronger relation to the local level than formal market. Information about land prices and land availability are basically disseminated by word of mouth. This understanding follows spatial diffusion theory regarding the process of information spread to depend on distance. A diffusive expansion of informal settlements reflects the role of other informal settlers to distribute relevant information. Accordingly, social factors and local-scale neighbourhoods gain importance and it can be argued that informal residential location decisions are basically taking place on the local level.

Urban theory and planning paradigms
99
These briefly sketched shortcomings of classical theories for the study at hand will be further elaborated later in Chapter 9.1. Selected findings from studies on Dar es Salaam will be presented to overcome gaps in knowledge relevant for the subsequent model development on informal residential location decisions. To do so, knowledge and experiences of local experts and findings from research studies which were undertaken to elaborate on drivers of urban change will be reflected and utilised for analysis and model development.
The description of changing planning paradigms in Tanzania has further demonstrated that there has been a shift towards more collaborative planning. This is of particular relevance when it comes to cooperation of stakeholders involved in urban management. The fundamental responsibility of the DCC concerning the cross-sectoral coordination of basic infrastructure and services provision calls for valid information on urban dynamics and appropriate tools. The model to be developed shall become a tool to support both functions and may, thus, contribute to a more cooperative and participatory planning approach in Dar es Salaam.

Urban theory and planning paradigms
100

Urban theory and planning paradigms
101
IIIIII - INTRODUCING THE CASE OF DAR ES SALAAM
The foregoing discussion on urbanisation processes in Africa has illustrated the characteristics of growth dynamics in the continent’s urban metropolises. The following sections will concentrate on Dar es Salaam, Tanzania, deemed as one of the most dynamic urban metropolises in Africa. The following chapters will introduce the case of Dar es Salaam providing basic facts and figures, an introduction to the planning context, and findings from quantitative analyses on urban growth patterns and trends in Dar es Salaam which will serve as a basis for modelling growth of informal residential areas.
“Both central and local government have been unable to control the rapid growth of Dar es Salaam. The challenge is to steer urban growth in a sustainable manner so that its
benefits reach all sectors of society, including the urban poor. With 84.2 percent of Tanzania’s urban population living in slums, the spatial planning of Dar es Salaam and other key urban areas within a 100-200 km radius need to be addressed on an urban
regional basis.”
(UN-HABITAT 2008a: 130)

Urban theory and planning paradigms
102
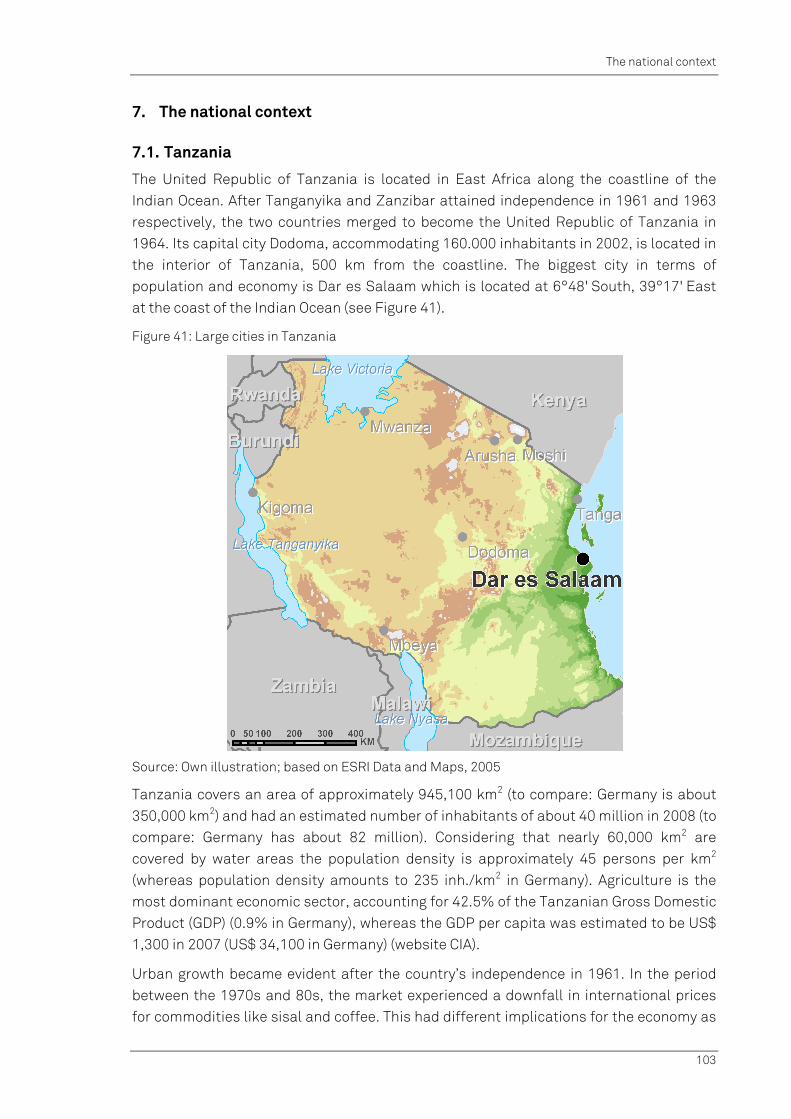
The national context
103
7. The national context
7.1. Tanzania
The United Republic of Tanzania is located in East Africa along the coastline of the Indian Ocean. After Tanganyika and Zanzibar attained independence in 1961 and 1963 respectively, the two countries merged to become the United Republic of Tanzania in 1964. Its capital city Dodoma, accommodating 160.000 inhabitants in 2002, is located in the interior of Tanzania, 500 km from the coastline. The biggest city in terms of population and economy is Dar es Salaam which is located at 6°48' South, 39°17' East at the coast of the Indian Ocean (see Figure 41).
Figure 41: Large cities in Tanzania
Source: Own illustration; based on ESRI Data and Maps, 2005
Tanzania covers an area of approximately 945,100 km2 (to compare: Germany is about 350,000 km2) and had an estimated number of inhabitants of about 40 million in 2008 (to compare: Germany has about 82 million). Considering that nearly 60,000 km2 are covered by water areas the population density is approximately 45 persons per km2
(whereas population density amounts to 235 inh./km2 in Germany). Agriculture is the most dominant economic sector, accounting for 42.5% of the Tanzanian Gross Domestic Product (GDP) (0.9% in Germany), whereas the GDP per capita was estimated to be US$ 1,300 in 2007 (US$ 34,100 in Germany) (website CIA).
Urban growth became evident after the country’s independence in 1961. In the period between the 1970s and 80s, the market experienced a downfall in international prices for commodities like sisal and coffee. This had different implications for the economy as

The national context
104
well as Tanzania’s farmers, and as a result, rural producers migrated to urban areas in search for employment. Besides potential income opportunities, cities still attract migrants because of better education facilities and other subsidised or free public goods and services (World Bank, 2002: 6). Table 2 illustrates population growth of selected large cities in Tanzania.
Table 2: Population figures of the ten largest cities in Tanzania
Rank City Total number of inhabitants Region
Census 1978 Census 1988 Census 2002
1. Dar es Salaam 769,445 1,205,443 2,398,509 Dar es Salaam
2. Mwanza 110,553 172,287 378,327 Mwanza
3. Zanzibar City 110,531 157,634 351,902 Zanzibar
4. Arusha 55,223 102,544 282,712 Arusha
5. Mbeya 76,601 130,798 256,652 Mbeya
6. Morogoro 60,782 117,760 221,286 Morogoro
7. Tanga 103,399 137,364 208,791 Tanga
8. Dodoma 45,807 83,205 159,193 Dodoma
9. Kigoma 50,075 74,224 144,852 Kigoma
10. Moshi 52,046 96,838 144,336 Kilimanjaro
Source: Website URT
The following population statistics and estimates are based on UNDP figures from 1993: Tanzania’s urbanisation rate back in 1960 was 5% which was one of the lowest in Africa. In comparison, the average urbanisation rate for SSA was 15%, with approximately 8% of the population in the least developed countries living in cities. With urban growth rates of 10.3% between 1960 and 1991 (SSA 5.2%) and 7.5% between 1991 and 2000 (SSA 5.3%), Tanzania experienced a dramatic boost of urbanisation (Simon, 1997: 88 f).
Tanzania’s population is projected to grow to about 67 million people in 2050 (UN, 2005: 38). Future population growth in Tanzania is estimated to take place predominantly in urban areas. Between 2000 and 2005 urban areas in average gained 4.9% population, rural areas experienced an increase of only 0.3%. According to the UN population forecast, the urban population will grow from 13.1 million in 2003 up to 33.1 million in 2030, whereas the rural population will decrease slightly from 23.9 to 23.8 million in the same period. This means the share of urban population in Tanzania will increase from 35.4% in 2003 to 58.2% in 2030 (UN, 2004b). It seems very probable that in the near future also in Tanzania the rural-urban proportion might shift so that the majority of people will live in urban environments very soon.
For political and administrative reasons Tanzania is divided up into 26 regions in which population densities vary considerably. Rural regions like the region of Lindi exhibit very low population density whereas high density regions like Dar es Salaam or parts of Tanzania’s islands can also be found (see Figure 42).
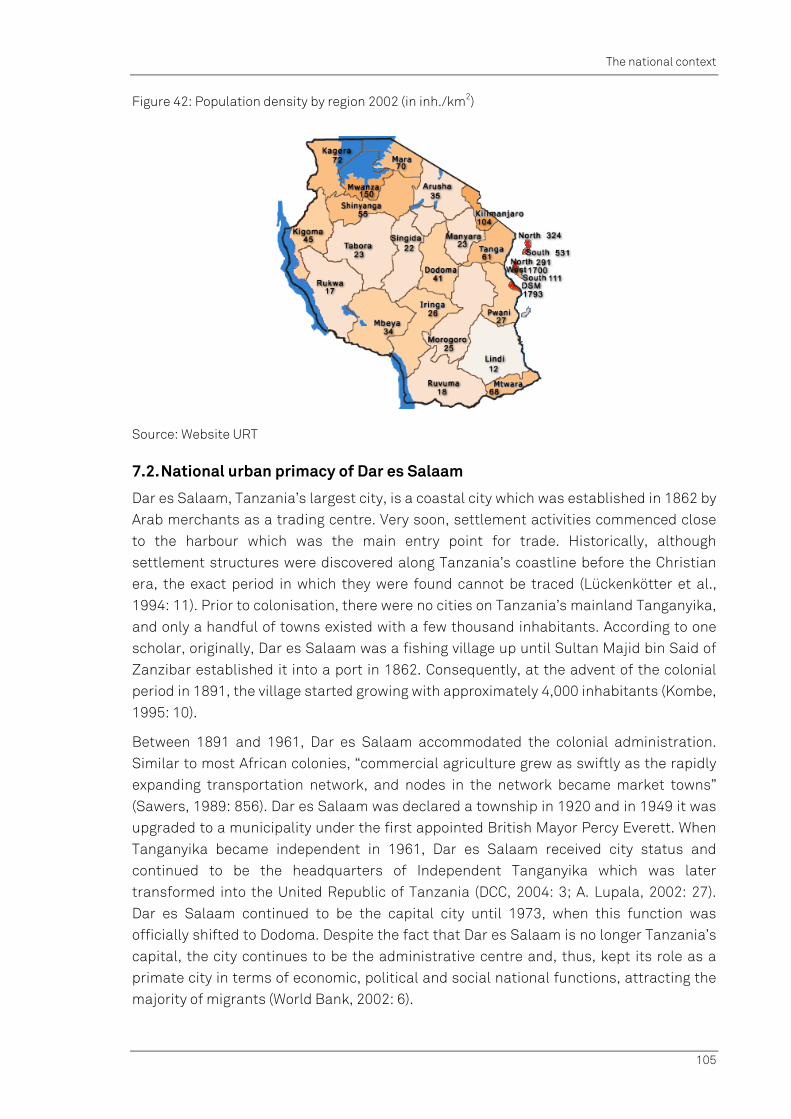
The national context
105
Figure 42: Population density by region 2002 (in inh./km2)
Source: Website URT
7.2. National urban primacy of Dar es Salaam
Dar es Salaam, Tanzania’s largest city, is a coastal city which was established in 1862 by Arab merchants as a trading centre. Very soon, settlement activities commenced close to the harbour which was the main entry point for trade. Historically, although settlement structures were discovered along Tanzania’s coastline before the Christian era, the exact period in which they were found cannot be traced (Lückenkötter et al., 1994: 11). Prior to colonisation, there were no cities on Tanzania’s mainland Tanganyika, and only a handful of towns existed with a few thousand inhabitants. According to one scholar, originally, Dar es Salaam was a fishing village up until Sultan Majid bin Said of Zanzibar established it into a port in 1862. Consequently, at the advent of the colonial period in 1891, the village started growing with approximately 4,000 inhabitants (Kombe, 1995: 10).
Between 1891 and 1961, Dar es Salaam accommodated the colonial administration. Similar to most African colonies, “commercial agriculture grew as swiftly as the rapidly expanding transportation network, and nodes in the network became market towns” (Sawers, 1989: 856). Dar es Salaam was declared a township in 1920 and in 1949 it was upgraded to a municipality under the first appointed British Mayor Percy Everett. When Tanganyika became independent in 1961, Dar es Salaam received city status and continued to be the headquarters of Independent Tanganyika which was later transformed into the United Republic of Tanzania (DCC, 2004: 3; A. Lupala, 2002: 27). Dar es Salaam continued to be the capital city until 1973, when this function was officially shifted to Dodoma. Despite the fact that Dar es Salaam is no longer Tanzania’s capital, the city continues to be the administrative centre and, thus, kept its role as a primate city in terms of economic, political and social national functions, attracting the majority of migrants (World Bank, 2002: 6).
The national context
106
In order to decentralise the system in the country, the Dar es Salaam the City Council was one of those councils that were dissolved in 1972. However, the decentralised system put too much emphasis on rural development and subsequently urban areas deteriorated so heavily that the urban local authorities had to be reinstalled in 1978. In 1992, a Commission of Enquiry was set up to investigate the reasons for the inadequacy of the Dar es Salaam City Council to deliver the various public services. The Commission revealed some structural and management weaknesses and recommended dissolution and restructuring of the Dar es Salaam City Council. In June 1996 Dar es Salaam City Council was dissolved and the Dar es Salaam City Commission appointed to give advice on future administrative structures for Dar es Salaam. The Commission ceased in 2000 and new administrative structures were put in place (DCC, 2004: 3).
The development of a primate city, as well as the disproportionate hierarchical system of cities, is often present in countries where pre-colonial city networks did not exist. Often, colonial governments imposed spatio-economic structures which were based on an exogenous capital or harbour city. Dar es Salaam is a typical example for this type of primate city and of urban hierarchies (Vorlaufer, 2004: 666). The existence of a primate city in a country usually indicates an imbalance in development - a progressive core, and a lagging periphery, on which the primate city depends for labour, food and other resources. Figure 43 highlights the contrast between the actual population figures of the 20 largest cities in Tanzania and their expected population figures ranked according to the rank-size rule (Zipf, 1949). Today, Dar es Salaam is more than ten times larger than Arusha, the second largest city in Tanzania which shows a population considerably below the expected size.
Besides demographic primacy a second form of urban primacy called functional primacy may be considered. It is characterised by the pronounced dominance of a metropolis in the political-administrative, economic, social and cultural-scientific range in relation to other centres of the country. This excessive concentration of central functions frequently occurs in the megacities of developing countries.

The national context
107
Figure 43: Urban primacy of Dar es Salaam
Source: Own illustration; based on website URT
Tanzania has been one of the few countries in SSA to act vigorously against urban primacy. However, the country has been largely unsuccessful in this respect (Sawers, 1989: 841). One reason for the low urbanisation rate back in the 1960s, and the rapid urbanisation processes in the subsequent decades, was that during the colonisation period, the growth of most urban cities including Dar es Salaam was quite modest. This was largely due to the fact that colonial administrators prohibited the free migration of indigenous African people from rural to urban areas (Kombe & Kreibich, 2000b: 39; A. Lupala, 2002: 27 f). After independence in 1961, population increase in urban areas gained momentum as a result of the growing economic disparities between urban and rural areas. For the next decades growth rates skyrocketed at high values leading to a doubled population about every decade. These rates were among the highest in urban SSA (UNDP, 1996).
In 1969, the Tanzanian government introduced a comprehensive programme to decrease the urban primacy of Dar es Salaam. According to one author, “investment funds were allocated to several growth poles throughout the country. Prices for consumer goods, as well as prices paid to farmers for their crops were made uniform throughout the country to encourage growth in remote areas. The government was reorganized to bring the planning and administrative functions closer to the regions, and to diminish the role of the capital city. (...) Primary education became virtually universal, health clinics were built in many towns, and the announced goal was to supply piped water to every village in the country. Plans were revealed to move the capital itself to the interior town of Dodoma. The government forcibly deported residents of Dar es Salaam who had no formal-sector employment in an attempt to reduce the city’s population”
0,0
1,0
2,0
3,0
Dar
es
Sala
am
Arus
ha
Mbe
ya
Mw
anza
Mor
ogor
o
Zanz
ibar
Tang
a
Dod
oma
Mos
hi
Kig
oma
Tabo
ra
Mus
oma
Irin
ga
Song
ea
Nya
kato
Mtw
ara
Sum
baw
anga
Shin
yang
a
Buk
oba
Sing
ida
1 2 3 4 5 6 7 8 9 10 11 12 13 14 15 16 17 18 19 20
inha
bita
nts
in m
illio
n
Population Census 2002 Rank-size rule expectations
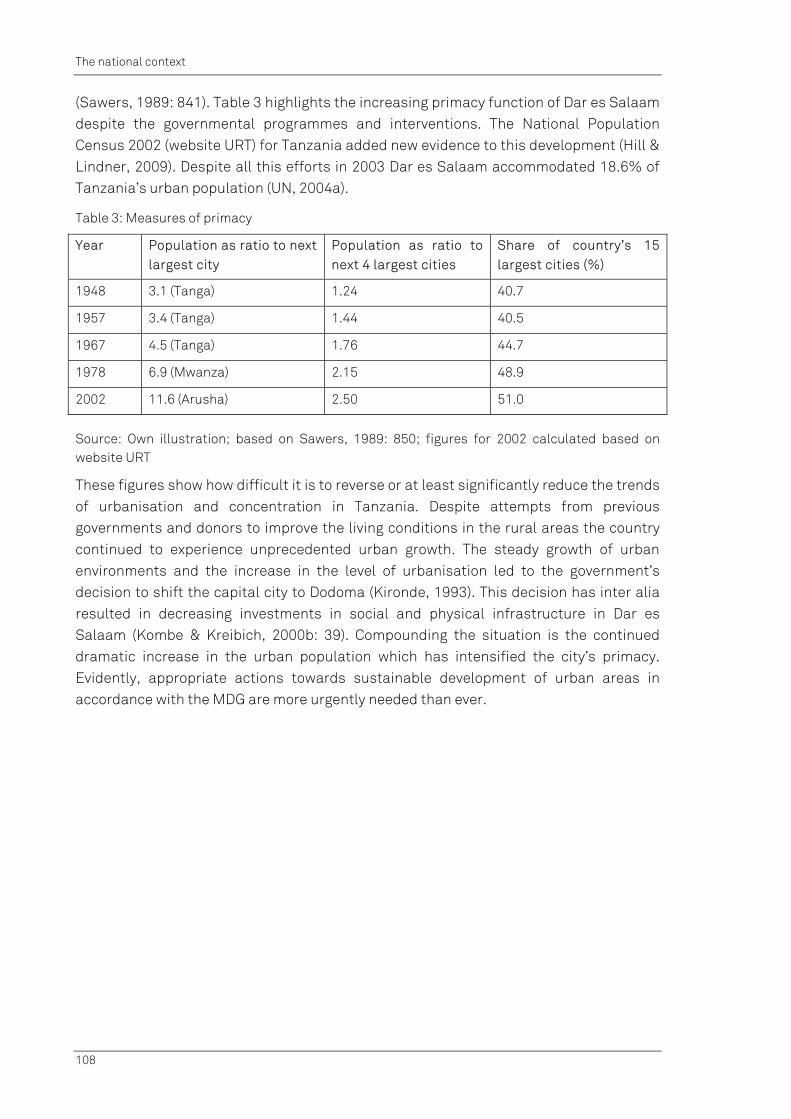
The national context
108
(Sawers, 1989: 841). Table 3 highlights the increasing primacy function of Dar es Salaam despite the governmental programmes and interventions. The National Population Census 2002 (website URT) for Tanzania added new evidence to this development (Hill & Lindner, 2009). Despite all this efforts in 2003 Dar es Salaam accommodated 18.6% of Tanzania’s urban population (UN, 2004a).
Table 3: Measures of primacy
Year Population as ratio to next largest city
Population as ratio to next 4 largest cities
Share of country’s 15 largest cities (%)
1948 3.1 (Tanga) 1.24 40.7
1957 3.4 (Tanga) 1.44 40.5
1967 4.5 (Tanga) 1.76 44.7
1978 6.9 (Mwanza) 2.15 48.9
2002 11.6 (Arusha) 2.50 51.0
Source: Own illustration; based on Sawers, 1989: 850; figures for 2002 calculated based on website URT
These figures show how difficult it is to reverse or at least significantly reduce the trends of urbanisation and concentration in Tanzania. Despite attempts from previous governments and donors to improve the living conditions in the rural areas the country continued to experience unprecedented urban growth. The steady growth of urban environments and the increase in the level of urbanisation led to the government’s decision to shift the capital city to Dodoma (Kironde, 1993). This decision has inter alia resulted in decreasing investments in social and physical infrastructure in Dar es Salaam (Kombe & Kreibich, 2000b: 39). Compounding the situation is the continued dramatic increase in the urban population which has intensified the city’s primacy. Evidently, appropriate actions towards sustainable development of urban areas in accordance with the MDG are more urgently needed than ever.
Planning context
109
8. Planning context
In order to better understand the framing conditions for the emerging urban growth dynamics and patterns in Dar es Salaam this chapter provides a brief introduction into the planning context. Therefore, the city’s administrative and political structures and their linkages with further institutions responsible for planning and the delivery of trunk infrastructure are presented. Furthermore, deficiencies of the regulatory framework and local governance failures both related to urban management are being analysed.
8.1. Legal and institutional framework
In Tanzania a two-tier system of government is in place, combining central and local government structures. Local governments can either be urban (city, municipal or town councils), or rural (district councils). The local government in Dar es Salaam is split up into an administrative hierarchy on the one hand and a political hierarchy on the other hand. The administrative structure of Dar es Salaam has four levels. Spatial planning issues are anchored in the Dar es Salaam City Council (DCC) level, where the administration is headed by the City Mayor (also called Director) of Dar es Salaam. The City Mayor is the political head of the DCC. He is elected among the councillors from the three municipal councils constituting the DCC. Under the City Mayor there are three Heads of Departments namely:
City Administrative Officer in charge of the Finance and Administration Department,
City Economist in charge of planning and coordination of all city development activities, and
City Planner in charge of urban planning, environment and utilities services (DCC, 2004: 14).
Each municipality has a municipal council (DCC, 2004: 12). Both, the DCC and the three municipalities operate in a congruent jurisdictional area, but each of the municipal councils “has been given a jurisdiction area demarcated with an administrative order” (DCC, 2004: 13). The municipalities are further subdivided into wards which are in turn composed of so called mitaa17 each headed by a mtaa chairman.
The political structures in Dar es Salaam reflect the central government and consist of three levels, namely region, district and division. On the regional level Dar es Salaam is headed by the Dar es Salaam Regional Commissioner, below on the district level are the three district commissioners of Temeke, Ilala and Kinondoni. Last but not least the divisions are headed by division secretaries (Basteck, 2005: 34; DCC, 2004: 13; see also Figure 44).
17 sub-wards, singular: mtaa

Planning context
110
Figure 44: The administrative and political organisation of local government in Dar es Salaam
Source: Own illustration; based on DCC, 2004
Following the enactment of the Physical Planning Act (2007) and Land Use Planning Act (2007) as the statutory instruments for regulating land-use planning in Tanzania, the Town and Country Planning Ordinance, Cap. 378 which dated back to 1956 (revised in 1961) and the National Land Use Planning Commission Act 3 (1984) were repealed. Already these two previous laws required land uses to be organised in a planned manner, with certain approvals required by the government. They divide land planning into two categories: Regional land planning areas and land planning for specific areas, such as towns and urban areas. The latter is regulated by the Town and Country Planning Ordinance with the purpose to ensure ordered development of land, and to protect the health and welfare of the public and the natural environment. Land may only be developed in accordance to a land-use planning scheme and only with a prior ‘planning consent’ from the relevant authority (§35). Any land area declared by the Minister for Lands to be a ‘planning area’ (§13) must have both general and detailed planning schemes prepared which address specific categories of desirable land uses in the planning area. Planning schemes divide the planning area into different zones giving certain categories of uses which are allowed or prohibited (website LEAT). The ordinance provides detailed regulations concerning the following issues:
declaration of planning areas,
preparation and approval of general and detailed planning schemes,
control of development,
acquisition of land, and
compensation (URT, 1956).
The political representatives play an important role in the process of land delivery and infrastructure planning. So does the central government as sector ministries such as the Ministry of Lands, Housing and Human Settlements Development (MLHHSD) have basic
Planning context
111
influence on urban growth management and can put significant pressure on the local authorities or veto their development plans and programmes. Thus, responsibility for land-use planning, allocation and control is allotted to both the DCC and the MLHHSD (Basteck, 2005: 35). Kironde (1995) highlights that due to these circumstances local authorities have lost their autonomy which has lead to a situation of confusion and conflicts and to problems when it comes to coordination, control and accountability in urban management.
Another form of interrelationship between the different levels is caused by flows of financial resources. The DCC is highly reliant on grants from the central Government. Sliuzas summed up findings from Kombe (1994) and Kyessi (2002) showing that the contribution of governmental grants to DCC revenues has increased from about 10% in the 1960s to 70% in the first half of the 1990s. This is particularly problematic due to the poor national economic situation in Tanzania and the fact that often the allocated central funds are only partially released to the DCC (e.g., 77% in 1988/89) (Sliuzas, 2004: 83). Additionally, parts of these funds may be earmarked for specific purposes only. One example for this procedure in a planning context was the allocation of government funds for the DCC to survey lands for new urban developments. Unfortunately, no commensurate allocation to compensate displaced land-owners was included (Kombe, 1994) so that the “production of layouts remained an academic and futile exercise, serving only to frustrate both local government staff and plot seekers, creating an impression of ineffectiveness both with the residents who had registered for land and farmers whose lands were under threat of acquisition” (Sliuzas, 2004: 84 f).
8.2. Planning documents
Due to constraints in financial resources and human capacity, the majority of the world’s rapidly growing cities are unable to cope with the challenges of rapid urbanisation. The local planning authorities in Dar es Salaam are barely able to respond to the enormous demand for new plots. As a first attempt to guide urban growth the German colonial government introduced a building code during the colonial period. After the First World War the British took over the administration and inherited the building code. In 1947 the Town Planning Department was founded and the Town and Country Legislation was established.
To meet the growing demand for housing land through the formal market the first masterplan for Dar es Salaam was prepared in 1948 by Gibbs & Partners, a foreign consultancy enterprise. Updates were produced in 1968 and 1979 by Marshal Macmillan Monaghan from Canada. Thus, the latest approved zoning plan for Dar es Salaam is a masterplan dating back to 1979 and as a consequence there is no up-to-date zoning plan in place.
The mandate of the masterplan was to curb the mushrooming of informal settlements, characterised by inadequate social and infrastructure services and deteriorating living environments (URT, 1979). The masterplan was partially implemented in the subsequent years but local authorities were not able to meet the total demand of growing urban uses as Dar es Salaam during that time experienced rapid urban growth. As a result a

Planning context
112
huge proportion of the areas which were covered by the zoning regulations of the masterplan turned into urban uses without following the zoning regulations so that the structure of urban uses today widely contradicts the designations in this document. To counteract these implementation problems the ’Sustainable Dar es Salaam Project‘ (SDP) was introduced by the DCC in 1992. The SDP was part of the worldwide network of the ’Sustainable Cities Programme‘ and aimed to introduce a new planning and management approach through the application of a process called ’Environmental Planning and Management‘ (EPM). The EPM as a process-oriented framework is “a strategic approach to urban environmental planning and management based on enabling participation and building commitment” (DCC, 2006: 4). In the late 1990s the government started to elaborate a ‘Sustainable Urban Development Plan’ (SUDP) as a strategy to guide the future urban growth of Dar es Salaam. In 1999 the first draft for a SUDP was launched, the final version was published in 2006. In the document the SUDP is defined to be “the citywide planning framework resulting from the incremental aggregations and reconciliation of issue-specific strategic and synthesization of lessons of experiences gained through demonstration projects” (DCC, 2006: 6). The final output was a plan that integrated the strategies of interventions which were agreed by issue-specific working groups. This characteristic is one of the major problems as in fact this plan is rather a strategic policy document than a detailed planning document with concrete spatial designations. The document was revised several times lastly in the year 2006 but never approved.
In 2002, the Government of Tanzania through its MLHHSD introduced the so called ‘20,000 Plots Project’ which aims at reducing the shortage of planned, surveyed and serviced plots in the city by means of creating new self-sufficient, self-sustained satellite towns in the peri-urban areas of Dar es Salaam. At the same time the project was meant to control land speculations and the corruption of land offices (URP, 2006: 3 f). The project was developed in collaboration with all three municipalities of the city and identified areas for the development of formally planned settlement areas. It has to be mentioned that the project does not focus on the urban poor but rather continues to exclude them from the formal land market. The selection of areas to be designated as 20,000 plots project areas can be questioned as some of them are located in very remote zones of Dar es Salaam and do not form a strategic development vision for the city.
The project included substantial infrastructure improvements, particularly gravel roads, to improve accessibility of the land parcels. Utility companies were encouraged to provide water, electricity, sewerage and telephones, and the municipalities were to upgrade road and the drainage systems to higher standards. The project is often evaluated to be a success story as the degree of implementation via the delivery of planned and surveyed plots was high. Building activities have started as can be seen from Figure 45.
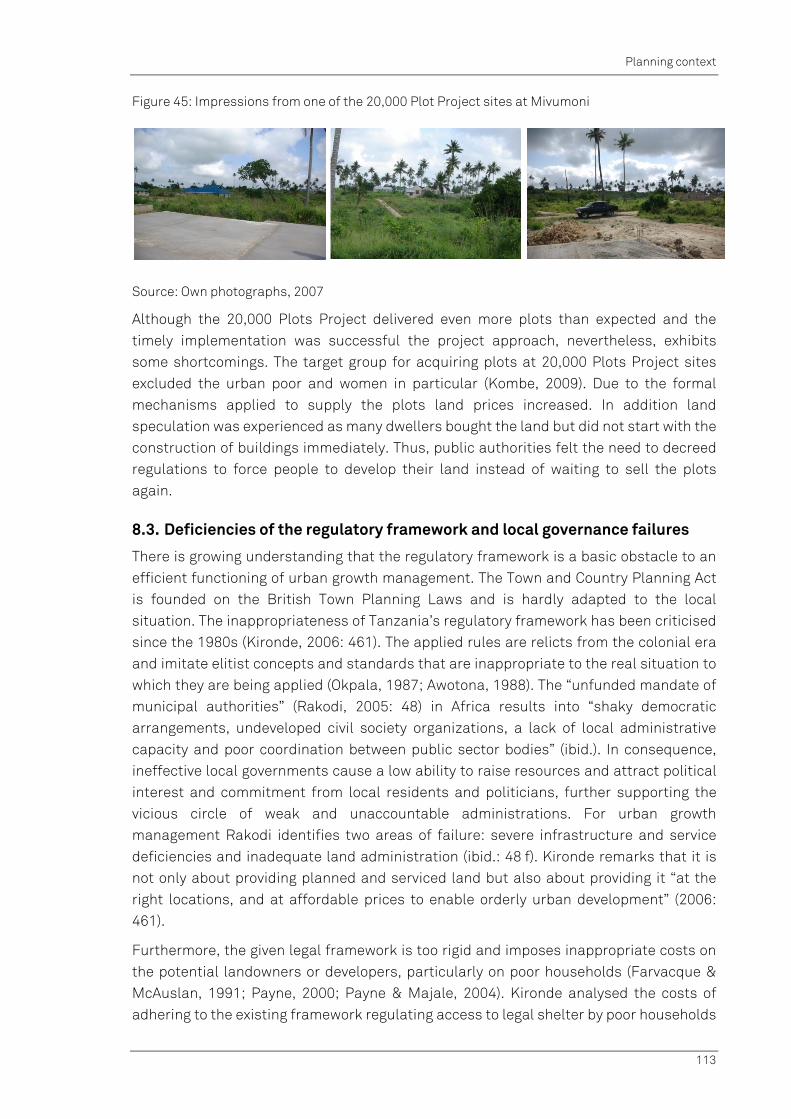
Planning context
113
Figure 45: Impressions from one of the 20,000 Plot Project sites at Mivumoni
Source: Own photographs, 2007
Although the 20,000 Plots Project delivered even more plots than expected and the timely implementation was successful the project approach, nevertheless, exhibits some shortcomings. The target group for acquiring plots at 20,000 Plots Project sites excluded the urban poor and women in particular (Kombe, 2009). Due to the formal mechanisms applied to supply the plots land prices increased. In addition land speculation was experienced as many dwellers bought the land but did not start with the construction of buildings immediately. Thus, public authorities felt the need to decreed regulations to force people to develop their land instead of waiting to sell the plots again.
8.3. Deficiencies of the regulatory framework and local governance failures
There is growing understanding that the regulatory framework is a basic obstacle to an efficient functioning of urban growth management. The Town and Country Planning Act is founded on the British Town Planning Laws and is hardly adapted to the local situation. The inappropriateness of Tanzania’s regulatory framework has been criticised since the 1980s (Kironde, 2006: 461). The applied rules are relicts from the colonial era and imitate elitist concepts and standards that are inappropriate to the real situation to which they are being applied (Okpala, 1987; Awotona, 1988). The “unfunded mandate of municipal authorities” (Rakodi, 2005: 48) in Africa results into “shaky democratic arrangements, undeveloped civil society organizations, a lack of local administrative capacity and poor coordination between public sector bodies” (ibid.). In consequence, ineffective local governments cause a low ability to raise resources and attract political interest and commitment from local residents and politicians, further supporting the vicious circle of weak and unaccountable administrations. For urban growth management Rakodi identifies two areas of failure: severe infrastructure and service deficiencies and inadequate land administration (ibid.: 48 f). Kironde remarks that it is not only about providing planned and serviced land but also about providing it “at the right locations, and at affordable prices to enable orderly urban development” (2006: 461).
Furthermore, the given legal framework is too rigid and imposes inappropriate costs on the potential landowners or developers, particularly on poor households (Farvacque & McAuslan, 1991; Payne, 2000; Payne & Majale, 2004). Kironde analysed the costs of adhering to the existing framework regulating access to legal shelter by poor households

Planning context
114
as a member of a team operating research in six countries with the aim to advise on possible ways and means of revising it, in order to get more of the low-income households onto legal land (Kironde, 2006: 461; Payne & Majale, 2004). He grouped the relevant factors during the process of accessing legal shelter into three major categories following the proposal by Payne and Majale (2004):
Administrative procedures define the path and the institutions through which the public authorities and the citizens have to go to achieve their aim of providing or acquiring land, so that at the end land occupiers are recognised as legal owners and developers of that land.
Planning standards define how the settlement should look like in terms of ’quality’ regarding plot minimum sizes, minimum frontages and depths, road widths, and provisions for public, social and economic uses.
Planning regulations are rules that allow or disallow activities on the plot or in an area; or prescribe the way the plot can be developed or used. They include land-use zoning controls, plot-use restrictions, and building setbacks (Kironde, 2006: 461).
The administrative procedures are identified to be the most restrictive factor in the supply of land in general as even “when land has been made available, administrative procedures to get an offer for a right of occupancy take a very long time” (Kironde, 2006: 470). Next in significance are the standards adopted whereby the insistence on large plots in planning schemes restricts the supply of planned land in the few planning schemes that exist. Moreover, roads consume relatively large shares of land adhering to standards that are unnecessary to meet needs even in the foreseeable future (ibid.).
Although local authorities can initiate their own land-use schemes, powers of approval lie with the central government or with authorised officers in these authorities who are answerable to the central government. Still, there is a high level of centralisation related to the implementation of the regulatory framework in combination with the typical consequences for urban management. ”All planned land-use schemes must get the approval of the Director for Human Settlements Development. All land surveying plans must be approved by the Director of Surveys and Mapping. All valuations for compensation must be approved by the Government Chief Valuer. All Certificates of Title are signed by the Commissioner for Lands. This leads to delays and direct and indirect costs to the land seekers” (Kironde, 2006: 470). Since 2007 and the enactment of the Physical Planning Act and the Land Use Planning Act the approval of all planned land-use schemes is the responsibility of the Director of Physical Planning.
Moreover, other central government agencies such as those providing water, road infrastructure and electricity “operate independently within areas of the jurisdiction of local governments” (Kironde, 2006: 464). Basteck in his work on infrastructure and urban growth confirms this highlighting missing inter-institutional coordination (2005: 38 f). He argues that “the planning system and procedure in Dar es Salaam is rather individualised and sectoral, than concentrating on a holistic, intersectoral co-operation” (Basteck, 2005: 38) and accompanied by the marginalisation of local authorities in the provision of services (Basteck, 2005: 39). Apparently, this situation is existent since
Planning context
115
independence in 1961 (Kyessi, 2002: 29). Today responsibilities for infrastructure provision lie in the hands of manifold stakeholders: namely Dar es Salaam Water Supply and Sewerage Authority (DAWASA), Dar es Salaam Water Supply Company (DAWASCO), Tanzania Electricity Supply Company (TANESCO), Tanzania Telecommunication Limited (TTCL), and the DCC’s Urban Planning, Utility Services and Environment Department. Some of these are private companies, some are parastatal organisations and others are public bodies. However, in many respects the minister in charge has the final decision although by law the local authorities are empowered to provide infrastructure self-dependently. “For example, depending on the status of the road, road construction and maintenance may be the responsibility of the Ministry of Works, the engineer of the regional commissioner or the DCC. The responsibility for drainages lies with the Ministry of Communication and Works and with the Ministry of Water and Livestock Development, as well as with the councils. A parastatal organisation and a private company are responsible to supply water. Electricity is supplied by a national parastatal organisation that operates under the Ministry of Energy and Minerals” (Basteck, 2005: 36).
In addition to the given shortcomings of the legal framework and the existing planning policies and documents local governance failures deteriorate the situation. Many of them are due to resource deficits including technical staff and finances. Deficiencies in resource flows have been highlighted in a variety of contributions to the scientific debate about urban management (Kironde, 1992; Kombe, 1995; Kombe & Kreibich, 2000a). Evidence for this is given by Kombe who points out that in 1992 only 71 land surveying personnel were employed although 203 were needed (1995: 86). In 1997 the demand of the DCC for more than 20 land surveyors was only met with 12 land surveyors who were available; the situation even gets worse by the lack of survey equipment (Kombe & Kreibich, 2000b: 19). Gelinck (1996: 36) sums up the situation by stating that the work of the DCC’s Department for Urban Planning, Utility Services and Environment is constrained by a shortage of financial funds, basic equipment and stationary, poor office management and record keeping, and by a lack of transport facilities.
Furthermore, relationships and collaboration between different administrative levels such as the wards and the city council are weak. Referring to Sliuzas (2004: 184 f), the municipalities have limited capacities to respond to plans and proposals developed at the ward level. Since project proposal are hardly implemented the wards’ primary function can be described as routine administrative tasks which they carry out on behalf of the municipal councils (Kombe & Kreibich, 2000b: 46). The mtaa level is weak as the mtaa leaders are no civil servants and, accordingly, they do not draw income from this occupation. Moreover, the mtaa offices lack facilities, resources and management skills which impairs the fulfilment of their extensive list of duties (Basteck, 2005: 34 f).
Attempts have been made to overcome existing bottlenecks of local government structures for example by the introduction of a Local Government Reform Process (LGRP). „In 1997, as part of the overall civil service reform programme, a Local Government Reform Process was initiated. Starting from 2000, powers and central government resources are transferred to the local level to enable the local governments
Planning context
116
to improve their level of service delivery. The essence of LGRP is to transfer duties, financial resources and legal opportunities from the central to the local government levels“ (REPOA, 2005).
Evaluating the success of the LGRP Mamuya (2008) argues that after 8 years of reform, the results do not look convincing. He identifies three major weaknesses of the public-sector reform in Tanzania:
It is implemented outside the constitutional mechanisms of control and accountability encouraging corruption and equity problems.
There are no effective regulation mechanisms in place resulting in rising costs for taxpayers.
Local governments still lack sufficient autonomy.
Due to the above sketched short-coming of urban planning authorities the majority of urban growth in Dar es Salaam takes place in an informal manner. Given the described situation of constrained public resources, lacking cross-sectoral, inter-institutional and administrational cooperation along with an inappropriate legal framework and a weak planning system, the need for well-informed and rational decisions becomes strikingly obvious. The little capacities available should be utilised in the most effective and efficient manner. Cross-sectoral and institutional cooperation as well as coordination between administrative bodies should be facilitated by a sound and common knowledge base as one input for discussion on targeted and useful planning measures and their likely impacts. Therefore, a solid knowledge base and appropriate tools are needed on dynamics and trends of urban development.

Urban structure and development of Dar es Salaam
117
9. Urban structure and development of Dar es Salaam
This chapter includes elaborations on characteristics of urban dynamics in Dar es Salaam. It takes up empirical findings of other scholars to demonstrate their adaptation of urban theory for the specific local context. Their views on relevant factors for location decisions and, thus, on an aggregated level for urban dynamics will be discussed. Local experience and lessons learnt for urban Dar es Salaam shall foster the way forward towards model development. In the following analyses on past and recent urban structures and development in Dar es Salaam are presented. The findings illustrate the urban development processes, land and housing market, land-use distribution, accessibility, population distribution and the mutual interlinkages between these factors forming the underlying mechanisms of individual informal residential location decisions. Selected analyses are included that focus on the period between 1982 and 2002 for the extent of the study area for which a comprehensive geodatabase was accomplished including data on land use, transport network, land form, terrain and population. The findings serve as input to the subsequent modelling work as they unveil key features of urban development.
The following sections also illustrate the spatial scope of the modelling work of this study and subsequently document data availability alongside a description of the procedures carried out for data preparation to compile the necessary database for urban development analyses and CA modelling. Most data have been obtained from ITC, Enschede18. The datasets had to be prepared, extended or updated in order to fulfil the requirements concerning the analysis and modelling work which will be described subsequently.
9.1. Informal urbanisation processes
9.1.1. Informal urban development challenges
Urban growth of Dar es Salaam used to be influenced mainly by rural-urban migration and increasingly by natural population gains. According to the National Census of Tanzania of 2002 the average growth rate of population was 4.3% per annum between 1988 and 2002 (website URT). The majority of urban residents are too poor to participate in the formal land and housing market. The increasing level of poverty, rapid population growth and a lack of suitable housing policies have forced the majority of home seeking urban residents and rural migrants towards informal land and housing markets.
In Dar es Salaam, official estimates assume that approximately 70% of the population live in informally developed settlements with severe deficits in basic services and infrastructure supply. Kironde reports about recent calculations based on property tax databases which depict that even more than 80% of all buildings in the city of Dar es Salaam are located in unplanned areas. “Given the higher house occupancy rates in
18 The authors would like to say thanks to the colleagues at ITC (Enschede in The Netherlands) for supporting our work by the provision of geodata. Dr. Richard Sliuzas, Dr. Sherif Amer, Dr. Mark Brussel have to be mentioned in particular.

Urban structure and development of Dar es Salaam
118
unplanned areas, the proportion on the City’s population living in unplanned areas is likely to be higher than 80 percent” (Kironde, 2006: 463). These unfavourable conditions have led to massive socio-economic and environmental problems such as uncontrolled urban sprawl, deterioration of open spaces, transport problems such as bad accessibility and road congestion. Another determinant of urban environmental problems in Dar es Salaam is air pollution which is mainly caused by automobiles as a result of lead emissions from gasoline. The city has experienced a significant increase in both the total number of cars (in the 1990s by 6.3% annually) and the road traffic volume because excessive urban sprawl is unsuitable for public transport. The situation is further exacerbated during peak traffic hours, when the main roads and the inner city are congested, and people are exposed to high air pollution (Mbuligewe & Kassenga, 1997).
Due to the fact that Tanzania belongs to the group of least developed countries of the world – which comprises 50 countries – the local authorities struggle to respond to the enormous settlement pressure and demand for housing land. Urbanisation under poverty is characterised by limited capacities of the city’s authorities concerning financial strength and manpower in terms of governmental employees of the administrative bodies. This caused informal settlement activities which are characterised by a declining capability of the government to provide basic infrastructure and to manage land development (Kombe & Kreibich, 2000b: 1). Additionally, the shortage of trained manpower continues to impede effective and efficient planning and development in SSA countries (Ling, 1988). This was a problem during colonial times which also continued after independence (Sliuzas, 2004: 27). A study carried out in Anglophonic African countries revealed that in 1964 over 70% of the region’s planners, technicians, senior administrators and managers, all carrying considerable responsibilities for policy, planning, finance and development, were expatriates (Kanyeihamba, 1980: 261).
Informal urban sprawl in Dar es Salaam can be described as a diffusion process progressing in wave-like concentric rings from the city centre towards the periphery of the city in combination with broadening ribbons following the arterial roads (see Figure 46).

Urban structure and development of Dar es Salaam
119
Figure 46: Urban expansion of Dar es Salaam until 2002
Source: Own illustration; based on land-use and transport network data provided by ITC, Enschede; updated for 2002 by IRPUD
9.1.2. Informal settlers and informal land markets
On the demand side, poor settlers following a ‘shelter first’ strategy will seek unplanned and unserviced plots in order to avoid the costs associated with obtaining planning consents. On the supply side, consolidating settlements will become attractive for the extension of private sector utility networks, especially electricity, public transport, and drinking water. Both sides are facing serious risks when the informally growing settlements are located in areas which can later be serviced only at high or even excessive costs. Statutory planning could direct peripheral urban growth into serviceable locations and, thus, reduce risks and costs for both parties. But unregulated informal urbanisation leaves both urban land management and utility supply almost entirely up to market forces. In this environment of high uncertainty, little is known

Urban structure and development of Dar es Salaam
120
about locational decisions of informal settlers and investment strategies of utility suppliers. The mutual linkages are, however, complex.
Individual residential locations decisions of settlers can be distinguished into three groups. The first group is formed by ‘formal settlers’ that are attracted by the CBD either because they work in the formal market (where jobs are basically located in the CBD) or because they work in that part of the informal market which addresses the demand in the CBD. They request good accessibility to the CBD when choosing a residential location. They live either in formal or informal settlements but many of them prefer to live in a planned settlement. The second group constitutes of ‘informal settlers’ that basically work in informal markets that forms some type of ‘local informal economy’. The markets for these services are located either in the informal sub-centres of the city or can be located on an even more local-scale level which can be found at the settlement level. This group calls for good accessibility to the markets in the sub-centres (for further details on informal sub-centres in Dar es Salaam see Chapter 9.3.2 and Figure 56) and most of them are settled in informal areas. The third group is made up of ‘subsistence farmers’ being those settlers that make their livelihoods basically from subsistence farming. Subsistence farming is subjected to a different set of determinants. Urban farmers tend to sprawl into more remote locations presumably because of lower land prices associated with lower accessibility. They do not require good access to the transportation network in order to make their livelihoods. They buy relatively large plots of land at peripheral locations with poor access but for affordable prices because they mainly live from their own produce. Most of them are located in informal settlement areas. For the model at hand all three types make up the focus of interest. They basically constitute the dynamics that can be observed in the peri-urban zone of the city (Hill et al., 2010).
Land markets in SSA enable all these forms of residential location preferences as land availability on the informal market rarely is limited neither due to natural constraints nor to planning regulations. But the increasing land prices alongside the major development axes push new settlers both to the outer periphery of the city – in Dar es Salaam already up to a distance of 30 km from the centre - and to the interstitial areas. There, poor settlers can afford to buy affordable plots large enough to conduct subsistence farming. For some years, the ever moving peri-urban frontier of the poor interferes with suburbanising high income earners who can afford a private car and seek to escape urban agglomeration disadvantages by resettling on large plots in a quasi rural environment. The spatial structure resulting from this double-layered urban sprawl can be characterised as fragmented at low density and, thus, highly inefficient in terms of infrastructure supply costs and energy economics.
Unfortunately, comprehensive data on land prices covering the whole study area could not be obtained so that this driver of urban development patterns could not be included explicitly into the model. However, as land prices are strongly influenced by location factors like accessibility to the city centre, distances to nearest roads, etc. they are somehow implicitly reflected by the model.

Urban structure and development of Dar es Salaam
121
The determinants of land prices in developing countries are to a broader extent depending on social factors and information availability than in developed countries. A. Lupala (2002) argues that land prices in Dar es Salaam are basically driven by four factors as can be seen in Figure 47. The factors are described more in-depth in the following giving additional information about how to integrate them into the modelling work.
Figure 47: Major drivers of land prices in Dar es Salaam
Source: Own illustration; based on A. Lupala, 2002: 251
A. Lupala lays emphasise on the fact that “land is not only an economic good but also a social one” (A. Lupala, 2002: 252). He lists up the following social factors that influence land prices and, therefore, hinder the strict application of market-led theory:
good social relationships between land seller and the land buyer may lead to price concessions,
the economic status of the land buyer influences the price he has to pay, e.g., a buyer with a car most likely has to pay more than somebody who seems to be poor,
the involvement of middlemen in land deals provides room for increasing prices because of commission, collusion and cheating, and
land sales due to financial stress (desperate need for cash) tends to distort land prices because of the limited time to search the highest offer (A. Lupala, 2002: 252).
The relevance of information availability is due to imperfect land markets which suffer from transparency and information. In developed countries there exist standard land prices which give an idea about the land price in a specific area. One has to imagine this as a map giving spatial information on land values which are publicly registered and determined by an official advisory committee for land prices.
Both, information availability and social factors are represented in the model by the inclusion of local-scale neighbourhood factors reflecting the constitution of land uses as described in more detail in Chapter 5.7.3 and 11.2.2. The neighbourhoods assume that both information availability and social networks are a function of distance precisely that their relevance and impact decreases with growing distance to existing settlements.
The third driving force for land prices on the land market is accessibility. Land prices are higher close to major roads and show a distance decay effect of decreasing land prices with increasing distance to the road network. Research on Dar es Salaam exhibited the

Urban structure and development of Dar es Salaam
122
pattern as illustrated in Figure 48. Various land uses, of course, show varying degrees of stickiness to major roads.
Figure 48: Land prices in relation to major roads in Dar es Salaam in 1998
Source: A. Lupala, 2002: 221
The mechanisms of the land market reflecting demand and supply, advantages of location, e.g., accessibility, travel costs and bid rents (as described in Chapter 6) are somehow limited in Dar es Salaam due to an imperfect market. Nevertheless, the following analyses will reveal that some of them can be found and empirically proved.
9.2. Spatial scope of the study
The study area for which the land-use simulation model was developed comprises large parts of the city area of Dar es Salaam. It covers about 97,000 ha and, thus, comprises the majority of the areas which have been subject to urban development until 2002. The delimitation of the study area is mainly based on data availability considerations. The multi-temporal land-use data have mainly been derived from aerial photographs. The extent of the latter is a limiting factor but this was the only source available to reliably recapture the expansion of urban areas and of road infrastructure network. Figure 49 illustrates the administrative borders of the city and municipalities of Dar es Salaam and the location and extent of the study area.
For the sake of CA modelling and for the GIS-based analysis the study area has been subdivided into a regular grid with a resolution of 100 m (meaning that each cell covers a rectangular area of 100 by 100 m (1ha)). The resulting grid is composed of more than 97,000 grid cells.
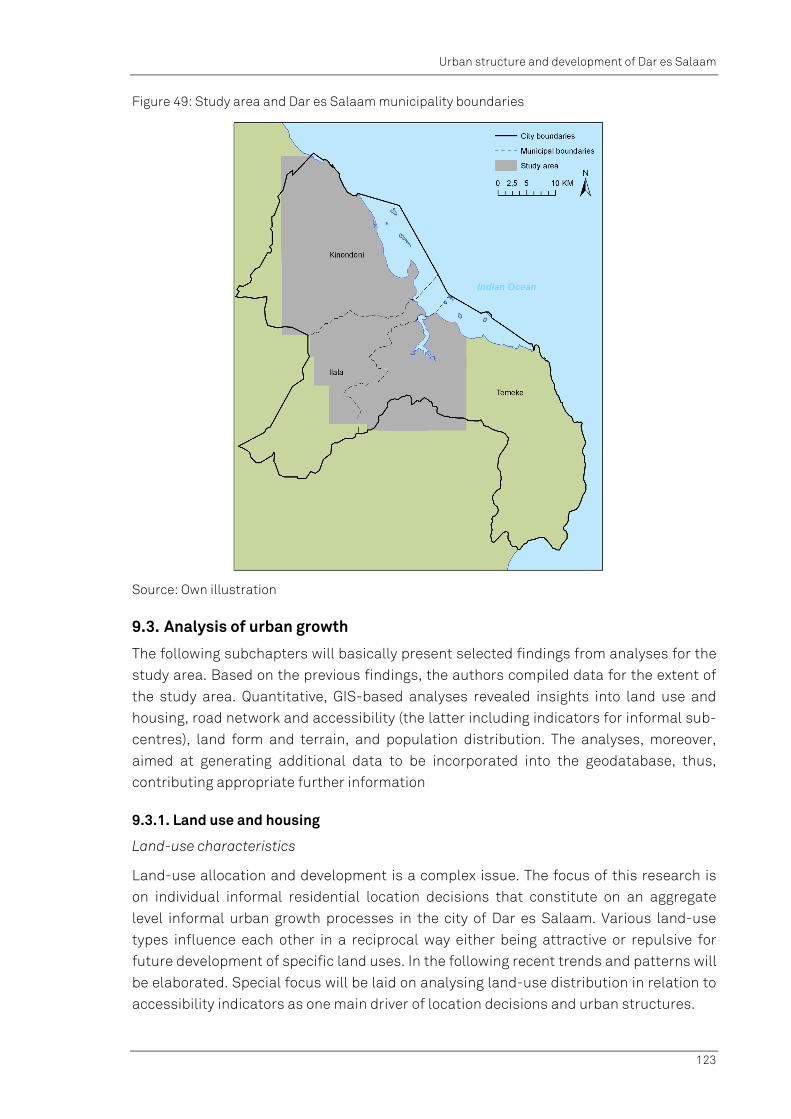
Urban structure and development of Dar es Salaam
123
Figure 49: Study area and Dar es Salaam municipality boundaries
Source: Own illustration
9.3. Analysis of urban growth
The following subchapters will basically present selected findings from analyses for the study area. Based on the previous findings, the authors compiled data for the extent of the study area. Quantitative, GIS-based analyses revealed insights into land use and housing, road network and accessibility (the latter including indicators for informal sub-centres), land form and terrain, and population distribution. The analyses, moreover, aimed at generating additional data to be incorporated into the geodatabase, thus, contributing appropriate further information
9.3.1. Land use and housing
Land-use characteristics
Land-use allocation and development is a complex issue. The focus of this research is on individual informal residential location decisions that constitute on an aggregate level informal urban growth processes in the city of Dar es Salaam. Various land-use types influence each other in a reciprocal way either being attractive or repulsive for future development of specific land uses. In the following recent trends and patterns will be elaborated. Special focus will be laid on analysing land-use distribution in relation to accessibility indicators as one main driver of location decisions and urban structures.
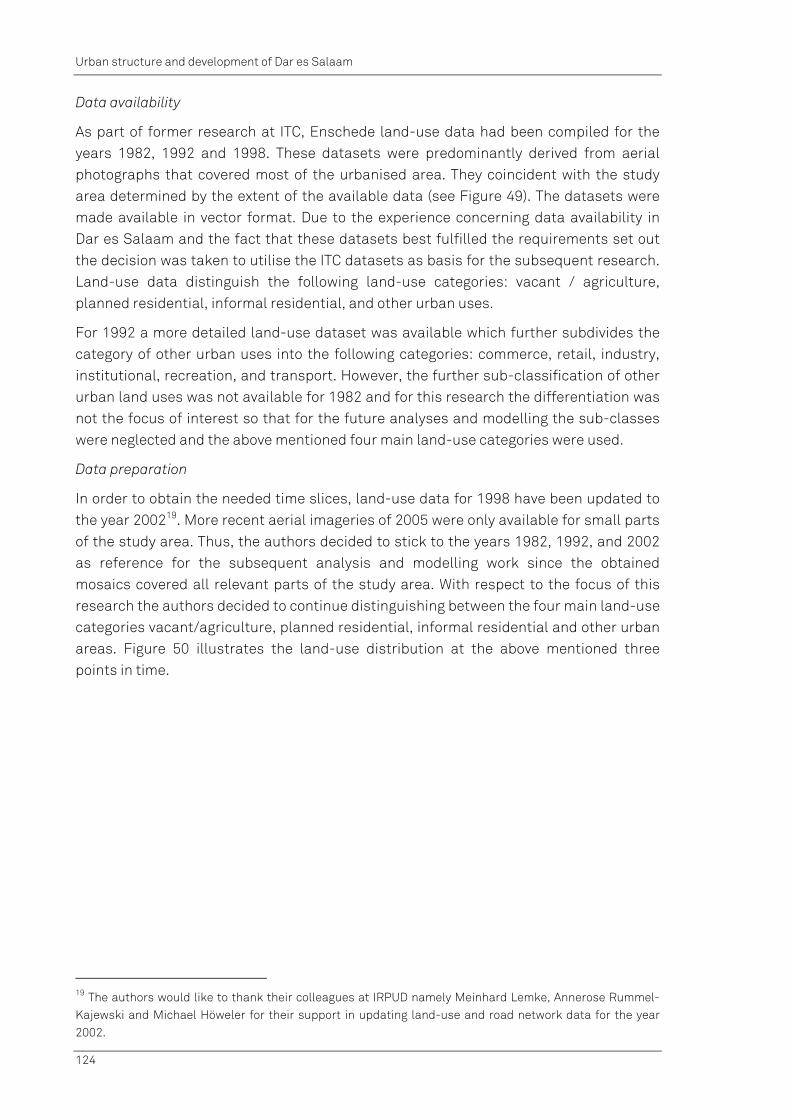
Urban structure and development of Dar es Salaam
124
Data availability
As part of former research at ITC, Enschede land-use data had been compiled for the years 1982, 1992 and 1998. These datasets were predominantly derived from aerial photographs that covered most of the urbanised area. They coincident with the study area determined by the extent of the available data (see Figure 49). The datasets were made available in vector format. Due to the experience concerning data availability in Dar es Salaam and the fact that these datasets best fulfilled the requirements set out the decision was taken to utilise the ITC datasets as basis for the subsequent research. Land-use data distinguish the following land-use categories: vacant / agriculture, planned residential, informal residential, and other urban uses.
For 1992 a more detailed land-use dataset was available which further subdivides the category of other urban uses into the following categories: commerce, retail, industry, institutional, recreation, and transport. However, the further sub-classification of other urban land uses was not available for 1982 and for this research the differentiation was not the focus of interest so that for the future analyses and modelling the sub-classes were neglected and the above mentioned four main land-use categories were used.
Data preparation
In order to obtain the needed time slices, land-use data for 1998 have been updated to the year 200219. More recent aerial imageries of 2005 were only available for small parts of the study area. Thus, the authors decided to stick to the years 1982, 1992, and 2002 as reference for the subsequent analysis and modelling work since the obtained mosaics covered all relevant parts of the study area. With respect to the focus of this research the authors decided to continue distinguishing between the four main land-use categories vacant/agriculture, planned residential, informal residential and other urban areas. Figure 50 illustrates the land-use distribution at the above mentioned three points in time.
19 The authors would like to thank their colleagues at IRPUD namely Meinhard Lemke, Annerose Rummel-Kajewski and Michael Höweler for their support in updating land-use and road network data for the year 2002.

Urban structure and development of Dar es Salaam
125
Figure 50: Land uses in Dar es Salaam in 1982, 1992, and 2002
Source: Own illustration; based on land-use and transport network data provided by ITC, Enschede; updated for 2002 by IRPUD
Analysis
The urban structure of Dar es Salaam is often described as a four finger pattern following the four major arterial roads. Despite intensive densification and consolidation processes in existing settlements, most of the urban population growth is accommodated on formerly vacant or agricultural land. High land consumption mainly results from the fact that single storey buildings prevail and affordable land for the relatively large plots can only be found at the urban fringe. Although land consumption is

Urban structure and development of Dar es Salaam
126
high, there is still much vacant land available at the urban fringe. This is one specific characteristic which distinguishes Dar es Salaam and other large cities in SSA from many other rapidly growing cities in other parts of the developing world. The availability of land contributes to increasing rates of land consumption, as well as to very low settlement densities at the outer fringe of the city.
An analysis of land-use data derived from three different land-use datasets in 1982, 1992, and 2002 reveals that most of the population growth in the last decades has been absorbed by informally developed settlements. Accordingly, new settlements are mushrooming at the urban periphery. Between 1982 and 2002, more than 15,500 ha of formerly vacant or agricultural land have been transformed into urban land uses. More than 75% of these new developments can be classified as informal settlements, whereas only roughly 15% were transformed into planned residential areas. Furthermore, about 8% of the newly developed areas accommodate other urban land uses, e.g., areas for industrial or commercial uses, transport or public services (see Figure 51).
Figure 51: Settlement area development in Dar es Salaam for 1982, 1992, and 2002
Source: Own illustration; calculations based on land-use data provided by ITC, Enschede; updated for 2002 by IRPUD
The settlement patterns of Dar es Salaam vary across the different parts of the city. Considering the four finger structure, the development along each of the four trunk roads exhibits quite different patterns. According to the latest land-use data, expansion in between the aforementioned development axes is due to commence, and will most likely increase as a result of enhanced accessibility. Moreover, there is evidence of increasing consolidation and densification processes in the inner parts of the city between the CBD and the ring road. This coincides with patterns of sprawl along the arterial roads outwards, in particular roads leading west into the rural hinterlands of Dar es Salaam (see Figure 50), where many households rely on agricultural production or
1982
1982
1982
1992
1992
1992
2002
2002
2002
chan
ge 1
982-
2002
chan
ge 1
982-
2002
chan
ge 1
982-
2002
0
2000
4000
6000
8000
10000
12000
14000
16000
18000
planned residential informal settlement other urban
area
in h
a

Urban structure and development of Dar es Salaam
127
subsistence farming. This phenomenon of urban sprawl can be affirmed by the analysis of land-use distribution and development.
Analysis concerning land-use changes reveals that dynamics have gained momentum in the decade between 1992 and 2002. In comparison to the previous decade the total amount of informal residential areas has more than doubled. In contrast, the emergence of planned residential areas has slowed down and experienced some stronger limitation to areas within distances of up to 10 km from the CBD. Until 1992 informal residential transformation focused on areas at distances between 6 and 15 km to the CBD constituting the highly dynamic peri-urban areas, the following decade experienced rapid informal growth at distances from 6 up to 30 km. Between 1992 and 2002, the inner city inside a radius of about 5 km had nearly achieved equilibrium state. Here, urban dynamics seem to be limited in contrast to the more remotely located areas. However, there are still some relatively large areas of agricultural or vacant land in the southern parts of the city which are difficult to access. Thus, settlement activities in these parts are rather scarce up to 2002 though the areas are close to the CBD in terms of air-line distance (see Figure 50 and Figure 52).
Figure 52: Proportions of land-use change according to air-line distance to the CBD between 1982 and 1992 (above) and between 1992 and 2002 (below)
Source: Own illustration; calculations based on land-use and transport network data provided by ITC, Enschede; updated for 2002 by IRPUD
-20%
-15%
-10%
-5%
0%
5%
10%
15%
20%
1 6 11 16 21 26 31
land
-use
cha
nges
distance from CBD (in km)
-25%
-20%
-15%
-10%
-5%
0%
5%
10%
15%
20%
25%
1 6 11 16 21 26 31
land
-use
cha
nges
distance from CBD (in km)
planned residential other urban
unbuilt / agriculture informal settlements
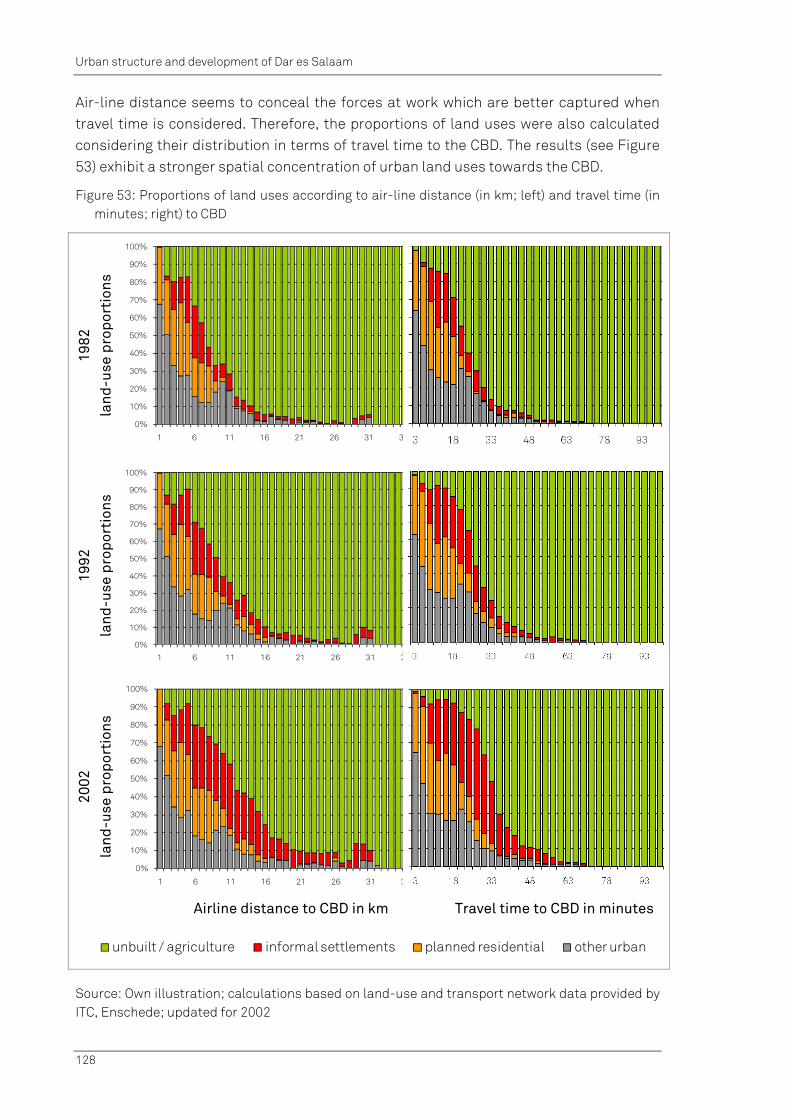
Urban structure and development of Dar es Salaam
128
Air-line distance seems to conceal the forces at work which are better captured when travel time is considered. Therefore, the proportions of land uses were also calculated considering their distribution in terms of travel time to the CBD. The results (see Figure 53) exhibit a stronger spatial concentration of urban land uses towards the CBD.
Figure 53: Proportions of land uses according to air-line distance (in km; left) and travel time (in minutes; right) to CBD
Source: Own illustration; calculations based on land-use and transport network data provided by ITC, Enschede; updated for 2002
1982
la
nd-u
se p
ropo
rtio
ns
1992
la
nd-u
se p
ropo
rtio
ns
2002
la
nd-u
se p
ropo
rtio
ns
Airline distance to CBD in km Travel time to CBD in minutes
0%
10%
20%
30%
40%
50%
60%
70%
80%
90%
100%
1 6 11 16 21 26 31 3
0%
10%
20%
30%
40%
50%
60%
70%
80%
90%
100%
1 6 11 16 21 26 31 3
0%
10%
20%
30%
40%
50%
60%
70%
80%
90%
100%
1 6 11 16 21 26 31 3
unbuilt / agriculture informal settlements planned residential other urban

Urban structure and development of Dar es Salaam
129
Whereas planned residential and other urban land uses display a clear distance decay effect in terms of decreasing development with increasing distance to the CBD, informal residential use exhibits different patterns. Spatial analyses for 2002 reveal only small proportions of informal settlement areas close to the city. For example, inside the inner ring of 1 km around the CBD there are no informal residential areas at all. At distances of up to 3 km other urban land uses are the predominant land-use type with 33 to 67%. Moreover, the rings between 8 and 12 km distance also show predominant shares of other urban land uses with values between 11 and 24%. The ring between 3 and 4 km is dominated by the highest share of planned residential land use to be found making up for 41% of the total area. Additionally, in the ring between 7 and 8 km is planned residential areas are the most prominent category (25%). The two rings between 5 and 7 km distance are dominated by informal residential areas that make up for 30 and 26% respectively. Moreover, in the peripheral rings from 12 km on outwards informal residential areas is the prevailing urban land-use category (see Figure 54).
Figure 54: Proportions of urban land uses according to air-line distance concentric rings around the CBD in 2002
Source: Own illustration; calculations based on land-use and transport network data provided by ITC, Enschede; updated for 2002 by IRPUD
This pattern, however, changes to some extent when travel time is introduced to explain land-use distributions. The analysis indicates that particularly planned residential areas tend to be located close to the city concerning travel time. At the same time informal development is substantially pushed to areas with lower accessibility.
At a glance, the analysis of overall development in the city of Dar es Salaam between the years 1982 and 2002 exhibits strong dynamics of urban expansion. Moreover, it highlights the contrast between sprawling informal residential settlements allocated to less accessible remote locations and centrally located planned residential areas.
0
10
20
30
40
50
60
70
80
1 6 11 16 21 26 31 36
lan
d-u
se
pro
po
rtio
ns
in %
distance to CBD (in km)informal settlement other urban planned residential

Urban structure and development of Dar es Salaam
130
9.3.2. Road network and accessibility
Transport characteristics
Although Dar es Salaam has experienced a rapid increase in car ownership rates still the majority of urban settlers and in particular the urban poor, basically rely on the quasi informal public transport system of dalla dallas. These minibuses basically operate on all types of roads but their frequency is generally and in particularly seasonally restricted on feeder roads because they are often not passable in the rainy season. Settlers chose their location following the supply with dalla dalla routes. Those who cannot afford to settle close to existing routes switch to more remote locations with lower land prices assuming that the services will follow soon.
Experience has shown that the supply of dalla dalla routes follows the settlements development. As soon as the necessary demand is to be found to run a dalla dalla line with profit the route will be established. Once the route is established the growth of the supplied area is accelerating in the reverse conclusion demonstrating the mutual interlinkages between settlement development and transport infrastructure supply.
It has to be emphasised that road infrastructure is one main criteria to influence individual residential location decisions of informal settlers. Depending on the frequency and the destinations of their journeys settlers tend to choose locations. In doing so settlers consider accessibility issues and in particular how they can access the CBD and informal sub-centres to fulfil they daily needs or reach their places of work. These two aspects will be analysed in the following sections by calculating travel times for each cell to those destinations.
Accessibility at this point of the study is calculated based on the existing road network. However, it has to be mentioned that the local planning authorities in Dar es Salaam are of course recently discussing some infrastructure improvement projects to overcome bottlenecks of the existing transport system. Three major projects shall be mentioned here as they will be further elaborated and their impacts for informal urban development be analysed and further discussed during the remainder of this study: i) constructing a bridge over the Mzinga Creek to better connect the southern parts of the city; ii) building a ring road to better cross-connect the outer parts of the city and to relieve the inner parts from transit traffic; iii) establish a Bus Rapid Transit (BRT) system for Dar es Salaam to reduce the number of vehicles in the inner parts of the city while at the same time reducing air pollution, traffic jams and increasing travel times (for further details see Chapter 13.3).
Data availability
The significance of travel time in explaining urban sprawl calls for the inclusion of the road network to the analysis. ITC provided data on the road network for the year 1998. This vector dataset distinguishes between two classes of roads. The first class, major roads, comprises all arterial and city ring roads of Dar es Salaam. The second class includes all remaining so called minor roads.

Urban structure and development of Dar es Salaam
131
Data preparation
The road network data of 1998 had to be updated for the reference year 2002. Based on the aerial photographs of 2002 the road network could be updated by manual digitisation. Additional time slices have been created for 1992 and 1982 using the original aerial photographs for those years that had also been used by ITC to derive the respective land-use data. Because the visual quality of the historic aerial photographs is rather poor20 and the spatial coverage was not completely consistent, the resulting multi-temporal road network must be regarded as an approximation rather than a fully consistent dataset.
As a second step, assumed travel speeds had to be defined. Since in reality travel speeds between major roads and most frequently unsealed minor roads vary significantly, an estimated average travel speed of 40 km/h was assumed for major roads while minor roads allow for an average speed of 20 km/h. These assumptions are based on personal experience made during fieldtrips and have been confirmed by local experts. In general local traffic is subject to frequent occurrence of traffic jams as most of the motorised traffic relies on the major roads as much as possible due to bad conditions of minor roads.
The ferry connection was introduced to the transport infrastructure data being classified as a special part of the road network to adequately represent the relatively long travel times for a distance of only about 500 m. Assuming a travel speed of 1km/h equates with a travel time of 30 minutes needed to cross the creek which is roughly the average total time needed to buy a ticket, to queue for boarding, to go aboard the ferry, to cross the creek and debark.
Based on the road network data and the assumed travel speeds further variables have been calculated which account for the aspects of access to road infrastructure and accessibility in the model:
Euclidean distance to next trunk road,
Euclidean distance to next minor road,
travel time to the CBD, and
travel time to informal sub-centres.
The first two variables ’Euclidean distance to next trunk road‘ resp. ’Euclidean distance to the next minor road‘ are calculated using the same methodology: for each cell centre the Euclidean distance to the closest road was calculated after overlaying the cellular space with the road network data.
The variable ’travel time to the CBD‘ is meant to account for the spatial situation of each cell with respect to the city’s urban structure and transportation system. The CBD can be seen as the historic nucleus of the city and still today most of the major roads which constitute the main development axes are oriented towards the CBD. Thus, this variable
20 The aerial photographs were only black and white and also in relatively low resolution.

Urban structure and development of Dar es Salaam
132
provides a good indication on how remote a location is with respect to the core of the city. More sophisticated accessibility measures like for instance potential accessibility indicators could not be calculated due to data constraints.
The procedure used to calculate ’travel time to CBD‘ for the cellular space of about 97,000 cells comprises several steps of calculation. First, all roads were buffered with a buffer distance of 50 m in order to select those cells with ‘direct’ network access21. For this group of cells the travel time needed to get to the CBD is derived using the network analyst tool provided as an extension to ArcGIS. It determines the optimal path on the road network in terms of minimum impedance to get from the source (each cell centre) to the destination (the CBD location). It is assumed that on roads the mode of transport would be vehicle-based, i.e., car or a dalla dalla without any further differentiation of availability and travel speed between these two modes22. The impedances, in this case travel time per network segment, are accumulated during the analysis resulting in a travel time value for each source to the destination. However, assumptions made on average travel speeds and the resulting travel times calculated by the accessibility model have to be interpreted as accessibility indications rather than actual values.
The following equation summarises the procedure:
tt = md * ms + td * ts
whereas
tt: travel time to the CBD of each cell with direct network connection
md: distance on minor roads
ms: average speed on minor roads
td: distance on trunk roads
ts: average speed on trunk roads
For those cells missing a ‘direct’ network access, total travel time is composed by two factors: the travel time on road plus the travel time that a pedestrian needs to get from the cell centre to the road by foot. In order to calculate these travel times the authors developed a custom Python script. It considers the whole cellular space as sources and the cells located on the network for which travel times have already been calculated as destinations. For each source cell the script determines the destination cell (i.e., one of the cells with direct network access) to which the pedestrian will walk comparing all available options with respect to lowest total travel time. The pedestrian’s travel time is
21 This step has been applied to reduce computing time as well as to enhance the calculation by enabling to calculate more realistic travel times for all cells which do not have direct access to the network. 22 Due to missing data on the past and present public transport network (i.e. dalla dalla) the analysis assumes that connections will become available where sufficient demand exists. Thus, no differentiation between modes has been made since the provision of public transport services is rather demand driven and can generally be assumed to be satisfied once road connections are available.
Urban structure and development of Dar es Salaam
133
determined by the Euclidean distance (including a detour factor of 1.323) to the chosen destination on the road network multiplied with an assumed walking speed of 5 km/h. The following equation summarises the procedure:
tt = dp * sf * df + md * ms + td * ts
whereas
tt: is the total travel time of each cell without a network connection to the CBD
dp: the distance for a pedestrian to reach the road access point which allows for a minimum total travel time
sf: the travel speed by foot
df: the detour factor
md: distance on minor roads
ms: average speed on minor roads
td: distance on trunk roads
ts: average speed on trunk roads
Analysis
Figure 55 shows the travel time results of the accessibility analysis for 2002. The low level of accessibility in the south-eastern part of the city24, in the area between Morogoro and Bagamoyo Road in the western periphery, and in other areas without direct connection to the road network in the interstitial zones of the city can be clearly identified. The function of the arterial roads as axes of accessibility in the urban periphery becomes evident. Areas with comparatively good accessibility in terms of travel time to the CBD (particularly areas attached to the arterials) correlate with those areas which experienced significant urban growth in the past two decades. The areas in between which also exhibit comparatively short driving distances do not experience the same degree of development resulting from significantly higher travel times caused by the bad quality of roads compared to the areas located closer to the main roads. Investigations in three selected informal settlements in Dar es Salaam underscored accessibility as one of the most important determinants for location decisions of peripheral urban settlers (Kreibich et al., 2008).
23 Detour factors are a common concept in accessibility analyses for areas where no network (or at least no network data) exists. They are applied to account for the fact that it is generally rather impossible to walk or drive straight line through an area. 24 Besides the road network, the areas south of the large creek are alternatively connected to the CBD via a ferry. For accessibility analysis an additional connection was added to the dataset representing a travel time of about half an hour needed to cross the creek using the ferry connection. As transport capacities cannot be directly modelled in the accessibility model at hand this had to be neglected in the presented results.

Urban structure and development of Dar es Salaam
134
Figure 55: Travel times to the CBD in 2002 (in minutes)
Source: Own illustration; calculations based on road network provided by ITC for 1998, updated for 2002 by IRPUD
Accessibility of informal sub-centres
Many poor urban settlers only rely to a little degree on services of the CBD. They rather fulfil their daily needs in more decentrally organised informal sub-centres. These are located in remote areas with highly dynamic urban catchment areas in terms of informal settlement activities. For Dar es Salaam four of these informal sub-centres as can be seen in Figure 56 are of relevance: Tegeta, Kimara, Gongo la Mboto, and Rangi Tatu. In the following they will be described in more detail.

Urban structure and development of Dar es Salaam
135
Figure 56: Informal sub-centres in Dar es Salaam
Source: Own illustration
Tegeta
Tegeta is located along Bagamoyo Road in Kunduchi Ward in the municipality of Kinondoni. Most of the businesses in the informal sub-centre are concentrated along Bagamoyo road and the main access roads into the settlements. Petty trading and small businesses form the centre of livelihood opportunities for the residents. These include wholesale and retail shops dominated by hardware for construction materials. Lately, several banks have opened offices there. Tegeta settlement started to develop in the 1950s. Attracting substantial population, in 1974 it received the status of a village. Rapid increase of population was experience in the early 1990s and in 1994 the village status was replaced by the sub-ward status. This was also the time when Tegeta started to be recognised as part of the urban fabric and as an informal sub-centre (Msangi, 2009). A recent impression of the urban character of Tegeta can be received from Figure 57.

Urban structure and development of Dar es Salaam
136
Figure 57: Tegeta informal sub-centre
Source: Msangi, 2009
Kimara
The informal sub-centre is located in the sub-ward Kimara Matangini in Kimara ward, Kinondoni Municipality. It is located along Morogoro Road and the whole of the subward is unplanned. Kimara settlement started to develop in the 1960s when only a few families of the early inhabitants were living there. The population increased slightly in the 1970s and notable population increase was experienced in the 1980s. In the 1990s the area was completely saturated. It was during that time when the settlement acquired the sub-ward status. In the 1960s, agriculture was the main economic activity of the few people who used to live there. However, in recent times things have changed dramatically, and business has become the main economic and hence the basis for livelihoods of majority of the inhabitants. The types of businesses include small retail shops for consumer goods, bars, restaurants, markets and informal garages. Most of these businesses are concentrated along the Morogoro Road and the main access roads into the settlement. The available services or facilities include plenty of transport facilities (many busses end and start at Kimara), health services (e.g., a government dispensary) and a police post. There are also several primary and secondary schools in Kimara which attract pupils and students from various places in Dar es Salaam (Msangi, 2009).

Urban structure and development of Dar es Salaam
137
Figure 58: Kimara informal sub-centre
Source: Msangi, 2009
Gongo la Mboto
The informal sub-centre Gongo la Mboto is located along Nyerere / Pugu Road in Ukonga Ward in Ilala Municipality. The whole sub-ward is of unplanned character. The major economic activities forming the basis for livelihoods of the inhabitants comprise basically business activities like small retail shops for consumer goods, local brew shops, bars, restaurants and poultry keeping activities. Most of the businesses are concentrated along the Nyerere Road and main access roads into the settlement. Gongo la Mboto settlement started to exist in the 1960s. By 1976, when the Villagelisation Programme (which aimed to bring people to live together in villages where they were provided with basic social services (health, water and education) and agricultural support (Severo & Taylor, 2001: 20)) was being emphasised by the government, although there were already many people living in that area Gongo la Mboto was not registered as a village and was not involved in the Villagelisation Programme. It wasn’t until around the 1980s when Gongo la Mboto got the status of a sub-ward government. Even with that status population increased only with a moderate pace. The period between 1985 and 1986 recorded the most rapid population growth ever in the area.
Most of the small towns and settlements that depend on Gongo la Mboto for various services are located to the south of the sub-centre. Among these services are transport services (many of the buses to the city centre start and end at Gongo la Mboto), shops for food, markets, health services (although only to a little extent) and educational facilities and services such as secondary schools. There are several dispensaries and secondary schools owned and operated by the armed forces. Accordingly, a sizeable portion of the inhabitants are practicing and retired members of the police and armed forces (Msangi, 2009).

Urban structure and development of Dar es Salaam
138
Figure 59: Gongo la Mboto informal sub-centre
Source: Msangi, 2009
Rangi Tatu
The informal sub-centre of Rangi Tatu is located along Kilwa Road in Mbagala Rangi Tatu sub-ward in Charambe Ward in Temeke Municipality. The whole of the sub-ward is unplanned. The major economic activities of the inhabitants include small business activities such as food vending, retail consumer shops, bars and restaurant as well as garments. There is also a big number of informal garages, pharmacies, hair cutting salons and butcheries. Most of the businesses are concentrated along Kilwa Road and along the main access roads into the settlement.
People started to move into the in the settlement area at the end of the 1910s. Slow settlement growth followed up to 1961 when the country got its independence. Between 1974 and 1976 due to the Villagelisation Programme Mbagala Rangi Tatu received more influx of people and started to acquire urban characteristics in the 1970s. Between 1980 and 1990 rapid population increase was experienced and the settlement became completely saturated and received a sub-ward status (1985). The services that other settlements depend on in Rangi Tatu include transport services (many buses to the city centre and remote areas start and end at Rangi Tatu). Other services to be found there are health services (there are three private hospitals), wholesale shops, and religious facilities. There are also a police post, a market owned by the Temeke Municipality as well as an auction that is conducted on daily basis in evening hours. Also, many big lorries from upcountry offload their luggage right in Rangi Tatu just as is the case in Kariakoo, the big city market.
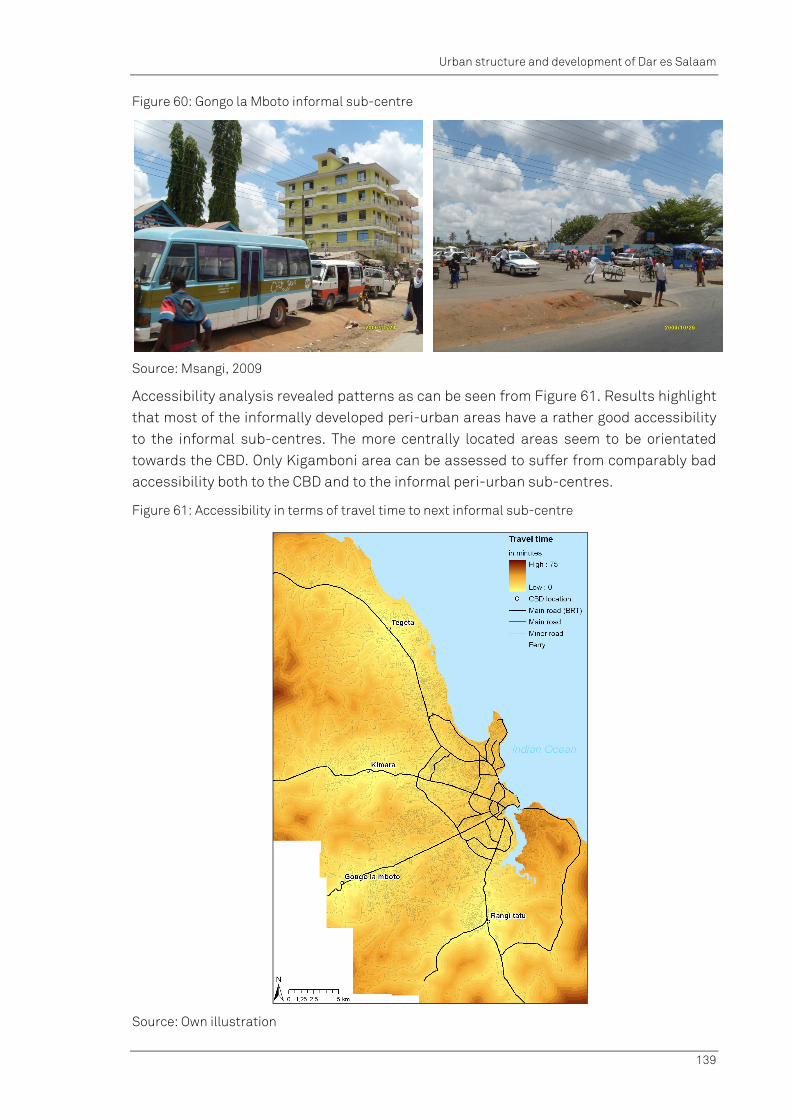
Urban structure and development of Dar es Salaam
139
Figure 60: Gongo la Mboto informal sub-centre
Source: Msangi, 2009
Accessibility analysis revealed patterns as can be seen from Figure 61. Results highlight that most of the informally developed peri-urban areas have a rather good accessibility to the informal sub-centres. The more centrally located areas seem to be orientated towards the CBD. Only Kigamboni area can be assessed to suffer from comparably bad accessibility both to the CBD and to the informal peri-urban sub-centres.
Figure 61: Accessibility in terms of travel time to next informal sub-centre
Source: Own illustration

Urban structure and development of Dar es Salaam
140
9.3.3. Land form and terrain
Land form characteristics
Urban development in Dar es Salaam has some characteristics that are related to the dominant land form and terrain. Like many large cities in SSA Dar es Salaam has a land market that is characterised by a high availability of land at the edges of the city. Whereas urban expansion of many cities in Asia or Latin America is restricted by topographic constraints like surrounding hills the hinterland of Dar es Salaam is widely flat and open. Land for urban uses is highly available and market prices are low. Furthermore, there are limited restrictions due to planning regulations.
Restrictions to urban expansion can be observed following some natural conditions. Unfavourable conditions for urban uses are swamp areas and river basins and areas that show a high terrain roughness with high elevation gradients. Settlers prefer to avoid those areas in order to prevent risks and detriments.
Data availability
Data on the land form provided by ITC, Enschede included information on areas classified as coastal plains, hills, quarries, salt pans, river valleys, and swamp areas from which relevant constraint areas have been extracted. These data were complemented by a digital elevation model (DEM) in raster format with a resolution of 20 m (see Figure 62).
Figure 62: Terrain elevation and land form
Source: Own illustration; based on terrain data provided by ITC, Enschede

Urban structure and development of Dar es Salaam
141
Data preparation
Data on land form and terrain elevation were used to derive variables and constraining factors to be included into the CA-based model. Constraining factors account for areas which are assumed to be excluded from urban development due to unfavourable natural conditions. Constraints are assumed to apply for the following land-form categories: swamp areas, river valleys, and forest areas. Manual digitising had to be applied where respective data were not immediately available.
Slope data on land form while irreclaimable slopes have been derived from the DEM by calculating the average slope for each raster cell. Based on the elevation values found in the DEM at an original resolution of 20 m the mean slope for each cell in the destination resolution of 100 m has been calculated using the following calculation procedure:
slope_degrees = ATAN ( √ ( [dz/dx]2 + [dz/dy]2 ) ) * 57.29578
where the rate of change (delta) of the surface in the horizontal (dz/dx) and vertical (dz/dy) directions from the centre cell determines the slope25.
Figure 63: Frequency distribution of slope (in degrees)
Source: Own illustration
Analysis
The frequency distribution of slope values (see Figure 63) showed that 95% of all cells had a slope of less or equal 7 degrees and 99% of all cells exhibited a slope of less or equal 10 degrees. A cross tabulation of slope (in degrees) against informal and non informal residential land uses (see Table 4) revealed that the cells that were informally 25 The multiplication factor of 57.29578 is applied to transform radian units into degrees. The radian is a unit of plane angle, equal to 180/π (or 360/2π) degrees, or about 57.2958 degrees. It is the standard unit of angular measurement in all areas of mathematics beyond the elementary level.
slope in degrees
freq
uenc
y

Urban structure and development of Dar es Salaam
142
developed for residential purposes with a slope of more than 7 degrees only made up for 3.7% of all informal residential areas. The informally developed cells with a slope steeper than 10 degrees made up only 0.7% of all informal residential areas.
Table 4: Cross tabulation of slope per cell (in degrees) against informal and not informal residential land use cells
Slope (degrees)
Not informal
residential Informal
residential Total
% of all not informal res. cells (80,025)
% of all informal res. cells (17,065)
% of all cells
(97,090) <=1 31,503 7,104 38,607 39.36645 41.62907 39.76414<=2 16,295 3,586 19,881 20.36239 21.01377 20.47688<=3 9,671 2,040 11,711 12.08497 11.95429 12.06200<=4 6,952 1,425 8,377 8.68729 8.35042 8.62808<=5 5,153 978 6,131 6.43924 5.73103 6.31476<=6 3,709 701 4,410 4.63480 4.10782 4.54218<=7 2,481 443 2,924 3.10028 2.59596 3.01164<=8 1,513 293 1,806 1.89066 1.71696 1.86013<=9 1,059 200 1,259 1.32334 1.17199 1.29673
<=10 963 168 1,131 1.20337 0.98447 1.16490<=11 360 72 432 0.44986 0.42192 0.44495<=12 191 31 222 0.23868 0.18166 0.22865<=13 78 10 88 0.09747 0.05860 0.09064<=14 34 5 39 0.04249 0.02930 0.04017<=15 19 3 22 0.02374 0.01758 0.02266<=16 10 3 13 0.01250 0.01758 0.01339<=17 16 0 16 0.01999 0.00000 0.01648<=18 5 0 5 0.00625 0.00000 0.00515<=19 4 2 6 0.00500 0.01172 0.00618<=20 2 1 3 0.00250 0.00586 0.00309<=21 3 0 3 0.00375 0.00000 0.00309<=22 3 0 3 0.00375 0.00000 0.00309<=23 0 0 0 0.00000 0.00000 0.00000<=24 1 0 1 0.00125 0.00000 0.00103
Sum 80,025 17,065 97,090
100.00000 100.00000 100.0000
0
Source: Own calculations
9.3.4. Population
Population characteristics
Around 1985, Dar es Salaam exceeded the threshold of one million inhabitants and subsequently continued to grow. According to census data, Dar es Salaam as Tanzania’s largest city accounted for 2.5 million inhabitants in 2002 and recently experiences growth rates of about 4%. The UN estimates a population of 3.8 million for 2015 assuming that annual growth rates decline down to 3.2% until 2015 (UN, 2006a).
Dar es Salaam exhibits multiple patterns concerning population densities and trends according to varying spatial locations. The city centre concentrates other urban uses
Urban structure and development of Dar es Salaam
143
than the residential one and in consequence population densities are comparably low. The surrounding areas exhibit high densities which can be found on the one hand in planned areas with multi-storey building (e.g., Kariakoo) or in highly consolidated informal settlements (e.g., Hannah Nassif). In average – except from the city centre - with increasing remoteness population densities decrease (see Figure 65).
Social networks are an important factor in Dar es Salaam. Existing urban structures attract further urban settlement activities until a high degree of consolidation is reached where densification processes become hardly impossible. The pull effect of population is an important criterion in informal residential location decisions representing attractiveness for settlers and is modelled in this study via neighbourhood effects.
Data availability
The database provided by ITC offered two raster datasets on population for 1992 and 1998. These figures were generated by Sliuzas (2004) in his research on managing informal settlements and are based on 1992 census data. The spatial distribution of the population in Dar es Salaam has been calculated by Sliuzas based on a so-called ‘roof cover index‘, a technique of disaggregating population according to the area covered by building roofs26.
Data preparation
Although population data were available from ITC, the format turned out to be unsuitable being provided as a grid of regular hexagonal cells with a size of 5.4 ha each. Each cell was attributed with information on the number of people inhabiting that cell for 1992 and 1998. For the sake of analysis these cells have been transformed to the common grid cell size used for this study. This was done by converting the hexagons into points and afterwards interpolating these points to a continuous raster surface with the desired resolution using the method of Inverse Distance Weighting (IDW). The optimum set of IDW parameters was elaborated iteratively by comparing results of different parameter settings.
These data could not be adapted or updated for the other reference years due to a lack of respective information. It was, therefore, decided not to consider population density for the subsequent modelling work. These restrictions also have to be kept in mind when interpreting the results of the analyses ahead.
Analysis
As a first indicator of the spatial distribution of the urban population of Dar es Salaam the proportion of inhabitants according to concentric rings around the CBD was calculated for 1992 and 1998 (see Figure 64).
The analysis of population distribution reveals that the clear majority of the inhabitants (approximately 70% in 1992) live between 3 and 9 km airline distance to the CBD. The central ring directly surrounding the CDB is an exception accommodating only around 10% of the total population. This is assumed to be related to the fact that many other
26 This procedure has been described in detail by Sliuzas (2004: 111 ff).

Urban structure and development of Dar es Salaam
144
urban uses are located there and, furthermore, more space is consumed by areas for basic infrastructure like roads or open spaces for recreation.
Figure 64: Concentric population distribution in Dar es Salaam 1992 and 1998
Source: Own illustration; calculations based on population data provided by ITC, Enschede
As a second interesting finding, this pattern slightly changes between the two reference years: the outer distance rings show increased proportions of urban settlers in 1998 which can be considered to be a further indication of sprawling urban development. In the peri-urban areas (in between 21 and 33 km distance to the CBD) the ratio between population increase and land occupation changes significantly which results in significant urban sprawl. While sprawl at the outer fringe is characterised by very low population densities, with fewer settlers consuming larger amounts of land at the same time large portions of the population are absorbed into already existing settlements through consolidation.
Population densities have been calculated separately for the two types of residential land use (informal and formal). The total population per residential land use was subsequently summed up by 3 km concentric rings and divided by the number of cells in the respective ring. Unsurprisingly, informal settlements are characterised by significantly higher population densities compared to planned residential areas at the same distance from the CBD (see Figure 65). These higher densities can basically be explained by higher building densities due to small plot sizes, unregulated subdivision and extensions or infill activities both undertaken by home owners sometimes also with the intention to provide rental rooms. Moreover, space required for infrastructure like roads is often consumed for informal building activities and, thus, further increases densification. Additionally, poverty leads to higher occupancy rates per room.
05
101520253035404550
3 6 9 12 15 18 21 24 27 30 33
Distance to CBD in km
Pro
port
ion
of in
habi
tant
s in
%
Population 1992
Population 1998

Urban structure and development of Dar es Salaam
145
Figure 65: Average population density by settlement type and distance to CBD in 1998 (in inh./ha)
Source: Own illustration; calculations based on land-use and population data provided by ITC, Enschede
Population densities exhibit a distance decay effect towards the urban fringe where low population densities prevail (see Table 5). The only exception is constituted by informal residential areas in the first ring at a distance of up to 3 km around the CBD. There the average population density is relatively low with 275 inh./ha compared to the second ring with an average density of 330 inh./ha. Table 5 sums up key figures of population distribution for 1992 and 1998.

Urban structure and development of Dar es Salaam
146
Table 5: Population distribution figures
Airline distance to CBD (km)
Average population density in informal settlements 1998 (inh./ha)
Average population density in planned residential areas 1998 (inh./ha)
Average population density 1992 (inh./ha)
Average population density 1998 (inh./ha)
Proportion of total population 1992 in %
Proportion of total population 1998 in %
up to 3 275 174 83 90 10.82 9.13
> 3 to 6 330 128 122 135 43.79 37.46
> 6 to 9 141 87 50 65 27.93 28.29
> 9 to 12 71 63 13 23 9.37 12.60
> 12 to 15 52 40 5 10 4.18 6.78
> 15 to 18 39 28 1 4 1.45 2.80
> 18 to 21 35 36 2 2 1.71 1.73
> 21 to 24 27 18 0.5 1 0.26 0.57
> 24 to 27 33 n.a. 1 1 0.17 0.30
> 27 to 30 26 n.a. 1 1 0.22 0.28
> 30 to 33 32 n.a. 1 1 0.09 0.07
Source: Own calculations
Interim conclusions
147
10. Interim conclusions
Tanzania, like many other African countries, has experienced strong population growth in the past and is projected to continue to do so. Besides natural population growth the trend of rural-urban migration shapes Tanzania to become an urbanised country in which by 2030 most likely almost 60% of the population will live in urban centres (UN, 2004b). Research has shown that to a considerable extent natural population increase recently has gained importance in determining urban growth. Dar es Salaam, Tanzania’s primate city with about 2.4 million inhabitants in 2002, has experienced enormous growth rates. Even though growth pace has slowed down in the past decade still the present situation as well as future projections are characterised by rapid urban growth.
Deficiencies of the legal framework, severe public capacity constraints and a lack of coordination between relevant actors in the field of planning result in a situation where formal planning cannot keep track with the enormous growth pressure and hence urban development takes place almost exclusively informally. As the actual impact of formal land-use zoning during the last decades was only be marginal and additionally for Dar es Salaam there is no up to date masterplan in place it was concluded for this study not to integrate a zoning variable into the model structure
Recent and accurate data on urban development and related factors are scarce. The database the current work broadly relies on has been contributed by a partnering European academic institution instead of local authorities. However, much work has been spent on updating and extending the database and still it imposes considerable constraints concerning the analysis and modelling work to be carried out. Nonetheless, it provides a useful foundation for further research work.
The presented analyses on the urban development of Dar es Salaam reveal the basic urban patterns and development trends. Urban growth is predominantly absorbed into informal settlements which sprawl at the urban fringes. The past development predominantly followed a four finger pattern with most of the development being allocated alongside the major arterial roads towards the urban periphery. Thus, the close interrelationship between road infrastructure and land-use can be assumed to be the most important determinant behind urban expansion. Indeed, accessibility has proven to be of high relevance when it comes to explain the driving forces of individual informal residential location decisions. Lately, urban growth commences to spread into more remote and less accessible areas, such as interstitial areas.
Population densities vary significantly in the urbanised space. Generally, a decrease from the central business district towards the urban periphery is observable. While in the older consolidated parts of the city formally planned residential areas prevail, the share of informal settlements increases with growing distance (and particularly travel time) from the CBD to constitute the predominant land-use type in the peri-urban and more sparsely populated parts of the city where much of the future urban growth will likely occur.

Interim conclusions
148
The past, present, and projected development dynamics and the limited capacity of public (planning) authorities call for well informed planning decisions based on adequate information on drivers, determinants and likely patterns of future urban growth. Unfortunately, the opposite seems to be the case in Dar es Salaam. The subsequent modelling work will account for the insights gained in the preceding analyses and aims at modelling and forecasting urban development dynamics and trends. The model shall consider the major drivers of individual residential location decisions of informal urban settlers in order to be able to respond in a coordinated manner to likely future development trends. The following chapters will describe the conceptual model development as well as its implementation and testing.

Interim conclusions
149
IIVV -- MMOODDEELLLLIINNGG UURRBBAANN GGRROOWWTTHH
The following chapters introduce the modelling work which was carried out for the development of a CA-based land-use simulation model for the rapidly growing city of Dar es Salaam. The model follows a raster-based approach to simulate urban growth considering land-use changes of vacant / agricultural cells into informal residential land use. The model iterates 10 years intervals until the year 2022. The overall land-use demand is calculated exogenously based on population projections. The following chapters describe both the conceptual modelling work and the technical implementation. Furthermore, the processes of calibration and validation will be illustrated and results of transport infrastructure scenarios be presented.
“(...) this new generation of urban models, characterized by an innovative paradigm, which we have termed geosimulation. The concept of geosimulation is based on geographic, i.e.,
spatially-related automata. Modern GIS and remote sensing databases serve as the information source for geosimulation. (...) Also, modern system theory provides the
paradigmatic basis and analytical tools for investigating geosimulation models.”
(Benenson & Torrens, 2005: 2)

Interim conclusions
150
Model development
151
11. Model development
The Dar es Salaam land-use model was specifically developed for the present research context. In the first phase of the project, the availability of base data turned out to be a very challenging task with respect to GIS-based analyses and land-use modelling and simulation. Thus, the development of the model had to take data availability issues into account. Fortunately, CA-type models with their specific features as mentioned in the previous chapters do not demand a very sophisticated database and can (to certain degrees) compensate ‘information and data gaps’ by their specific features - primarily by considering neighbourhood effects. The following chapters elaborate on the model development by discussing requirements to the model design and technical implementation.
11.1. Model database
The compiled database serves to model and simulate urban dynamics in terms of informal residential growth in Dar es Salaam. Thus, the database had to consider given technical requirements as described in more detail below as well as requirements resulting from the phenomenon to be modelled. Chapter 6.1 has introduced relevant urban theory on location decisions, urban structures, and urban growth. In addition, Chapter 9.1 has added findings and knowledge on the local specifics observed in Dar es Salaam. Concluding the two chapters call for specific variables to be considered in the subsequent analysis and modelling work. At the same time the compilation of the database was restricted by data availability issues. These were mainly influenced by prerequisites to define which requirements the datasets have to meet to be appropriate for this purpose. This reduced the number of variables to be included into the geodatabase.
The following paragraphs introduce the compilation of the database for the extent of the study area (see Chapter 9.2). Due to the overall needs related to development of a CA-based simulation model some prerequisites concerning the underlying database had to be considered. The datasets have to:
cover the whole extent of the study area,
spatially fit with the reference datasets,
be available as time slices for 1982, 1992, and 2002 for dynamic variables, and
be reliable, complete, consistent and offer appropriate resolution.
Considering these requirements the spatial database has been compiled based on datasets which were already available as well as data which were created or updated during this research based on aerial photographs. However, at the start of the analysis and modelling work no geodata was available to the project. First attempts to get hold of datasets on land use or transport networks from Dar es Salaam City Council or from local project partners were rather unsuccessful because either no data existed or could not be made available. If data were available it usually did not fulfil the above-sketched requirements. These experiences underlined why Dar es Salaam and many other cities in

Model development
152
developing countries are often referred to as data-poor environments. Among public authorities comprehensive geodatabases are not in use or project-related databases often get lost once respective funding has ended. Local agencies and public bodies are missing common accurate, spatially georeferenced base data. Basic data used in public administration are mostly based on stand-alone digitising and spatial referencing which in most cases leads to incompatible and inaccurate datasets if data are available at all. Thus, it became clear that data availability imposes a considerable constraint towards the actual analysis and modelling work to be carried out.
Fortunately, it was encountered that ITC, Enschede, in the Netherlands had carried out considerable work on data acquisition and compilation in Dar es Salaam. After contacts had been established the authors were granted access to the ITC database which served as a basis to compile the final model database (see Table 6).

Model development
153
Table 6: Overview of variables included in the calibration database
Variable Dynamic27 Description
Land use yes Land use of each cell (informal residential, planned residential, other urban, vacant / agriculture)
Elevation no Elevation above sea level of each cell
Slope no Slope in each cell in degrees derived from digital elevation model
Trunk road distance
yes Euclidean distance from cell centre to next major road
Minor road distance
yes Euclidean distance from cell centre to next minor road
All road distance yes Euclidean distance from cell centre to next road
Network distance to CBD
yes Shortest path distance in metres on transport network from each cell centre to the central business district
Travel time to CBD
yes Average travel time (in minutes) on transport network from each cell centre to the central business district
Travel time to Tegeta
yes Average travel time (in minutes) on transport network from each cell centre to the informal service centre of Tegeta
Travel time to Kimara
yes Average travel time (in minutes) on transport network from each cell centre to the informal service centre of Kimara
Travel time to Gongo la Mboto
yes Average travel time (in minutes) on transport network from each cell centre to the informal service centre of Gongo la Mboto
Travel time to Rangi Tatu
yes Average travel time (in minutes) on transport network from each cell centre to the informal service centre of Rangi Tatu
Informal residential neighbourhood (count and score)
yes Cellular neighbourhood considering informal residential land use: count and weighted count (score) of informal residential cells within circular neighbourhood around each cell
Planned residential neighbourhood (count and score)
yes Cellular neighbourhood considering planned residential land use: count and weighted count (score) of formally planned residential cells within circular neighbourhood around each cell
Other urban neighbourhood (count and score)
yes Cellular neighbourhood considering other urban land use: count and weighted count (score) of other urban cells within circular neighbourhood around each cell
Source: Own illustration
11.2. Conceptualising the model
The Dar es Salaam land-use model is a CA-based simulation model considering the theoretical foundations as described before in Chapters 5.6. to 5.8. The authors decided to keep the model as simple as possible while designing it to reproduce the observed spatial phenomena as powerfully as possible. This seemed even more appropriate as
27 Multi-temporal data is marked to be dynamic when the specific dataset for the relevant years 1982, 1992, and 2002 changes between the time slices. In contrast, some datasets remain fixed as basically natural assets like slope and elevation do not change during the simulation period.

Model development
154
the model is applied in a data-poor environment and keeping the model simple would endorse the options to transfer the developed model to similar application contexts.
Scale, size and extent
Spatial scale decisions are argued to be amongst the most important to take in CA modelling. “Scale generally represents the window of perception through which reality is observed” (Ménard & Marceau, 2005; referring to Marceau, 1999). In urban CA three features in terms of spatial scale have to be defined: The spatial extent of the study, the cell size, and the neighbourhood configuration. According to Ménard & Marceau the decision can be determined by “a mixture of data availability, intuition, computing and resource considerations, trial and error, and sometimes information about spatial unit size or influences” (2005: 695). As the model at hand is based on the principles and techniques of CA, space is being divided into discrete evenly spaced cells. The cell size was defined to be 100x100 m, a common size used for other urban CA applications documented in scientific literature (e.g., Barredo et al., 2003; Deadman et al., 1993; de Almeida et al., 2003). Considering the data to be fed in to the model as well as local expert opinions this choice has been proven useful for the application at hand. The cellular neighbourhood to be considered by the model was designed as an array of circular rings with a maximum radius of 6 cells (for further details see Chapter 11.2.2). A further factor influencing the modelling work is the extent of the study area. In order not to unnecessarily constrain the model it seems desirable to choose the spatial extent of the study area to cover relevant spatial interactions as far as possible28. On the other hand the extent of the area is constrained by the fact that all data needed by the model have to be available for the whole study area. This turned out to be the decisive factor for choosing the spatial extent for the presented model.
Land use as the observed phenomenon
As land use is the central phenomenon subject to the current modelling work each cell is assigned to a specific land use. This information was derived from vector data that have been transformed into a raster dataset using GIS software. Since each cell could only represent one discrete land-use type the assigned land use represents the predominant land use in that specific cell, i.e., the land-use type with the highest areal share. These land uses constitute the basis for the model and for the simulation of future urban development.
The Dar es Salaam land-use model is designed to simulate the spatial dynamics of informal residential land use over time. It iterates a given land-use pattern in constant time intervals (e.g., ten years) and changes the land-use state of selected cells from vacant / agriculture to informal residential. In order to do so, the model considers the specific transition potential of each cell (see Chapter 5.7). This potential is being
28 In cases like Dar es Salaam where there are huge amounts of open space available outside the built-up areas and rapid growth of informal urbanisation extends the urban fringes into the periphery. Accordingly, the study area should include the existing urban areas and an appropriate amount of surrounding vacant land. As no other influencing agglomerations exist close to Dar es Salaam the choice of the model’s study area does not need to consider interactions with neighbouring cities.

Model development
155
calculated by considering various variables determining informal residential location decisions. The selection of respective variables constituting the cell properties on the one hand has been led by scientific literature and considerations about the dominant drivers of urban development which again have been approved by local experts. On the other hand data availability issues also had to be considered during the process of variable selection.
Variables and land-use transformations
The factors determining cell suitability can be distinguished into current land use, accessibility, slope and cellular neighbourhoods (see Chapter 11.2.2). In contrast to some other urban CA-based models the zoning status of each cell is not taken up as a variable for land-use change potential in this study. This is due to the fact that there is no comprehensive legally binding land-use plan approved and in place (see Chapter 8.2). The only planning designation considered by the model for future simulations are the areas of the 20.000 Plots Project which are assumed to be completely transferred to planned residential use in 201229 (for further details see Chapter 11.3). The overall land demand for informal residential land is considered as an exogenous factor to the model. The amount of building land required determines how many cells will be transformed from vacant to informal residential land use. The model allocates the required number of cells by considering the specific transition potential of each vacant cell selecting those cells with the highest likelihood (transition potential) to be transformed. This is the basic functional principle of the so-called ‘transition rules’. The overall model structure can be seen from Figure 66.
The following chapters provide more detailed information on the variables and are structured in accordance to the general model procedure as illustrated in Figure 66.
Figure 66: Model concept for informal residential development
Source: Own illustration
29 The 20,000 Plots Project sites are in fact recently being implemented and are, thus, assumed to be developed at the end of the simulation.

Model development
156
11.2.1. Constraint areas
The model incorporates constraint areas as a fixed factor. In constraint areas no development is permitted to take place and the areas are excluded from the model simulation (see Figure 67). In the case of Dar es Salaam which is characterised by much informal development and weak planning these constraint areas are mainly subject to natural constraints. This has been confirmed by local experts that participated in a workshop discussion in Dar es Salaam. For the Dar es Salaam land-use model it has been decided to delineate constraint areas as follows:
river valleys,
swamp areas, and
forest reserves.
Figure 67: Model procedure to define constraint areas
Source: Own illustration
Figure 68 illustrates the distribution of constraint areas in the study area. The comparison of the existing dataset and the actual land uses in 2002 exhibited that parts of the constraints areas that were classified as river valleys were already developed. Accordingly, the authors decided to intersect the river valley constraint areas with land-use data for 2002 and restrict the constraint areas to areas that were not developed for urban uses so far. This caused the fragmentation of river valley constraint areas as mapped.

Model development
157
Figure 68: Constraint areas
Source: Own illustration; based on terrain data provided by ITC, Enschede
11.2.2. Cell suitability
Current land use
If a cell is not part of a constraint area its current land use constitutes one of the cell properties considered in the next step of each simulation iteration to influence future development (e.g., if a cell is assigned to planned residential or other urban use it would not develop into an informal settlement). Since the model only considers land-use transformations of vacant / agricultural cells into informal residential cells, current land use is the fundamental factor to restrict the number of cells to be considered at the stage of calculating the transition potential.
Each cell’s current land use affects the cell’s exposure to change and influences the local neighbourhood of surrounding cells. Therefore, after defining constraint areas the cells to be included into the simulation at time t=0 in terms of being potentially exposed to the relevant transformation process has to be defined. As the model simulates land-use transformations from vacant / agricultural use to informal residential land use only the relevant cells for simulation are all cells currently assigned to vacant / agricultural land use. For the calculation of cell neighbourhood factors for these cells all cells inside the study area are considered without any restrictions. The neighbourhood scores for

Model development
158
the cells are determined by the land uses of the cells inside the cellular neighbourhood. In the subsequent time step t=1 this imposes a land use transformation for an exogenously defined number of vacant cells being transformed into informal residential cells. Consequently, due to these changes the neighbourhood constellations in further iteration steps will also change (see Figure 69).
Figure 69: Land-use transformation process
Source: Own illustration
Accessibility
The Dar es Salaam land-use model considers two basic types of accessibility factors associated with transport infrastructure: distance-related and travel time-related ones. While the model includes only one distance-related variable, namely Euclidean distance to next road, the field of travel time-related variables comprises 5 different variables. Each of these is calculated as average travel time for the fastest connection on the network to the given destinations. 5 different destinations have been identified to be relevant: the CBD and four informal sub-centres, namely Tegeta, Kimara, Gongo la Mboto, and Rangi Tatu (see Figure 56). These variables have all been calculated as described above (see Chapter 9.3.2).
Neighbourhood
The neighbourhood effect influences the cell’s transition potential by determining which land uses can be found in its neighbourhood. The underlying assumption is that the neighbourhood has a strong influence over a cell’s development and that the closest neighbouring cells have the highest influence on cell in question (core cell). Furthermore, it is assumed that the degree of influence decreases with increasing distance to the core cell. The decision on the size of the neighbourhood, i.e., the radius around each cell to be considered as the neighbourhood as well as the gradient of decreasing influence from the core cell has to be taken as part of the modelling process.

Model development
159
In case of the Dar es Salaam model the cellular neighbourhood may consist of cells belonging to four different land-use classes. For the simulated land-use class informal residential, it is assumed that predominantly cells assigned to informal residential land use have a strong effect on the modelled transformation.
The aforementioned considerations have been discussed with local experts and the decision about the neighbourhood delineation was based upon their opinions about the suitable local zone of interaction of residents. In addition, experimental testing of the model with different neighbourhood configurations (100 m and 1100 m radii) was conducted. The regression model was applied to derive model coefficients for datasets that included neighbourhood scores for a radius of either 100 m or 1100 m instead of 600 m to compare the effects of larger and smaller neighbourhood delineations. The results confirmed the chosen neighbourhood size demonstrating that the best results and the best model fit were achieved in conjunction with the radius of 600 m.
Figure 70: Neighbourhood delimitation and distance classes
Source: Own illustration
Finally, a circular neighbourhood formed by a radius of 6 cells (i.e., 600 meters) from the centre of the core cell was defined for the Dar es Salaam model. All cell centroids in a distance of up to 600 m are included into the neighbourhood calculations (see Figure 70). These cells total to a number of 112 cells constituting the core cell’s neighbourhood. Following Tobler’s first law of geography, a distance-based weighting gradient has been applied to the 6 rings when calculating the neighbourhood score so that cells closer to the core cell carry more weight than more distant ones (see Figure 71)30. The distance classes are defined as follows: the first (inner) one forming the classical von Neumann neighbourhood contains cells with a centroid in a distance of 100 m from the centre’s
30 The weighting factor is defined by the following equation: y=(7-x)2.This highlights the relevance of nearness but at the same time does not assume the influence to decrease as rapidly as with an exponential function.
100 200 300 400 500 600600 500 400 300 200 100
100200
300400
500600
600500
400300
200100
distance classes (distancein m)

Model development
160
core. The subsequent bands draw rings in 100 m steps around the centre of the core cell until the full neighbourhood radius of 600 m is complete.
Figure 71: Weighting of neighbourhood distance classes
Source: Own illustration
For each of the concentric distance bands all cells assigned to a particular land use are counted and subsequently this number is multiplied with the specific weight of the respective band. Finally, the neighbourhood score is attained by summing up all scores from the six bands. This procedure is applied to each cell of the land-use raster that was defined before to be relevant during this simulation period.
Slope
The slope factor is simply included into the model as the slope variable calculated as base data described in Chapter 9.3.3.
11.3. Exogenous drivers and settlement area demand
The demand for new residential areas is calculated externally to the model based on UN (2008c) population projections for Dar es Salaam. The UN population projections assume an increase from about 3 million inhabitants in 2008 to 4 million inhabitants in 2015 and 5.7 million inhabitants in 2025 (see Figure 72). UN projections provide population figures in five years intervals. For this study data were needed starting back in 1982 so that figures were used from 1980 on. Historical data were needed to derive historical multi-temporal average population densities for residential use as a basis for forecasting land-use demand for residential purposes in the future. UN population prospects project future urban growth up to the year 2025. The figures were available for five year intervals. For the simulations of this study the figures had to be interpolated to derive the population figures for 2012 and 2022. The following figures illustrate the population development as it is taken as a basis for the further modelling work.
0
5
10
15
20
25
30
35
40
1 2 3 4 5 6
wei
ghti
ng fa
ctor
distance class
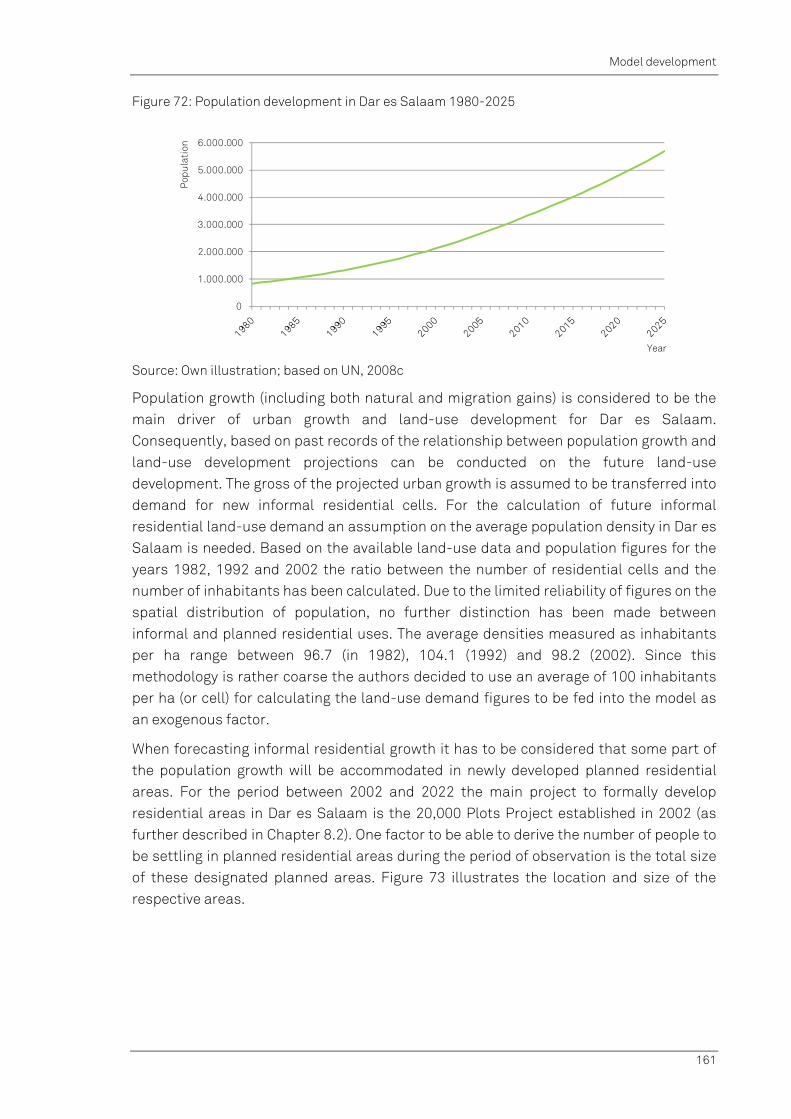
Model development
161
Figure 72: Population development in Dar es Salaam 1980-2025
Source: Own illustration; based on UN, 2008c
Population growth (including both natural and migration gains) is considered to be the main driver of urban growth and land-use development for Dar es Salaam. Consequently, based on past records of the relationship between population growth and land-use development projections can be conducted on the future land-use development. The gross of the projected urban growth is assumed to be transferred into demand for new informal residential cells. For the calculation of future informal residential land-use demand an assumption on the average population density in Dar es Salaam is needed. Based on the available land-use data and population figures for the years 1982, 1992 and 2002 the ratio between the number of residential cells and the number of inhabitants has been calculated. Due to the limited reliability of figures on the spatial distribution of population, no further distinction has been made between informal and planned residential uses. The average densities measured as inhabitants per ha range between 96.7 (in 1982), 104.1 (1992) and 98.2 (2002). Since this methodology is rather coarse the authors decided to use an average of 100 inhabitants per ha (or cell) for calculating the land-use demand figures to be fed into the model as an exogenous factor.
When forecasting informal residential growth it has to be considered that some part of the population growth will be accommodated in newly developed planned residential areas. For the period between 2002 and 2022 the main project to formally develop residential areas in Dar es Salaam is the 20,000 Plots Project established in 2002 (as further described in Chapter 8.2). One factor to be able to derive the number of people to be settling in planned residential areas during the period of observation is the total size of these designated planned areas. Figure 73 illustrates the location and size of the respective areas.
0
1.000.000
2.000.000
3.000.000
4.000.000
5.000.000
6.000.000
Popu
lati
on
Year
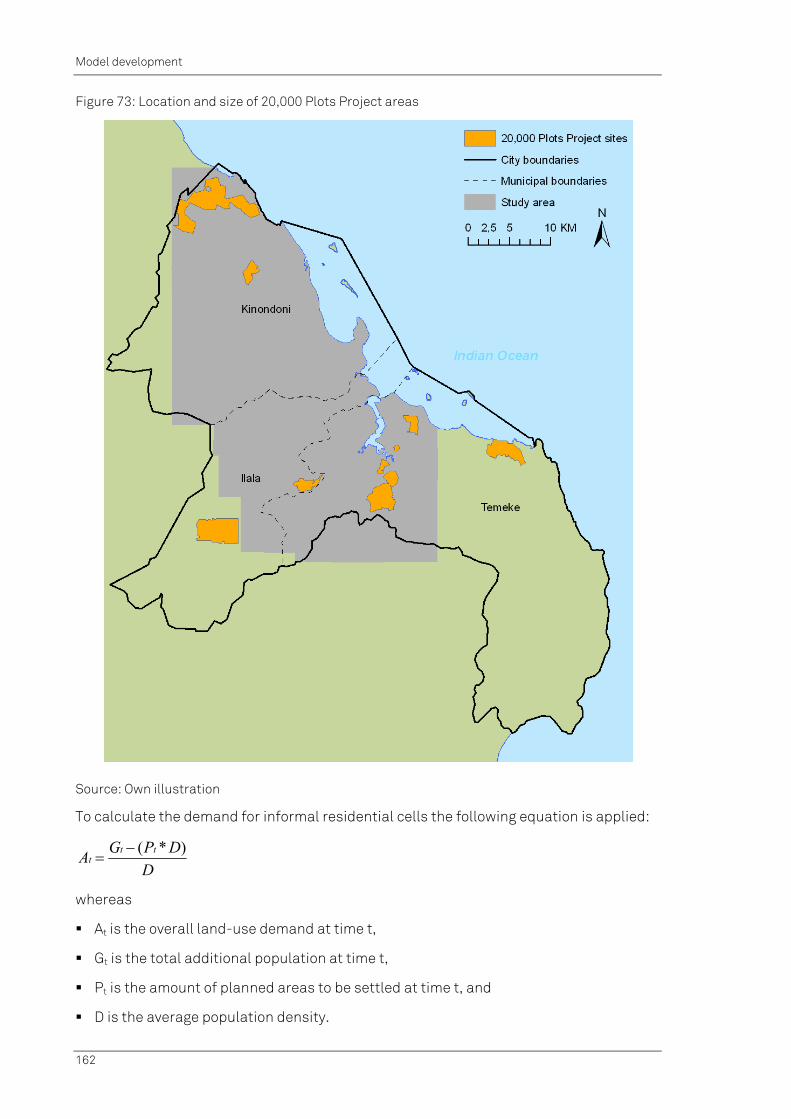
Model development
162
Figure 73: Location and size of 20,000 Plots Project areas
Source: Own illustration
To calculate the demand for informal residential cells the following equation is applied:
D
DPGA
ttt
)*(
whereas
At is the overall land-use demand at time t,
Gt is the total additional population at time t,
Pt is the amount of planned areas to be settled at time t, and
D is the average population density.
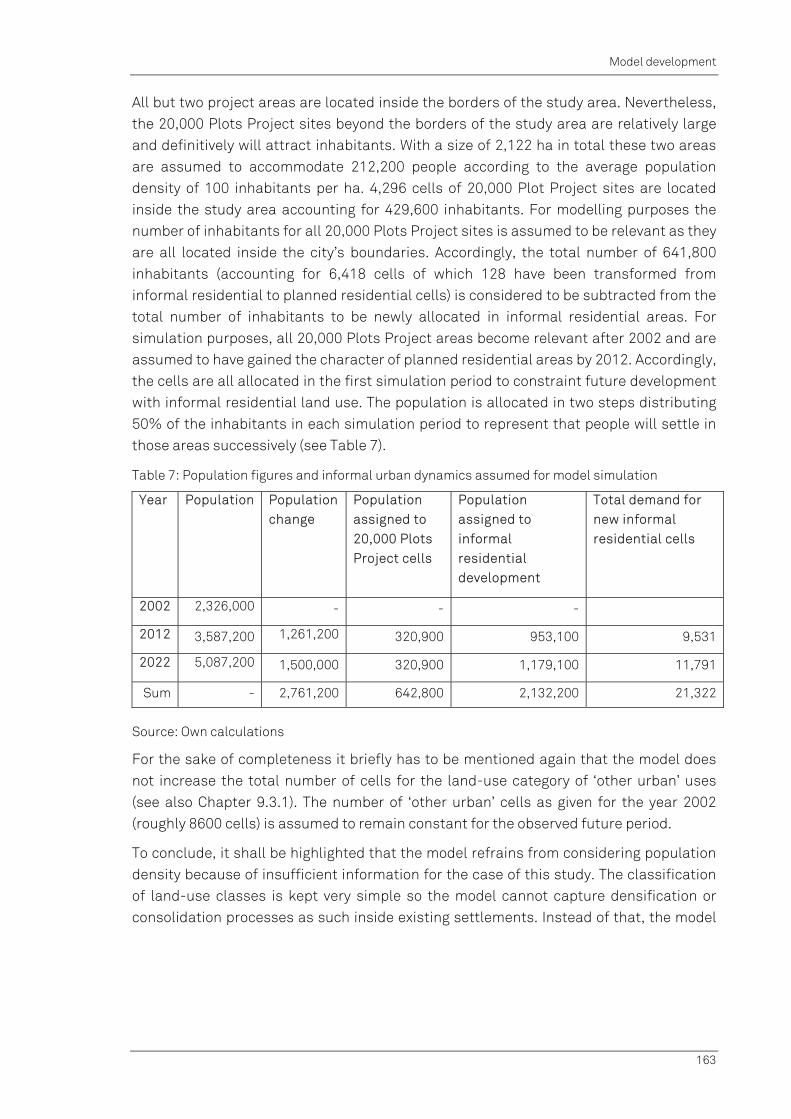
Model development
163
All but two project areas are located inside the borders of the study area. Nevertheless, the 20,000 Plots Project sites beyond the borders of the study area are relatively large and definitively will attract inhabitants. With a size of 2,122 ha in total these two areas are assumed to accommodate 212,200 people according to the average population density of 100 inhabitants per ha. 4,296 cells of 20,000 Plot Project sites are located inside the study area accounting for 429,600 inhabitants. For modelling purposes the number of inhabitants for all 20,000 Plots Project sites is assumed to be relevant as they are all located inside the city’s boundaries. Accordingly, the total number of 641,800 inhabitants (accounting for 6,418 cells of which 128 have been transformed from informal residential to planned residential cells) is considered to be subtracted from the total number of inhabitants to be newly allocated in informal residential areas. For simulation purposes, all 20,000 Plots Project areas become relevant after 2002 and are assumed to have gained the character of planned residential areas by 2012. Accordingly, the cells are all allocated in the first simulation period to constraint future development with informal residential land use. The population is allocated in two steps distributing 50% of the inhabitants in each simulation period to represent that people will settle in those areas successively (see Table 7).
Table 7: Population figures and informal urban dynamics assumed for model simulation
Year Population Population change
Population assigned to 20,000 Plots Project cells
Population assigned to informal residential development
Total demand for new informal residential cells
2002 2,326,000 - - -
2012 3,587,200 1,261,200 320,900 953,100 9,531
2022 5,087,200 1,500,000 320,900 1,179,100 11,791
Sum - 2,761,200 642,800 2,132,200 21,322
Source: Own calculations
For the sake of completeness it briefly has to be mentioned again that the model does not increase the total number of cells for the land-use category of ‘other urban’ uses (see also Chapter 9.3.1). The number of ‘other urban’ cells as given for the year 2002 (roughly 8600 cells) is assumed to remain constant for the observed future period.
To conclude, it shall be highlighted that the model refrains from considering population density because of insufficient information for the case of this study. The classification of land-use classes is kept very simple so the model cannot capture densification or consolidation processes as such inside existing settlements. Instead of that, the model

Model development
164
uses an average population density of 100 inhabitants per ha for all residential classes to forecast informal residential land-use demand31.
11.4. Transition potential and transition rules
Based on the above described suitability factors the model calculates each cell’s transition potential which represents the cell’s relative likelihood to be transformed from vacant to informal residential land use. The model applies a binomial logistic regression model to define transition potential. The complex procedure to define appropriate model coefficients and the basic model equation are described in detail in the chapter on model calibration and validation (see Chapter 12).The functional principle of the so-called ‘transition rules’ is that the model allocates the required number of cells selecting those cells with the highest transition potential first until the externally defined demand for additional informal residential cells is achieved.
11.5. Perturbation
In contrast to other existing CA-based land-use models the authors finally decided not to include a perturbation into the presented model. A perturbation factor represents the assumption that location decisions of individual inhabitants do not fully follow rational rules. In contrast to the homo economicus individual decisions in the real world are influenced, e.g., by imperfect markets or imperfect knowledge of the individual. This has lead to the establishment of a stochastic variation factor to land-use simulation models using Monte Carlo techniques.
Practically, the inclusion of a perturbation factor would have the effect that every simulation run resulted into a slightly different land-use distribution. Therefore, to the authors a shift from a deterministic to a stochastic modelling approach does not impose a practical improvement to the presented model. If the model is calibrated to be able to reproduce urban dynamics as accurately as possible concerning the existing basic datasets any perturbation factor must be considered to decrease the model’s accuracy. Therefore, a perturbation factor most likely would have the impact that the model predicts urban dynamics less correctly.
Another practical issue results from the necessity to decide on a reference model run. If each model run produces slightly differing results the choice of a preferred result to be presented as the best or correct result imposes considerable methodological issues. Obviously, this also applies when it comes to comparing the results of various scenarios. It becomes difficult to deduce which changes really occur due to the changes implied by the scenario and not due to the perturbation factor and the stochastic variation of the two results. Leaving the perturbation factor out and keeping the model parameters ceteris paribus facilitates the identification of interrelationships and effect of changes due to model parameters.
31 For example, the actual population densities in consolidated informal residential areas in average is much higher than 100 persons/ha whereas newly established informal residential areas at the urban periphery exhibit lower population densities.
Model development
165
Since the output of each model run slightly differs, many applications try to solve this problem by running multiple simulation runs and calculating averaged results to be used for both the baseline simulation and the scenarios. However, it can be argued that if the number of simulation runs used to calculate such average solutions is just high enough, the averaged output will anyway be congruent to the solutions produced when neglecting the perturbation factor.
Naturally, like any urban model the model at hand cannot estimate future development completely unfailingly which is basically due to the model’s high level of abstraction, the absence of data on some relevant drivers and potential slight inaccuracies of the geodatabase. Moreover, there is uncertainty of land use changes found in reality, too. It can be argued that the model at hand already represents a somehow imperfect market as the data available to the model face considerable constraints concerning accuracy and correctness and is highly abstracted (e.g., cell size, neglecting residential densities and the aggregate class of other urban land uses). Since not all desired information was available due to the data-poor environment a lot of abstract assumptions have been made (e.g., for calculating travel times) and some information was even not available at all (e.g., land prices or availability of land). Land prices could to some degree be represented by the inclusion of accessibility variables (prices are highly dependent on distance to roads; see Chapter 9.1.2) but the varying degree of land availability found in reality could not be considered. For example, there was no way applicable to represent whether the land owner of a specific cell was willing to sell the land to somebody else to allow for land-use transformation towards residential use.
Taken together this already leads to a certain level of inaccuracy in the model outputs and keeping this in mind it seems undesirable to add a perturbation factor on top of that. Eventually, the model only demonstrates the spatial distribution of likeliness of informal urban dynamics given the existing urban structures and does not claim to make totally precise and reliable forecasts. The model should rather give ideas where, given all the described model assumptions and datasets, informal urban growth is very likely to take place in the future. It is not that important whether the exact cell can be predicted but rather to project the development of future urban patterns.
11.6. Technical implementation
The following subchapter describes the technical implementation of the model which has been developed based on a GIS modelling framework. Subsequently, the model core will be explained in detail along with the concepts concerning data input and output as well as visualisation and assessment of model outputs.
11.6.1. ArcGIS as basic modelling framework
The simulation model developed in this study is based on standard GIS software and designed along the principles of CA. Since CA as a modelling technique are established in urban science, there was much background information available which the authors could refer to. However, it became evident that in order to be as flexible as possible

Model development
166
there would be no out-of-the-box solution concerning the implementation of the simulation model. Thus, the model has been developed specifically for this research.
The decision to use the standard GIS package ‘ArcGIS/ArcInfo’ by ESRI as basis for the subsequent modelling work was taken because the model could use many of the usual GIS features for its basic operational procedures. A basic requirement fulfilled by ArcGIS was the capability of processing both raster and vector data which seemed desirable in order to comply with respect to the chosen modelling approach. The raster processing functionalities found in ArcGIS and particularly in the Spatial Analyst extension serve for a whole range of features associated with the way CA are conceptualised. The ability to handle vector data was mandatory since many of the input data used were in vector format. This software is capable of running advanced GIS operations to process both raster and vector data.
Even more importantly, the modelling work needed a framework that offers a suitable programming interface to be able to make use of GIS functionality in a customised application. ArcGIS provides developers with rich options for customised application development supporting various programming and scripting computer languages such as Python which has been chosen to implement the core model.
11.6.2. A Python-driven model
The simulation model developed by the authors is based on software allowing for rapid model development due to manifold pre-existing GIS functionalities in conjunction with Python scripting language which has been employed to serve as the programming environment providing the necessary option to extend functionality and develop a customised application.
The model core consists of a Python script driving the whole model runtime. To initialise the model the core script checks for appropriate input parameters and creates respective Python objects with parameter values used during runtime. Once the model is initialised the script enters the main iteration process. Most of the model variables are being calculated at the beginning of each model loop prior to further processing. This comprises primarily the determination of current land use and neighbourhoods. For the latter, individual custom models have been developed with ArcGIS model builder which are invoked by the core script32. The outputs are being stored in ArcGIS grid format for further processing.
After determining the cell properties the calculation of the transition potential is being conducted by the model. The core script generates the equation dynamically and passes it to the Map Algebra tool of the Spatial Analyst toolbox, by which all variables of the
32 Using the standard functionality provided by the software framework the customised neighbourhood calculations with distance weighted scoring could not be implemented immediately using the tools provided by default. Thus, this procedure had to be more or less directly implemented using Python in conjunction with the focal statistics features provided by ArcGIS Spatial Analyst.

Model development
167
equation are processed and the corresponding coefficients are applied to determine each cell’s transition potential.
Subsequently, the core script invokes the Python-based procedure of iteratively selecting cells according to their transition potential (in descending order starting with the highest value) to be transformed into a respective land use until the demand for the specific land use is satisfied. Based on these transformations a new land-use raster is being generated at the end of each model iteration which serves as an input raster for the next model loop. At the end of one iteration the model loops iteratively through the core script until the desired number of iterations as defined externally has been reached.
11.7. Data input and output, visualisation, and results assessment
The presented model needs information on the spatial distribution of the respective variables. In most cases these variables represent information derived from spatial datasets during model runtime. These spatial datasets need to be fed in to the model in form of raster or vector data for the extent of the study area. The model database comprises specific locations where respective datasets reside (see Figure 74). Following the naming conventions the datasets are automatically processed by the core script providing the respective variables to the subsequent model procedures. This approach offers the flexibility of exchanging input datasets for the model without changing the core script and has already proven useful during calibration and validation procedures.
After each iteration the model creates a new land-use dataset which can directly be used for further analysis, visualisation, display, and storage of the model results. Like most other datasets processed during runtime the output land-use data is in ArcGrid format and can, thus, be utilised in other GIS applications.
One application developed in conjunction with the presented model is the rapid analysis of model outputs. Once the outputs datasets have been generated they can be loaded by a template map file into the ArcGIS mapping application ArcMap. Here a custom set of tools has been developed based on Model Builder which can be employed to automatically analyse the model outputs with just a few mouse clicks in order to derive key information on structural parameters as well as degrees of fit between model outputs and reference datasets. This turned out to be particularly useful for instance during calibration and validation procedures. The resulting maps can be exported and saved to respective graphic files.
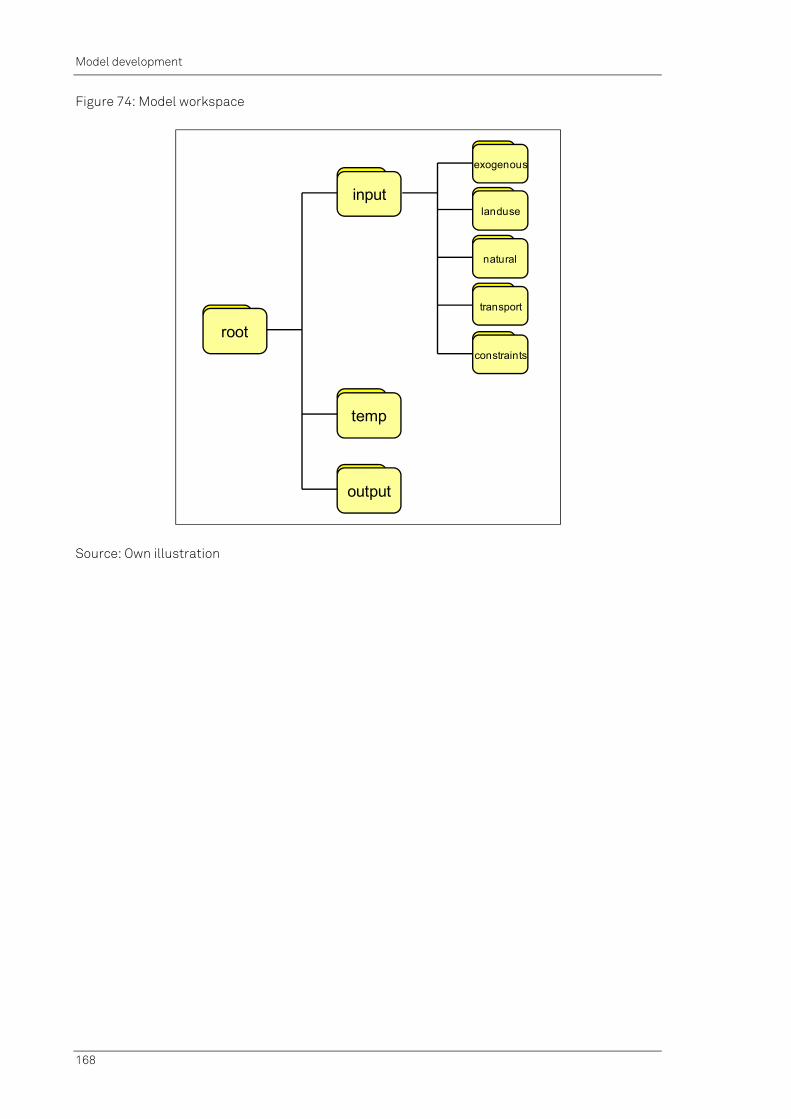
Model development
168
Figure 74: Model workspace
Source: Own illustration
root
input
temp
exogenous
landuse
natural
transport
constraints
output

Model calibration and validation
169
12. Model calibration and validation
Among the main challenges when developing urban models is the process of model calibration and validation. These steps go hand in hand and can be applied iteratively to reach the optimum result. Model calibration aims at reproducing land use of a reference year to which the model is tuned while the validation step for the model at hand simulates land uses for another point in time. The latter is done based on the relationships established in the calibration phase and compares the model results with observed real land-use patterns for that year (Loonen et al., 2007).
“Without calibration it will be impossible to correctly describe the behaviour of the system and predict its possible future” (Silva & Clarke, 2002: 530). Calibration (in statistics) is the reverse process to regression. The calibration problem is the use of known data on the observed relationship between the dependent variable and the independent variables to estimate other values of the independent variables from new observations of the dependent variable. Model calibration is the process by which numerical values are assigned to the model parameters to ensure that the model simulation reproduces the phenomenon observed in reality realistically (Hasbani & Marceau, 2007: 2). The aim of the calibration is to enable the model to reproduce land use for the base year(s). Clarke et al. have highlighted the “critical nature of calibration as a scientific process, as an opportunity to communicate the model's functions to a broader audience, as the solid ground upon which predictive work stands (...). Calibration should be an integral step in model design, (...) and should build a rigorous scientific base for validation and predictive use of the model” (1996: 9).
The modelling process needs to include procedures to ensure that the model and its results are plausible. Model validation (and verification) procedures are of basic importance as simulation models are increasingly used in “problem solving and in decision making. The developers and users of these models, the decision makers using information derived from the results of the models, and people affected by decisions based on such models are all rightly concerned” (Sargent, 1998: 121). Schlesinger et al. (1979) define model validation as a substantial prerequisite that a computerised model in its intended application possesses a satisfactory range of accuracy.
12.1. Coefficient estimation
Basically, model calibration aims at estimating model coefficients appropriately. Model developers can generally choose between two general approaches namely econometric analyses and heuristic estimation. Moeckel points out that “econometrics analyse data by statistical procedures to calculate coefficients, heuristic approaches guesstimate coefficients based on expert interviews, theoretical knowledge, and trial-and-error” (2007: 251). Zanakis et al. highlight that in the optimisation arena for solving real-world optimisation problems “the development of heuristics is chiefly an art and a creative problem solving endeavour” (1989: 88). Both approaches have their specific strengths and weaknesses. Econometric methods are often criticised for being applied without any theoretical foundation. They might exclude factors that are statistically insignificant
Model calibration and validation
170
in the data at hand although their importance is generally agreed on underlined by major theories. Moreover, they are accused to be too rigid and restricted by data availability issues and provide information that is biased by historical events. On the other hand heuristic methods are said to be arbitrary, manipulating to achieve the desired results and not fully traceable for others in terms of understanding the underlying argumentation (Moeckel, 2007: 251 f). As the majority of urban CA applications now “focus more on concrete predictability and geographical plausibility than on theoretical process modelling, the transition rules are increasingly empirically derived” (Ménard & Marceau, 2005: 694).
For the work at hand both approaches were applied and brought into combination to reach the optimal model fit. Moeckel argues that due to the fact that both approaches demand prior knowledge about the observed phenomenon “the contrast between econometric and heuristic methods should become less relevant, as the two need not to be taken as dichotomy but rather as supplements” (Moeckel, 2007: 252).
Sometimes, econometric analyses lead to results that conflict with established theory. Statistical models might produce results that fit quite well to the observed phenomenon but are estimated under a set of wrong assumptions or limited data. In these cases, the authors suggest to rather stick to the theory as long as the theory is convincingly applicable to the phenomenon under observation. In line with most models which use a combination of the two approaches the authors support a hybrid approach.
12.2. Transition potential and transition rules
In CA modelling land-use transformations are implemented based on calculating so-called transition potentials and applying transition rules. The former define the specific potential of a cell to be transformed into a specific land-use (in this case from vacant into informal residential land use). The latter is a set of distinct rules which handle the process of land-use allocation based on the cells’ transition potentials and the overall demand for that land use. In the Dar es Salaam land-use model, the transition potential for informal residential cells is determined by the cell suitability in terms of natural conditions, accessibility and the cellular neighbourhood. While natural conditions in the present case refer to slope only, accessibility comprises the variables “travel time to CBD”, “travel time to sub-centers” and “Euclidean distance to the closest road”. The neighbourhood types considered are “informal residential neighbourhood composition” and “planned residential neighbourhood composition”. Other urban has not been considered since it constitutes rather a residual category and the contained land uses may impose quite different effects in terms of attractiveness or repulsion of neighbouring cells.
Based on the derived combined intrinsic potential of each cell the transition rules are applied defining which cells are transformed into another land use and which ones remain unchanged. Simply put, the applied transition rule draws all vacant cells in descending order according to their transition potential and then selects cells to be transformed sequentially starting from the highest transition potential until the land-use demand which is defined exogenously is satisfied. Once the total demand is
Model calibration and validation
171
satisfied the procedure is finished. To calculate the transition potential on which the transition rule relies a logistic function is applied which requires parameter values and a set of specific parameter coefficients. For a detailed description of the applied econometric approach of a binary logistic regression model (as used to estimate these coefficients in this modelling work) the reader is referred to Backhaus et al. (2006).
12.3. Calibration process and results
The calibration process proved to be quite demanding for the study at hand. From the beginning of the study the authors had followed a theory-guided model development when choosing variables and modelling the linkages between them. The logistic regression is an econometric method but the authors combined it with a more heuristic approach as they complemented and recombined model variables in an iterative process to improve model quality. During model calibration the authors used degree of fit parameters to compare the simulated land-use patterns of numerous test runs with those that could be observed in reality. Additionally, visual comparison and interpretation of the generated land-use maps were applied to heuristically improve the model. In the following some selected examples will be given to highlight important steps in the calibration process. These visual map comparisons exhibited some weaknesses of the interim simulation results. At the beginning of the process, accessibility indicators were restricted to accessibility in terms of travel time to CBD and various indicators concerning distance to different road types. Visual interpretation of the simulated land-use maps revealed that simulation results covered development dynamics insufficiently, particularly in those areas that had transformed into informal sub-centres during the time period under study. As a consequence, the authors decided to define 4 informal sub-centres (see Figure 56) and add respective accessibility variables in terms of travel time into the calibration process in order to test whether these new variables would overcome this shortcoming of the model and improve the quality of the model.
Land-use data were available for the years 1982, 1992 and 2002. The urban development patterns of the two observation periods turned out to be quite different: Whereas development patterns in the period between 1982 and 1992 were relatively compact, data for 2002 showed more disperse settlement patterns particularly at the urban periphery along Morogoro Road. Whereas data for 1982, 1992 and 1998 were provided by ITC, Enschede, data for 2002 were updated non-automatically based on the existing stock of data and by using aerial photographs. However, as huge parts of data collection were executed via visual interpretation and manual digitising, the detail and accuracy of the resulting datasets vary33. This might have caused some temporal bias in land use exaggerating the dispersion of settlement structures in 2002. Accordingly, regression analyses for the two time periods exhibited clearly differing regression
33 For example in contrast to the former time slices the 2002 data contains more fragmented structures with much more detail at the urban fringes. These structures perhaps also existed in earlier years but have not been included into the respective datasets due to various reasons like for instance weaker quality and resolution of the underlying aerial photographs or simply different editors.

Model calibration and validation
172
coefficients leading to rather low levels of model fit when being applied to the other time period during the subsequent validation procedure. To overcome this challenge the authors decided to calculate the regression model for the period from 1982 to 2002 enabling the model to estimate coefficients that best suit the overall development patterns in the observed time segment. This decision was inter alia taken considering the fact that the time-sliced land-use data exhibit considerable variations concerning accuracy and detail imposed by the way of its collection. Applying model parameters based on the period from 1982 to 1992 also resulted in lower model accuracy when simulating land use for 2002. Eventually, land-use datasets for 1982 and 2002 produced the most satisfying results.
This procedure had an additional advantage for the future work with the model. As the calibration period was 20 years the future iteration runs normally should represent 20 years periods. Model testing showed that when applying the same parameter settings on a yearly basis, i.e., running twenty iterations to distribute all new cells instead of distributing the total demand in only one iteration the results varied significantly. This can basically be explained by the dynamic neighbourhood factors that change with each iteration and, therefore, strongly influence results. The results for the two 10 year periods used for validation assured the authors of the selected model parameters to be also suitable for simulating 10 year periods per iteration. Accordingly, to simulate future development perspectives for Dar es Salaam ten year iteration periods will be used forecasting informal urban residential growth for 2012 and 2022 respectively.
Another variable to be integrated following residential location theory was accessibility. As only one time slice of the road network could be integrated the decision was taken to consider the 1992 road network for the calibration period of 1982 to 200234. Based on these considerations various combinations were estimated and simulation runs executed. The integration of the 1992 road network - and the accordant accessibility figures - in combination with the parameter setting as described above lead to the best results.
After an iterative process that brought together the above described decisions the authors finally selected the following regression model with a set of variables and coefficients as can be seen from Table 8:
34 The authors assumed that using the 2002 road network would overestimate those areas where roads emerged only after 1992. Taking the 1982 network would insufficiently locate urban growth cells where new roads emerged between 1982 and 2002 and would, thus, result into too compact settlement patterns for 2002.
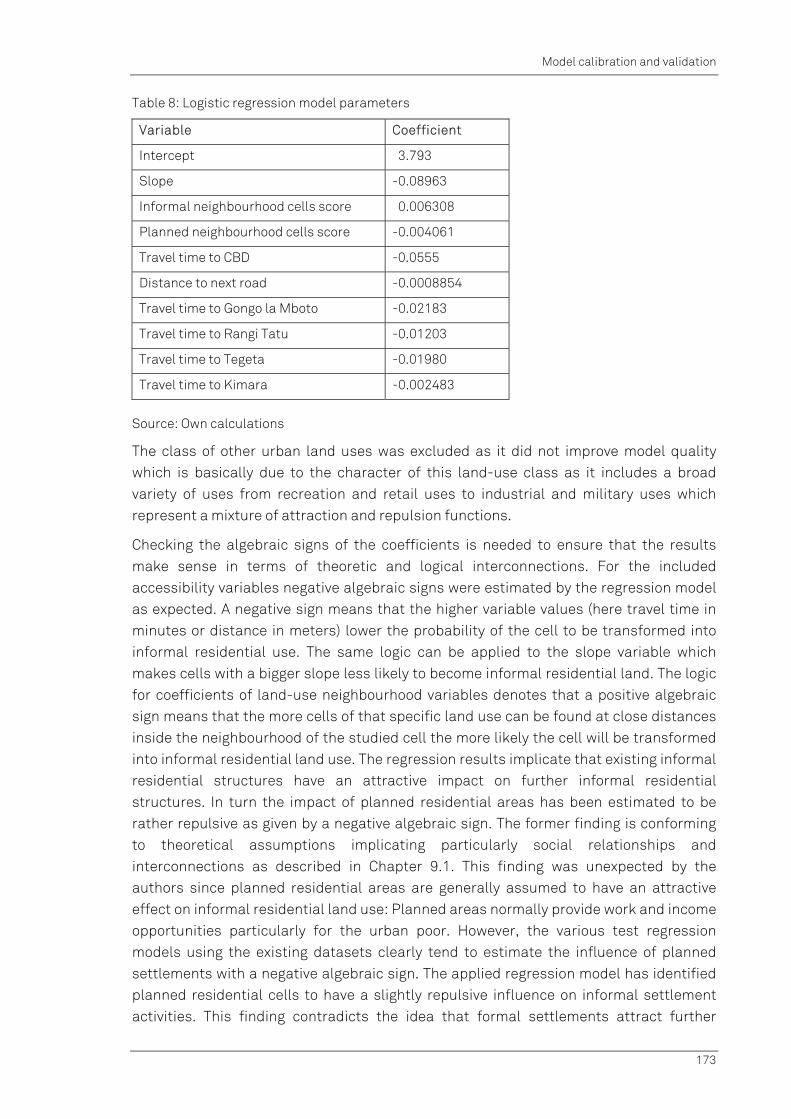
Model calibration and validation
173
Table 8: Logistic regression model parameters
Variable Coefficient
Intercept 3.793
Slope -0.08963
Informal neighbourhood cells score 0.006308
Planned neighbourhood cells score -0.004061
Travel time to CBD -0.0555
Distance to next road -0.0008854
Travel time to Gongo la Mboto -0.02183
Travel time to Rangi Tatu -0.01203
Travel time to Tegeta -0.01980
Travel time to Kimara -0.002483
Source: Own calculations
The class of other urban land uses was excluded as it did not improve model quality which is basically due to the character of this land-use class as it includes a broad variety of uses from recreation and retail uses to industrial and military uses which represent a mixture of attraction and repulsion functions.
Checking the algebraic signs of the coefficients is needed to ensure that the results make sense in terms of theoretic and logical interconnections. For the included accessibility variables negative algebraic signs were estimated by the regression model as expected. A negative sign means that the higher variable values (here travel time in minutes or distance in meters) lower the probability of the cell to be transformed into informal residential use. The same logic can be applied to the slope variable which makes cells with a bigger slope less likely to become informal residential land. The logic for coefficients of land-use neighbourhood variables denotes that a positive algebraic sign means that the more cells of that specific land use can be found at close distances inside the neighbourhood of the studied cell the more likely the cell will be transformed into informal residential land use. The regression results implicate that existing informal residential structures have an attractive impact on further informal residential structures. In turn the impact of planned residential areas has been estimated to be rather repulsive as given by a negative algebraic sign. The former finding is conforming to theoretical assumptions implicating particularly social relationships and interconnections as described in Chapter 9.1. This finding was unexpected by the authors since planned residential areas are generally assumed to have an attractive effect on informal residential land use: Planned areas normally provide work and income opportunities particularly for the urban poor. However, the various test regression models using the existing datasets clearly tend to estimate the influence of planned settlements with a negative algebraic sign. The applied regression model has identified planned residential cells to have a slightly repulsive influence on informal settlement activities. This finding contradicts the idea that formal settlements attract further
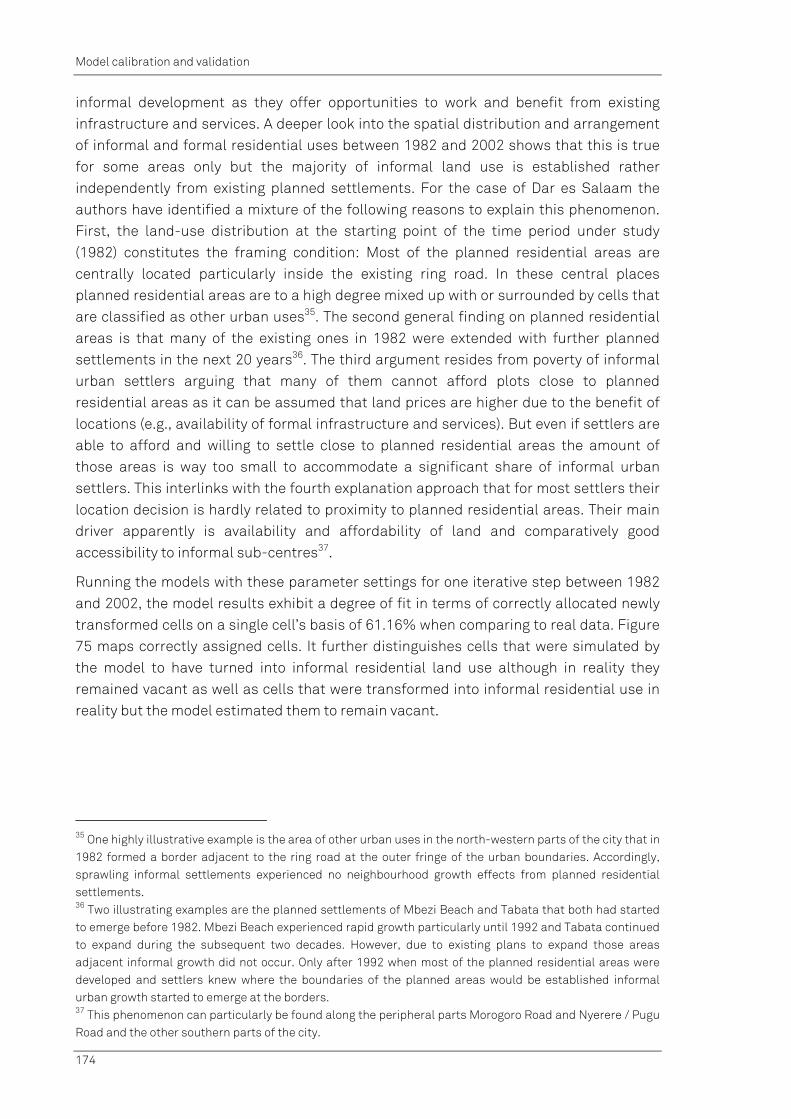
Model calibration and validation
174
informal development as they offer opportunities to work and benefit from existing infrastructure and services. A deeper look into the spatial distribution and arrangement of informal and formal residential uses between 1982 and 2002 shows that this is true for some areas only but the majority of informal land use is established rather independently from existing planned settlements. For the case of Dar es Salaam the authors have identified a mixture of the following reasons to explain this phenomenon. First, the land-use distribution at the starting point of the time period under study (1982) constitutes the framing condition: Most of the planned residential areas are centrally located particularly inside the existing ring road. In these central places planned residential areas are to a high degree mixed up with or surrounded by cells that are classified as other urban uses35. The second general finding on planned residential areas is that many of the existing ones in 1982 were extended with further planned settlements in the next 20 years36. The third argument resides from poverty of informal urban settlers arguing that many of them cannot afford plots close to planned residential areas as it can be assumed that land prices are higher due to the benefit of locations (e.g., availability of formal infrastructure and services). But even if settlers are able to afford and willing to settle close to planned residential areas the amount of those areas is way too small to accommodate a significant share of informal urban settlers. This interlinks with the fourth explanation approach that for most settlers their location decision is hardly related to proximity to planned residential areas. Their main driver apparently is availability and affordability of land and comparatively good accessibility to informal sub-centres37.
Running the models with these parameter settings for one iterative step between 1982 and 2002, the model results exhibit a degree of fit in terms of correctly allocated newly transformed cells on a single cell’s basis of 61.16% when comparing to real data. Figure 75 maps correctly assigned cells. It further distinguishes cells that were simulated by the model to have turned into informal residential land use although in reality they remained vacant as well as cells that were transformed into informal residential use in reality but the model estimated them to remain vacant.
35 One highly illustrative example is the area of other urban uses in the north-western parts of the city that in 1982 formed a border adjacent to the ring road at the outer fringe of the urban boundaries. Accordingly, sprawling informal settlements experienced no neighbourhood growth effects from planned residential settlements. 36 Two illustrating examples are the planned settlements of Mbezi Beach and Tabata that both had started to emerge before 1982. Mbezi Beach experienced rapid growth particularly until 1992 and Tabata continued to expand during the subsequent two decades. However, due to existing plans to expand those areas adjacent informal growth did not occur. Only after 1992 when most of the planned residential areas were developed and settlers knew where the boundaries of the planned areas would be established informal urban growth started to emerge at the borders. 37 This phenomenon can particularly be found along the peripheral parts Morogoro Road and Nyerere / Pugu Road and the other southern parts of the city.
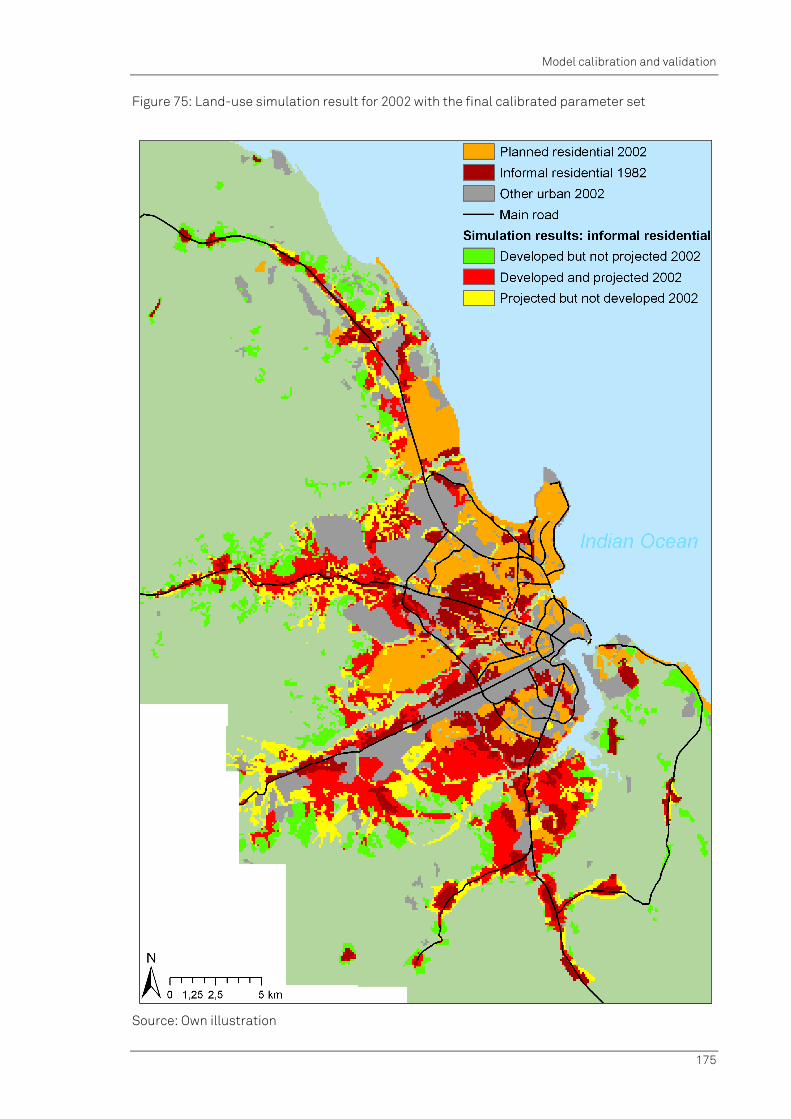
Model calibration and validation
175
Figure 75: Land-use simulation result for 2002 with the final calibrated parameter set
Source: Own illustration
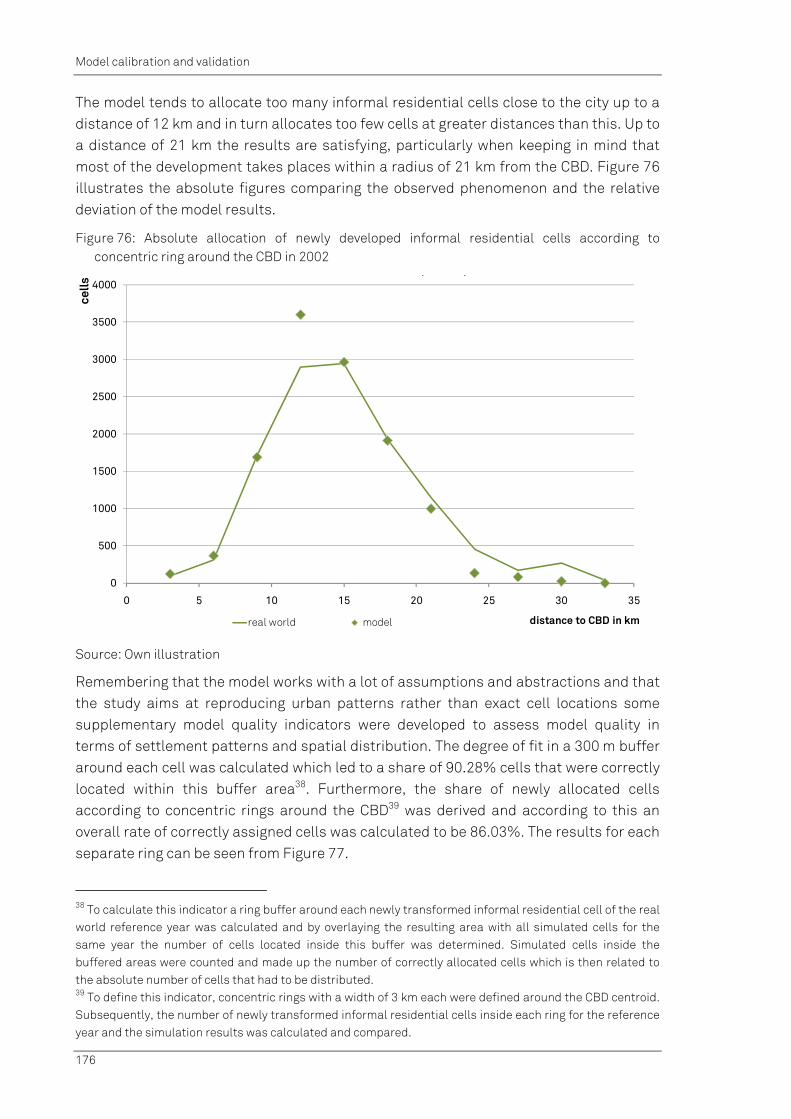
Model calibration and validation
176
The model tends to allocate too many informal residential cells close to the city up to a distance of 12 km and in turn allocates too few cells at greater distances than this. Up to a distance of 21 km the results are satisfying, particularly when keeping in mind that most of the development takes places within a radius of 21 km from the CBD. Figure 76 illustrates the absolute figures comparing the observed phenomenon and the relative deviation of the model results.
Figure 76: Absolute allocation of newly developed informal residential cells according to concentric ring around the CBD in 2002
Source: Own illustration
Remembering that the model works with a lot of assumptions and abstractions and that the study aims at reproducing urban patterns rather than exact cell locations some supplementary model quality indicators were developed to assess model quality in terms of settlement patterns and spatial distribution. The degree of fit in a 300 m buffer around each cell was calculated which led to a share of 90.28% cells that were correctly located within this buffer area38. Furthermore, the share of newly allocated cells according to concentric rings around the CBD39 was derived and according to this an overall rate of correctly assigned cells was calculated to be 86.03%. The results for each separate ring can be seen from Figure 77.
38 To calculate this indicator a ring buffer around each newly transformed informal residential cell of the real world reference year was calculated and by overlaying the resulting area with all simulated cells for the same year the number of cells located inside this buffer was determined. Simulated cells inside the buffered areas were counted and made up the number of correctly allocated cells which is then related to the absolute number of cells that had to be distributed. 39 To define this indicator, concentric rings with a width of 3 km each were defined around the CBD centroid. Subsequently, the number of newly transformed informal residential cells inside each ring for the reference year and the simulation results was calculated and compared.
0
500
1000
1500
2000
2500
3000
3500
4000
0 5 10 15 20 25 30 35
cells
distance to CBD in km
( )
real world model
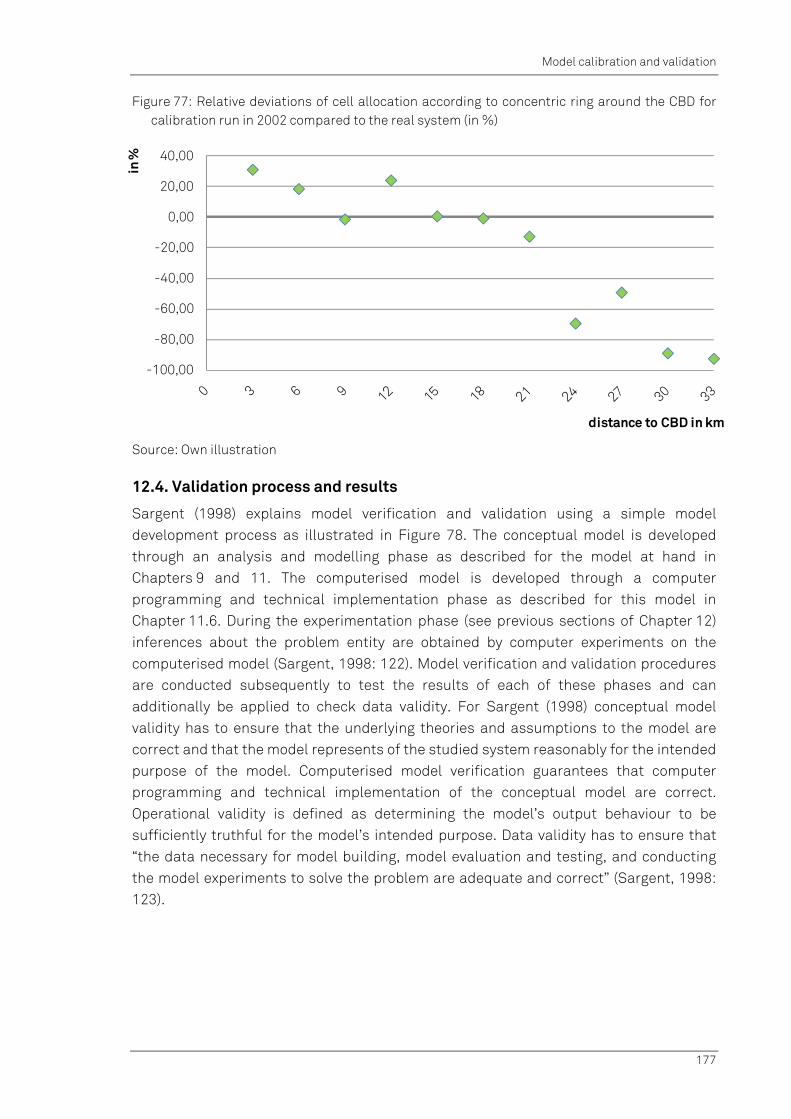
Model calibration and validation
177
Figure 77: Relative deviations of cell allocation according to concentric ring around the CBD for calibration run in 2002 compared to the real system (in %)
Source: Own illustration
12.4. Validation process and results
Sargent (1998) explains model verification and validation using a simple model development process as illustrated in Figure 78. The conceptual model is developed through an analysis and modelling phase as described for the model at hand in Chapters 9 and 11. The computerised model is developed through a computer programming and technical implementation phase as described for this model in Chapter 11.6. During the experimentation phase (see previous sections of Chapter 12) inferences about the problem entity are obtained by computer experiments on the computerised model (Sargent, 1998: 122). Model verification and validation procedures are conducted subsequently to test the results of each of these phases and can additionally be applied to check data validity. For Sargent (1998) conceptual model validity has to ensure that the underlying theories and assumptions to the model are correct and that the model represents of the studied system reasonably for the intended purpose of the model. Computerised model verification guarantees that computer programming and technical implementation of the conceptual model are correct. Operational validity is defined as determining the model’s output behaviour to be sufficiently truthful for the model’s intended purpose. Data validity has to ensure that “the data necessary for model building, model evaluation and testing, and conducting the model experiments to solve the problem are adequate and correct” (Sargent, 1998: 123).
-100,00
-80,00
-60,00
-40,00
-20,00
0,00
20,00
40,00
in %
distance to CBD in km

Model calibration and validation
178
Figure 78: Validity procedures in the simplified version of the modelling process
Source: Sargent, 1998: 123
Validity can be checked applying a variety of validation techniques (for details see Sargent, 1996; Balci & Sargent, 1984). The selection is a crucial issue as there is no general set of specific tests that can be applied to each model and “no algorithm exists to determine what techniques or procedures to use. Every new simulation project presents a new and unique challenge” (Sargent, 1998: 129).
Data validity in this study has been checked during data base compilation (see Chapter 11.2). In consequence the included data can generally be classified to be usable for the modelling purpose. Model verification ensures that the conceptual model has correctly been transferred into a computerised model. The sub-models have been checked for correctness as well as the core script of the model. Conceptual model validation has been ensured applying various techniques: The theories and assumptions underlying the model have been tested using quantitative analysis on data on the problem entity. Additionally, it has been determined whether the appropriate structure, logic, mathematical and causal relationships have been used. For this purpose ‘face validation’ was used as primary validation technique. Face validity involves people knowledgeable about the system into the process asking them whether the model and/or its behaviour are reasonable to them. This technique has been applied in this study at the early stage of the modelling process during workshops with local stakeholders and experts in Dar es Salaam. Operational validity is described to be the phase during validation “where most of the validation testing and evaluation takes place” (Sargent, 1998: 125). Sargent (1998) classifies the approaches to operational validity distinguishing between whether the system is observable or not on the one hand and whether the approach is subjective or objective (see Figure 79).

Model calibration and validation
179
Figure 79: Operational validity classification
Source: Sargent, 1998: 126
The problem entity of this study is observable and for this study subjective (e.g., visual map interpretation) and objective (statistical accuracy indicators) approaches were combined to check if the results of the operational model are valid.
Model parameters were estimated on basis of a 20 years period and asked for being checked using a different dataset. For this purpose the model parameters were applied to the simulation period of 1982 to 1992 and for 1992 to 2002 separately. For the first validation run road networks for 1992 were used, the latter run was calculated based on the 2002 road network. Figure 80 maps the results classified in comparison to the real development for the respective target year.
Visual interpretation for the earlier period indicates that during that period the amount of urban growth is underestimated in the southern parts of the city whereas areas along Morogoro Road and in the interstitial areas between Morogoro Road and Bagamoyo Road experienced more development in reality than was estimated by the model. The latter development in the simulation model often filled in existing disperse settlement structures which can basically be explained by the initial disperse patterns in combination with the neighbourhood variable of informal residential areas. The structures in the south of the city that the model could not correctly simulate are mainly larger contiguous areas. These settlements developed in a rather non-diffusive way and are hard to predict by the model’s character, particularly if they take place at a distance of more than 600 m from existing settlements which is defined as the influencing neighbourhood radius. Moreover, some of these dynamics may be strongly influenced simply by reasons of land availability40 which cannot be captured at all by the model.
40 In this context, land availability is basically determined by individual decisions of land owners to subdivide and sell their land to informal settlers.

Model calibration and validation
180
Figure 80: Validation results 1982 to 1992 (left) and 1992 to 2002 (right)
Source: Own illustration
The simulation of the later period exhibits different variations compared to the real development patterns (see Figure 80, right). During that period the northern areas experienced more development than the model forecasted. In contrast, the southern parts of the city show an ambiguous character. On the one hand there is too much development estimated at the fringes of the existing settlements and on the other hand there are again relatively large contiguous areas that newly developed in reality but could not predicted by the model. Again these areas basically develop at more remote locations regarding the existing settlement patterns or the emerging settlement areas develop very rapidly and extensively in terms of space-consumption so that the one-step iteration of the model with the 600 m neighbourhood cannot reproduce it. Despite these deviations the overall patterns produced by the model simulation are satisfying for both observation periods.
In accordance to the accuracy assessment of the model calibration results the accuracy indicators were also calculated for the two validation runs. Of course, the resulting values are not as good compared to those computed for the calibration period. Table 9 illustrates an overview of the derived indicator values.

Model calibration and validation
181
Table 9: Model accuracy indicators for calibration and validation results
Calibration run 1982 to 2002
Validation run 1982 to 1992
Validation run 1992 to 2002
Degree of fit 61.16% 45.01% 52.15%
Degree of fit 300 m buffer 90.80% 74,57% 82.19%
Degree of fit concentric ring around CBD
86.03% 64.60% 82.99%
Source: Own calculations
Figure 81 demonstrates that the calibration parameter set produces reasonable and satisfying results when being applied for the periods from 1982 to 1992 and for 1992 to 2002 also. The results show that the validation runs tend to stick to the calibration results concerning overestimating and underestimating the emergence of informal residential cells whereas at the distance between of 12 and 15 km a turning point can be observed shifting overestimated values to underestimated values41. Furthermore, it has to be stressed that this turning point marks the areas where a very high total number of informal settlements are located and much of the dynamic at the urban periphery of Dar es Salaam during the last decade could be observed (see Figure 82 and also Figure 84).
Figure 81: Relative deviation of model results according to concentric ring around the CBD for calibration run 2002, and validation runs for 1992 and 2002 in comparison to the real system (in %)
Source: Own illustration
41 Bearing in mind that the figures assess the relevance of the CBD for location decisions the relevance of the CBD seems to be slightly overestimated by the model.
-100,00
-80,00
-60,00
-40,00
-20,00
0,00
20,00
40,00
60,00
80,00
100,00
in %
distance to CBD in kmvalidation 1992 validation 2002 calibration 2002

Model calibration and validation
182
Figure 82: Absolute allocation of informal residential cells along concentric ring around the CBD of the real system and model validation runs for 1992 and 2002 and calibration run for 2002
Source: Own illustration
Figure 82 illustrates the absolute number of cells transformed per ring. It demonstrates that particularly those areas that are highly dynamic can adequately be represented except one outlier at a distance between 9 and 12 km where the calibration model estimates too many cells and the validation runs for both periods do so, too. The other rings particularly at the urban periphery between 12 and 18 km to the CBD where transformation processes are highly dynamic very much follow the real system’s development as the relative deviation rates are very low. The inner and very outer rings show higher relative deviation rates but due their relatively low absolute numbers the results are satisfying, too.
0
500
1000
1500
2000
2500
3000
3500
4000
4500
5000
cell
s
distance to CBD in kmreality 1992 validation 1992 reality 2002 validation 2002 calibration 2002

Simulating urban futures
183
13. Simulating urban futures
The following chapter will present findings from simulation runs projecting the urban future of Dar es Salaam. The role of urban scenarios in a strategic urban planning process will be adumbrated and characteristics of land-use development scenarios be described. Subsequently, the results of five simulation runs will be presented including the baseline scenario as well as scenarios simulating the impacts of infrastructure projects on the city’s land-use development.
13.1. Urban scenarios, urban planning, and the future
Scenarios are one “instrument for strategic thinking and option search” (Xiang & Clarke, 2003: 885). Xiang and Clarke’s article highlights that scenario technique can be traced back to the Manhattan Project in 1942 when nuclear physicists around Oppenheimer evaluated the possibilities of reactions of the hydrogen bomb (Davis, 1968: 129 ff). In the 1950s scenarios were used for strategic studies for military planning purposes that were reported in the 1960s by Kahn and Wiener in their book ‘The Year 2000’ where they defined scenarios as “hypothetical sequences of events constructed for the purpose of focusing attention on causal processes and decision-points'' (Kahn & Wiener, 1967: 6). In 1972 the much-debated book ‘The Limits to Growth’ published by Meadows and colleagues put global scenarios to the attention of the general public as selected scenarios for world resource consumption were presented (Meadows et al., 1972).
Since the 1960s scenarios as a means of representing potential futures have been in the land-use planner's toolkit as is evidenced by the use of land-development scenarios in many planning documents (Xiang & Clarke, 2003: 886). “At root, land-development scenarios are composed images of an area's land-use patterns that would result from particular land-use plans, policies, and regulations if they were actually adopted and implemented at a certain point of time” (Xiang & Clarke, 2003: 886). According to Xiang and Clarke (2003) there are five characteristic components to all land-use development scenarios. Alternatives are the first one as they tell about the range of potential choices of land-use plans, different policies and regulations. The second characteristic are the consequences which are the immediate or cumulative impacts (in physical, ecological, economical, and social terms) caused by each alternative on future land development. Thirdly, causations are mentioned that tie the causal linkages between alternatives and consequences. Time frames are the fourth element defining the periods between implementation and the consequences. Last but not least, geographical footprints are highlighted as “place-oriented blueprints of alternatives, and the anticipated marks of their ramifications on the geography of an area. The last component - hardly unique - is so pivotal both to the building (that is, composition) and to the utilization of land-development scenarios that it indeed becomes a hallmark that distinguishes land-development scenarios from their counterparts in business, industry, or even the military” (Xiang & Clarke, 2003: 886).
Clarke and Xiang particularly address the relationship between planning and modelling and the respective role of scenarios in decision-making processes. They declare
Simulating urban futures
184
scenario sets to be in a “unique strategic position that connects two streams of future-oriented human activities: scientific inquiry about the future, and real world planning for the future” (2003: 887). The authors would like to highlight that scenarios also support a sound decision-making. Schwartz points into the same direction saying that the inclusion of the bigger picture in a scenario makes them to be “one common element to all correct decisions” (1996: 209). Those authors further highlight two reasons why scientific scenarios are often less successful than scenarios of journalists or novelists. The first is that the latter group takes “a quite different yet arguably more balanced approach, one that concentrates on the union of the discovery and communication of insights in a way that vivifies both” (2003: 902). In contrast, the scientific scenarists focus on the scientific inquiry but lose sight of communication with non-academics, to whom scientific scenarios often seem to be “too abstract to be comprehensible, too pale to be imaginary, and too predictable to be surprising” (ibid.: 903). Xiang and Clarke argue that this is one reason why many academic scenario sets have only little impact on real-world planning and decision-making. They further declare that a second reason is founded in a larger degree of long-term commitment of journalists or novelists. This group is interested in assessing the impacts of scenarios both on the scenario users and their courses of actions (Carlson, 1977; Laszlo, 1977; Phelps et al., 2001). As an example for long-term commitment Xiang and Clarke (2003: 903) give the sequel to ‘The Limits to Growth’ entitled ‘Beyond the Limits’ which was published twenty years later in 1992, in which Meadows and colleagues assessed the global conditions to be worse than imagined in the 1972 scenarios.
Xiang and Clarke distinguish between single-themed and multi-themed scenario sets whereas the former is “typically arranged sequentially with regard to gradations of difference along a single thematic dimension” (2003: 896). In contrast, the latter type includes a scenario set where “each scenario is composed along a unique thematic dimension that emphasizes a specific pathway into the future, and each of the scenarios in the set are radically different from one another dimensionally” (ibid.). The scenarios of this study can be classified to be developed as single-themed sets along the dimension of transport infrastructure.
13.2. Baseline scenario
The most common procedure which is usually referred to as baseline scenario means extrapolating the dynamics based on past conditions and behaviour. A baseline scenario approach assumes conditions that are ceteris paribus. In other words behaviour is expected to remain unchanged except of those aspects that explicitly are assumed to change to explore their impacts. The situation found in 2002 is assumed to remain unchanged except from the point in time and the respective land-use demand figures. The baseline scenario of this study forecasts development for the years 2012 and 2022. Accordingly, the assumed number of inhabitants changes, i.e., for the model at hand the

Simulating urban futures
185
respective numbers of cells to be developed. All independent variables stay unchanged42 and the simulation results demonstrate the development to be expected without any planning or policy interventions. The baseline scenario presented below applies the logistic regression function as derived from the calibration and is based on the land-use and transport network data of 2002. The underlying assumptions of population growth have already been described above in Chapter 11.3 as being based on population figures and projections by the UN (2008c).
Baseline scenario simulation results
The simulation results can be seen in Figure 83 showing the land-use distribution for the years 2012 and 2022. The urban expansion is mapped as projected to take place until 2022 implied by adding 21,322 ha of informal residential use and selected 20,000 Plots Project sites to the urban fabric of the study area. It clearly illustrates the spatial dimension and distribution of settlement pressure that Dar es Salaam is likely to face in the near future.
Figure 83: Baseline scenario land-use distribution forecasted for 2012 (left) and 2022 (right)
Source: Own simulation
42 This is a specific characteristic of the presented model. Other models might for example integrate results from other models like for example transport models, thus, they might up-date road network and travel times. As no such model exists for Dar es Salaam, here all other independent variables stay unchanged.

Simulating urban futures
186
During the first period the southern parts of the city and the Kigamboni area in particular still show comparably low growth dynamics. Development in the southern parts until 2012 will largely be restricted to areas along Kilwa Road and the road that turn off south-west from Kilwa Road at Rangi Tatu sub-centre. In parallel, most of the development is projected to take place along the northern and western main roads resulting into broadening settlement ribbons there. The so far dispersedly developed settlements at the urban periphery along the arterial roads will experience further development with vacant cells in close neighbourhood to existing residential areas being transformed resulting in larger zones of contiguous settlement areas.
For the next decade the northern, north-western and south-western interstitial areas are projected to become hotspots of urban development. Informal settlements approach the northern project sites of the 20,000 Plots Project. Additionally, the south of the city exhibits accelerating settlement dynamics along the road network proceeding eastwards to Kigamboni.
What strikes the eye is that the results for the two periods show slightly differing patterns. The results for 2012 are characterised by a more compact urban growth at the edges realigning the boundaries of the existing urban area of 2002. In contrast, the results for 2022 are more disperse at the peri-urban fringe. This can be explained by the fact that for both simulation periods the road network of 2002 was used without any extensions. During the first simulation period the neighbourhood variables and the existing disperse settlement patterns lead to infill effects along the pre-existing urban borders. The next period’s starting situation is, thus, characterised by less disperse settlement boundaries which results in newly emerging patterns of informal urban expansion mainly alongside road infrastructure. To a considerable degree the formation of these structures is assumed to be emphasised by the fact that in the areas that experience urban dynamics between 2012 and 2022 the road network remains unchanged. As the model only forecasts informal residential growth transport infrastructure is not updated for the simulation period. Beyond the urban fringes of the existing reference land-use dataset (2002) the road network exhibits rather low densities without an evenly distributed network of smaller roads that would encourage development to emerge in a more symmetrically wave-like diffusive manner. Therefore, the urban boundaries form tentacle-like ribbons following the roads.
Analysing the spatial distribution of baseline scenario results illustrates that each decade the peak of informal urban dynamics has shifted further outwards from the CBD in terms of Euclidean distance (see Figure 84). In the 1980s the most dynamic ring was the one between 6 and 9 km, the 1990s were characterised by rapid growth primarily at distances between 9 and 12 km. The simulation results revealed that most likely future development will take place in a distance between 12 and 15 km during the time period of 2002 to 2012 whereas during the last period of simulation between 2012 and 2022 the peak of urban dynamics will shift further towards the periphery to the ring between 15 and 18 km from the CBD.
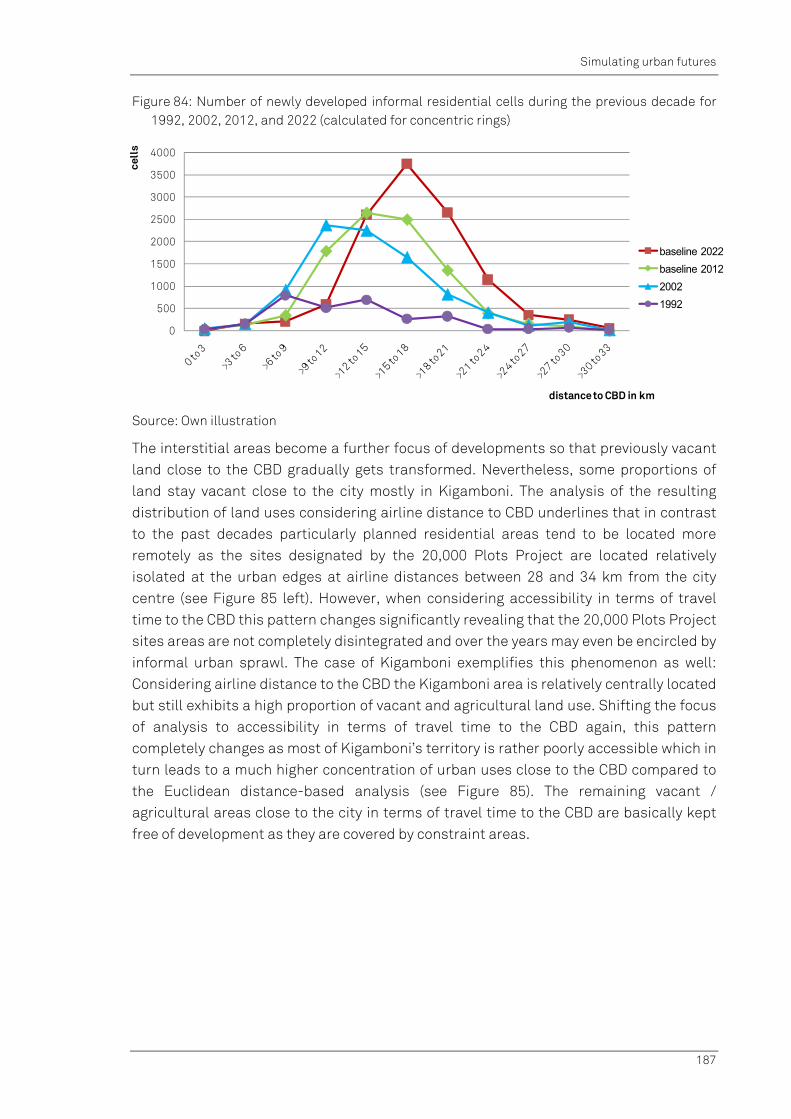
Simulating urban futures
187
Figure 84: Number of newly developed informal residential cells during the previous decade for 1992, 2002, 2012, and 2022 (calculated for concentric rings)
Source: Own illustration
The interstitial areas become a further focus of developments so that previously vacant land close to the CBD gradually gets transformed. Nevertheless, some proportions of land stay vacant close to the city mostly in Kigamboni. The analysis of the resulting distribution of land uses considering airline distance to CBD underlines that in contrast to the past decades particularly planned residential areas tend to be located more remotely as the sites designated by the 20,000 Plots Project are located relatively isolated at the urban edges at airline distances between 28 and 34 km from the city centre (see Figure 85 left). However, when considering accessibility in terms of travel time to the CBD this pattern changes significantly revealing that the 20,000 Plots Project sites areas are not completely disintegrated and over the years may even be encircled by informal urban sprawl. The case of Kigamboni exemplifies this phenomenon as well: Considering airline distance to the CBD the Kigamboni area is relatively centrally located but still exhibits a high proportion of vacant and agricultural land use. Shifting the focus of analysis to accessibility in terms of travel time to the CBD again, this pattern completely changes as most of Kigamboni’s territory is rather poorly accessible which in turn leads to a much higher concentration of urban uses close to the CBD compared to the Euclidean distance-based analysis (see Figure 85). The remaining vacant / agricultural areas close to the city in terms of travel time to the CBD are basically kept free of development as they are covered by constraint areas.
0
500
1000
1500
2000
2500
3000
3500
4000
cell
s
distance to CBD in km
baseline 2022
baseline 2012
2002
1992

Simulating urban futures
188
Figure 85: Land-use distributions in baseline scenario 2012 (above) and 2022 (below) concerning concentric rings around the CBD (left) and travel time isochrones (right)
Source: Own illustration
Travel time is a suitable indicator to demonstrate concentration patterns. In contrast to airline distance where large shares of the central rings remain vacant the more central travel time isochrones are broadly transformed to urban uses. The respective figures for 1982, 1992 and 2002 (see Figure 53) have illustrated this trend which has even gained distinctiveness for 2012 and 2022 (see Figure 85). Due to the fact that urban uses strongly tend to concentrate considering travel times vacant land gets limited at isochrones of low travel time. The baseline scenario results show that land availability limitations which were restricted in 2002 from the CBD until the isochrone of 15 to 18 minutes is projected to enlarge up to the isochrone of 27 to 30 minutes in 2012 and further to the 36 to 39 minutes isochrone in 202243.
In general, the results demonstrate that indicators for accessibility to the CBD are useful measures to analyse urban development trends. Airline distance to the CBD was used to illustrate how peaks of informal growth dynamics shift to further distances from the CBD with every decade (see Figure 84). Travel time to the CBD was applied to track the enlargement of the contiguously developed urban fabric of Dar es Salaam (see Figure 85).
43 A breakpoint in the values of land availability can be observed. This is indicated by a proportion of vacant land of about 10%.
0%
10%
20%
30%
40%
50%
60%
70%
80%
90%
100%
1 6 11 16 21 26 31 36
land
-use
pro
port
ions
distance to CBD in km
0%
10%
20%
30%
40%
50%
60%
70%
80%
90%
100%
3 18 33 48 63 78 93travel time to CBD in min
0%
10%
20%
30%
40%
50%
60%
70%
80%
90%
100%
1 6 11 16 21 26 31 36
land
-use
pro
port
ions
distance to CBD in km
0%
10%
20%
30%
40%
50%
60%
70%
80%
90%
100%
3 18 33 48 63 78 93travel time to CBD in min
unbuilt / agriculture informal settlements planned residential other urban

Simulating urban futures
189
Assessing baseline scenario results
Mapping the urban expansion has strikingly highlighted the enormous extent of potential urban sprawl caused by projected population growth until 2022. The simulation results of the baseline scenario have demonstrated the need for active intervention into informal urban development as concerns the supply with basic services and infrastructures. In the preceding chapters the authors have elaborated on their understanding that public planning authorities have a responsibility to provide access to formal services and public infrastructures for the urban poor at early stages of settlement development.
The baseline simulation results represent urban development without the influence of any strategic planning measures. Thus, for the development of more strategic comprehensive urban planning documents the presented results may serve as a starting point to identify growth hotspots. Additionally, necessary planning interventions can be identified where strategic aims and model projections differ.
Finally, considering the overall patterns of the simulation results it has to be stressed that the delineation of the study area as described in Chapter 9.2 imposes a constraint to the reasonable time horizon of the model. When reaching the limits of the study area, in reality considerable development might take place beyond these edges. For example development along Morogoro Road reaches the limits in 2012 and the same applies to Kilwa and Pugu / Nyerere Road from 2022 on. Moreover, some large sites of the 20,000 Plots Project are located outside the study area. For the model this imposes a restriction for further growth resulting in a shift of dynamics to other locations inside the study area. This constraint underlines the authors’ decision to define the year 2022 to be the time frame of this study for model simulation and not to extend it further into the future.
13.3. Transport infrastructure scenarios
Urban models are also used to simulate land-use developments under changed framing conditions. However, the capability to do so is restricted to those conditions that are considered by the model structure. For the model at hand changes in the following framing conditions could be integrated to simulate their likely impacts:
infrastructure and accessibility: changes can be modelled in terms of road infrastructure projects that become relevant as newly build in the road network dataset or as changes in average travel speeds applied to calculate travel times. The latter can also be used to represent the introduction of new modes of transport, such as the establishment of a bus rapid transit system (BRT) along-side an existing road improving the overall average travel speed on that road44;
land use: actual changes in land use or land-use constraints represent restrictions or changed framing conditions of urban growth.
44 This has to be considered as a proxy since public transport is not directly incorporated into the model and, thus, has to be accounted for by changes in average travel speed in the common road network.

Simulating urban futures
190
From the planning perspective the overall goal considering the issue of rapid urban growth is to influence future informal location decisions. Thus, the question arises where suitable access points exist for local planning authorities to guide those location decisions towards a more desirable urban development. Due to the fact that the authorities’ capacities to act is limited not only in terms of their financial resources but particularly in terms of implementing formal plans, the authors give special attention to the aspect of practicability of the proposed policies. History has shown that planning regulations and zoning are barely implemented in Dar es Salaam. The only considerable project recently planned and implemented is the 20,000 Plots Project (see Chapter 8.2). Its sites for planned residential uses will be considered for all scenarios.
Research has demonstrated that one way to arrange favourable conditions for informal urban settlers and, thus, to guide future urban growth is the provision of trunk infrastructure (Hill et al., 2010). Building roads improves spatial accessibility which is one main driver of informal residential settlement activities. Transport infrastructure scenarios seem to be an adequate approach to demonstrate alternative development opportunities because, on the one hand, road infrastructure is one driver for individual residential location decisions and, on the other hand, public authorities are responsible for the provision of road infrastructure. Thus, the scenarios presented in the subsequent chapters will be developed along a single-themed set and focus on infrastructure projects.
Four alternative development scenarios will be included in this study. These scenarios assume the following changes in transport infrastructure supply: i) establishment of a bus rapid transit (BRT) system, ii) construction of a new ring road, iii) Kigamboni Bridge construction and iv) the joint implementation of all three infrastructure projects. All these measures are part of the current Dar es Salaam Transport Policy and System Development Masterplan worked out by a team of private consulting companies called Pacific Consultants International (PCI) and Construction Project Consultants (CPC) under the sponsorship of the Japan International Cooperation Agency (JICA). The masterplan aims at formulating short-term actions to alleviate current traffic problems and a long-term perspective for urban transport policy and development in the Dar es Salaam metropolitan area until 2030. Most of the following specifications concerning infrastructure projects are based on the draft final report for this plan (DCC, 2008). The report encompasses various chapters including inter alia the long-term vision for Dar es Salaam and the assumed framework in terms of demographic, economic and spatial development assumptions. It provides plans for the development of the road transport sector, the public transport sector and for managing CBD traffic. Additionally, it proposes institutional and financial arrangements to implement the plan as well as plan monitoring and evaluation components (DCC, 2008).
The three separate infrastructure projects to be considered in the forthcoming scenarios have been selected by the authors because they form basic elements of the planned infrastructure development for Dar es Salaam. Their implementation can be assumed to take place in the near future. Moreover, they are among the biggest projects recently discussed in Dar es Salaam but so far their likely impacts for future urban development

Simulating urban futures
191
are largely unknown. This makes them attractive to demonstrate their effects on informal residential growth and to highlight the need for further jointly organised actions of planning authorities and service providers.
13.3.1. Scenario I: Bus rapid transit implementation
The first transport infrastructure scenario assumes the establishment of a BRT system called DART (Dar es Salaam Rapid Transit). DART is one of the major infrastructure projects currently planned by the local planning authorities at the DCC. The idea of implementing a BRT in Dar es Salaam came up when UNEP showed interest to develop a pilot BRT project in Africa (URT, 2007: 5). In 2003 the establishment of the BRT project was declared by the city council to be one of three development priorities and in 2004 World Bank support was secured for planning and engineering the first BRT corridor and, subsequently, the project was formally launched (URT, 2007: 5). Financial funding by the World Bank has been granted and the start of construction is scheduled for 2010.
Excursus: Bus Rapid Transit
BRT is a term used to describe a variety of public transportation systems that rely on buses to provide a high speed transport service significantly faster than an ordinary bus line. Basically, this is achieved by improvements of infrastructure, vehicles and scheduling. BRT systems aim at approaching the service quality of rail transit while still taking advantage of the cost savings of bus transit. A number of BRT systems have emerged in recent years both in developed and developing countries driven by interest in and mandates for managing urban sprawl, reducing traffic congestion, automobile pollution, and automobile dependency, and a desire to better protect the natural environment (Pucher, 2001). The major elements of a BRT are: - dedicated bus ways, - stations, - vehicles, - fare collection, - intelligent transportation systems (ITS), - service and operating plans, and - branding elements (Federal Transit Administration, 2009).
Well-known examples for successfully implemented BRT systems come from Curitiba, Brazil or Bogota, Colombia. Recently, Lagos, the capital of Nigeria, introduced Africa’s first bus rapid transit which became operational in March 2008. After only one year of operation the system had carried a total of 56.2 million passengers and by far exceeded the number that had been forecasted (Blosse, 2009: 41). BRT systems can have different forms, from dedicated bus ways that have their own rights-of-way to limited bus stops on pre-existing routes. The former will be the case in Dar es Salaam where the whole system including vehicles, lanes, bus stop stations, etc. will have to be newly established.

Simulating urban futures
192
As the technical and organisational issues are not the focus of this work, only the specifications needed for the model simulation will be illustrated in the following. This encompasses the routing of the BRT lines and the assumed changes in travel speeds on these routes. As the BRT will use existing roads which will be widened no additional roads have to be added to the existing road network.
The proposed system will be implemented step-wise during five phases in total. Phase I will include about 21 km of bus routes, 29 bus stations, 6 feeder stations, 5 terminals and 2 bus depots (URT, 2007: 1 f, 88 f). Phase II encompasses about 16 km of DART routes and additional 19 km will be established with Phase III of the DART project. During Phase IV further 16 km of routes will be added. The final phase will add 8.4 km to the DART network. The location of the routes45 can be seen in Figure 86.
Up to date, Phases I to IV of the DART system are assumed to be implemented gradually and the services for those phases are scheduled to be brought into operation until 2015 (DCC, 2008). Latest plans for DART implementation also include Phase V to be implemented until 2015. However, the authors assume that due to common delays as well in the planning process as during construction it is very likely that Phase V will not be implemented before 2022. The potential effects of building a bridge across the creek (which is part of the plans for Phase V) will not be neglected in this study but be included as a separate scenario adding a bridge section to the road network without DART services (see Scenario IIII Chapter 13.3.3). For the sake of modelling, the project Phases I to IV are assumed to be operational from 2012 on instead of 2015.
45 Phase I will cover a stretch of 10 km starting at Kivukoni Terminal near the Kigamboni Ferry Terminal following the Kivukoni Front and leading further into Morogoro Road. The DART route follows Morogoro Road until Ubungo. At Ubungo another DART terminal will be erected close to the existing Ubungo Bus Terminal at the intersection with Nelson Mandela / Sam Nujoma Road. The route continues along Morogoro Road ending at Kimara Mwisho again picking up the location of an already existing bus terminal. Two additional DART routes branches will be established during Phase I. The Kawawa Road branch will be running northwards along Kawawa Road from Magomeni up to Morocco where a terminal will be erected at the junction with Ali Hassan Mwinyi Road. The Msimbazi Street branch will follow Msimbazi Street southbound to Kariakoo and will have a terminal at Kariakoo near the TRC railway line opposite the current Scandinavian Bus Terminal (URT, 2007: 1). In Phase II a DART route will be established along Pugu / Nyerere Road connecting Kariakoo with Gongo La Mboto, an informal sub-centre close to the airport. Phase III bus routing follows Kilwa Road to the south and connects Kilwa Road via the existing outer city ring road (Nelson Mandela Road) northbound to Pugu / Nyerere Road and further north to Morogoro Road at the crossing with Kawawa Road (DCC, 2008). Before reaching Morogoro Road the routing leaves the existing city ring road and switches to a newly widened road for the last quarter of the route. Phase IV provides Bagamoyo Road - as the last of the four main arterial roads in Dar es Salaam - with DART infrastructure. It hooks up at the northern end of the Kawawa Road route of Phase I and follows Bagamoyo Road north until the crossing with Old Bagamoyo Road. Additionally, it connects Bagamoyo Road with Morogoro Road via Sam Nujoma Road, the northern part of the existing outer city ring road.
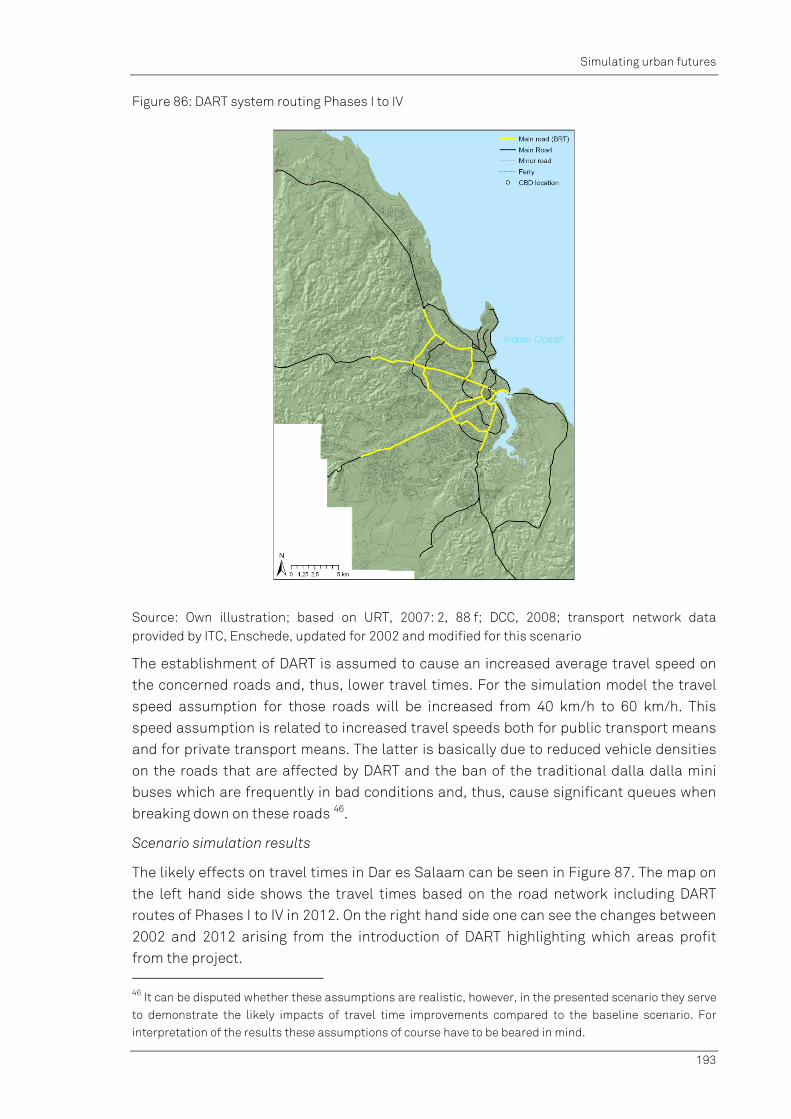
Simulating urban futures
193
Figure 86: DART system routing Phases I to IV
Source: Own illustration; based on URT, 2007: 2, 88 f; DCC, 2008; transport network data provided by ITC, Enschede, updated for 2002 and modified for this scenario
The establishment of DART is assumed to cause an increased average travel speed on the concerned roads and, thus, lower travel times. For the simulation model the travel speed assumption for those roads will be increased from 40 km/h to 60 km/h. This speed assumption is related to increased travel speeds both for public transport means and for private transport means. The latter is basically due to reduced vehicle densities on the roads that are affected by DART and the ban of the traditional dalla dalla mini buses which are frequently in bad conditions and, thus, cause significant queues when breaking down on these roads 46.
Scenario simulation results
The likely effects on travel times in Dar es Salaam can be seen in Figure 87. The map on the left hand side shows the travel times based on the road network including DART routes of Phases I to IV in 2012. On the right hand side one can see the changes between 2002 and 2012 arising from the introduction of DART highlighting which areas profit from the project. 46 It can be disputed whether these assumptions are realistic, however, in the presented scenario they serve to demonstrate the likely impacts of travel time improvements compared to the baseline scenario. For interpretation of the results these assumptions of course have to be beared in mind.
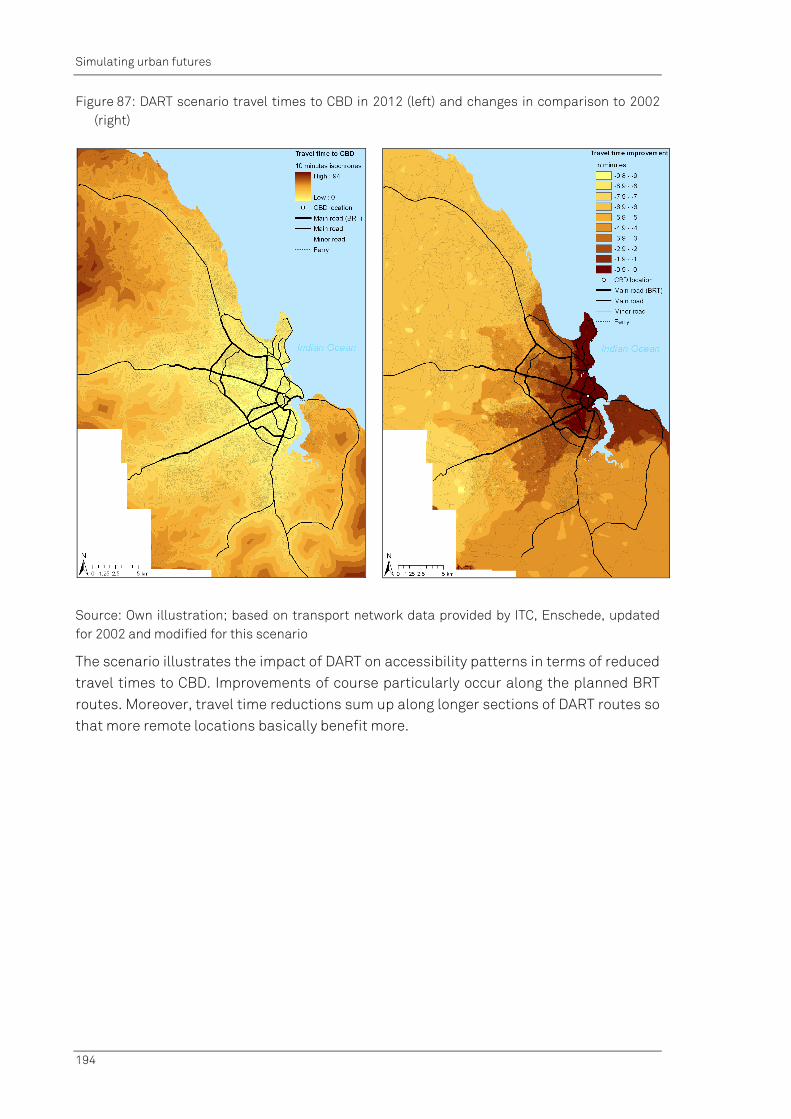
Simulating urban futures
194
Figure 87: DART scenario travel times to CBD in 2012 (left) and changes in comparison to 2002 (right)
Source: Own illustration; based on transport network data provided by ITC, Enschede, updated for 2002 and modified for this scenario
The scenario illustrates the impact of DART on accessibility patterns in terms of reduced travel times to CBD. Improvements of course particularly occur along the planned BRT routes. Moreover, travel time reductions sum up along longer sections of DART routes so that more remote locations basically benefit more.

Simulating urban futures
195
Figure 88: DART scenario simulation results for 2022 (left) and changes in land-use development 2022 in comparison to the baseline scenario (right)
Source: Own simulation
The small shifts in informal residential development observable in Figure 88 can be explained by small combined travel time improvements of all considered travel time variables benefitting those areas which are consequently projected to be transformed for this scenario in contrast to the baseline scenario. The change map demonstrates that the spatial variation to the baseline scenario differs only slightly as just 299 cells are allocated elsewhere which makes up less than 1.4% of all newly developed cells during that time period. Keeping in mind that accessibility changes only from 2012 on, the number makes up for 2.5% of the cells to be allocated during the second decade of simulation. These cells basically shift from the southern parts of the city (Kigamboni and the settlements south-west of the informal sub-centre of Rangi Tatu) to the northern parts along Bagamoyo Road, north of Morogoro Road, and to the areas between the two roads.
The analysis of cell distribution along concentric rings (see Figure 89) reveals that DART causes reduced urban dynamics up to an airline distance of 21 km for the benefit of dynamics at more distant location. In comparison to the other scenarios the DART scenario only causes slight changes in the spatial distribution of informal residential growth.

Simulating urban futures
196
Figure 89: Number of informal residential cells developed in 2022 at different locations for the DART scenario in comparison to the baseline scenario (DART minus baseline; according to concentric rings around the CBD)
Source: Own illustration
Assessing scenario results
Since DART routes basically supply areas already developed impacts on informal urban development simulated by the model are rather marginal. This relates mainly to the limited capabilities of the model which only simulates transformations from vacant to residential land use but is not able to simulate consolidation and densification processes of any kind. However, exactly these processes must be expected to happen along the upgraded roads and adjacent areas experiencing immediate upgrades in accessibility. This development may also impact in turn on demand for residential building land by reducing land consumption elsewhere or at least relocating densification processes. It must, however, be clearly stated, that these developments are outside the model’s domain.
Although the impacts of the DART scenario are rather marginal considering the results produced by the simulation model from a planning perspective it can be stated that the DART system will further impact on urban development from of boosting consolidation and (vertical) densification and, thus, contribute to a more compact urban development while at the same time limiting land consumption elsewhere. Moreover, ecological impacts can be expected by increased attractiveness and capabilities of public transport concerning the attenuation of road traffic volumes and congestions. The enhanced reliability of public transport will be another benefit and help to improve modal split. The model results exhibit some degree of shortcoming considering the immediate outputs of this scenario but can still be assessed to be valid keeping in mind its limitations.
-150
-100
-50
0
50
100
150
200
250
cell
s
distance to CBD in kmdelta DART scenario
Simulating urban futures
197
13.3.2. Scenario II: Ring road construction
The idea to include the ring road scenario was initially developed during an expert workshop in Dar es Salaam. A draft version of the simulation model was presented to demonstrate its basic mechanisms, features, objectives, and opportunities for application in spatial planning. The attendant planning authority representatives pointed out that this infrastructure option had been broadly discussed, recently, and some alternative ideas about the exact routing of this road had been sketched. The ring road is also included in the Dar es Salaam Transport Masterplan (DCC, 2008). So far there has been no approval of plans by the government and no decisions have been made on financing.
As described in Chapter 9.3.2, the backbones of the transport infrastructure in Dar es Salaam are the radial major roads departing from the city centre. Additionally, the city centre is cross-connected by an inner and an outer city ring road but to date there is no comparable connection at greater distance from the CBD or even at the periphery of the city. This structure induces a lot of additional traffic on the existing ring roads as well as on the arterials: to reach areas adjacent to another arterial one has to go inwards towards the CBD before moving outwards again on another arterial because there is no direct transversal connecting two peripheral parts of the city. By-passing on minor roads is barely attractive since these roads are mostly unsealed and in bad conditions rendering travelling significantly slower and less comfortable.
To remedy this situation a more peripheral ring road is planned which shall prevent the CBD from being a bottleneck for through traffic and allow for faster travel times at least for intra-periphery trips. The scenario assumes all conditions being ceteris paribus concerning the baseline scenario but adds an additional ring road to the network. The projected ring road is classified for the model to be a major road. Thus, the assumed travel speed for the ring road corresponds to the average travel speed on all other major roads which is 40 km/h. The ring road connects the coast of Kigamboni to Bagamoyo Road east of the informal sub-centre Kimara. It crosses Kilwa Road north of Rangi Tatu and also connects to Pugu / Nyerere Road. This routing has been adopted from the maps published in the transportation masterplan. The proposed routing can be seen from Figure 90.

Simulating urban futures
198
Figure 90: Routing of the proposed ring road
Source: Own illustration; based on road network data provided by ITC, Enschede, updated for 2002 and modified for this scenario
It is assumed that the ring road is operational in 2012. Again, the simulation will be conducted until 2022. The construction of the peripheral ring roads leads to changes in accessibility patters as can be seen in Figure 91. The map on the left side shows the travel times based on a road network including the new ring road in 2012. On the right side one can see the changes in travel times between 2002 and 2012 arising from the inclusion of the ring road highlighting which areas profit from the infrastructure project in terms of decreased travel times to the CBD.

Simulating urban futures
199
Figure 91: Ring road scenario travel times in 2012 (left) and changes compared to 2002 (right)
Source: Own illustration; based on road network data provided by ITC, Enschede, updated for 2002 and modified for this scenario
Scenario simulation results
The most significant absolute improvements in travel times resulting from the implementation of the ring road scenario benefit the south-western parts of Kigamboni. Here, travel times are decreased by almost half an hour. This considerable decrease in travel time results directly from the establishment of a shorter, totally new main road connection and the associated increases in travel speeds. In addition slight improvements can be observed in those areas where the new ring road passes interstitial areas between the arterial roads. Particularly those areas benefit where not only upgrades in terms of travel speed improvements on existing roads have been realised but completely new segments have been built.

Simulating urban futures
200
Figure 92: Ring road scenario results for 2022 (left) and changes to the baseline scenario (right)
Source: Own simulation
The simulation model results for 2022 can be seen in Figure 92 on the left side. Moreover, the right side figure illustrates the differences between the baseline simulation run and the ring road simulation run in 2022. In comparison to the baseline scenario a total of 602 cells are allocated differently in 2022. They account for about 2.8% of all informal residential cells that had to be allocated. Keeping in mind that accessibility changes only from 2012 on, the number makes up for 5.1% of the cells to be allocated during the second decade of simulation. This scenario exhibits the general trend to allocate informal residential cells closer to the CBD particularly in Kigamboni area and in interstitial areas close to the projected ring road where previously road connectivity was poor. Furthermore, it results in a general trend to rather allocate cells more to the south which can be explained by the fact that the ring road does not connect to the northern arterial road.
A surprisingly high proportion of the shifted cells move to Kigamboni area as the new peripheral ring road significantly increases accessibility to CBD in terms of travel times (see Figure 91). It also improves accessibility of the three more southerly located informal sub-centres. Accordingly, the areas west and south-west of informal sub-centre Rangi Tatu grow. The interstitial areas between Bagamoyo Road and Morogoro Road experience some shifting losses as well as the edges of the urban ribbons along

Simulating urban futures
201
Bagamoyo Road. Some benefits are also projected for the settlements north of Pugu / Nyerere Road.
Statistical analysis considering concentric distance classes from the CBD (Figure 93) reveal that the ring road scenario causes additional growth up to a distance of 15 km, whereas more remote locations lose some development pace. The largest deviation to the baseline scenario is projected for the concentric ring between 6 and 9 km where the ring road scenario allocates a plus of 358 cells. At 15 km a turning point can be observed from where on this scenario allocates fewer cells than the baseline scenario with a decreasing delta with increasing distance to the CBD.
Figure 93: Number of informal residential cells developed in 2022 at different locations for the ring road scenario in comparison to the baseline scenario (ring road minus baseline; according to concentric rings around the CBD)
Source: Own illustration
Assessing scenario results
In terms of spatial planning the scenario can be rated to be a desirable project as it relieves the areas around the CBD and adjacent the existing ring roads from the considerable amount of transit traffic currently forced to pass these areas when needing to travel from one edge of the city to another. Moreover, also the distances to be covered for those trips are decreased which is not dispensable considering environmental issues. However, the authors cannot fully understand the proposed routing of the ring road as it misses a direct connection between Morogoro and Bagamoyo Road which would undoubtedly constitute a reasonable enhancement to the routing presented in the recent transportation master plan.
Another consequence of the proposed ring road concerning an integrated urban development perspective is the issue of preserving open spaces which should ideally be developed as a network. Without the ring road at least so far the interstitial areas were kept free from development due to relatively low accessibility.
-300-200-100
0100200300400
cell
s
distance to CBD in kmdelta ring road scenario
Simulating urban futures
202
13.3.3. Scenario III: Kigamboni Bridge crossing Mzinga Creek
The Mzinga Creek south of the city centre is a barrier to urban development for the area of Kigamboni south of the creek. To access Kigamboni one either has to take a considerable detour or use the slow-speed and limited capacity ferry service to cross the creek.
The idea to build a bridge across the Mzinga Creek to connect with the city centre of Dar es Salaam goes back to 1970s when under the financial support of the African Development Bank studies were conducted and plans were developed how to construct this bridge (website Knowledge Matters – Tanzania). To date, project implementation is envisaged to be financed through resources managed by the National Pension Fund. However, the bridge has never been built until today although the idea was repeatedly discussed during the last decades.
For the simulation model, new roads have to be added to the network and assumed travel speeds have to be assigned. As the bridge does not substitute the ferry connected and is located more to the south than the ferry harbour (see Figure 94) a new road section had to be included. Kigamboni Bridge is planned to cross the creek close to the Tanzania National Stadium. As illustrated in the transportation masterplan, the bridge will extend the existing outer city ring road (Nelson Mandela Road and Sam Nujoma Road) eastwards. The new road stretch to Kigamboni Bridge will divert from Nelson Mandela Road when the latter turns northwards after having passed the stadium in direction towards the creek. This southern location allows the general harbour activities to be continued without being influenced by the bridge. At the same time it allows to construct a comparably smaller bridge since clearance for bigger boats is not an issue here.

Simulating urban futures
203
Figure 94: Routing of Kigamboni Bridge
Source: Own illustration; based on transport network data provided by ITC, Enschede, updated for 2002 and modified for this scenario
Scenario simulation results
With the introduction of the Kigamboni Bridge the whole link is assumed to be classified as a major road, thus, allowing a travel speed of 40 km/h. The establishment of the bridge is assumed for 2012. The bridge scenario would lead to accessibility patterns as shown in Figure 95. The left side figure maps the resulting travel times to the CBD for 2012 assuming the introduction of the Kigamboni Bridge. The right side of the figure illustrates the changes in accessibility between 2002 and 2012 caused only the introduction of the bridge.
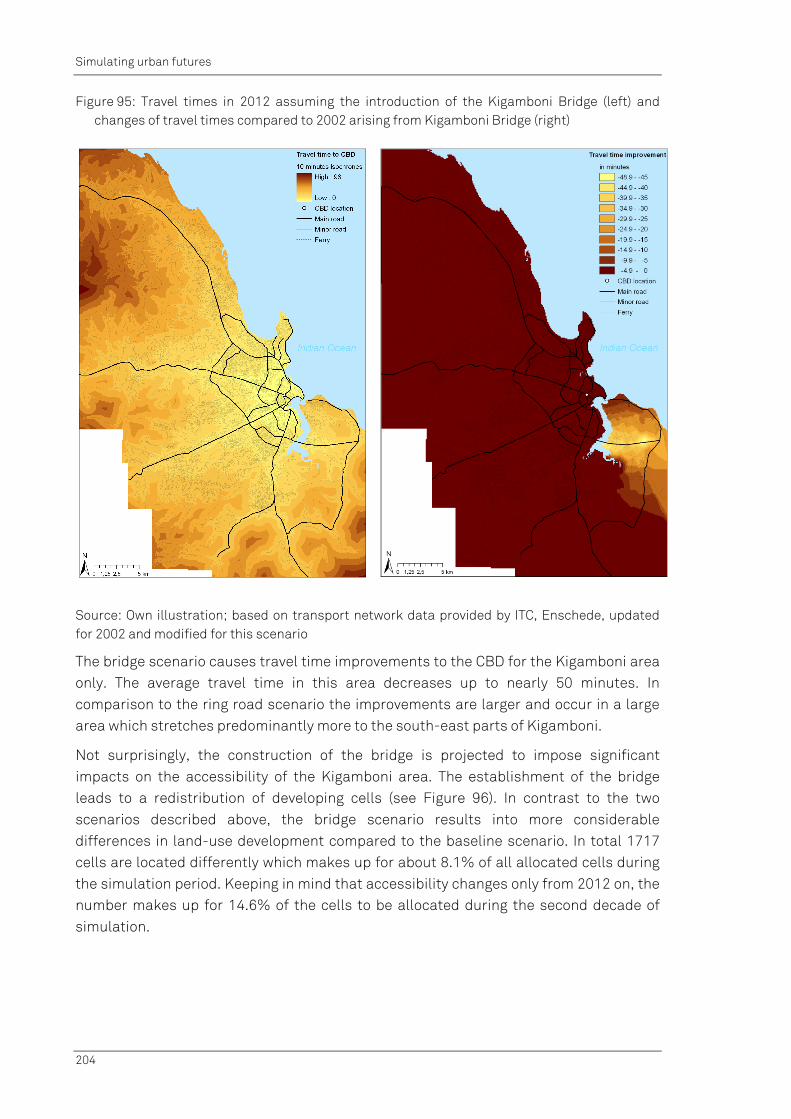
Simulating urban futures
204
Figure 95: Travel times in 2012 assuming the introduction of the Kigamboni Bridge (left) and changes of travel times compared to 2002 arising from Kigamboni Bridge (right)
Source: Own illustration; based on transport network data provided by ITC, Enschede, updated for 2002 and modified for this scenario
The bridge scenario causes travel time improvements to the CBD for the Kigamboni area only. The average travel time in this area decreases up to nearly 50 minutes. In comparison to the ring road scenario the improvements are larger and occur in a large area which stretches predominantly more to the south-east parts of Kigamboni.
Not surprisingly, the construction of the bridge is projected to impose significant impacts on the accessibility of the Kigamboni area. The establishment of the bridge leads to a redistribution of developing cells (see Figure 96). In contrast to the two scenarios described above, the bridge scenario results into more considerable differences in land-use development compared to the baseline scenario. In total 1717 cells are located differently which makes up for about 8.1% of all allocated cells during the simulation period. Keeping in mind that accessibility changes only from 2012 on, the number makes up for 14.6% of the cells to be allocated during the second decade of simulation.

Simulating urban futures
205
Figure 96: Bridge scenario results for 2022 (left) and differences in land-use development for 2022 in comparison to the baseline scenario
Source: Own illustration; based on transport network data provided by ITC, Enschede, updated for 2002 and modified for this scenario
The bridge scenario projects that Kigamboni attracts nearly all shifting cells. Accordingly, the Kigamboni area shows a clear tendency to develop more dynamically than in the baseline scenario. The locations where the shifted cells were originally developed in the baseline scenario are in contrast distributed quite dispersedly along the urban fringes of the baseline scenario results.
The introduction of the bridge can be considered to significantly affect the overall development of the city. Measuring informal residential land-use changes regarding concentric rings around the CBD (see Figure 97) the emerging patterns reveal that in comparison to the baseline scenario the outcome of the Kigamboni Bridge scenario exhibits a clear tendency to allocate more cells closer to the city centre. In comparison to the baseline scenario, increased growth can be observed at rings with distances of up to 12 km whereas the peak of shift can be found at the ring from 6 to 9 km with 832 more cells being developed. At a distance of 12 km the bridge scenario commences to develop fewer cells than the baseline scenario. The respective peak can be found at the distance between 15 and 18 km where 720 fewer cell are developed than in the baseline scenario. The overall distribution pattern shows a tendency to concentrate development at more centrally located cells in terms of airline distance to the CBD.
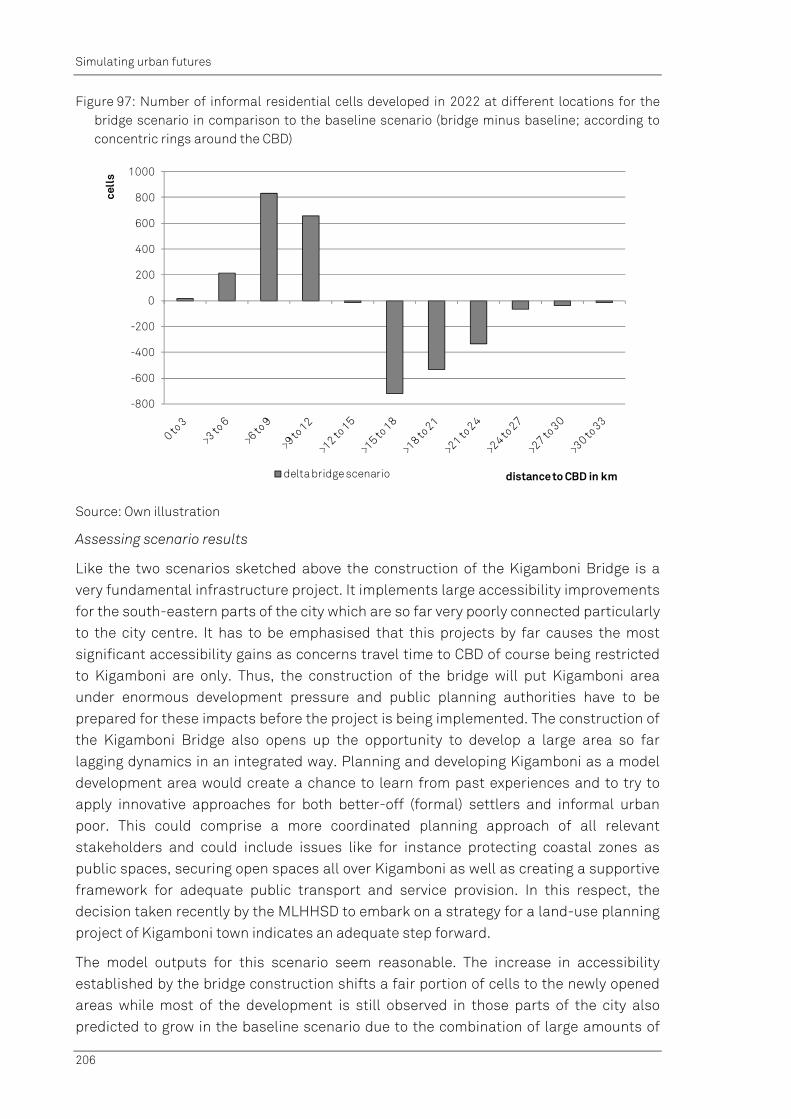
Simulating urban futures
206
Figure 97: Number of informal residential cells developed in 2022 at different locations for the bridge scenario in comparison to the baseline scenario (bridge minus baseline; according to concentric rings around the CBD)
Source: Own illustration
Assessing scenario results
Like the two scenarios sketched above the construction of the Kigamboni Bridge is a very fundamental infrastructure project. It implements large accessibility improvements for the south-eastern parts of the city which are so far very poorly connected particularly to the city centre. It has to be emphasised that this projects by far causes the most significant accessibility gains as concerns travel time to CBD of course being restricted to Kigamboni are only. Thus, the construction of the bridge will put Kigamboni area under enormous development pressure and public planning authorities have to be prepared for these impacts before the project is being implemented. The construction of the Kigamboni Bridge also opens up the opportunity to develop a large area so far lagging dynamics in an integrated way. Planning and developing Kigamboni as a model development area would create a chance to learn from past experiences and to try to apply innovative approaches for both better-off (formal) settlers and informal urban poor. This could comprise a more coordinated planning approach of all relevant stakeholders and could include issues like for instance protecting coastal zones as public spaces, securing open spaces all over Kigamboni as well as creating a supportive framework for adequate public transport and service provision. In this respect, the decision taken recently by the MLHHSD to embark on a strategy for a land-use planning project of Kigamboni town indicates an adequate step forward.
The model outputs for this scenario seem reasonable. The increase in accessibility established by the bridge construction shifts a fair portion of cells to the newly opened areas while most of the development is still observed in those parts of the city also predicted to grow in the baseline scenario due to the combination of large amounts of
-800
-600
-400
-200
0
200
400
600
800
1000
cell
s
distance to CBD in kmdelta bridge scenario

Simulating urban futures
207
pre-existing settlements (i.e., neighbourhood relations) and unchanged comparably good accessibility.
13.3.4. Scenario IV: Combined implementation of DART, ring road, and Kigamboni Bridge
As the three infrastructure projects introduced previously are not mutually exclusive the fourth scenario will demonstrate the effects of their combined implementation. The routing and assumed travel times can be seen in Figure 98. For modelling purposes the various infrastructure networks had to be connected to form a consistent road network including the necessary connecting nodes.
The implementation is assumed to be finished in 2012. As the three infrastructure projects have already been discussed or are even precisely projected, the combination of them is likely to become reality in the near future. The scenario will, thus, provide interesting indications about the likely future of informal residential development in Dar es Salaam assuming a timely implementation of the projected infrastructure projects. By detecting cross-cutting impacts on urban development patterns, this combined scenario may also provide extra information on the likely consequences for urban planning.

Simulating urban futures
208
Figure 98: Routing for the combination of DART scenario, Kigamboni Bridge scenario and ring road scenario
Source: Own illustration; based on transport network data provided by ITC, Enschede, updated for 2002 and modified for this scenario
Scenario simulation results
The infrastructure measures merged into the combined scenario cause obvious changes in accessibility variables as can be seen in Figure 99 for travel times to the CBD as an example. These are used for the simulation period between 2012 and 2022.

Simulating urban futures
209
Figure 99: Travel time to CBD for the combined scenario (left) and changes compared to the baseline scenario (right)
Source: Own illustration; based on transport network data provided by ITC, Enschede, updated for 2002 and modified for this scenario
This scenario exhibits the highest improvements in travel time for Kigamboni where the benefits of the ring road and the bridge scenario are combined, thus, improve travel time to CBD by up to 50 minutes and more. Moreover, this scenario also improves accessibility in large parts of the urban periphery, particularly in the western and northern parts of the study area. In those areas travel times are reduced by 5 to 10 minutes. Only the very southern parts of the study area and the inner city areas benefit less than 5 minutes.
The combination of the three selected infrastructure projects also demonstrates big impacts in terms of emerging informal residential land-use dynamics (see Figure 100). In total, the combined scenario shifts 1648 land-use transformations to other locations constituting about 7.7% of all allocated cells. Keeping in mind that accessibility changes only from 2012 on, the number makes up for 14% of the cells to be allocated differently compared to the baseline scenario during the second decade of the simulation period. Rather dispersed losses of developed cells at the urban fringes compared to the baseline scenario (with only a slight concentration in the southern parts of the study area) balance out the rather clustered development in Kigamboni. The resulting urban patterns are quite similar to the results of the bridge scenario. Travel time
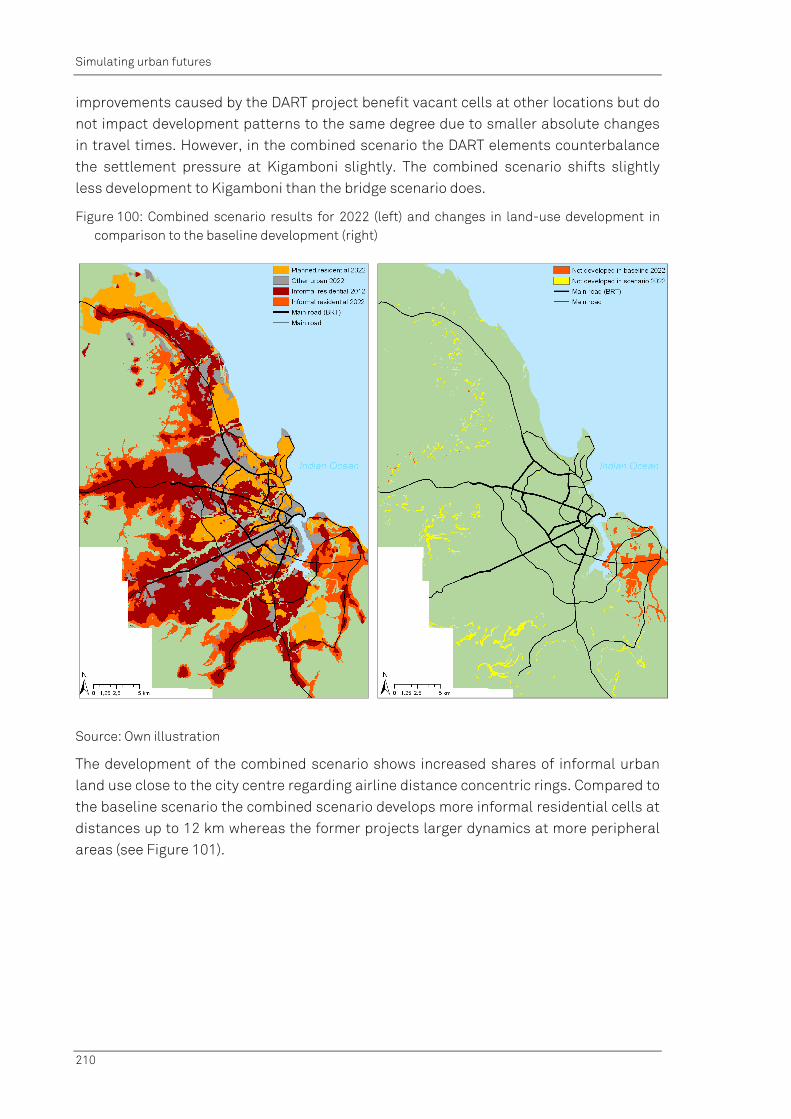
Simulating urban futures
210
improvements caused by the DART project benefit vacant cells at other locations but do not impact development patterns to the same degree due to smaller absolute changes in travel times. However, in the combined scenario the DART elements counterbalance the settlement pressure at Kigamboni slightly. The combined scenario shifts slightly less development to Kigamboni than the bridge scenario does.
Figure 100: Combined scenario results for 2022 (left) and changes in land-use development in comparison to the baseline development (right)
Source: Own illustration
The development of the combined scenario shows increased shares of informal urban land use close to the city centre regarding airline distance concentric rings. Compared to the baseline scenario the combined scenario develops more informal residential cells at distances up to 12 km whereas the former projects larger dynamics at more peripheral areas (see Figure 101).
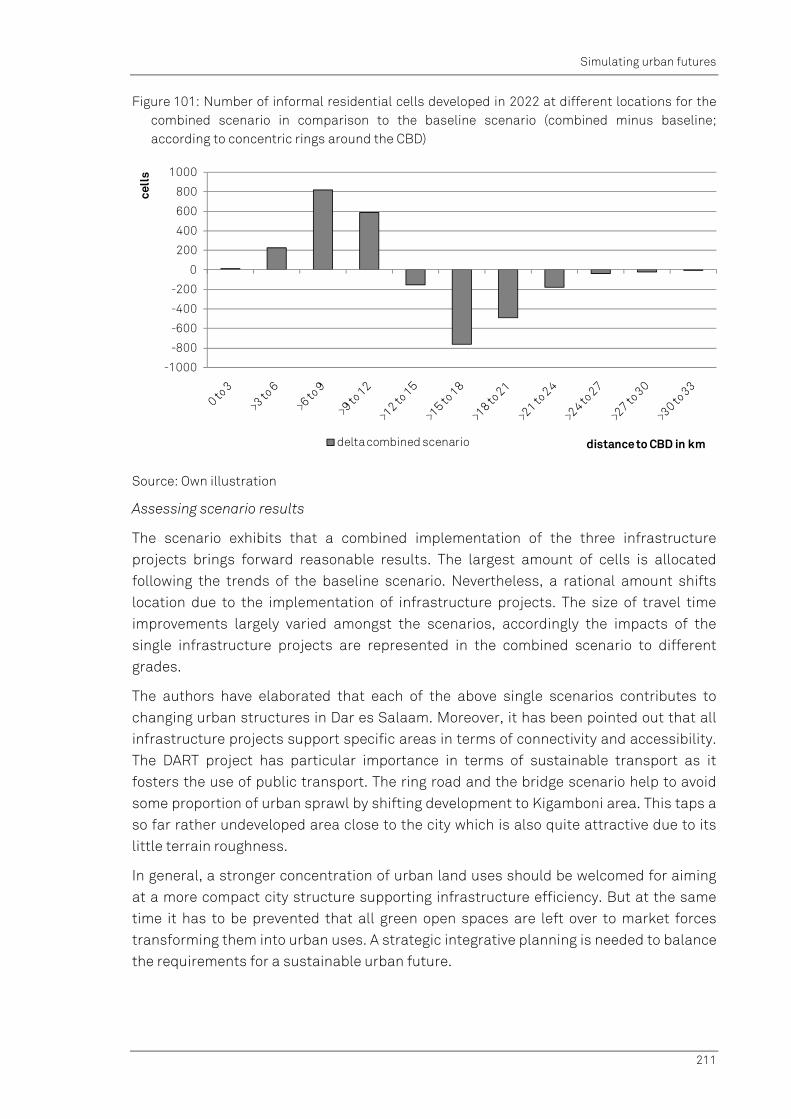
Simulating urban futures
211
Figure 101: Number of informal residential cells developed in 2022 at different locations for the combined scenario in comparison to the baseline scenario (combined minus baseline; according to concentric rings around the CBD)
Source: Own illustration
Assessing scenario results
The scenario exhibits that a combined implementation of the three infrastructure projects brings forward reasonable results. The largest amount of cells is allocated following the trends of the baseline scenario. Nevertheless, a rational amount shifts location due to the implementation of infrastructure projects. The size of travel time improvements largely varied amongst the scenarios, accordingly the impacts of the single infrastructure projects are represented in the combined scenario to different grades.
The authors have elaborated that each of the above single scenarios contributes to changing urban structures in Dar es Salaam. Moreover, it has been pointed out that all infrastructure projects support specific areas in terms of connectivity and accessibility. The DART project has particular importance in terms of sustainable transport as it fosters the use of public transport. The ring road and the bridge scenario help to avoid some proportion of urban sprawl by shifting development to Kigamboni area. This taps a so far rather undeveloped area close to the city which is also quite attractive due to its little terrain roughness.
In general, a stronger concentration of urban land uses should be welcomed for aiming at a more compact city structure supporting infrastructure efficiency. But at the same time it has to be prevented that all green open spaces are left over to market forces transforming them into urban uses. A strategic integrative planning is needed to balance the requirements for a sustainable urban future.
-1000
-800
-600
-400
-200
0
200
400
600
800
1000
cell
s
distance to CBD in kmdelta combined scenario

Simulating urban futures
212
13.4. Comparison of scenarios
The model developed during this study has shown to be able to simulate informal residential development. Based on standard GIS software along with customised scripting a CA-based model has been developed and calibrated subsequently. After successful validation of the model using historic datasets a set of transport infrastructure scenarios has been calculated and compared to a baseline scenario covering the time period from 2002 to 2022. However, it has to be stressed that for the first simulation period every infrastructure scenario the results of the baseline scenario were simply adopted as all changes to the road network and travel time are assumed to be implemented by 2012 only. Therefore, changed framing conditions became relevant only for the last simulation period between 2012 and 2022 which in a way limits the impacts of the infrastructure scenarios.
As an overall conclusion, the baseline scenario has highlighted that Dar es Salaam will face a continuation of its enormous urban sprawl in the next decade with rapid expansion of the urban fringes towards the periphery. The four scenarios have demonstrated how infrastructure measures may redistribute informal urban growth inside the study area highlighting the area of Kigamboni as one of the potential future hotpots of urban growth. To compare results and assess the impacts of infrastructure projects in addition to the analyses presented above, the distribution of all land uses was calculated for concentric rings around the CBD for the combined scenario. Comparing these results with the respective figures for the baseline scenario the results underline the tendency to settle in areas close to the CBD filling up available agricultural or vacant areas once accessibility improvements due to infrastructure projects are tangible (see Figure 102).
Figure 102: Land-use distribution according to concentric rings in 2022 for the baseline scenario (left) and the combined scenario (right)
Source: Own illustration
The variations of the scenario results in comparison to the baseline scenario were also analysed by means of concentric rings around the CBD. Among the three single project scenarios the most significant variation compared to the baseline scenario can be
0%
10%
20%
30%
40%
50%
60%
70%
80%
90%
100%
1 6 11 16 21 26 31 36
land
-use
pro
port
ions
distance to CBD in km
0%
10%
20%
30%
40%
50%
60%
70%
80%
90%
100%
1 6 11 16 21 26 31 36
land
-use
pro
port
ions
distance to CBD in km
unbuilt / agriculture informal settlements planned residential other urban

Simulating urban futures
213
observed for the bridge scenario (see Figure 103). The fourth scenario combining all infrastructure projects causes slightly less variation in terms of spatial distribution of cells considering the concentric distribution of cells in comparison to the baseline scenario. The ring road scenario also shows a stronger concentration of development towards the city centre but to a lower degree only. In contrast, the results of the DART scenario exhibit the smallest variations compared to the baseline scenario. However, the authors have stressed that it will most likely have considerable impacts in terms of further consolidation and redensification in those settlements located along the BRT corridors. Only at a distance of more than 21 km to the CBD the DART scenario impacts significantly on the model results. There is increased development which can be explained by considerable accessibility improvements on still vacant land.
Figure 103: Variations in concentric distribution simulated residential land development of the four scenarios compared to the baseline scenario for 2022
Source: Own illustration
When interpreting these figures one has to consider that the model results only indicate newly emerging informal residential cells. As has been elaborated before, the urban fringes are very sparsely populated and it is for sure that a lot of urban dynamics which cannot be simulated by the model will also take place in the existing developed areas. Action is also needed in the existing urban areas (which to a large degree consist of informal residential developments and where adequate infrastructure and services are missing) to support improvements of living conditions.
-800
-600
-400
-200
0
200
400
600
800
1000
cell
s
distance to CBD in kmdelta DART delta ring road delta bridge delta combined
Interim conclusions
214
14. Interim conclusions
This work aims to contribute to the ongoing scientific debate about analysing mechanisms of informal urban dynamics and identifying suitable access points for effective planning interventions. It analyses informal urban dynamics in rapidly growing cities and seeks to elaborate a suitable simulation model to reproduce past and forecast future development.
The presented model is a CA-based simulation model with a high level of abstraction. As an inherent aim of model development was to keep the model as simple as possible the constraints imposed by working in a data-poor environment could be compensated to a good extent by the chosen modelling approach. With the final set of variables the model has demonstrated to be able to adequately reproduce informal urban dynamics for the case of Dar es Salaam. Although the underlying mechanism of households’ residential location preferences are much more detailed and complex in reality the aggregated representation of relevant location factors for land-use change from vacant to informal residential use can be assessed to be appropriate to model urban dynamics in Dar es Salaam. This holds true for at least the last two decades and is assumed to be applicable to demonstrate general patterns of the likely future development for the next two decades, too.
The study has identified the following key determinants for informal residential location decisions (see Chapter 12.3): slope, informal neighbourhood cells score, planned neighbourhood cells score, travel time to CBD, travel time to next urban sub-centre and distance to next road. These indicators can be grouped into three categories: i) natural conditions, ii) neighbourhood factors, and iii) accessibility factors. According to these groups the following sections will briefly sum up, interpret, and conclude the main findings.
Natural development constraints
For informal residential growth in Dar es Salaam natural conditions form an influencing factor. Slope has been proven to be one variable relevant for urban settlers and, thus, influences location decisions since the city’s surface is rather uneven. This feature may apply to other megacities as well but may also be of less importance in environments where low terrain roughness is found. Clear constraints from natural conditions could only be verified for core areas of river valleys, swamp areas, and mangroves, as they impose fundamental obstacles for building activities. For the simulation of future development forest areas were additionally included as constraint areas. Although their locations are rather remote and settlement just beginning to reach them partly so far the continuous rapid expansion of the urban boundaries will soon put settlement pressure on those areas. Constraining development in those areas reflects that local stakeholders will value the utility of forest areas and will protect them from being transformed into urban uses.

Interim conclusions
215
Neighbourhood factors
The following two determinants represent the influence of existing urban residential areas inside the local neighbourhood of transformable cells. It has been elaborated that social location factors are of particular importance for poor urban settlers. Existing informal settlements were identified to have by far the strongest influence for the future emergence of informal residential areas. This finding in itself is not surprising but the magnitude of the effect is relatively large.
The applied regression model has identified planned residential land use to have a slight repulsive influence on informal settlement activities. This finding contradicts the proposition that formal settlements attract further informal development as they offer opportunities to work and benefit from existing infrastructure and services. A deeper look into the spatial distribution and arrangement of informal and formal residential uses between 1982 and 2002 shows that this is true for some areas only but the majority of informal land use established rather independently from existing planned settlements. For the case of Dar es Salaam the authors have identified a mixture of the following reasons to explain this phenomenon. First, the land-use distribution at the starting point of the time period under study (1982) implicates a framing condition. Most of the planned residential areas were centrally located particularly inside the existing ring roads. In these central places planned residential areas are to a high degree mixed up with or surrounded by cells that are classified as other urban uses. One highly illustrative example are the areas of other urban uses in the north-western parts of the city that in 1982 formed a border adjacent to the ring road at the outer fringe of the urban boundaries. Accordingly, sprawling informal settlements experienced no neighbourhood growth effects from planned residential settlements.
The second general finding on planned residential areas is that for many of the areas existing in 1982 further planned developments can be observed in the subsequent two decades. Two illustrating examples are the planned settlements of Mbezi Beach and Tabata that both had started to emerge before 1982. Mbezi Beach experienced rapid growth particularly until 1992 and Tabata continued to grow from 1982 until 2002. However, due to existing plans to expand those areas adjacent informal growth did not occur. Only after 1992 when most of the planned residential areas were developed and settlers knew where the boundaries of the planned areas would be established informal urban growth started to emerge at the borders. The third interpretation departs from poverty of the informal urban settlers arguing that many of them cannot afford plots close to planned residential areas as it can be assumed that land prices are higher due to the benefit of locations (e.g. availability of formal infrastructure and services). But even if settlers are able and willing the supply of planned residential areas simply could not satisfy the enormous demand. This interlinks with the fourth observation that for many settlers their location decision is hardly connected to any considerations concerning proximity to planned residential areas. Their main driver apparently is availability and affordability of land with comparatively good accessibility to informal sub-centres as well as to the CBD. This phenomenon can particularly be found along the

Interim conclusions
216
peripheral sections of Morogoro Road and Nyerere / Pugu Road and the other southern parts of the city.
Accessibility
This research has underlined that for informal urban settlers travel time to CBD is not the only relevant location factor but also access to more peripheral informal sub-centres. As a further variable the actual location of each plot (or cell) considering road network access can be adequately represented by including the Euclidean distance from each cell centre to any next road. This finding from Dar es Salaam is very likely to account for other rapidly growing megacities in the developing world as well.
The authors assess accessibility, i.e., transport infrastructure planning and provision, to be the central access point for planning interventions. As an integrative part of urban management transport infrastructure developments are an appropriate instrument to guide future informal growth to areas that are favoured by planning authorities. This could help to optimise the use of the scarce resources available for planning purposes, to reduce costs for investment and maintenance, and to achieve affordable prices for the supply with water, electricity and public transport. In those favourable locations urban structures with appropriate densities can create adequate threshold populations for the economic supply of trunk infrastructure. For this purpose the model at hand offers a powerful tool as it demonstrates the likely effects of transport measures and helps to communicate them to the relevant stakeholders. Such application of the model supports integrative and coordinated actions for planning and infrastructure provision measures by local and private actors.
Zoning and perturbation
In contrast to many other models that are presented in the scientific debate the authors decided not to include zoning designations and a perturbation factor into the model structure. The latter was excluded as its positive effect to the model quality could not be verified because each statistical alteration to the optimum results would lower model quality. Moreover, randomly changing results hinder the identification of effects of changes and scenarios and make comparisons of simulation results and scenarios much more difficult (see Chapter 11.5).
Due to the fact that no binding master plan exists for Dar es Salaam no zoning factor was finally included in the model. The factual impacts of planning on urban development in Dar es Salaam are currently rather low. This fact will also be relevant for many other megacities in the developing world to which the model could potentially be transferred and, therefore, does not constitute any shortcoming of the model at hand.
Interpreting model results
The authors would like to stress again that the presented results must not be understood as taken for granted. They rather give an idea of where urban growth is likely to happen given a set of assumptions that the model is based on. Dealing with model simulation results one always has to keep in mind that most of the assumptions are generalised statements that neglect unnecessary detail and focus on basic elements

Interim conclusions
217
considered to be relevant for the phenomenon under study. Of course, some relevant details might also be missing as no information was available to model them. Actual development may also occur due to incidental decisions and some settlement decision will also be taken following a rather survivalist than a utility maximisation strategy. Moreover, framing conditions that were kept constant for the simulation are very likely to change during the time period under study.
Practical model application
The study also aimed at answering how such simulation models could be integrated into local practice to support sound planning processes and decision making. Chapter 17 has elaborated on what is needed to transfer the expert system into a powerful strategic instrument for local planners. Besides the need for technical amendments and extensions it has been demonstrated that the main challenges of a successful integration are of organisational and institutional character. Capacity building is needed, organisational structures have to be established and resources need to be allocated to enable a smooth and efficient integration into local planning processes.
The presented model simulating future informal urban growth has the potential to serve as a smart platform to break new ground for cooperation. It could be used to bring together relevant representatives of all institutions involved in urban growth regulation and infrastructure provision and also to establish solid structures for continuous information exchange and cross-sectoral collaboration.

Interim conclusions
218

Interim conclusions
219
VV -- CCOONNCCLLUUSSIIOONNSS AANNDD TTHHEE WWAAYY FFOORRWWAARRDD
Concluding this study some thoughts will be spent on the perspectives for integrated planning and development of Dar es Salaam, a discussion on the model benefits and shortcomings as well as the way forward towards the practical establishment of the model as an urban decision support system. Finally, needs for further research will be addressed.

Interim conclusions
220

Integrated planning and development perspectives for the urban future of Dar es Salaam
221
15. Integrated planning and development perspectives for the urban future of Dar es Salaam
The model developed during this research supports well-informed and sound decisions for regulating the urban future of Dar es Salaam. But at the same time it only contributes a piece of knowledge in a larger puzzle of urban growth management to achieve the overall goal of a sustainable urban future for the city. Although the focus of this work is on analytical issues the authors would like to sketch their view concerning basic requirements for a normative planning framework for Dar es Salaam which is so far largely missing. This study has demonstrated that in a rational planning approach (see Figure 17) the model can be applied to develop scenarios predicting impacts of planning measures (see Chapter 13). Given a normative framework, the model could also be utilised for the evaluation of planning measures and their impacts.
The following sections will elaborate on selected issues to be considered when planning for a sustainable urban future for Dar es Salaam. Fundamental knowledge on urban facts, dynamics, and trends is a prerequisite for sound, efficient, and feasible planning decisions. As the ability of local planning authorities to plan and control development in Dar es Salaam is limited there is a need to identify strategic access points for planning measures and intervention in areas subject to considerable future urban dynamics. Local authorities in Dar es Salaam may use the results of urban simulation models to gain insights into urban development processes and to better prepare for what can be expected to happen with a high probability as a consequence of taking specific planning decisions. The simulation model presented can help to identify the areas that are very likely to experience increased settlement pressure particularly due to the establishment of infrastructure projects. However, to identify those areas is only the first step and starting point of pro-active urban management; the subsequent steps of planning and plan implementation should not be handed over to the market forces only. Local planning authorities should play an active role ensuring that the scarce resources available are spent in an effective and resource-efficient way. Moreover, the measures should be targeted to increase public welfare for all city inhabitants particularly focussing on creating a supportive and guiding framework for the informal land and housing sector. Local governments should closely cooperate with and support their institutions at mtaa and ward levels to pro-actively intervene so as to secure public land-use rights in informal settlements before unregulated densification reaches prohibitive levels.
The simulation model has descriptive and explanatory power but cannot substitute a normative framework to define visions for future development. In Dar es Salaam the essential problem still is that an integrated and coordinated planning approach is lacking. As the city’s population is projected to continuously grow and the pressure on so far un-built land, existing infrastructures, and natural assets will persistently increase, a strategic vision for the city’s future is urgently needed in order to direct and manage urban development. A normative framework has to be developed, agreed upon, and approved by all relevant stakeholders. Subsequently, it has to be monitored in a

Integrated planning and development perspectives for the urban future of Dar es Salaam
222
transparent and participatory process. For urban management purposes the framework needs a clear spatial component and, thus, the following paragraphs will highlight some issues of particular spatial relevance. However, in this study only some rather basic issues can be discussed as each topic potentially represents an individual research area and, thus, goes far beyond the scope of this study.
Dar es Salaam should realign towards a more integrated development of transport and land use. This integrated approach would inter alia focus on reconciling the provision of transport infrastructure with the planning and self-emergence of residential land. Planned residential areas should right from the start get well connected to the transport network and to supply and disposal net infrastructure facilities. Informal settlement dynamics should be guided to suitable locations using the attracting powers of establishing infrastructure in favourable areas. Last but not least infrastructure provision should also try to follow the unplanned emergence of informal settlements as quickly as possible to allow for planning intervention before the ex-post provision becomes too expensive or even impossible due to consolidation processes.
Integration land-use and transport planning also favours the idea of a more compact city. It could help to limit the occupation of so far unbuilt land at the urban periphery to a certain extent, reduce energy consumption, and transportation expenditures. It is clear that even with substantial densification a considerable proportion of future urban growth would, nevertheless, take place outside the existing built-up areas. Growth rates are too high for the relatively weak planning system in place to direct all urban growth into densification areas. In terms of transport infrastructure the public transport sector plays a substantial role. Particularly along transport infrastructure lines with high capacities like trunk roads or DART routes more compact settlement structures, e.g., higher population densities should be realised. This would support the use of public transport as well as the efficient use of net infrastructures. Unfortunately, the urban reality in Dar es Salaam looks different what can be demonstrated exemplarily by the fact that most of the locations dedicated for newly planned residential areas under the 20,000 Plots Project can be classified as being relatively isolated and peripheral: more than 30% of the dedicated plots are located outside the edges of the study area of this research. Furthermore, large project areas are placed far north at the border of the study area, further large areas can be found at Buyuni in the south-western periphery and in eastern Kigamboni. This shortcoming is underlined by the fact that many of these areas are not connected to the existing main road network or to the planned routing of the DART project resulting in low accessibility. The expansion of urban areas into remote locations would call for the expansion of public transport infrastructure and facilities that could only be realised at rather inefficient means considering cost recovery.
Furthermore, the supply of basic technical infrastructure should be given more attention in newly emerging informal residential areas. Ideally, basic services like water, sewage, electricity, and waste collection should be provided in a coordinated manner and retrofitted in existing settlements to allow the urban poor to be connected to the formal supply network and to benefit from lower costs of service access. The above reasoning on cost-efficiency applies to supply and disposal infrastructure in a similar way. The
Integrated planning and development perspectives for the urban future of Dar es Salaam
223
decision on where to favour future urban development should consider the existing networks, capacities, and constraints concerning difficulties in supplying services, e.g., imposed by natural conditions. Besides providing services to the individual household level, areas for future large-scale infrastructure facilities like power plants, waste disposal sites or sewage-treatment plants should be designated. Whether these are organised in a more centralised or decentralised manner is one of the various general issues that need to be discussed as a contribution to the strategic vision for Dar es Salaam and the respective translation into public policy. The same accounts for the provision of social infrastructure and services like for example health and educational facilities. Their provision has to be coordinated with urban development in order to guarantee functional urban structures allowing particularly the urban poor to access, participate, and benefit from these facilities.
Uncontrolled urban expansion leads to considerable impacts on agriculture, food production and security, and self-subsistence farming including the transformation of fertile agricultural land into built-up areas. Thus, integrated urban development planning has to consider land fertility for zoning designations as “livestock keeping in rural niches within fast developing urban areas is a major contributor to monetary income and food security” (Lupala & Kreibich, 2008: 19). Urban agriculture particularly needs easy access to markets, adequately sized plots, and adequate environmental conditions. Moreover, planning should protect and carefully develop traditional villages preserving some of their rural characteristics like subsistence farming.
Environmental protection has some aspects to be considered rather on the urban-regional level. In terms of nature conservation three assets are of outstanding importance: i) forests, ii) mangroves and iii) coastal areas47. Nature conservation in general has to be brought forward through formal regulations and informal mechanisms alike that are appropriately designed and interconnected to successfully implement nature conservation into practice.
The simulation model has clearly identified Kigamboni to be one of the very likely hotspots for future residential dynamics in Dar es Salaam. Due to the so far low degree
47 Forest areas are rare inside the boundaries of Dar es Salaam anyway. Still there exist some larger areas outside the city boundaries adjacent to the south-western and south-eastern parts of Ilala Municipality. Although today’s settlement pressure hardly impacts on these areas, they are likely to experience settlement pressure in the future as the urban boundaries are continuously expanding. Thus, an effective protection is crucial which requires a combination of formal support and informal mechanisms on the grassroots level to implement these regulations and to guarantee the regulations to be respected. These regulations and mechanisms need to be developed and put into place as soon as possible. Mangroves are a prominent characteristic along the coastline of Dar es Salaam. These areas largely resist urban activities in terms of land-use change as building activities are naturally hampered. Nevertheless, they are affected by human activities basically due to clear-cutting seeking for wood as a resource or due to pollution by harmful substances like sulfides or heavy metals (Lyimo & Mushi, 2005; de Wolf et al., 2001). Coastal areas experience strong pressure of development particularly for tourism purposes. Keeping the coast and beaches accessible for the public should be fostered. Green and open spaces in the urban areas have an added value for inhabitants on a small-scale level. The provision of green public areas like parks allows for easy access to recreational areas and at the same time supports the quality of air and balances the impacts of urban heat islands.

Integrated planning and development perspectives for the urban future of Dar es Salaam
224
of urban development in that area planning authorities may take up the opportunity to consider Kigamboni as an urban laboratory to carefully develop, test, and implement new and more integrated approaches to spatial planning considering all types of settlers – low, middle, and high income people which satisfy their demand for housing either on the formal or informal markets. New instruments and approaches for efficient service and infrastructure provision, and effective environmental and coastal protection could be exercised.

Model discussion
225
16. Model discussion
This section will conclude the lessons learnt during model development, implementation and simulation. It presents some elaborations on the benefits gained from the modelling exercise and demonstrates the burdens and shortcomings that were encountered during the whole modelling process.
Benefits
The modelling work gave much insight into the processes that are taking place in Dar es Salaam shaping rapid urban expansion. It has proven basic mechanisms of location theory to be valid also for informal residential location decisions and confirmed that a comparably simple modelling approach can adequately reproduce past development patterns observed in the real world system. Simulating the degree of urban expansion according to UN population projections and the emerging spatial distribution patterns of urban land provided clear evidence that planning action is urgently needed. Rapid population growth is likely to result into further urban sprawl occupying large areas of presently vacant or agricultural land.
As will be discussed in further detail in the subsequent chapter, the developed model holds considerable potential to be employed in local planning practice. Contributing to this are its ability to generate results in comparably short time and its inherent options for visualisation of results. Since the model was developed based on an all-in-one GIS software it particularly supports communication and discussion of results. As it provides planners and politicians alike with a good overview about recent and future development trends the model results are assumed to (and have partly already proven during fieldwork) to be a powerful tool for enhancing communication and, thus, ultimately coordination and cooperation among different stakeholders involved in urban planning and management.
The simulation of infrastructure scenarios has highlighted the impacts of changes in the road and transport network. Each one of the considered infrastructure projects has specific impacts. The combined scenario for the joint establishment of all three infrastructure measures has identified Kigamboni to be the most relevant hotspot for future development given the implementation of these projects.
The model is easy to apply since its structure is designed along one of the main CA principles: simplicity. It does not demand for a sophisticated database and could, thus, be modified or transferred to other locations (bearing in mind the need for (re-) calibration). Furthermore, it is not very complex and, thus, avoids to be criticised for black-box modelling which basically describes the danger that users may be unable to understand and fully penetrate a model and its functioning principles. This characteristic constitutes a major prerequisite to responsibly and successfully apply such models.
Another benefit results from the model being developed based on standard GIS software using open source scripting language which makes it possible to easily extend or change the model. It can be adapted and changed according to local needs and requirements

Model discussion
226
allowing in principal for a seamless adaptation to different circumstances as for instance imposed by other geographic contexts.
Shortcomings
The model at hand simulates urban futures based on calibration results derived from past development patterns. This is a common approach not only taken by CA models. The underlying assumption is that these past development patterns will continue into the future. Thus, the model more or less extrapolates past development. However, a major criticism is that several factors might change resulting into future drivers and configurations to change with the consequence that different patterns are likely to occur. Given the current modelling approach such (major) changes cannot be reproduced by the model dynamically. For the case of Dar es Salaam, however, one can fortify the chosen modelling approach by reasonably arguing that major changes are not very likely to occur in the near future given the conditions of rapid and largely informal urban growth.
A further limitation to the modelling work arose mainly from the issues of data availability. Right from the beginning of model development a major handicap was imposed by the difficulties in database compilation. Fortunately, a fundamental progress could be achieved when a consistent spatial database for Dar es Salaam could be acquired from ITC in Enschede. However, any additional data needed that could not be derived from aerial photography had to be disregarded as there were hardly any useful datasets that could be acquired during field work in Dar es Salaam. The compiled database still holds inconsistencies and, thus, the derived model calibration must be assumed to be to some extent affected by such deficits.
Nevertheless, the database which the study finally made use of is rather restricted and, thus, limits the options for simulating urban development. For instance figures on the spatial distribution of population densities were available only for 1998 as the latest time slice. Updating this data for 2002 would by far have exceeded the scope of this study. As reliable datasets on population distribution or density were not available for the time period under study the authors had to develop an alternative way to handle population figures. Finally, UN population figures combined with a consolidation factor derived from historic datasets as well as assumptions were used to broadly derive the overall demand for informal residential land. As a consequence, this means that there is no further distinction in terms of population density between different residential settlement types available for the extent of the whole study area. Thus, the model only distinguishes two types of residential areas: informal and planned residential without any further opportunity to differentiate sparsely populated cells from highly consolidated ones. Furthermore, the model so far cannot simulate any other development than transformations from vacant / agricultural to informal residential land. This neglects the findings of studies that have been conducted examining consolidation processes and various settlement types that exist in Dar es Salaam.
Moreover, the model’s abilities to simulate future scenarios are confined to changes in variables considered by the model, e.g., infrastructure-related factors such as
Model discussion
227
accessibility. Other changes such as general land-use policies or changes in economic framing conditions are not immediately implementable by the presented model. In addition, apart from infrastructure measures foreseen by the scenarios themselves no further forecasting of road development is possible. Accordingly, the simulation results for 2012 and 2022 are based on the road network for 2002. Regarding the modelling techniques this approach does not support the idea of mutual interdependencies of land use and transport infrastructure. Residential growth is considered the dependent variable and the road network is one of the independent variables. The land use transport feedback cycle, however, emphasises the mutual interdependencies of the two issues. This model characteristic results in a situation where accessibility at the newly emerging urban fringes may be improved in the real world system leading to an accelerating expansion of settlement activities in adjacent areas while in the model growth might be directed to other areas due to a comparatively better accessibility instead. Generally it can be stated that the longer the simulation period the larger these distorting effects get. Moreover, for transport scenarios only selected major projects and routes were incorporated into the model database as the main purpose of the scenario approach was to demonstrate the basic impacts of the selected infrastructure projects on informal urban development.
One further aspect that could be criticised is that travel time assumptions are basically assumed to be fixed besides those changes that result from changed scenario settings. The real system, however, in the recent past experienced a rapid deterioration of the traffic situation characterised by a rapid growth of registered vehicles (Mbuligwe & Kassenga, 1997) and accompanying capacity lacks leading to increasing travel times due to traffic jams. The travel speeds assumed for travel time calculations have been discussed during field work in 2007 and might be rather optimistic. At least for the time horizon until 2022 the travel times must be considered to suffer from the aforementioned increase in traffic in general. The imposed bias concerning actual travel times has to be kept in mind when interpreting model results.
A final remark is imposed by the extent of the study area which was again constrained by data availability. When calculating the simulation runs the extent became a limiting factor with respect to the forecasting period. The simulation results for 2022 exhibited that during a time period of only 20 years at some locations the built-up urban fabric is projected to reach the edges of the study area. It must be considered that this distorts the model results by shifting transformation processes to other locations inside the study area and, thus, influencing the shape of urban form to a certain degree. For this reason the authors decided to limit the simulation period to 2022 instead of forecasting until 2032 as originally intended.
Moreover, the authors would like to stress again that the presented results must not be understood as taken for granted. They rather provide an idea of what is likely to happen given a set of assumptions that the model is based on. Dealing with model simulation results one always has to keep in mind that most of the assumptions are generalised statements that neglect unnecessary detail and focus on basic elements considered to be relevant for the phenomenon under study. Of course, some relevant details might

Model discussion
228
also be missing as no information was available to model them. Actual development may also occur due to incidental decisions and many settlement decisions are also taken following a rather survivalist than a utility maximisation strategy.
Towards a practical urban decision support system
229
17. Towards a practical urban decision support system
This study departs from the notion that sound management of rapid urban growth in megacities of the developing world is one of the main challenges for a sustainable urban future. This research explored informal urban dynamics in Dar es Salaam trying to model the observed informal residential processes. The advances and shortcomings experienced were described above as well as the principal potential of the developed model to support rational planning decisions for future urban development of Dar es Salaam. Subsequently, the issue of transferring the model into a tool to be employed in local planning practice should be investigated. So far the model has to be considered as a so-called expert system and is, thus, not easily applicable by its primary addressees – spatial planners in Dar es Salaam. Therefore, the following sections will elaborate on the requirements both in organisational or institutional as well as in technical terms to allow for a useful and effective integration of the model eventually converting it into a decision support system.
Currently, the model is an ArcGIS application consisting of one core Python script and several (sub-)scripts or Model Builder models. Each of these sub-models provides specific functionality. In order to allow for a convenient user experience contributing to the overall applicability it may be worthwhile to consider consolidating the model concerning its very modular structure. It will still rely on an appropriate ArcGIS installation as basis for its operational procedures but the modules which are currently at least partly stand-alone (e.g., accessibility calculation) will need to be integrated into the model core. Along with that, a customised graphical user interface (GUI) would further enhance the model applicability for non-GIS-experts. It should allow users to interact with the software in the familiar PC-style way, e.g., by using dialog boxes to specify custom parameters discarding any need to revisit the script each time there is a need to alter parameters.
Considering the situation as experienced by the authors during several site visits in Dar es Salaam the question arises where to host the model, i.e., the computer application as well as the database. Since the capacities of public institutions both in financial as well as in technical terms are constrained it may be a reasonable alternative to consider to host the model on a server of a specialised local company or even off-shore in order to guarantee smooth functioning and adequate maintenance of the host system in terms of both hard- and software. Such a system could then be managed and accessed via the internet and thereby even be shared across different institutions while at the same time maintaining a common unified model base.
The practical implementation of the model in local urban planning is connected with the issue of monitoring urban development as well as database updates and maintenance. The applicability and usefulness of such models is severely constrained by accurate and up-to-date input data. Thus, a continuous monitoring of spatial development and the associated maintenance of an adequate geodatabase are required in order to ensure best model results. Such input data can be provided by periodic data acquisition from
Towards a practical urban decision support system
230
aerial photographs or satellite imagery. The data in question particularly comprise land-use data and road network data.
In addition to the practical use as a decision support system planners and decision makers may wish to further extend the model, e.g., to simulate other land-use transformations. Since this would involve more fundamental modelling work these issues are covered separately in Chapter 18 on further research needs.
For the organisational and institutional aspects of implementing the model as decision support system the most important requirement is adequate capacity building. This aims at guiding possible users to fully understand the modelling approach and the internal mechanisms of the model. This is a prerequisite for sound analyses and interpretation of the model outputs. “The widespread transfer and diffusion of GIT to developing countries such as those in SSA is by no means a panacea for its development problems nor for its spatial information handling problems (Taylor 1991), which are substantial. (…) The gradually increasing local availability of GIT does provide opportunities for making structural improvements in information support related to informal settlement management at strategic and local levels” (Sliuzas, 2004: 220). Considering that, it turns out that adequate institutional embedding becomes relevant. This must, however, be assumed to be a crucial issue since institutional and organisational changes may impact on the people involved and support from all stakeholders should not be assumed (ibid.: 219). Even if one could assume that these issues could be overcome the basic requirement would be the support by public institutions and policy in general. Given this, the implementation of the model may unfold even a coordinative function among local planning authorities including both public and private stakeholders improving planning and the provision of minimum standards of infrastructure and basic services for formal and informal urbanisation processes. Besides ‘educating’ both public and private actors48 on the mechanisms and consequences of informal urbanisation the model outputs may also serve as inputs to discussions about adequate, effective, and efficient planning measures facing the manifold problems associated with informal urbanisation as discussed in the preceding chapters. One option is to embed such model in the immediately responsible institution which must be considered to be the DCC. Another option proposed by Sliuzas (2004: 229) would be to promote the responsibility of local academics institutions, e.g., Ardhi University with its School of Urban and Regional Planning. To involve academic stakeholders into the discussion could further enhance the integration of theory and practice concerning model outputs and scenarios and, thus, support rational plan-making at city level.
48 Sliuzas (2004: 222) states for instance a lack of a systematic and comprehensive view of informal expansion and densification processes amongst senior professionals which is of some concern considering that since those might be expected to play important roles in future policy development.

Further research needs
231
18. Further research needs
The model developed for this study has demonstrated to be applicable and useful to simulate informal urban development patterns in Dar es Salaam. In conjunction with respective scenarios the model enables the exploration of urban development alternatives as concerns infrastructural projects and their impacts on informal urban development. However, there is still further potential for improving the model and extending its applicability. These aspects on which further research is needed are subject of the elaborations of the subsequent paragraphs.
Since the experiences made working on the case of Dar es Salaam underpinned the notion of a data-poor environment the model database has turned out to be among the most challenging issues to tackle. Besides the general issue of absence of data the problem of historic and recent data alike became evident. The given prevailing framing conditions found in Dar es Salaam can be assumed to be quite similar in most of the least developed countries. Thus, the question arises how such models can be supplied regularly with recent data keeping their information base up-to-date.
Adding to the issues associated with the model’s database, the extent of the study area has turned out to be problematic. This is due to the fact that for some parts of the study area informal urban growth in 2012 commenced to reach the edges of the current study extent. This impacted on the time horizon of the simulation period which has in response been confined by the authors to 2022. In order to enable for simulations beyond this time horizon the study area would have to be extended in order to avoid distortions by cells being allocated differently due to urban growth reaching the edges of the study area. However, this would impact immediately on the model database which in consequence would also need to be extended aggravating the issue of data availability. Thus, the authors recommend research on a comprehensive (multi-temporal) database covering the whole city area of Dar es Salaam.
Such project could also provide valuable information for the extension of the model database. The model currently cannot consider potentially relevant information. Most prominently the presented model lacks information on population densities and associated building densities. In order to better account for consolidation processes and to further differentiate residential land-use classes such data would provide valuable input. However, during model implementation recent data on this subject area was not available to the authors. The same applies to information on land availability and land prices. Such information may improve the model since these factors contribute to the mechanisms driving the informal land market. Implicitly, this information is already incorporated in the model since the cell properties generated can be argued to implicitly represent land prices by considering some features usually determining pricing. But as local land pricing only partly follows typical market mechanisms, incorporating these into the model could, to some extent, help to better explain developments which cannot be captured by the current set of variables.
The same applies to capacities of the road network: congestions pose a considerable issue to all forms of road-bound traffic. To consider road capacities and thereby to

Further research needs
232
implement a more sophisticated transport model would allow for calculating more precise travel times and more sophisticated accessibility indicators.
Adding other types of infrastructure could also potentially enhance the model quality. For example, water supply has been identified to be a potential driver of informal urban development by the Megacities Research Project from which this research emanates. Given the availability of appropriate data this factor could also be incorporated into the presented model to test its relevance. Another extension of the model’s database would be the incorporation of additional variables describing natural conditions. Currently, only slope is considered by the model. However, other factors may also play a role particularly when considering the transformation of vacant land at the urban fringes. Land cells which are characterised by a good suitability for agricultural use can be assumed to be less likely transformed to residential use. Another variable which may also be relevant could be land cover, i.e., remote sensed information on the predominant surface type of an area such as arable soil or bare rock. This may contribute to more evidence on attractive locations for activities like urban agriculture. However, further research must be spent on the question how these properties do affect the aforementioned transformation processes. At least, it can be assumed that those variables might be able to improve the quality of the model for describing transformation processes at the urban fringes.
Considering all aforementioned ideas on extensions of the model database one general remark has to be kept in mind – the basic principle of keeping the model as simple as possible should not be abandoned. Thus, in each case it has to be checked whether substantial improvements can really be achieved by adding a further variable to the model and whether these improvements justify associated efforts. A further major prerequisite is the availability of historic data for each variable to be potentially incorporated with respect to model calibration and validation which have to be repeated each time a new variable is introduced.
Another potential for major improvement of the model is constituted by the ability to simulate additional types of land-use transformations. Currently, the model is confined to simulate only one transformation from vacant to informal residential land use which is and has been the dominant kind of transformation in the ongoing period of rapid urban growth since the 1980s. However, there are of course other land-use transformations affecting urban development, for instance the development of industrial or commercial land uses. These processes are currently not captured at all by the model since these land-use types reside together with others in the residual category ‘other urban land uses’49. For future simulations these categories may tend to play a more important role presuming that economic growth might increase significantly in Dar es Salaam. Thus, it might be worthwhile to consider these land uses for future versions of the model. The same applies for planned residential land use: until now, zoning is just incorporated as a constraining designation factor into the model for the
49 Not considering them in the present model version could well be justified since for the past decades economic growth was low and, thus, no considerable development of these categories was observable.

Further research needs
233
case of the 20,000 Plots Project areas. The designated project sites have been excluded from any other urban development. Respective land-use demand figures for informal residential land correspondingly were reduced. Due to the current situation in Dar es Salaam with no comprehensive planning document in power this approach seems reasonable. However, with respect to further development of the model it may be valuable to explicitly include the simulation of planned residential development along respective zoning designations. This may also imply a further general consideration on transformations between different land uses. In fact, the utilisation of vacant or agricultural land has been and presumably will remain the dominant transformation type in Dar es Salaam for the foreseeable future but also other transformation types may occur successively with attractive building plots getting short due to ongoing urban sprawl. Again, it has to be kept in mind that these considerations should only be applied if they can be proved to substantially advance the model results considering the trade-off between the power of simplicity and the desire of capturing more urban complexity.
Another need for further research partly related with the consideration of other land-use transformations may constitute the consideration of other exogenous drivers for land-use development. For the presented model informal residential land-use demand is simply calculated based on future population figures. For considering other land uses, such as industrial or commercial uses, different drivers will be relevant, e.g., projections on economic development. The presented approach assumes fixed consolidation factors and fixed average densities in order to derive land-use demand. Moreover, further increases in average floorspace demand per capita can also be assumed which will also impact on future overall land-use demand. Future research should seek to elaborate on this issue considering more differentiated consolidation factors and, thus, gain better precision regarding land-use demand projections. This issue could gain additional importance when developing, establishing, and monitoring a normative framework for the future urban development of Dar es Salaam.
In addition the authors would like to stress the application potential of such model considering the current debate on global climate change. Urban growth models may potentially contribute significantly for instance by simulating impacts of urban growth and planning measures on CO2 emissions. Furthermore, the impacts of urban growth on natural resources like loss of CO2 sinks related to deforestation due to residential or agricultural land demand may be explored by future research. The authors are confident that such modelling exercise would open up an in-depth laboratory for further research. Of course the presented model will need modifications and extensions depending on the aims of such a study.
With respect to scenario simulation CA models are rather limited to the variables directly considered by the model. Thus, it may also be disputable and subject to further research if more sophisticated means on urban simulation (e.g., microsimulation models) may be implementable in the context of developing countries. On the one hand these models demand far more sophisticated databases and are much more complex but they also offer the ability to further elaborate on the likely impacts of changes in behaviour,

Further research needs
234
policies, economic performance, etc. These issues may be of particular interest also for the aforementioned climate change debate.
The transferability of the presented model poses a further issue for future research. Though the model was developed specifically to simulate urban growth in Dar es Salaam it may be transferable to other geographical contexts since many of the drivers identified can be assumed to be valid in other cities, too. This may apply at least to other SSA cities which are characterised by similar growth phenomena. The literature consulted for this research found other CA-applications in African cities and of course CA are applied also beyond the African continent. Many cities in developing countries face similar framing conditions and problems concerning population development, urban growth, and weak planning systems. However, one has to bear in mind that drivers may vary and data availability impacts seriously on model calibration, validation, and finally application. Additional research need is, thus, imposed by every single model application in a different geographical context.
Finally, more research has to be spent on the establishment and implementability of such models into local planning processes in Dar es Salaam as well as in other rapidly growing cities in SSA and the developing world. Like already indicated in Chapter 17 such models hold considerable potentials but also require a sound application and a suitable (institutional and technical) embedding. Furthermore, participatory approaches involving local stakeholders and residents into model design, database updates, and elaboration of scenarios seem to be a promising approach largely un-tackled by research so far. Most of the related issues could only be named very briefly in this study and in order to take the step towards a real-world decision support system more research and practical experience are strongly required.

Further research needs
235
VVII -- AANNNNEEXX
This block contains the lists of abbreviations, figures, tables, and references.

Further research needs
236

List of abbreviations
237
19. List of abbreviations
API Application Programming Interface BMBF Bundesministerium für Bildung und Forschung (Federal Ministry for
Education and Research) BRT Bus Rapid Transit CA Cellular Automaton/a CBD Central Business District CIA Central Intelligence Agency CPC Construction Project Consultants CPC Construction Project Consultants CWS City Water Services Limited DART Dar es Salaam Rapid Transit DAWASA Dar es Salaam Water Supply and Sewerage Authority DCC Dar es Salaam City Council DEM Digital Elevation Model DFG Deutsche Forschungsgemeinschaft e.g. exempli gratia – for example ECA Economic Commission for Africa EGM United Nations Expert Group Meeting EPM Environmental Planning and Management ESFS Earth Sciences for Society ESRI Environmental Systems Research Institute et al. et alii – and others f and the following page ff and the following pages GaWC Globalisation and World Cities GDP Gross Domestic Product GIS Geographic Information Systems GIT Geoinformation Technology GPS Global Positioning System ha hectare(s) i.e. id est – that is ibid. ibidem – at the same place IDW Inverse Distance Weighting ILO International Labour Organisation ILO-JASPA International Labour Organization, Jobs and Skills Programme for Africa IMF International Monetary Fund inh. inhabitant(s) IRPUD Institute of Spatial Planning, TU Dortmund University ITC International Institute for Geo-Information Science and Earth Observation ITS Intelligent Transportation Systems JICA Japan International Cooperation Agency JICA Japan International Cooperation Agency

List of abbreviations
238
km kilometre(s) km/h kilometre(s) per hour km2 square kilometre(s) LEAT Lawyers' Environmental Action Team LGRP Local Government Reform Process m metre(s) MDG Millennium Development Goals MLHHSD Ministry of Lands, Housing and Human Settlement Development MOLAND Monitoring Land Use Dynamics in Europe NICs Newly Industrialising Countries PC Personal Computer PCI Pacific Consultants International RDBMS Relational Database Management System REPOA Research on Poverty Alleviation RES Resettlement Schemes SDP Sustainable Dar es Salaam Project SSA sub-Saharan Africa(n) SSU Sites and Services and Squatter Upgrading SUDP Sustainable Urban Development Plan t time TANESCO Tanzania Electricity Supply Company TIN Triangular Irregular Networks TRC Tanzania Railways Corporation TTCL Tanzania Telecommunication Limited UN United Nations UNCHS United Nations Centre for Human Settlements UNDP United Nations Development Programme UN-HABITAT United Nations Human Settlements Programme UNU United Nations University UPG Settlement Upgrading Processes URP Department of Urban and Regional Planning, Ardhi University, Dar es
Salaam, Tanzania URT United Republic of Tanzania US$ United States Dollar(s) USAID United States Agency for International Development Vol. Volume
List of figures
239
20. List of figures
Figure 1: Urban and rural populations of the world, 1950-2030 .......................................... 3
Figure 2: Methodology ............................................................................................................... 6
Figure 3: Population dynamics by development groups, 1950 to 2050 ............................. 12
Figure 4: Average annual rate of change of the population of the world and major development groups, 1950-2050 ................................................................................... 12
Figure 5: Urban population as percentage of the total population, 2005 .......................... 14
Figure 6: Average annual growth rates (in %) of the urban population, 1990-2003 ......... 15
Figure 7: Examples for informal transport modes in Dar es Salaam: dalla dalla buses (left) and bicycle taxis (right) ........................................................................................... 20
Figure 8: Inequality, poverty and slum formation ................................................................ 22
Figure 9: Continuum in land tenure right .............................................................................. 24
Figure 10: Procedures of formal and informal housing supply ........................................... 25
Figure 11: Models of formal and informal development and interventions ...................... 26
Figure 12: Examples for informal water supply in Dar es Salaam: water kiosk in the informal settlement of Matangini (left), water truck (middle) and water vendors selling tapped water in little plastic bag along the roads(right) .................................. 29
Figure 13: The costs of being beyond the utility ................................................................... 30
Figure 14: Large cities in Africa in 2007 and 2020 ............................................................... 32
Figure 15: Number of megacities (more than 5 million inhabitants) in developed and developing countries in 1900, 1950 and 2000. .............................................................. 33
Figure 16: Classification and distribution of Global Cities (above) and cities with developing tendencies towards Global Cities (below) according to GaWC group approach ........................................................................................................................... 36
Figure 17: The rational planning model ................................................................................. 47
Figure 18: Computer-based modelling of geographic phenomena .................................... 49
Figure 19: Levels of data modelling ....................................................................................... 51
Figure 20: Two basic structures for spatial data .................................................................. 52
Figure 21: Two representations of land use .......................................................................... 54
Figure 22: Space-time cube ................................................................................................... 56
Figure 23: Basic principles of the ’land use transport feedback cycle' .............................. 57
Figure 24: Land-use transport feedback cycle ..................................................................... 58
Figure 25: Selection of regular cells types ............................................................................ 62

List of figures
240
Figure 26: Selected cell delineation types on (A) a regular grid with von Neumann and Moore neighbourhood, (B) a two-dimensional network, (C) a Voronoi partition an a two-dimensional urban space, based on property coverage ...................................... 63
Figure 27: Examples for local neighbourhoods in a rectangular grid ................................ 64
Figure 28: Moore neighbourhood variations depending on different cell tessellations .. 65
Figure 29: Urban CA-based model variations ....................................................................... 68
Figure 30: A dozen economies of scale ................................................................................. 73
Figure 31: Land rent as described by von Thünen ................................................................ 78
Figure 32: Land prices regarding distance to CBD and the road network ......................... 78
Figure 33: Von Thünen’s concentric rings of agricultural uses ........................................... 79
Figure 34: The concentric zone model of Burgess ............................................................... 81
Figure 35: Formation of hexagonal market areas ................................................................ 84
Figure 36: Network and overlapping of Christaller’s central places .................................. 85
Figure 37: Market nets as described by Lösch ..................................................................... 86
Figure 38: Mean information field probabilities (left) and numeric ranges (right) ........... 92
Figure 39: Relocation-type diffusion and expansion-type diffusion ................................. 93
Figure 40: Hierarchical innovation diffusion ........................................................................ 93
Figure 41: Large cities in Tanzania ...................................................................................... 103
Figure 42: Population density by region 2002 (in inh./km2)............................................... 105
Figure 43: Urban primacy of Dar es Salaam ....................................................................... 107
Figure 44: The administrative and political organisation of local government in Dar es Salaam ................................................................................................................ 110
Figure 45: Impressions from one of the 20,000 Plot Project sites at Mivumoni ............. 113
Figure 46: Urban expansion of Dar es Salaam until 2002 ................................................. 119
Figure 47: Major drivers of land prices in Dar es Salaam .................................................. 121
Figure 48: Land prices in relation to major roads in Dar es Salaam in 1998 ................... 122
Figure 49: Study area and Dar es Salaam municipality boundaries ................................ 123
Figure 50: Land uses in Dar es Salaam in 1982, 1992, and 2002 ..................................... 125
Figure 51: Settlement area development in Dar es Salaam for 1982, 1992, and 2002 .. 126
Figure 52: Proportions of land-use change according to air-line distance to the CBD between 1982 and 1992 (above) and between 1992 and 2002 (below) .................... 127
Figure 53: Proportions of land uses according to air-line distance (in km; left) and travel time (in minutes; right) to CBD ...................................................................................... 128

List of figures
241
Figure 54: Proportions of urban land uses according to air-line distance concentric rings around the CBD in 2002 ................................................................................................. 129
Figure 55: Travel times to the CBD in 2002 (in minutes) .................................................... 134
Figure 56: Informal sub-centres in Dar es Salaam ............................................................ 135
Figure 57: Tegeta informal sub-centre ................................................................................ 136
Figure 58: Kimara informal sub-centre ............................................................................... 137
Figure 59: Gongo la Mboto informal sub-centre ................................................................ 138
Figure 60: Gongo la Mboto informal sub-centre ................................................................ 139
Figure 61: Accessibility in terms of travel time to next informal sub-centre .................. 139
Figure 62: Terrain elevation and land form ......................................................................... 140
Figure 63: Frequency distribution of slope (in degrees) .................................................... 141
Figure 64: Concentric population distribution in Dar es Salaam 1992 and 1998 ........... 144
Figure 65: Average population density by settlement type and distance to CBD in 1998 (in inh./ha) ....................................................................................................................... 145
Figure 66: Model concept for informal residential development ..................................... 155
Figure 67: Model procedure to define constraint areas .................................................... 156
Figure 68: Constraint areas .................................................................................................. 157
Figure 69: Land-use transformation process ..................................................................... 158
Figure 70: Neighbourhood delimitation and distance classes ......................................... 159
Figure 71: Weighting of neighbourhood distance classes ................................................. 160
Figure 72: Population development in Dar es Salaam 1980-2025 ................................... 161
Figure 73: Location and size of 20,000 Plots Project areas .............................................. 162
Figure 74: Model workspace ................................................................................................. 168
Figure 75: Land use simulation result for 2002 with the final calibrated parameter set .................................................................................................................................... 175
Figure 76: Absolute allocation of newly developed informal residential cells according to concentric ring around the CBD in 2002 ...................................................................... 176
Figure 77: Relative deviations of cell allocation according to concentric ring around the CBD for calibration run in 2002 compared to the real system (in %) ........................ 177
Figure 78: Validity procedures in the simplified version of the modelling process ........ 178
Figure 79: Operational validity classification ..................................................................... 179
Figure 80: Validation results 1982 to 1992 (left) and 1992 to 2002 (right) ...................... 180

List of figures
242
Figure 81: Relative deviation of model results according to concentric ring around the CBD for calibration run 2002, and validation runs for 1992 and 2002 in comparison to the real system (in %) ................................................................................................ 181
Figure 82: Absolute allocation of informal residential cells along concentric ring around the CBD of the real system and model validation runs for 1992 and 2002 and calibration run for 2002 ................................................................................................. 182
Figure 83: Baseline scenario land-use distribution forecasted for 2012 (left) and 2022 (right) ............................................................................................................................... 185
Figure 84: Number of newly developed informal residential cells during the previous decade for 1992, 2002, 2012, and 2022 (calculated for concentric rings) ............... 187
Figure 85: Land-use distributions in baseline scenario 2012 (above) and 2022 (below) concerning concentric rings around the CBD (left) and travel time isochrones (right) ............................................................................................................................... 188
Figure 86: DART system routing Phases I to IV ................................................................... 193
Figure 87: DART scenario travel times to CBD in 2012 (left) and changes in comparison to 2002 (right) ...................................................................................................................... 194
Figure 88: DART scenario simulation results for 2022 (left) and changes in land-use development 2022 in comparison to the baseline scenario (right) ........................... 195
Figure 89: Number of informal residential cells developed in 2022 at different locations for the DART scenario in comparison to the baseline scenario (DART minus baseline; according to concentric rings around the CBD) .......................................................... 196
Figure 90: Routing of the proposed ring road ..................................................................... 198
Figure 91: Ring road scenario travel times in 2012 (left) and changes compared to 2002 (right) ............................................................................................................................... 199
Figure 92: Ring road scenario results for 2022 (left) and changes to the baseline scenario (right) ............................................................................................................................... 200
Figure 93: Number of informal residential cells developed in 2022 at different locations for the ring road scenario in comparison to the baseline scenario (ring road minus baseline; according to concentric rings around the CBD) .......................................... 201
Figure 94: Routing of Kigamboni Bridge.............................................................................. 203
Figure 95: Travel times in 2012 assuming the introduction of the Kigamboni Bridge (left) and changes of travel times compared to 2002 arising from Kigamboni Bridge (right) ............................................................................................................................... 204
Figure 96: Bridge scenario results for 2022 (left) and differences in land-use development for 2022 in comparison to the baseline scenario ................................ 205
Figure 97: Number of informal residential cells developed in 2022 at different locations for the bridge scenario in comparison to the baseline scenario (bridge minus baseline; according to concentric rings around the CBD) .......................................... 206

List of figures
243
Figure 98: Routing for the combination of DART scenario, Kigamboni Bridge scenario and ring road scenario ........................................................................................................... 208
Figure 99: Travel time to CBD for the combined scenario (left) and changes compared to the baseline scenario (right) .......................................................................................... 209
Figure 100: Combined scenario results for 2022 (left) and changes in land-use development in comparison to the baseline development (right) ............................. 210
Figure 101: Number of informal residential cells developed in 2022 at different locations for the combined scenario in comparison to the baseline scenario (combined minus baseline; according to concentric rings around the CBD) .......................................... 211
Figure 102: Land-use distribution according to concentric rings in 2022 for the baseline scenario (left) and the combined scenario (right) ....................................................... 212
Figure 103: Variations in concentric distribution simulated residential land development of the four scenarios compared to the baseline scenario for 2022 ........................... 213

List of tables
244
21. List of tables
Table 1: City classification by Jacobson and Prakash 34
Table 2: Population figures of the ten largest cities in Tanzania 104
Table 3: Measures of primacy 108
Table 4: Cross tabulation of slope per cell (in degrees) against informal and not informal residential land use cells 142
Table 5: Population distribution figures 146
Table 6: Overview of variables included in the calibration database 153
Table 7: Population figures and informal urban dynamics assumed for model simulation 163
Table 8: Logistic regression model parameters 173
Table 9: Model accuracy indicators for calibration and validation results 181
References
245
22. References
Abiodun, J. O. 1997: The challenges of growth and development in metropolitan Lagos. In: Rakodi, C. (Ed.): The urban challenge in Africa. Growth and management of its large cities. United Nations University Press, Tokyo, New York, Paris, 192-222
Ackoff, R. L. 1959: Games, decisions and organization. General Systems, 4, 145-150 Albin, P. S. 1975: The analysis of complex systems. Lexington Books, Lexington Albrechts, L. 2004: Strategic (spatial) planning reexamined. Environment and Planning
B: Planning and Design, 31 (5), 743-758 Alexander, C. 1964: Notes of the synthesis of form. Harvard, University Press,
Cambridge, MA Alexander, C. 2002: The nature of order, Books 1-4, Center for Environmental Structure,
Berkeley, CA Allen, G. R. 1954: The ‘courbe des populations’ – A further analysis. Oxford Bulletin of
Statistics, 16, 179-189 Alonso, W. 1964: Location and land use. Harvard University Press, Cambridge ARL (Akademie für Raumforschung und Landesplanung) 2007: Metropolregionen –
Innovation, Wettbewerb, Handlungsfähigkeit. Positionspapier aus der ARL Nr. 71, Hannover
Awotona, A. 1988: The perception of housing conditions in Nigeria by the urban poor. Habitat International, 12, 75–96
Backhaus, K.; Erichson, B.; Plinke, W.; Weiber, R. 2006: Multivariate Analysemethoden. Eine anwendungsorientierte Einführung. Springer, Berlin, Heidelberg
Bähr, J. 1993: Verstädterung der Erde. Geographische Rundschau, 45 (7-8), 468-472 Balci, O.; Sargent, R. G. 1984: A bibliography on the credibility assessment and validation
of simulation and mathematical models. Simuletter, 15 (3), 15–27 Barredo, J.; Demicheli, L.; Lavalle, C.; Kasanko, M.; McCormick, N. 2004: Modelling
future urban scenarios in developing countries: An application case study in Lagos, Nigeria. Environment and Planning B: Planning and Design, 31 (1), 65-84
Barredo, J.; Kasanko, M.; McCormick, N.; Lavalle, C. 2003: Modelling dynamic spatial processes: Simulation of urban future scenarios through cellular automata. Landscape and Urban Planning, 64, 145-160
Baross, P. 1986: Land supply for low income housing: Issues and approaches. UNCRD: Urban Shelter and services for the poor
Basteck, T. 2005: Influence of trunk infrastructure on the urban development under rapid urbanisation - The case of water supply in Dar es Salaam. Unpublished Diploma Thesis at TU Dortmund University
Batty, M. 2001: Polynucleated urban landscape. Urban Studies, 38 (4), 635-655 Batty, M. 2007a: Cities and complexity – Understanding cities with cellular automata,
agent-based models, and fractals. MIT Press Cambridge, London Batty, M. 2007b: Complexity in city systems: Understanding, evolution, and design. CASA
Working Paper Series, Paper 117, Centre for Advanced Spatial Analysis (CASA), University College London, London
Batty, M. 2008: Generating cities from the bottom-up: Using complexity theory for effective design. Cluster, Edition 7 - Transmitting Architecture, 150-161
Batty, M.; Couclelis, H.; Eichen, M. 1997: Editorial - Special issue: Urban systems as cellular automata. Environment and Planning B: Planning and Design, 24 (2), 159-164

References
246
Beaverstock. J. V.; Taylor, P. J.; Smith, R.G. 1999: A roster of world cities. Cities, 16 (6), 445-458
Benenson, I.; Omer,I.; Hatna, E. 2002: Entity-based modeling of urban residential dynamics: The case of Yaffo, Tel Aviv. Environment and Planning B: Planning and Design, 29: 491–512
Benenson, I.; Torrens, P. M. 2004: Geosimulation – Automata-based modeling of urban phenomena. Wiley, Chichester
Benenson, I.; Torrens, P. M. 2005: A minimal prototype for integrating GIS and geographic automata systems. In: Atkinson, P. M.; Foody, G. M.; Darby, S. E.; Wu, F. (Eds.): GeoDynamics. CRC Press, Boca Raton, London, New York, 347-367
Blank, A.; Solomon, S. 2000: Power laws in cities population, financial markets and internet sites (Scaling a system with a variable number components). Physica A, 287, 279-288
Blosse, J. 2009: Lagos sets standard for urban transport in Africa. Urban World, 1 (4), 40-41
Blotevogel, H. H. 1996: Zentrale Orte: Zur Karriere und Krise eines Konzepts in der Geographie und Raumplanung. Erdkunde, 50 (1), 9-25
Blotevogel, H. H. 2004: Zentrale Orte und Metropolregionen – Zu einigen aktuellen Entwicklungen der Raumordnungspolitik in Deutschland. Forum Raumplanung, 2, 32-43
Blotevogel, H. H. 2006: Metropolregion Rhein-Ruhr. Geographische Rundschau, 58 (1), 28-36
Bronger, D. 1989: Die Metropolisierung der Erde. Ausmaß – Dynamik – Ursachen. Geographie und Schule, 11 (61), 2-13
Bronger, D. 1996: Megastädte. Geographische Rundschau, 48 (2), 74-81 Bronger, D. 2004: Metropolen, Megastädte, Global Cities. Die Metropolisierung der Erde.
Wiss. Buchgesellschaft, Darmstadt Brown, L. A. 1968: Diffusion processes and location – A conceptual framework and
bibliography. Bibliography Series Number Four, Regional Science Research Institute, Philadelphia
Bunge, M. 1983: Epistemology and methodology - Treatise on basic philosophy vol. 5, Dordrecht
Bunge, M. 1996: Finding philosophy in social science. New Haven Burgess, E. W. 1925: The growth of the city. An introduction to a research project. In:
Park, R. E.; Ernest W. B.; McKenzie, R. D. 1925: The City. University of Chicago Press, Chicago, London, 47-61
Carlson, M. 1977: Public feedback for the Club of Rome. In: Laszlo, E.; Bierman, J. (Eds.): Goals in a global community: The original background papers for goals for mankind, a report to the Club of Rome: Volume I - Studies on the conceptual foundations. Pergamon Press, New York, 287-295
Chadwick, G. 1971: A systems view of planning – Towards a theory of the urban and regional planning process. Pergamon Press, Oxford, UK
Chrisman, N. 1997: Exploring geographic information systems. John Wiley & Sons, New York, Chichester, Weinheim, Brisbane, Singapore, Toronto
Christaller, W. 1933: Die zentralen Orte in Süddeutschland. Eine ökonomisch-geographische Untersuchung über die Gesetzmäßigkeit der Verbreitung und Entwicklung der Siedlungen mit städtischer Funktion. Fischer, Jena
Clark, C. 1967: Population growth and land use. Macmillan, London

References
247
Clarke, K. C.; Hoppen, S.; Gaydos, L. 1996: Methods and techniques for rigorous calibration of a cellular automaton model of urban growth. Proceedings, Third International Conference/Workshop on Integrating Geographic Information Systems and Environmental Modeling, January 21th-25th 1996, Santa Fe, NM
Colby, C. C. 1933: Centrifugal and centripetal forces in urban geography. Annals of the Association of American Geographers, 23 (1), 1-20
Couclelis, H. 1988: Of mice and men: What rodent populations can teach us about complex spatial dynamics. Environment and Planning A, 20, 99-109
Couclelis, H. 1991: ‘Requirements for planning-relevant GIS: A spatial perspective.’ Papers of the Regional Science Association, 70, 9-19
Couclelis, H. 1997: From cellular automata to urban models: New principles for model development and implementation. Environment and Planning B: Planning and Design, 24(2), 165-174
Couclelis, H. 2005: Where has the future gone? Rethinking the role of integrated land-use models in spatial planning. Environment and Planning A, 37 (8), 1353-1371
Danielzyk, R. 2004: Informelle Planung. In: Akademie für Raumforschung und Landesplanung (ARL) (Ed.): Handwörterbuch der Raumordnung, ARL, Hannover, 465-469
Davis, N. P. 1968: Lawrence and Oppenheimer. Simon and Schuster, New York Davis, M. 2006: Planet of slums. Verso, New York DCC (Dar es Salaam City Council) 2006: SUDP: Strategic urban development plan for the
city of Dar es Salaam – City growth vision, Vol. 1. Dar es Salaam DCC (Dar es Salaam City Council) 2004: Dar es Salaam city profile. Dar es Salaam DCC (Dar es Salaam City Council) 2008: Transport Policy and System Development
Master Plan - Draft final report. Dar es Salaam de Almeida., C. M.; Batty, M.; Monteiro, A. M. V.; Câmara, G.; Soares-Filho, B. S.;
Cerqueira, G. C.; Pennachin, C. L. 2003: Stochastic cellular automata modeling of urban land use dynamics: Empirical development and estimation. Computers, Environment and Urban Systems, 27, 481-509
de By, R. A. 2000: A gentle introduction to GIS. In: de By, R. A. (Ed.): Principles of Geographic information systems. ITC Educational Textbook Series, 1, Enschede, 19-36
de Soto, H. 1992: Marktwirtschaft von unten – Die unsichtbare Revolution in Entwicklungsländern. Orell Füssli Verlag, Zürich, Köln
de Wolf, H.; Ulomib, S. A.; Backeljauc, T.; Pratapb, H. B.; Blusta, R. 2001: Heavy metal levels in the sediments of four Dar es Salaam mangroves: Accumulation in, and effect on the morphology of the periwinkle, Littoraria scabra (Mollusca: Gastropoda). Environment International, 26 (4), 243-249
Deadman, P.; Brown R. D.; Gimblett R. H. 1993: Modeling rural residential settlement patterns with cellular automata. Journal of Environmental Management, 37, 147-160
Durand-Lasserve, A. 2005: Market-driven displacements and the perpetuation of informal settlements in developing cities. Paper presented at the 6th N-AERUS Workshop on promoting social inclusion in urban areas policies and practices, September 16th-17th 2005, Lund
Durand-Lasserve, A.; Selod, H. 2007: The formalisation of urban land tenure in developing countries. Paper presented at World Bank’s 2007 Urban Research Symposium, May 14th-16th 2007, Washington DC
References
248
ECA (Economic Commission for Africa) 2005: Meeting the challenges of unemployment and poverty in Africa. Economic Report on Africa 2005
ESRI (Environmental Systems Research Institute) 2005: Data and Maps Faludi, A. 1972: Planning theory. Pergamon Press, Oxford, UK Farvacque, C.; McAuslan, P. 1991: Reforming urban land policies and institutions in
developing countries. The World Bank, Washington DC Federal Foreign Office (Task Force for Global Issues) 2006: The world as a city, the city in
the world – Globalization, urbanization and international politics. Conference Summary Report 13. Forum Globale Fragen, April 6th-7th 2006, Berlin
Federal Transit Administration (U.S. Department of Transportation) 2009: Characteristics of bus rapid transit for decision-making. Washington.
Fleisch, H. 2001: Weltbevölkerung und Verstädterung. In: Hauchler, I.; Messner, D.; Nuscheler, F. (Eds.): Globale Trends 2002 – Fakten Analysen Prognosen. Stiftung Entwicklung und Frieden, Bonn
Forrester, J. W. 1969: Notes on complex systems. In: Urban Dynamics. MIT Press Cambridge, London, 107-114
Frakias, M.; Seto, K. C. 2007: Modeling urban growth in data-sparse environments: A new approach. Environment and Planning B: Planning and Design, 34, 858-883
Friedmann, J. 2004: Strategic planning and the longer range. Planning Theory and Practice, 5(1), 49-67
Friedmann, J. 2005: Planning cultures in transition. In: Sanyal, B. (Ed.): Comparative Planning Cultures. Routledge, New York, 29-44
Fuchs, R. J.; Brennan, E.; Chamie, J.; Lo, F.-C.; Uitto, J. I. (Eds.) 1994: Mega-city growth and the future. United Nations University Press, Tokyo
Gabaix, X. 1999: Zipf’s Law for Cities: An explanation. Quarterly Journal of Economics, 64, 739-767
Gaebe, W. 2004: Urbane Räume. Verlag Eugen Ulmer, UTB, Stuttgart Gelinck, J. H. W. 1996: A case study on the possibilities and constraints of GIS for urban
planning and management in Dar es Salaam. Faculty of Philosophy and Social Sciences, Eindhoven University of Technology, Eindhoven
Gilbert, A. (Ed.) 1996: The mega-city in Latin America. United Nations University Press, Tokyo
Gilbert, A. 2007: The return of the slum: Does language matter? International Journal of Urban and Regional Research, 31 (4), 697–713
Gulyani, S.; Talukdar, D. 2007: Inside informality: The links between poverty, micro-enterprises and living conditions in Nairobi's slums. World Bank, Washington DC
Hägerstrand, T. 1952: The propagation of innovation waves. Lund Studies in Geography B, Human Geography, 4, 3-19
Hägerstrand, T. 1953: Innovationsförloppet ur korologisk synpunkt. C. W. K. Gleerup, Lund
Hägerstrand, T. 1967: Innovation diffusion as a spatial process. The University of Chicago Press, Chicago, London
Haggett, P.; Cliff, A. D.; Frey, A. 1977: Locational models. Edward Arnold, London Haig, R. M. 1926: Towards an understanding of the metropolis. II - The assignment of
activities to urban areas. Quarterly Journal of Economics, 40, 402-434 Hall, P. 1996: The city of theory. In: LeGates, R. T.; Stout, F. (Eds.): The city reader.
Routledge, New York, 382-396

References
249
Harris, B. 1989: Urban and regional planning in the Third World with geographic information system support. Paper prepared for an International Conference on Geographic Information Systems Applications for Urban and Regional Planning, October 3th-6th 1989, Ciloto, Indonesia
Hart, K. 1973: Informal sector income opportunities and urban government in Ghana. Journal of Modern African Studies, 11, 61-89
Harvey, J. 1996: Urban land economics. Macmillan, Houndsmills Hasbani, J.-G.; Marceau, D. J. 2007: Calibration of a cellular automata model to simulate
land-use changes in the Calgary region. Geo-Tech event, May 14th-17th 2007, Calgary
Healey, P. 1996: The communicative Turn in planning theory and its implications for spatial strategy formation. Environment and Planning B: Planning and Design 23(2), 217–234
Heineberg, H. 2006: Stadtgeographie. Verlag Ferdinand Schöningh, UTB, Paderborn Helmholtz Association 2005: Risk habitat megacity - Strategies for sustainable
development in megacities and urban agglomerations. Concept for a Helmholtz Research Programme 2005-2013.
Hettner, A. 1927: Die Geographie – Ihre Geschichte, ihr Wesen und ihre Methoden. Hirt, Breslau
Hill, A.; Hühner, T.; Kreibich, V.; Lindner, C. 2010: Dar es Salaam, megacity of tomorrow - Informal urban expansion and the provision of technical infrastructure. In: Kraas, F. (Ed.): Megacities - Our global urban future. Springer, Series: International year of planet Earth (forthcoming)
Hill, A.; Lindner, C. 2007: Simulating the impact of trunk infrastructure provision on rapid urban growth in developing countries – A CA application for the city of Dar es Salaam, Tanzania. In: Proceedings of the 10th International Conference on Computers in Urban Planning and Urban Management, July 11th-13th 2007, Iguassu Falls, Brazil
Hill, A.; Lindner, C. 2009: City structure and development of Dar es Salaam, Tanzania – Patterns and trends of informal urban dynamics. In: Hill, A.; Weiß, K. (Eds.): Spatial Planning with Obstacles. 40 Years of Spatial Planning in Crisis Regions and Developing Countries. Dortmunder Beiträge zur Raumplanung 133, Dortmund: Institut für Raumplanung, 55-67
Holz, I.-H. 1994: Stadtentwicklungs- und Standorttheorien unter Einbeziehung des Immobilienmarktes. Geographisches Institut der Universität Mannheim, Mannheimer Geographische Arbeiten 36, Mannheim
Hoover, E. M. 1937: Location theory and the shoe and leather industries. Harvard University Press, Cambridge
Hoover, E. M. 1948: Location of economic activities. McGraw-Hill, New York Hopkins L. D. 2001: Urban development: The logic of making plans. Island Press,
Washington, DC Hoyt, H. 1939: The structure and growth of residential neighborhoods in American cities.
Federal Housing Administration, Washington, DC Hurd, R. M. 1903: Principles of city land values. Record & Guide, New York ILO (International Labour Organization) 1992: World labour report 1992. International
Labour Office, Geneva ILO (International Labour Organization) 2002: Women and men in the informal economy:
A statistical picture. International Labour Office, Geneva
References
250
ILO (International Labour Organization) 2003: Working out of poverty - Views from Africa. Tenth African Regional Meeting, Addis Ababa, December 2003, Special Supplementary Report by the Director-General. International Labour Office, Geneva
ILO (International Labour Organization) 2005: World employment report 2004-05 - Employment, productivity and poverty reduction. International Labour Office, Geneva
ILO (International Labour Organization) 2006: Changing patterns in the world of work, Report of the Director-General, International Labour Conference, 95th Session, Geneva
ILO (International Labour Organization) 2007: The decent work agenda in Africa: 2007–2015. Report of the Director-General to the Eleventh African Regional Meeting, Addis Ababa, April 2007. International Labour Office, Geneva
ILO-JASPA (International Labour Organization, Jobs and Skills Programme for Africa) 1992: African employment report 1992 - Jobs and skills programme for Africa, International Labour Organization, Addis Ababa
IMF (International Monetary Fund) 2006: World economic outlook database - September 2006 Edition. (http://www.imf.org/EXTERNAL/PUBS/FT/WEO/2006/02/DATA/INDEX.ASPX; accesses October 20th 2008)
Ioannides, Y. M.; Overman, H. G. 2003: Zipf’s Law for cities: An empirical examination. Regional Science and Urban Economics, 33, 127-137
Isard, W. 1956: Location and space-economy - A general theory relating to industrial location, market areas, land use, trade, and urban structure. Technology Press of Massachusetts Institute of Technology and Wiley, Cambridge
Jacobson, L.; Prakash, V. 1974: Metropolitan growth - Public policy for South and Southeast Asia, Sage, New York
Kahn H.; Wiener, A. J. 1967: The Year 2000: A framework for speculation on the next thirty-three years with contributions from other staff members of the Hudson Institute. Macmillan, New York
Kainz, W.; de By, R. A. 2000: Geographic information and spatial data types. In: de By, R. A. (Ed.): Principles of geographic information systems. ITC Educational Textbook Series Vol. 1, Enschede, 37-66
Kainz, W.; de By, R. A.; Ellis, M. C. 2000: Data processing systems. In: de By, R. A. (Ed.): Principles of geographic information systems. ITC Educational Textbook Series Vol. 1, Enschede, 67-91
Kanemoto, Y. 2008: Theories of urban externalities. North-Holland, Amsterdam, New York (available at: http://www.e.u-tokyo.ac.jp/~kanemoto/UrbanExt.html. original version 1989, accessed December 5th 2008)
Kanyeihamba, G. W. 1980: The impact of received law on planning and development in Anglophonic Africa. International Journal of Urban and Regional Research, 4 (2), 239-266
Kironde, J. M. L. 1992: Received concepts and theories in African urbanisation and management strategies: The struggle continues. Urban Studies, 29 (8), 1277-1292
Kironde, J. M. L 1993: Will Dodoma ever be the new capital of Tanzania? Geoforum, 24 (4), 435-453
Kironde, J. M. L. 1995: Access to land by the urban poor in Tanzania: Some finding from Dar es Salaam. Environment and Urbanization, 7 (1), 77-95
Kironde, J. M. L. 2006: The regulatory framework, unplanned development and urban poverty: Findings from Dar es Salaam, Tanzania. Land Use Policy, 23, 460–472

References
251
Kombe, W. J. 1994: The demise of public urban land management and the emergence of informal land markets in Tanzania. Habitat International, 18 (1), 23-43
Kombe, W. J. 1995: Formal and informal land management in Tanzania, the case of Dar es Salaam city. SPRING Research Series 13, Dortmund
Kombe, W. J. 2009: Women access to land and lroperty in sub-Saharan Africa: Policies, practices and the role of the informal land supply sector. In: Hill, A.; Weiß, K. (Eds.): Spatial planning with obstacles. 40 years of spatial planning in crisis regions and developing countries. Dortmunder Beiträge zur Raumplanung 133, Dortmund: Institut für Raumplanung, 31-54
Kombe, W. J.; Kreibich, V. 2000a: Reconciling informal and formal land management: An agenda for improving tenure security and urban governance in poor countries. Habitat International, 24 (2), 231-240
Kombe, W. J.; Kreibich, V. 2000b: Informal land management in Tanzania. SPRING Research Series 29, Dortmund
Kombe, W.; Kreibich, V. 2006: The governance of informal urbanisation in Tanzania. Mkuki na Nyota Publishers, Dar es Salaam
Kraas, F.; Mertins, G. 2008: Megastädte in Entwicklungsländern – Vulnerabilität, Informalität, Regier- und Steuerbarkeit. Geographische Rundschau, 11/2008, 4-10
Kreibich, V.; Hill, A.; Hühner, T.; Lindner, C. 2008: Informelle Stadterweiterung und die Versorgung mit technischer Infrastruktur in der zukünftigen Megacity Dar es Salaam, Tansania. Geographische Rundschau, 11/2008, 12-19
Krugman, P. 1996: The self-organizing economy. Blackwell, Malden, MA Kuhn, T. S. 1962/1981: Die Struktur wissenschaftlicher Revolutionen. Frankfurt a. M. Kulaba, S. 1989: Local government and the management of urban services in Tanzania.
In: Stren, E. E.; White, R. R. (Eds.): African cities in crisis - Managing rapid urban growth. Westview Press, Boulder, Colo
Kunzmann, K. R. 2005: Urban planning in the north: Blueprint for the south? In: Keiner, M.; Koll-Schretzenmayr, M.; Schmid, W. A. (Eds.) 2006: Managing urban futures – Sustainability and urban growth in developing countries. Ashgate, Aldershot
Kyessi, A. G. 2002: Community participation in urban infrastructure provision – Servicing informal settlements in Dar es Salaam. SPRING Research Series 33, Dortmund
Langram, G. 1992: Time in geographic information systems. Taylor & Francis, London, New York, Philadelphia
Laszlo, E. (Ed.) 1972: The relevance of general system theory. Papers presented to Ludwig von Bertalanffy on his Seventieth Birthday. George Braziller, New York
Laszlo E, 1977: The Club of Rome of the future vs. the future of the Club of Rome. In: Laszlo, E.; Bierman J. (Eds.): Goals in a global community: The original background papers for goals for mankind, a report to the Club of Rome: Volume I - Studies on the Conceptual Foundations. Pergamon Press, New York, 281-285
Le Monde Diplomatique 2006: Atlas der Globalisierung. taz, Berlin Le Monde Diplomatique 2009: Atlas der Globalisierung – Sehen und verstehen, was die
Welt bewegt. taz, Berlin Lee, C. 1973: Models in planning - An introduction to the use of quantitative models in
planning. Pergamon Press, Oxford, New York, Toronto, Sydney, Braunschweig Lee-Smith, D. 1989: Urban management in Nairobi: A case study of the matatu mode of
public transport. In: Stren, E. E.; White, R. R. (Eds.): African cities in crisis - Managing rapid urban growth. Westview Press, Boulder, Colo

References
252
Ling, A. (Ed.) 1988: Urban and regional planning and development in the Commonwealth. Howell Publications, Howell
Lloyd, S. 2006: Programming the universe - A quantum computer scientist takes on the Cosmos. Knopf, New York
Lo, F.-C.; Yeung, Y.-M. (Eds.) 1996: Emerging world cities in Pacific Asia. United Nations University Press, Tokyo
Loonen, W.; Koomen, E.; Kuijpers-Lind, M. 2007: Calibrating and validating the land use scanner algorithms. 15th European Colloquium on Theoretical and Quantitative Geography, September 7th-11th 2007, Montreal, Switzerland
Lösch, A. 1940: Die räumliche Ordnung der Wirtschaft. Eine Untersuchung über Standort, Wirtschaftsgebiete und internationalen Handel. Fischer, Jena
Lowry, I. S. 1965: A short course in model design. Journal of the American Planning Association, 31(2), 158-166
Lowry, I. S. 1968: Seven models of urban development. In: Hemmens, G. (Ed.): Urban development models. Special Report 97, Highway Research Board, Washington DC
Lückenkötter, J.; Fieger, A.; Roger, F. 1994: Improvement of squatter settlements: Between successful community organisations and lack of cooperation - A case study of self-help activities in squatter settlements in Dar es Salaam. Unpublished report, München
Lupala, A. 2002: Peri-urban land management for rapid urbanisation. The case of Dar es Salaam. SPRING Research Series 32, Dortmund
Lupala, J. 2002: Urban types in rapidly urbanizing cities - Analysis of formal and informal settlements in Dar es Salaam, Tanzania. Doctoral Thesis submitted to the Department of Infrastructure, Royal Institute of Technology, Stockholm
Lupala, A.; Kreibich, V. 2008: A case study from Dar es Salaam: Urban agriculture – A key to food security? Rural, 21 (1) 19-20
Lyimo, T. J.; Mushi, D. 2005: Sulfide concentration and redox potential patterns in mangrove forests of Dar es Salaam: Effects and avicennia marina and rhizophora mucronata seedling establishment. Western Indian Ocean Journal of Marine Science 4(2), 163-173
MacKinder, H. 1902: Britain and the British Seas. Heineman, London Maier, G.; Tödtling, F. 2006: Regional- und Stadtökonomik 1. Standorttheorie und
Raumstruktur. Springer, Wien, New York Maier, J. 2005: Welcome to the Bangkok slaughterhouse: The battle for human dignity in
Bangkok’s bleakest slums. Periplus Editions/Berkeley Books Pte Ltd., Singapore Malczewski, J. 1999: GIS and multicriteria analysis. John Wiley & Sons, New York,
Chichester, Weinheim, Brisbane, Singapore, Toronto Mamuya, I. 2008: What has gone wrong? Development and cooperation, 35 (7/8), 279-
281 Manning, C.; Mashigo, P. 1993: Manufacturing in micro-enterprises in South Africa.
Unpublished report submitted to the Industrial Strategy Project, University of Cape Town
Marceau, D. J. 1999: `The scale issue in the social and natural sciences.' Canadian Journal of Remote Sensing/Journal Canadien de Télédétection 25, 347-356
Marshall, A. 1916 (1890): Principles of economics. Vol. 1. Macmillan, London May, R. M. 1976: Simple mathematical models with very complicated dynamics. Nature,
261, 459-467

References
253
Mbuligwe, S. E.; Kassenga, G. R. 1997: Automobile air pollution in Dar es Salaam City, Tanzania. The Science of the Total Environment, 199, 227-235
McLoughlin, J. B. 1969: Urban and regional planning – A systems approach. Faber and Faber, London
Meadows D. H.; Meadows, D. L.; Randers, J. 1992: Beyond the limits: Confronting global collapse, envisioning a sustainable future. Chelsea Green, Post Mills, VT
Meadows, D. H.; Meadows, D. L.; Randers, J.; Behrens, W. W. III 1972: The limits to growth: A report for the Club of Rome's project on the predicament of mankind. Universe Books, New York
Ménard, A.; Marceau, D. J. 2005: Exploration of spatial scale sensitivity in geographic cellular automata. Environment and Planning B: Planning and Design, 32 (5), 693-714
Mertins, G. 1992: Urbanisierung, Metropolisierung und Megastädte. Ursachen der Stadt“explosion“ in der Dritten Welt. In: Deutsche Gesellschaft für die Vereinten Nationen (Ed.): Mega-Städte – Zeitbomben mit globalen Folgen. Dokumentationen, Informationen, Meinungen, 44, Bonn, 7-21
Mertins, G. 2009: Riskiert die Megastadt sich selbst? Herausforderung Mega-Urbanisierung. Politische Ökologie 114, 12-15
Moeckel, R. 2007: Business location decisions and urban sprawl - A microsimulation of business relocation and firmography. Blaue Reihe, Dortmunder Beiträge zur Raumplanung, Vol. 129, Dortmund
Molenaar, M. 1998: An introduction to the theory of spatial object modelling for GIS. Taylor & Francis, London, Bristol
Morrill, R.; Gaile, G. L.; Thrall, G. I. 1988: Spatial diffusion. Scientific Geography Series, Vol. 10. Sage Publications, Newbury Park, Beverly Hills, London, New Delhi
Msangi, D. 2009: Informal sub-centres in Dar es Salaam. Unpublished report at Ardhi University, Dar es Salaam
Musto, S. A. 1975: Wandlungstendenzen in der Gesellschaftsplanung. Soziale Welt, 26 (3), 293-309
Myers, D.; Kitsuse, A. 2000: Constructing the future in planning: A survey of theories and tools. Journal of Planning Education and Research, 19, 221-231
Nakajima, T. 1977: Application de la théorie de l’automate à la simulation de l’évolution de l’espace urbain. In Congrès Sur La Méthodologie De L’Aménagement Et Du Dévelopment. Montreal: Association Canadienne-Francaise Pour L’Avancement Des Sciences et Comité De Coordination Des Centres De Recherches En Aménagement, Développement Et Planification (CRADEP)
Nnkya, T. J. 2006: Collaborative turn in planning practice? A case. Unpublished paper at the Department of Urban and Regional Planning, University College of Lands and Architectural Studies, Dar es Salaam
O’Sullivan, D., Torrens, P. M. 2000: Cellular models of urban systems. CASA Working Paper 22, Centre for Advanced Spatial Analysis, University College London, London
Okpala, D. C. I. 1987: Received concepts and theories in African urbanisation studies and urban management strategies: A critique. Urban Studies, 24, 137-150
Ott, T.; Swiaczny, F. 2001: Time-integrative geographic information systems. Berlin, Heidelberg
Park, R. E.; Ernest W. B.; McKenzie, R. D. 1925: The City. University of Chicago Press, Chicago, London

References
254
Payne, G. 2000: Lowering the ladder: Regulatory frameworks for sustainable development. 17th Inter-Schools Conference on Sustainable Cities: Sustainable Development. Oxford, UK
Payne, G.; Majale, M. 2004: The urban housing manual: Making regulatory frameworks work for the poor. Earthscan, London, Sterling, VA
Phelps R.; Chan, C.; Kapsalis, S. C. 2001: Does scenario planning affect performance? Two exploratory studies. Journal of Business Research, 51 (3), 223-232
Porter, M. E. 1993: Nationale Wettbewerbsvorteile, Ueberreuter, Wien Potts, D. 1997: Urban lives: Adopting new strategies and adapting rural links. In: Rakodi,
C. (Ed.): The urban challenge in Africa - Growth and management of its large cities. United Nations University Press, Tokyo, New York, Paris, 447-494
Pucher, J. 2001: Renaissance of public transport in the United States? Transportation Quarterly, 56 (1), 33-49
Quinn, J. A. 1950: Human ecology. Prentice-Hall, New York Rajack, R. 2008: Urban expansion, public land management and land market outcomes.
Presentation at the 4th World Urban Forum, November 2008, Nanjing, China Rakodi, C. 1997a: Introduction. In: Rakodi, C. (Ed.): The urban challenge in Africa -
Growth and management of its large cities. United Nations University Press, Tokyo, New York, Paris, 1-13
Rakodi, C. 1997b: Global forces, urban change, and urban management in Africa. In: Rakodi, C. (Ed.): The urban challenge in Africa - Growth and management of its large cities. United Nations University Press, Tokyo, New York, Paris, 17-73
Rakodi, C. 1997c: Residential property markets in African cities. In: Rakodi, C. (Ed.): The urban challenge in Africa - Growth and management of its large cities. United Nations University Press, Tokyo, New York, Paris, 371-410
Rakodi, C. 1997d: Conclusions. In: Rakodi, C. (Ed.): The urban challenge in Africa - Growth and management of its large cities. United Nations University Press, Tokyo, New York, Paris, 553-594
Rakodi, C. 2005: The urban challenge in Africa. In: Keiner, M.; Koll-Schretzenmayr, M.; Schmid, W. A. (Eds.): Managing urban futures – Sustainability and urban growth in developing countries. Ashgate, Aldershot, Burlington, 47-70
Rapoport, A. 1966: Mathematical aspects of general systems theory. General Systems, 11, 3-11.
Ratcliff, R. U. 1949: Urban land economics. McGraw-Hill, New York Ratzel, F. 1891: Antropogeographie. 2 Bände, Neuauflage 1975, Darmstadt REPOA (Research on Poverty Alleviation) 2005: Project Brief No. 1, Formative process
research on the local government reform in Tanzania. Dar es Salaam Ribbeck, E. 2005: Die Welt wird Stadt: Stadtbilder aus Asien, Afrika, Lateinamerika.
jovis, Berlin Ricardo, D. 1817: On the principles of political economy and taxation. John Murray,
London Rode, P. 2006: City design - A new planning paradigm? Urban age discussion paper,
February 2006, Cities Programme, London School of Economics, London Rödding, W. 2001: Einführung in die Systemwissenschaften für Raumplaner. Lecture
Script Winter Semester 2001/2002, Dortmund Rogerson, C. M. 1996: Urban poverty and the informal economy in South Africa’s
economic heartland. Environment and Urbanization, 6 (1), 167-181

References
255
Rogerson, C. M. 1997: Globalization or informalization? African urban economies in the 1990s. In: Rakodi, C. (Ed.): The urban challenge in Africa. Growth and management of its large cities. United Nations University Press, Tokyo, New York, Paris, 337-370
Ryan, B.; Gross, N. C. 1943: The diffusion of hybrid seed corn in two Iowa communities. Rural Sociology 8: 15-24
Salet, W.; Faludi, A. 2000: Three approaches to strategic planning. In: Salet, W.; Faludi, A. (Eds.): The revival of strategic spatial planning. Royal Netherlands Academy of Arts and Sciences, Amsterdam, 1-10
Samuelson, P. A. 1983: Thünen at two hundred. Journal of Economic Literature, 21, 1468-1488
Sargent, R. G. 1996: Some subjective validation methods using graphical displays of data. In: Proceedings of 1996 Winter Simulation Conference, 345-351
Sargent, R. G. 1998: Verification and validation of simulation models. In: Medeiros D. J.; Watson, E. F.; Carson, J. S.; Manivannan, M. S. (Eds.): Proceedings of the 1998 Winter Simulation Conference
Sawers, L. 1989: Urban primacy in Tanzania. Economic Development and Cultural Change, 37 (4), 841-859
Schätzl, L. 1998: Wirtschaftsgeographie 1 - Theorie. Schöningh, Paderborn Schelling, T. C. 2006: Micromotives and macrobehavior. Norton & Company, New York Schlesinger, S.; Crosbie, R. E.; Gagné R. E.; Innis, G. S.; Lalwani, C. S.; Loch, J.; Sylvester,
J.; Wright, R. D.; Kheir, N.; Bartos, D. 1979: Terminology for model credibility. Simulation, 32 (3), 103–104
Schönwandt, W.; Voigt, A. 2005: Planungsansätze. In: Akademie für Raumforschung und Landesplanung (ARL) (Ed.): Handwörterbuch der Raumordnung. ARL, Hannover, 769-776
Schrand, H. 1992: Verstädterung in Industrie- und Entwicklungsländern. In: Köck, H. (Ed.) Städte und Städtesysteme (Handbuch des Geographieunterrichts 4). Aulis Verlag Deubner, Köln, 366-379
Schwartz, P. 1996: The Art of the long view: Planning for the future in an uncertain world. Doubleday, New York
Schwentker, W. 2006: Die Megastadt als Problem der Geschichte. In: Schwentker, W. (Ed.): Megastädte im 20. Jahrhundert. Vandenhoeck & Ruprecht, Göttingen, 7-26
Semboloni, F. 2000: The dynamic of an urban cellular automata in a 3-D spatial pattern. Prepared for XXI National Conference Aisre: Regional and Urban Growth in a Global Market, September 20th-22nd, 2000, Palermo
Severo, C.; Taylor, M. 2001: Results of the Rapid District Assessment of Existing Public-Private Partnerships for Health Services Delivery. Report of the Management Sciences for Health Management & Leadership Development Project. Tanzania
Shi, W.; Pang, M. Y. C. 2000: Development of Voronoi-based cellular automata - An integrated dynamic model for Geographical Information Systems. International Journal of Geographical Information Science, 14 (5): 455–474
Silva, E.; Clarke, K. 2002: Calibration of the SLEUTH urban growth model for Lisbon and Porto, Portugal. Computer, Environment and Urban Systems, 26, 525-552
Simon, D. 1997: Urbanization, globalization, and economic crisis in Africa. In: Rakodi, C. (Ed.): The urban challenge in Africa - Growth and management of its large cities. United Nations University Press, Tokyo, New York, Paris, 74-108
Simon, H. A. 1962: The architecture of complexity. Proceedings of the American Philosophical Society, 106, 467-482

References
256
Simon, H. A. 1965: The architecture of complexity. General Systems, 10, 63-76 Sliuzas, R. V. 2004: Managing informal settlements. A study using geo-information in
Dar es Salaam, Tanzania. ITC Publication Series No. 112, Enschede Smith, A 1776: An inquiry into the nature and causes of the wealth of nations 1.
Whitestone, Dublin Solow, R. S. 1973: Rejoinder to 'A comment on some uses of mathematical models in
urban economics'. Urban Studies, 10, 259-270 Spiekermann, K.; Wegener, M. 2008: Modelle in der Raumplanung. Lecture Material,
Dortmund (available at: http://www.spiekermann-wegener.de/mir/pdf/ MIR1_1_211008.pdf, accessed December 5th 2009)
Stachowiak, H. 1965: Gedanken zur allgemeinen Theorie der Modelle. Studium Generale, 18, 423-463
Stevens, D.; Dragicevic, S.; Rothley, K. 2007: iCity: A GIS-CA modelling tool for urban planning and decision making. Environmental Modelling and Software, 22 (6), 761-773
Stratmann, B. 2007: Megastädte: Größe ohne Klasse? Zur Soziologie der Megaurbanisierung – Wissensstand und aktuelle Forschungsprogramme. Verlag Dr. Kovac, Hamburg
Stren, E. E.; White, R. R. (Eds.): African cities in crisis - Managing rapid urban growth. Westview Press, Boulder, Colo
Svensson, S. 1942: Bygd och yttervärld – Studier över förhållandet mellan nyheter och tradtion. In: Nordisk Museets handl. 15
Tarde, G.: 1903: The laws of imitation. Henry, Holt and Co., New York Taubmann, W. 1985: Verstädterung in der Dritten Welt. Geographie heute, 6 (32), 2-9 Taubmann, W. 1996: Weltstädte und Metropolen im Spannungsfeld zwischen
„Globalität“ und „Lokalität“. Geographie heute, 17 (142), 4-9 Taylor, D. R. F. 1991: GIS and developing nations. In: Maguire, D: J.; Goodchild, M. F.;
Rhind, D. W.: Geographical Information Systems principles and applications. New York, Longman Scientific and Technical. II, 71-84
Therkildsen, O. 1991: Public sector driven urbanization in Tanzania. African Urban Quarterly, 6, 252-256
Tobler, W. 1970: A computer movie simulating urban growth in the Detroit region. Economic Geography, 46 (2), 234-240
Tobler, W. 1979: Cellular geography. In: Gale, S.; Ollson, G. (Eds.): Philosophy in Geography. Kluwer, Dordrecht
Torrens, P. M. 2000a: How cellular models of urban systems work (1. Theory). CASA Working Paper 28, Centre for Advanced Spatial Analysis, University College London, London
Torrens, P. M. 2000b: How land-use-transportation models work. CASA Working Paper 20. Centre for Advanced Spatial Analysis, University College London, London
Torrens, P. M.; O’Sullivan, D. 2001: Editorial: Cellular automata and urban simulation: Where do we go from here? Environment and Planning B: Planning and Design, 28 (2), 163-168
Torrens, P. M.; Nara, A. 2007: Modeling gentrification dynamics: A hybrid approach. Computers, Environment and Urban Systems, 31, 337–361
Turvey, R. 1957: The economics of real property. George Allen & Unwin Ltd., London Ullman, E. L. 1941: A theory of location for cities. American Journal of Sociology, 46 ,
853-64

References
257
Ullman, E. L.; Harris, C. D. 1945: The nature of cities. In: Building the Future City. Annals of the American Academy of Political and Social Sciences 242, 7-17
UN (United Nations) 1993: World urbanization prospects: The 1992 revision. New York UN (United Nations) 2004a: Wallpaper on urban agglomerations 2003. New York UN (United Nations) 2004b: Wallpaper on urban and rural areas 2003. New York UN (United Nations) 2005: World population prospects: The 2004 revision – Highlights.
New York UN (United Nations) 2006a: Wallpaper on urban agglomerations 2005. New York UN (United Nations) 2006b: World urbanization prospects: The 2006 revision –
Highlights. New York UN (United Nations) 2007: World population prospects: The 2006 revision. New York UN (United Nations) 2008a: Urban population, development and the environment 2007.
New York UN (United Nations) 2008b: Wallpaper on urban agglomerations 2007. New York UN (United Nations) 2008c: World urbanization prospects: The 2007 revision -
Highlights. New York UNDP (United Nations Development Programme) 1993: Human development report
1993- People’s participation. New York UNDP (United Nations Development Programme) 1996: Human development report
1996 – Economic growth and human development. New York UNDP (United Nations Development Programme) 2006: Human development report
2006 - Beyond scarcity: Power, poverty and the global water crisis. New York UNDP (United Nations Development Programme) 2007: Human Development Report
2007/2008 - Fighting climate change: Human solidarity in a divided world. New York UN-HABITAT (United Nations Human Settlement Programme) 2002: Global urban
indicators database: Version 2. Nairobi UN-HABITAT (United Nations Human Settlement Programme) 2003: The challenge of
slums – Global report on human settlements 2003. Earthscan, Nairobi, London UN-HABITAT (United Nations Human Settlement Programme) 2007: State of the world’s
cities report 06/07 - Press Kit. New York UN-HABITAT (United Nations Human Settlement Programme) 2008a: The State of the
African cities 2008 - A framework for addressing urban challenges in Africa. Nairobi UN-HABITAT (United Nations Human Settlement Programme) 2008b: State of the
world’s cities 2008/2009 - Harmonious cities. New York URP (Department of Urban and Regional Planning, MSc. Urban Planning and
Management, 2005/2006 Academic year) 2006: The implication of twenty thousand plots project on the emerging city form of Dar es Salaam. Unpublished report, Dar es Salaam
URT (United Republic of Tanzania) 1956: Town and country planning ordinance URT (Unites Republic of Tanzania) 1979: Dar es Salaam Master Plan. Marshall Macklin
Monaghan, Ontario URT (United Republic of Tanzania, Prime Minister’s Office for Regional Administration
and Local Government & Dar es Salaam City Council) 2007: Consultancy services for the conceptual design of a long term integrated Dar es Salaam BRT system and detailed design for the initial corridor - Environmental and Social Impact Assessment (ESIA). Dar es Salaam

References
258
Velibeyoglu, K. 1999: Urban design in the postmodern context. Unpublished research paper, Izmir
Verma, G. D. 2003: Slumming India: A chronicle of slums and their saviours. Penguin Books, New Delhi
von Bertalanffy, L. 1968: General system theory – Foundation, development, application. George Braziller, New York
von Böventer, E. 1968: Walter Christallers zentrale Orte und periphere Gebiete. Geographische Zeitschrift, 56, 102-111
von Neumann, J. 1966: Theory of self-reproducing automata. Edited and completed by Burks, A., University of Illinois, Urbana
von Neumann, J.; Morgenstern, O. 1944: Theory of games and economic behavior. Princeton University Press, Princeton
von Thünen, J. H. 1990 (1826): Der isoli[e]rte Staat in Beziehung auf Landwirtschaft und Nationalökonomie, oder Untersuchungen über den Einfluß, den die Getreidepreise, der Reichthum des Bodens und die Abgaben auf den Ackerbau ausüben. Perthes, Hamburg
Vorlaufer, K. 2004: Urbanisierung/Verstädterung. In: Mabe, J. E. (Ed.): Das Afrika-Lexikon – Ein Kontinent in 1000 Stichwörtern. Metzler, Stuttgart, 663-671
Waddington, C. H. 1968: The character of biological form. In: White, L. L. (Ed.): Aspects of form. Lund Humphries, London, 43-52
Weaver, W. 1948: Science and complexity. American Scientist, 36, 536 Weber, A. 1909: Über den Standort der Industrien: Reine Theorie des Standorts. J. C. B.
More, Tübingen Wegener, M.; Fürst, F. 1999: Land-use transport interaction: State of the art. Berichte
aus dem Institut für Raumplanung 46, Dortmund White, R.; Engelen, G. 1993: Cellular automata and fractal urban form: A cellular
modelling approach to the evolution of urban land-use patterns. Environment and Planning A, 25, 1175-1199
White, R.; Engelen, G.; Uljee, I. 1997: The use of constrained cellular automata for high-resolution modelling of urban land-use dynamics. Environment and Planning B: Planning and Design, 24 (3), 323-343
White, R.; Engelen, G.; Uljee, I.; Lavalle, C.; Erlich, D. 1999: Developing an urban land use simulator for European cities. In: Fullerton, K. (Ed.): Proceedings of the 5th EC GIS workshop: GIS of tomorrow. European Commission, Joint Research Centre, 179-190
Wiener, N. 1961(1948): Cybernetics - Or control and communication in the animal and the machine. New York
Windhorst, H.-W. 1983: Geographische Innovations- und Diffusionsforschung. Erträge der Forschung, Band 189. Wissenschaftliche Buchgesellschaft, Darmstadt
Wirth, L. 1925: A bibliography of the urban community. In: Park, R. E.; Ernest W. B.; McKenzie, R. D. 1925: The City. University of Chicago Press, Chicago, London, 161-228
Wolfram, S. 1984a: Preface. Physica, 10D, vii–xii Wolfram, S. 1984b: Universality and complexity in cellular automata. Physica, 10D, 1-35 Wolfram, S. 1988: Complex systems theory. In: Emerging syntheses in science:
Proceedings of the Founding Workshops of the Santa Fe Institute, Addison–Wesley, Reading, MA., 183–189
World Bank 2002: Upgrading low income urban settlements - Country assessment report Tanzania

References
259
World Bank 2003: Land policies for growth and poverty reduction. A World Bank policy research paper, World Bank and Oxford University Press, Washington
World Bank 2009: World development report 2009. Washington DC World Bank and UNCHS (Habitat) 2000: Cities alliance for cities without slums: Action
plan for moving slum upgrading to scale, special summary edition. New Delhi Xiang, W.-N.; Clarke, K. C. 2003: The use of scenarios in land-use planning. Environment
and Planning B: Planning and Design, 30 (6), 885-909 Zanakis, S. H.; Evans, J. R.; Vazacopoulos, A. A. 1989: Heuristic methods and
applications: A categorized survey. European Journal of Operational Research, 43, 88-110
Zipf, G. K. 1949: Human behavior and the principle of last effort. Addison Wesley Press, Cambridge
Zlotnik, H. 2004: World urbanization: Trends and prospects. In: Champion, T.; Graeme, H. (Eds.): New forms of urbanization. Beyond the urban-rural dichotomy. Ashgate, Aldershot, 43-64
Websites Website CIA (Central Intelligence Agency, World Factbook):
https://www.cia.gov/index.html; accessed December 6th 2009 Website DFG (Deutsche Forschungsgemeinschaft, Schwerpunktprogramm Megastädte):
http://www.dfg.de/aktuelles_presse/information_fuer_die_wissenschaft/schwerpunktprogramme/archiv/info_wissenschaft_34_05.html; accessed January 2nd 2010
Website Emerging Megacities: http://www.emerging-megacities.org; accessed October 20th 2008
Website ESFS (Earth Sciences for Society): http://www.esfs.org; accessed October 20th 2008
Website Hypergeo: http://hypergeo.free.fr; accessed June 27th 2006 Website Knowledge Matters – Tanzania:
http://eonyango.blogspot.com/2008/12/construction-of-kigamboni-bridge-set.html; accessed December 6th 2009
Website LEAT (Lawyers' Environmental Action Team) 2008: http://www.leat.or.tz/publications/env.handbook/4.4.c.land.use.php; accessed October 20th 2008
Website Universität Köln: http://www.geographie.uni-koeln.de/megacities-spp/index_e.htm; accessed December 6th 2009
Website URT (United Republic of Tanzania, Population and housing census 2002): http://www.tanzania.go.tz/census/; accessed December 6th 2009