urban development and sustainable financial management...
TRANSCRIPT

Urban Development and Sustainable Financial Management in China
Ping ChewManaging DirectorStandard & Poor’s
Chongqing, February 2009

22/25/2009
Standard & Poor’s Ratings Scale
AAA ---------- Highest credit quality
AA
ABBB
• ----------------------- Investment grade cut-off
BBB
CCCCC
C
SD or D ------------------------ Debt in default
China (A+)
Applied to:
• Sovereign governments
• Local and regional governments
• Government related entities (GREs)
• Corporations
• Financial Institutions
Standard & Poor’s Ratings Scale

32/25/2009
• Unbiased independent evaluation of the creditworthiness of an entity or its securities. • Globally consistent against standard scale• Measure of probability of default: likelihood of timely and full payment of principal and interest.
• NOT an equity recommendation• NOT a recommendation to buy, sell, or hold securities• NOT an audit• NOT a measure of liquidity, market value, volatility• NOT a way of defining “good” or “bad” companies• NOT a direct assessment of corporate governance“
What is a Standard & Poor’s Credit Rating

42/25/2009
4.63 5.076.26
8.96
11.69
AAA AA A BBB BBSource: Standard & Poor’s Global Fixed Income Research
US Corporate Bond Yields (%)10 Year Bonds - as at January 14, 2009
Market Prices and S&P Credit Ratings

52/25/2009
Analytical Framework: Corporate Issuers
Financial Risk• Governance/Risk tolerance/Financial policies
• Accounting
• Cash flow adequacy
• Capital structure & asset protection
• Liquidity & short-term factors
Business Risk
• Country risk
• Industry factors
• Competitive position
• Profitability/Peer group comparisons
Quantitative and Qualitative Perspectives
62/25/2009
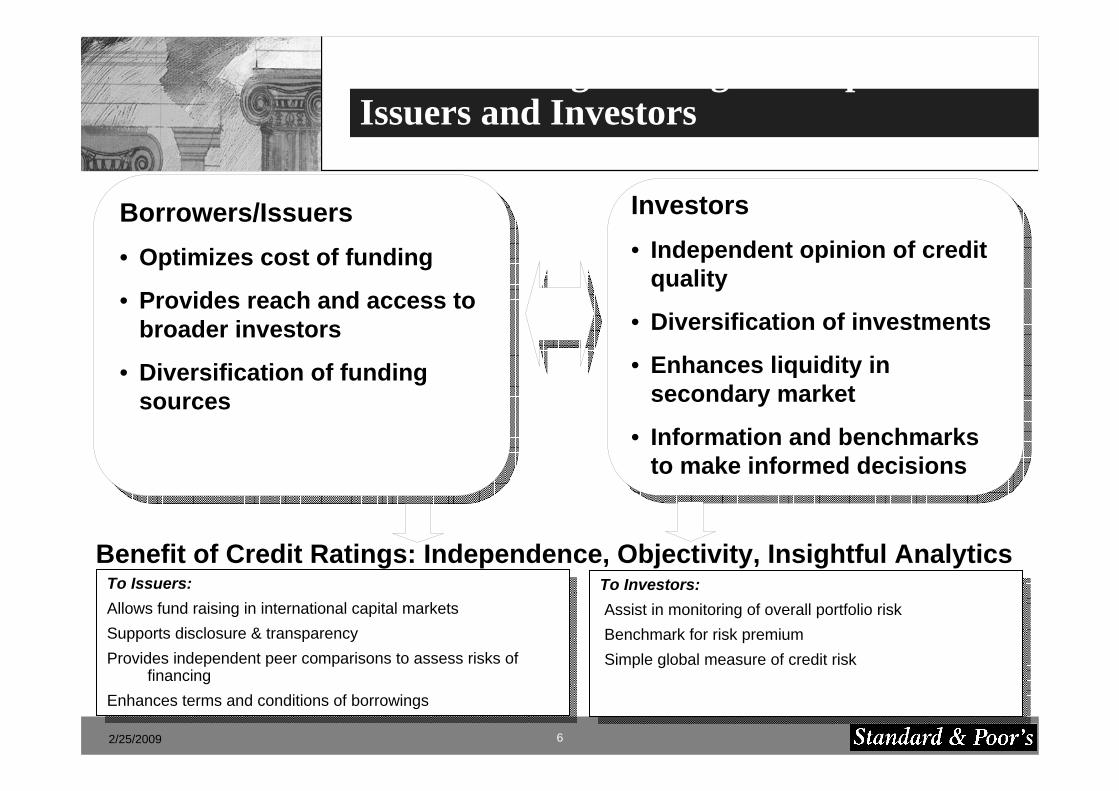
Role of Ratings: Filling the Gap Between Issuers and Investors
Investors• Independent opinion of credit
quality
• Diversification of investments
• Enhances liquidity in secondary market
• Information and benchmarks to make informed decisions
Borrowers/Issuers• Optimizes cost of funding
• Provides reach and access to broader investors
• Diversification of funding sources
To Issuers:Allows fund raising in international capital marketsSupports disclosure & transparencyProvides independent peer comparisons to assess risks of
financingEnhances terms and conditions of borrowings
Benefit of Credit Ratings: Independence, Objectivity, Insightful Analytics To Investors:Assist in monitoring of overall portfolio riskBenchmark for risk premiumSimple global measure of credit risk

72/25/2009
Relevance of S&P Credit Ratings to UDICs in China
• Helping municipal governments to better assess their contingentliabilities and investment portfolios form the bottom-up. • Helping UDICs to better balance their financial capacity with long-term performance goals. •Domestic evaluations of credit strength heavily influenced by UDIC relationship with government. Results likely to be more reflective of government support than company’s financial characteristics.• S&P credit rating process allow an independent assessment of the specific strengths and weaknesses of the companies concerned in terms of being supportive of creditworthiness.• S&P credit rating process provides an independent comparison interms of credit factors with relevant commercial peers in China (where available) and outside of China
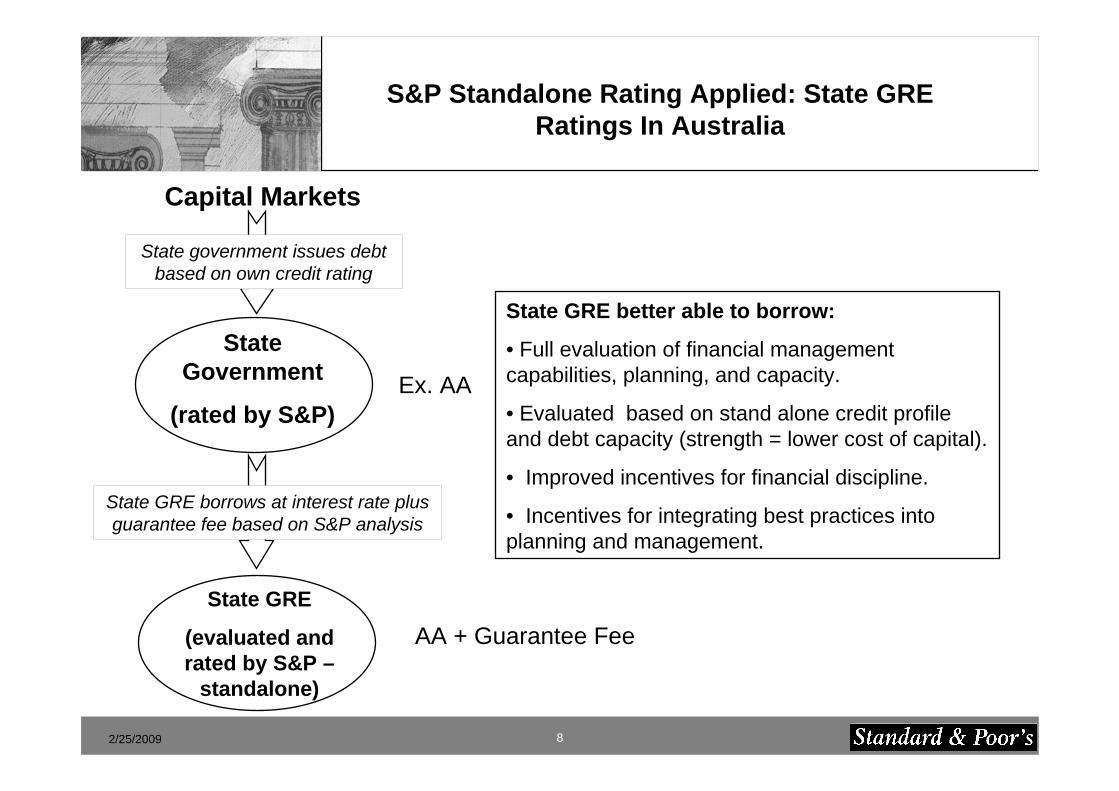
82/25/2009
State Government
(rated by S&P)
Capital Markets
State government issues debt based on own credit rating
State GRE borrows at interest rate plus guarantee fee based on S&P analysis
State GRE better able to borrow:
• Full evaluation of financial management capabilities, planning, and capacity.
• Evaluated based on stand alone credit profile and debt capacity (strength = lower cost of capital).
• Improved incentives for financial discipline.
• Incentives for integrating best practices into planning and management.
S&P Standalone Rating Applied: State GRE Ratings In Australia
State GRE
(evaluated and rated by S&P –
standalone)
Ex. AA
AA + Guarantee Fee

92/25/2009
What is an FMA?
FMA = Financial Management Assessment: is a comprehensive assessment of the financial management sophistication and quality of a public sector entity.
Public sector entities include local and regional governments (LRGs) and government related entities/companies (GREs).
FMA service is designed to: • Help understand specific strengths and weaknesses in key areas of an LRG/GRE
financial management;
• Benchmark against peers and global good practices in public finance;
• Help understand adequacy of the entity’s policies in the local context;
• Improve transparency of LRG/GRE finances, operations and management practices;
• Track progress in financial management;
• Help maximize fiscal and financial resources.

102/25/2009
Why FMA?
• Focus by Multilateral Institutions and Central Governments on building financial management capacity and accountability at subnational level• Growing demand for public sector transparency and accountability in emerging markets• Continuing public finance reforms across emerging markets• Growing need for global benchmarking of public finance quality • Need to enhance information provided by a credit rating/credit report• Assist LRGs/GREs better access and best manage proceeds from capital markets• Instill awareness of financial management and financial discipline
AND• Desire to leverage on S&P’s global experience and expertise in assessing quality of public finance management• S&P participation in the WB project in Russia 2001-2004: Code of Best Practices and over 50 other deliverables• S&P participation in WB Chongqing project: first FMA and standalone credit assessment.

112/25/2009
China - Local GRE Domestic Bond Issuance
0
20,000
40,000
60,000
80,000
2005 2006 2007 2008 2009Source: chinabond.com.cn
RM
B m
illio
n
0
500
1,000
1,500
2,000
RM
B m
illio
n
Total Issuance Avg. Issue Size (right scale)
No. of Issues 4 30 57 44 3* (as of 19 January 2009)
Total Issuance (2005-present): RMB 162.3 billion
Coupon Range: 4.0-8.35% (A – AAA)
Local GRE’s Re-Entering Debt Markets
122/25/2009
Current SOE/UDIC Borrowing Practices
• Heavy reliance on bank funding, often relying on a single bank for a large share of borrowing• Where bond financing is used, credit ratings assigned reflect mainly the guarantees rather than the credit quality of the issuer• Rudimentary and fragmented credit assessment systems in branches of the major commercial banks leads to:
• Dependence on guarantee and collaterals for lending decisions• Willing to increase lending to SOEs even when financials indicators are
weak, partly on account of expected government support• Preferred status of SOEs often reduce availability of financing to private businesses, especially during the monetary policy tightening of 2007 to early 2008• Current RMB4 trillion program and the decentralized nature of local government projects – are local governments and their entities ready to embark on borrowing?
132/25/2009
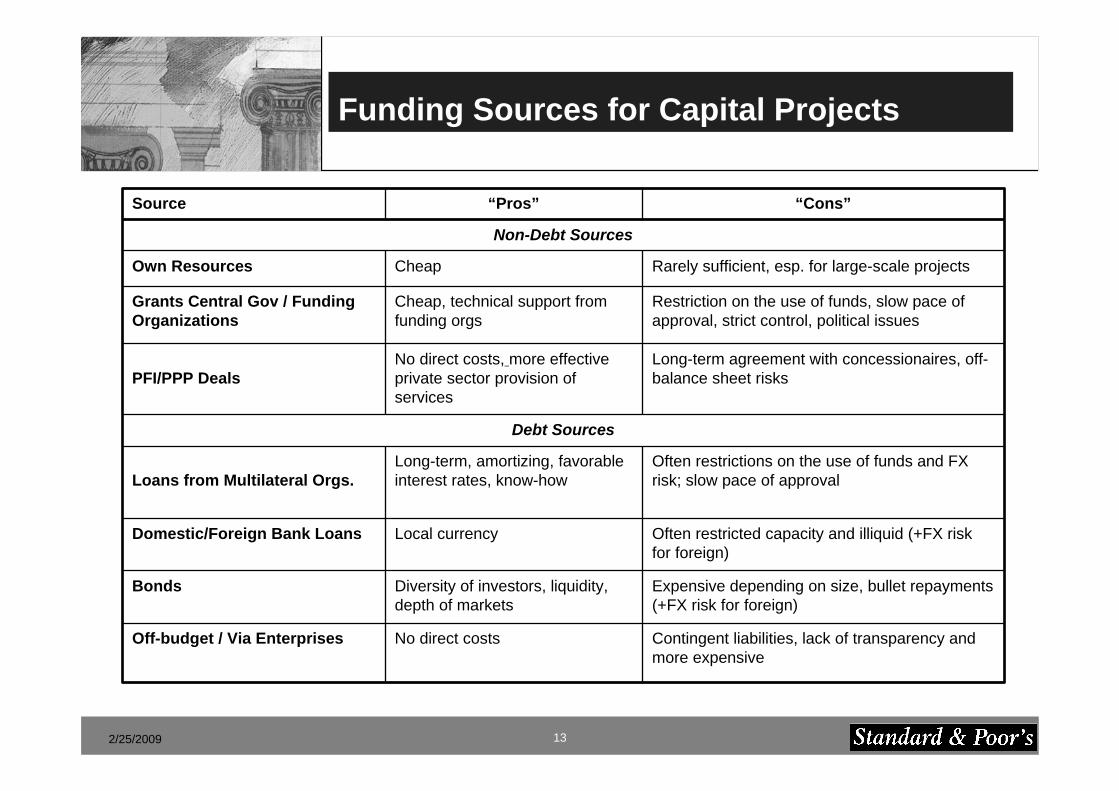
Contingent liabilities, lack of transparency and more expensive
No direct costsOff-budget / Via Enterprises
Expensive depending on size, bullet repayments (+FX risk for foreign)
Diversity of investors, liquidity, depth of markets
Bonds
Often restricted capacity and illiquid (+FX risk for foreign)
Local currencyDomestic/Foreign Bank Loans
Often restrictions on the use of funds and FX risk; slow pace of approval
Long-term, amortizing, favorable interest rates, know-howLoans from Multilateral Orgs.
Debt Sources
Long-term agreement with concessionaires, off-balance sheet risks
No direct costs, more effective private sector provision of services
PFI/PPP Deals
Restriction on the use of funds, slow pace of approval, strict control, political issues
Cheap, technical support from funding orgs
Grants Central Gov / Funding Organizations
Rarely sufficient, esp. for large-scale projectsCheapOwn Resources
Non-Debt Sources
“Cons”“Pros”Source
Funding Sources for Capital Projects

142/25/2009
Debt policy• Long-Term Strategy: Financial policy of the LRG should include guidelines on debt burden limits and debt
structure.• Public Sector Debt and Interests: Commercial risks could weaken government services. Debt should not be used
to fund operating expenditure and speculative financial investments. • Asset-Liability Matching - Short-term debt should be incurred for liquidity purposes only.• Multi-Year Budgeting: Consider future operating costs into financial projections.• Contingent Liabilities and Transparency: The government should analyze and publish data on its contingent
liabilities, including debt obligations and finances of government enterprises. • Narrow Role for Guarantees: Should be limited to the arrangement of funding for infrastructure and in order to
reduce borrowing costs. Guarantees should not be used as a “deferred payment” tool, when it is known upfront that the borrower will not fulfill its obligation.
Debt structure• Long-term debt should represent the majority of the debt portfolio.• The debt structure should allow for even repayment of principal across years. • Currency and interest risks should be hedged, where possible.• The debt portfolio should be diversified by the type of obligation and creditor.• Prioritized servicing of debt (discrimination of creditors) is possible only if required by borrowing terms and
conditions.• Detailed debt service and repayment forecasts should be prepared for the whole life of the longest obligation.
Good Practices in Debt Management: Policy and Structure
Good policy reduces borrowing costs

152/25/2009
Risks of Current Practices
• SOEs become highly leveraged relative to commercial peers. Liquidity risks are high due to heavy interest payments .
• Negative economic shocks could trigger a liquidity crisis at one or more SOEs and escalate risks of default.
• Similarly, an adverse change of opinion regarding the credit quality of the SOE could also cause liquidity problems
• Extensive cross-guarantees among SOEs creates the risk of a chain of defaults.

162/25/2009
Risks of Current Practices (cont’d)
• Government supervision rely on administrative rules (e.g. NDRC approval of projects) and focus mainly on protection of state assets and short term profitability.• Lack of market indicators and still developing risk management capabilities at local government agencies leads to weak oversight of SOE financial stability.• Current fiscal stimulus, driven by central government, could spur already debt-burdened SOEs to increase leverage still further. Financial fragility could deteriorate without market-based guidelines.• Importance of SOEs, especially UDICs, mean that local governments will very likely extend financial support to distressed entities. This would weaken the financial position of the government.• Should a number of key SOEs fall into financial distress simultaneously, the financial burden may rise beyond governments’ability to support. Further investments will fall steeply and services may be disrupted.
172/25/2009
Mission-orientation is high• UDICs strongly focused on their mission and quantitative targets in the respective five-year plans.• Project plans typically subject to close review by the companies involved and relevant authorities. • Detailed implementation plans are often made and progress monitored regularly.Financial policies often do not match up• Often inadequately capitalized due to the lack of funding on the part of the local government concerned. • Prudential guidelines regarding debt and liquidity often not formalised• Heavy reliance on bank debt and debt levels often high by standards of commercial firms due to the need to fulfill government mandated investment• Cash flows from operations often negative due to low profitability of their business operations or investments.
Initial Observations
182/25/2009
Distracting diversification• Struggle to balance the need to fund mandated investments, SASAC financial targets for top managers and cash-flow to stay afloat often prompt them to enter into ancillary or even unrelated activities to generate funds e.g. real estate development. • Local governments support by favorable regulations and selling prime land at below market priceBanks supportive despite high debt levels• Partly because of available collaterals such as completed facilities and land• Government support also considered favorably, especially when arrangements are made for stronger SOEs to guarantee loans to weaker ones• This creates a triangular creditor-debtor-guarantor relationship that may deepen credit risks when something goes wrong.
Initial Observations (cont’d)

192/25/2009
Weak Financial Measures – an illustration
Relatively strong operating performance
But leverage is higher than peers
Interest payments consumes much of profits
Cash flow is weak due to heavy investment and
interest payments
Bottomline is weak despite good operating
performanceCredit strength is below peers.
HK Peer #1
HK Peer #2
SOE Peer #1
SOE Peer #2 UDIC
Oper. income (bef. D&A)/revenues (%) 52.0 72.2 38.7 30.7 47.3
Total debt/debt plus equity (%) 55.3 27.9 68.8 53.9 76.3
Debt / EBITDA (x) 2.5 1.3 6.0 4.0 12.2
EBITDA interest coverage (x) 3.5 21.6 3.8 6.0 2.4
Funds from operations/debt (%) 29.3 64.1 11.5 22.0 9.4
Return on capital (%) 17.9 15.3 8.3 9.2 3.8

202/25/2009
Some UDICs Are Financially Weaker
UDIC #1 UDIC #2 UDIC #3 UDIC #4
Oper. income (bef. D&A)/revenues (%) 11.7 5.9 71.4 47.3
Total debt/debt plus equity (%) 72.0 51.0 75.0 76.3
Debt / EBITDA (x) 169.0 3.4 31.8 12.2
EBITDA interest coverage (x) 0.1 4.6 0.8 2.4
Funds from operations/debt (%) -4.6 21.7 -0.6 9.4
Return on capital (%) 1.4 17.7 0.0 3.8

212/25/2009
Financial Management Assessment – An Example
Sophistication and Adequacy of Systems &
Policies
Strategic management, organization structure, and corporate culture Intermediate (2)
Financial policies and planning Basic (1)
Operational management Sound (3)
Transparency and reporting Basic (1)
Ownership structure and government influences Basic (1)
Key governance structure, independence, and effectiveness Intermediate (2)
FMA Scale:
5 Advanced level of practices
4+
4 Sophisticated (mostly sound and advanced)
3+
3 Sound level of practices
2+
2 Intermediate (mostly basic and sound)
1+
1 Basic level of practices in most areas
0 Lack of many basic practices

222/25/2009
Financial Management Assessment (cont’d)
Strengths• Clear corporate objective that is well communicated at different levels of the organization• Stringent system of monitoring on the progress of its construction activities. Implementation Weaknesses• Lack of medium term financial planning, with much of such planning focused on near term needs.• Weak liquidity management practices that expose company to a higher level of liquidity risk than international peers.• Unsophisticated debt management system resulted in a concentration of liability base.

232/25/2009
Analytic services and products provided by Standard & Poor’s are the result of separate activities designed to preserve the independence and objectivity of each analytic process. Standard & Poor’s has established policies and procedures to maintain the confidentiality of non-public information received during each analytic process.

242/25/2009
FMA for Government Related Entities: Assessing Capacity and Constraints
Appendix
252/25/2009
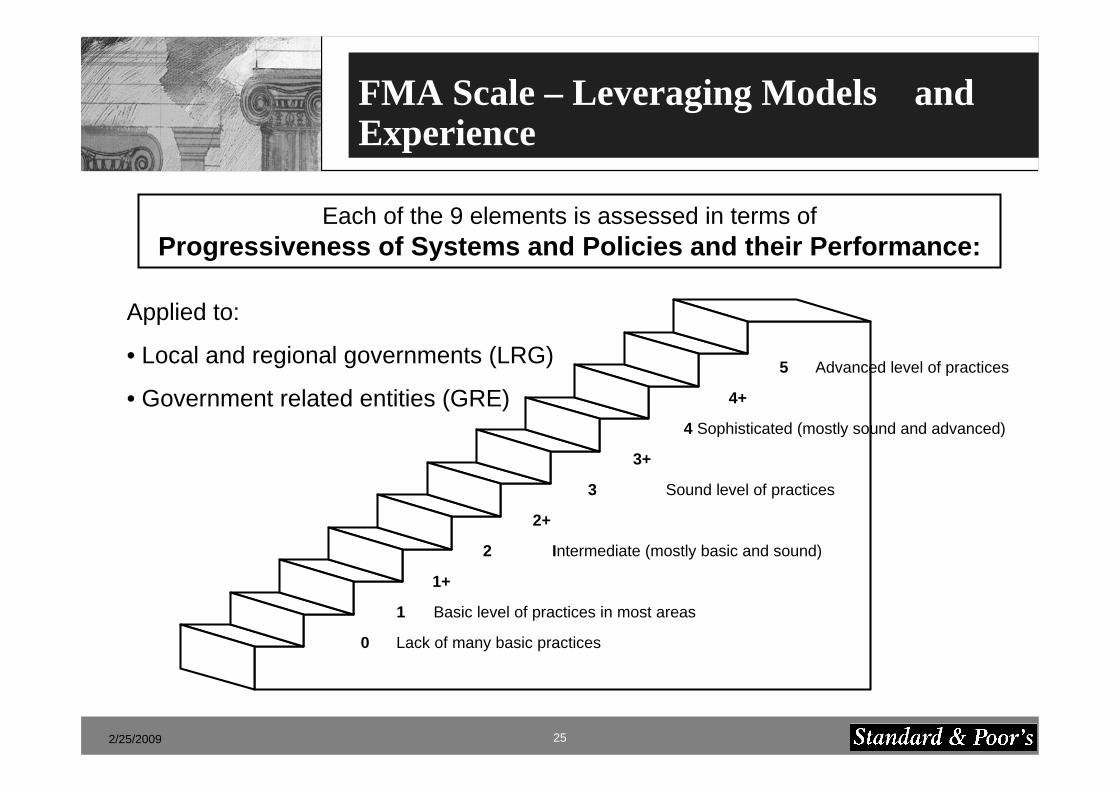
FMA Scale – Leveraging Models and Experience
5 Advanced level of practices
4+
4 Sophisticated (mostly sound and advanced)
3+
3 Sound level of practices
2+
2 Intermediate (mostly basic and sound)
1+
1 Basic level of practices in most areas
0 Lack of many basic practices
Each of the 9 elements is assessed in terms of Progressiveness of Systems and Policies and their Performance:
Applied to:
• Local and regional governments (LRG)
• Government related entities (GRE)

262/25/2009
Six analytical elements of FMA for GREs
1. Strategic management, organizational structure and corporate culture
2. Financial policies and planning
3. Operational management
4. Transparency and reporting
5. Ownership and board structure, and government relations
6. Key governance structures, independence and effectiveness
Analytical questions:
• What business processes, systems and policies are in place?
• How do they stand against principles of good practice and peer company practices? Are they adequate to the current environment and company’s needs?
• What is the performance level of these sets of business processes?
Analytical outcome:
• Opinion on strengths, weaknesses and risks of the company’s financial management systems and practices in the context of global good practices and local environment.

272/25/2009
FMA Analytical Framework: GREs
6. Key governance structures, independence and effectiveness
6a. Board of Directors / Management board / Committees / CEO
6b. Internal control
6c. Conflict of interest, related-party transaction
3. Operational management3a. Operating performance
3b. Sales and billing systems; supply management; working capital management; fixed assets management
3c. management experience and proficiency
5. Ownership structure and government influences5a. Ownership, regulatory and consumer roles
5b. Owner’s control and oversight from the government
5c. Influence from other stakeholders
4. Transparency and reporting4a. Public reporting
4b. Accounting policy/standards
4c. Financial statements
2. Financial policies and planning2a. Business (financial) plan
2b. Debt management
2c. Dividend policy
2d. Liquidity and cash management
2e. Risk management (insurance)
1. Strategic management, organizational structure and corporate culture
1a. Strategy
1b. Organizational structure
1c. Corporate culture

282/25/2009
Examples: Progressiveness vs. Performance
Overdue payables, cash shortages, average transaction turnover, …
Accounting basis, methods, coverage of budgeting, …
Auditing
Deviations from original budgets, timeliness, sudden revisions, …
Existence and sophistication of treasury systems, cash flow planning, …Liquidity management
Qualifications, sudden changes of auditors, severe delays in completion…Deviations from original budgets, timeliness, sudden revisions, …
Existence of internal and/or external audit of government financial statements, government entities…Budgeting
Performance IndicatorsProgressiveness of Systems and Policies
292/25/2009
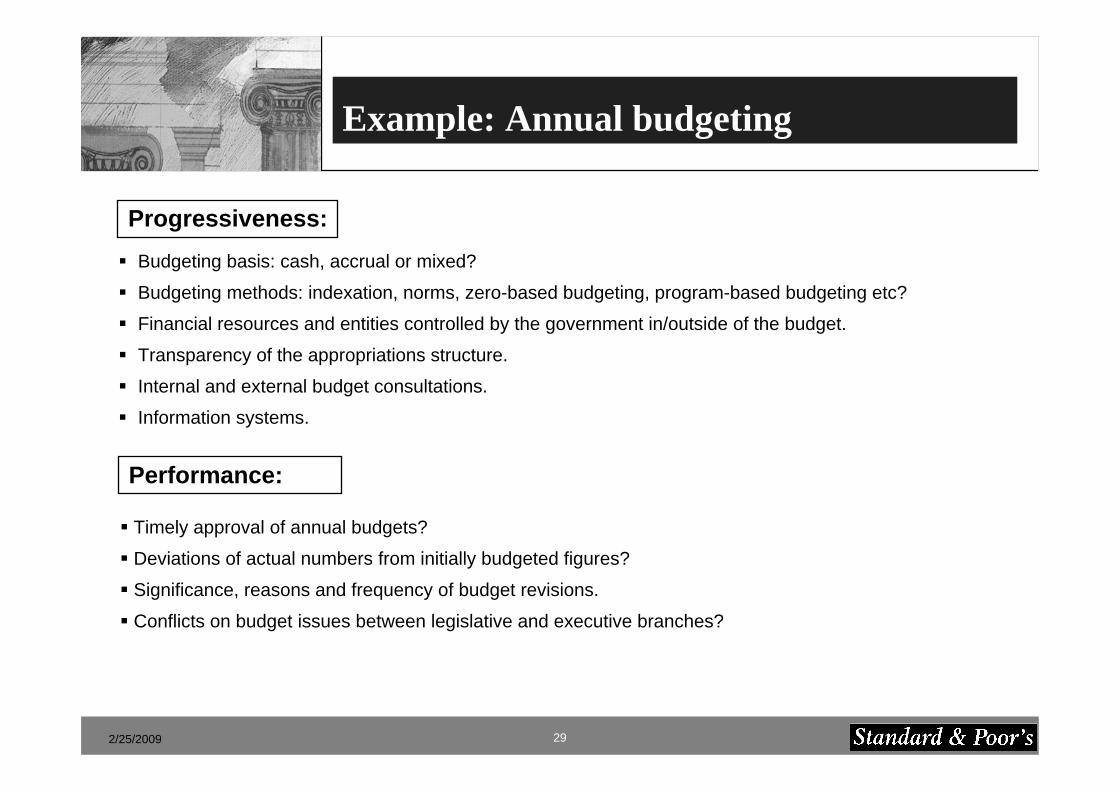
Example: Annual budgeting
Budgeting basis: cash, accrual or mixed?
Budgeting methods: indexation, norms, zero-based budgeting, program-based budgeting etc?
Financial resources and entities controlled by the government in/outside of the budget.
Transparency of the appropriations structure.
Internal and external budget consultations.
Information systems.
Progressiveness:
Timely approval of annual budgets?
Deviations of actual numbers from initially budgeted figures?
Significance, reasons and frequency of budget revisions.
Conflicts on budget issues between legislative and executive branches?
Performance:
302/25/2009
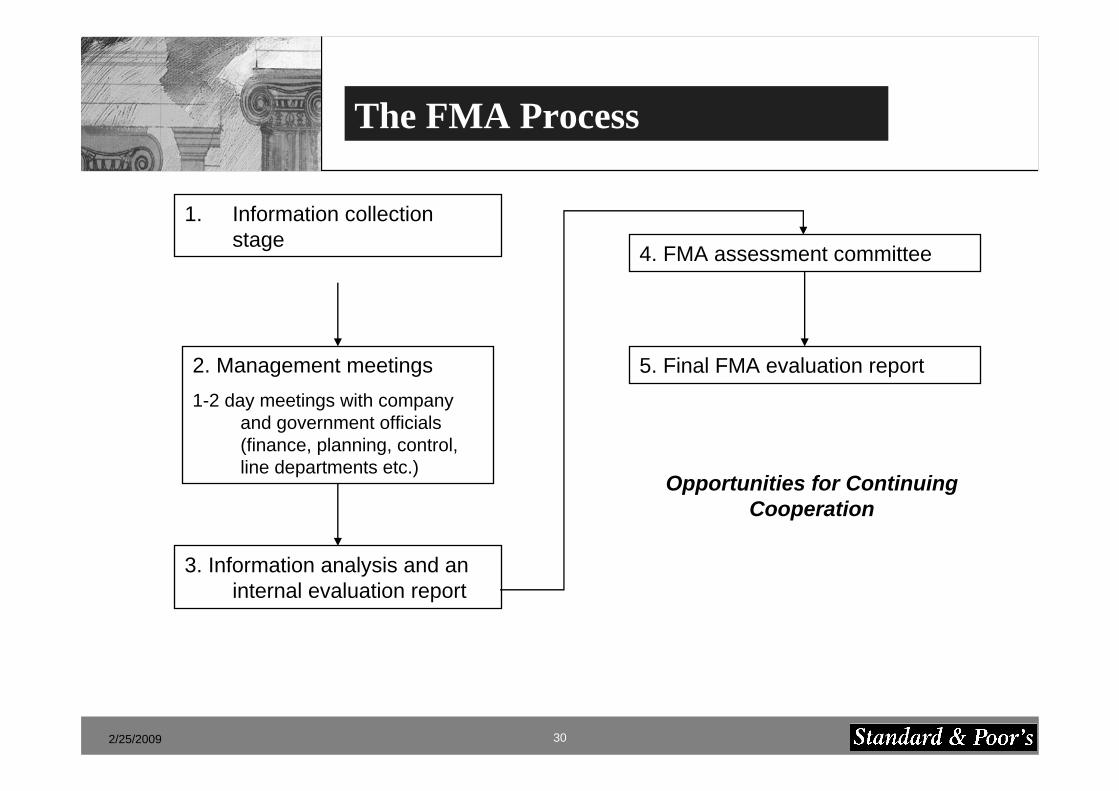
The FMA Process
1. Information collection stage
2. Management meetings1-2 day meetings with company
and government officials (finance, planning, control, line departments etc.)
3. Information analysis and an internal evaluation report
4. FMA assessment committee
5. Final FMA evaluation report
Opportunities for Continuing Cooperation

312/25/2009
FMA Output
Scores for 9 or 6 elements of financial management
Overview of key strengths and weaknesses
Peer comparison
Trends and challenges going forward
Summary table: strengths and weaknesses for each element
Comparison relative to best practices
Financial and economic statistics