uranium in hanford site 300 area
TRANSCRIPT
PNNL-22032 RPT-DVZ-AFRI-009
Prepared for the U.S. Department of Energy under Contract DE-AC05-76RL01830
Uranium in Hanford Site 300 Area: Extraction Data on Borehole Sediments G Wang RJ Serne MJ Lindberg W Um BN Bjornstad BD Williams IV Kutnyakov Z Wang N Qafoku November 2012
PNNL-22032 RPT-DVZ-AFRI-009
Uranium in Hanford Site 300 Area: Extraction Data on Borehole Sediments G Wang RJ Serne MJ Lindberg W Um BN Bjornstad BD Williams IV Kutnyakov Z Wang N Qafoku November 2012 Prepared for the U.S. Department of Energy under Contract DE-AC05-76RL01830 Pacific Northwest National Laboratory Richland, Washington 99352

iii
Executive Summary
In this study, sediments collected from boreholes drilled in 2010 and 2011 as part of a remedial investigation/feasibility study were characterized. The wells, located within or around two process ponds and one process trench waste site, were characterized in terms of total uranium concentration, mobile fraction of uranium, particle size, and moisture content along the borehole depth. In general, the gravel-dominated sediments of the vadose zone Hanford formation in all investigated boreholes had low moisture contents.
Based on total uranium content, a total of 48 vadose zone and periodically rewetted zone sediment samples were selected for more detailed characterization, including measuring the concentration of uranium extracted with 8 M nitric acid, and leached using bicarbonate mixed solutions to determine the liable uranium (U(VI)) contents. In addition, water extraction was conducted on 17 selected sediments.
Results from the sediment acid and bicarbonate extractions indicated the total concentrations of anthropogenic labile uranium in the sediments varied among the investigated boreholes. The peak uranium concentration (114.84 µg/g, acid extract) in <2-mm size fractions was found in borehole 399-1-55, which was drilled directly in the southwest corner of the North Process Pond. Lower uranium concentrations (~0.3–2.5 µg/g, acid extract) in <2-mm size fractions were found in boreholes 399-1-57, 399-1-58, and 399-1-59, which were drilled either near the Columbia River or inland and upgradient of any waste process ponds or trenches. A general trend of “total” uranium concentrations was observed that increased as the particle size decreased when relating the sediment particle size and acid extractable uranium concentrations in two selected sediment samples. The labile uranium bicarbonate leaching kinetic experiments on three selected sediments indicated a two-step leaching rate: an initial rapid release, followed by a slow continual release of uranium from the sediment. Based on the uranium leaching kinetic results, quasi-equilibrium can be assumed after 1000-h batch reaction time in this study.


v
Acknowledgments
Funding for this work was provided by the U.S. Department of Energy, Richland Operations Office as part of the Deep Vadose Zone Applied Field Research Initiative. The Pacific Northwest National Laboratory is operated by Battelle Memorial Institute for the U.S. Department of Energy. We greatly appreciate Pacific Northwest National Laboratory staff members Dennese Smith and Jeff Dermond for sample preparations, and Steven Baum for the uranium concentration measurement with the inductively coupled-plasma mass spectrometry. We appreciate the efforts of Kathy Neiderhiser and Hope Matthews for text processing and editing the document.


vii
Acronyms and Abbreviations
AE acid-extractable HEIS Hanford Environmental Information System ICP-MS inductively coupled-plasma mass spectrometry ND not done RI/FS remedial investigation/feasibility study RPM revolutions per minute UFA ultracentrifugation
Units of Measure
ft bgs feet below ground surface g gram kg kilogram L liter µ micro (prefix, 10-6) M molar (moles/L)


ix
Contents
Executive Summary .............................................................................................................................. iii Acknowledgments ................................................................................................................................. v Acronyms and Abbreviations ............................................................................................................... vii Units of Measure ................................................................................................................................... vii 1.0 Introduction and Background ....................................................................................................... 1.1
1.1 Remedial Investigation/Feasibility Study Drilling ............................................................... 1.1 1.2 Sample Collection ................................................................................................................ 1.3
2.0 Materials and Methods ................................................................................................................. 2.1 2.1 Sample Inventory ................................................................................................................. 2.1
2.1.1 Well 399-1-54 (Borehole C7653).............................................................................. 2.1 2.1.2 Well 399-1-55 (Borehole C7654).............................................................................. 2.1 2.1.3 Well 399-1-56 (Borehole C7655).............................................................................. 2.1 2.1.4 Well 399-1-57 (Borehole C7656).............................................................................. 2.4 2.1.5 Well 399-1-58 (Borehole C7657).............................................................................. 2.4 2.1.6 Well 399-1-59 (Borehole C7659).............................................................................. 2.4 2.1.7 Well 399-2-32 (Borehole C7660).............................................................................. 2.4 2.1.8 Well 399-3-33 (Borehole C7663).............................................................................. 2.4
2.2 Experimental Methods ......................................................................................................... 2.5 2.2.1 Sample Characterization ........................................................................................... 2.5
3.0 Analytical Results ......................................................................................................................... 3.1 3.1 Sediment from Well 399-1-54 (C7653) ............................................................................... 3.1
3.1.1 Moisture Content ....................................................................................................... 3.1 3.1.2 Uranium in Sediments from Well 399-1-54 .............................................................. 3.1
3.2 Sediment from Well 339-1-55 (C7654) ............................................................................... 3.3 3.2.1 Moisture Content ....................................................................................................... 3.3 3.2.2 Uranium in Sediments from Well 399-1-55 .............................................................. 3.3
3.3 Sediment from Well 339-1-56 (C7655) ............................................................................... 3.5 3.3.1 Moisture Content ....................................................................................................... 3.5 3.3.2 Uranium in Sediments from Well 399-1-56 .............................................................. 3.5
3.4 Sediment from well 339-1-57 (C7656) ................................................................................ 3.6 3.4.1 Moisture Content ....................................................................................................... 3.6 3.4.2 Uranium in Sediments from Well 399-1-57 .............................................................. 3.7
3.5 Sediment from Well 339-1-58 (C7657) ............................................................................... 3.8 3.5.1 Moisture Content ....................................................................................................... 3.8 3.5.2 Uranium in Sediments from Well 399-1-58 .............................................................. 3.8

x
3.6 Sediment from Well 339-1-59 (C7659) ............................................................................... 3.10 3.6.1 Moisture Content ....................................................................................................... 3.10 3.6.2 Uranium in Sediments from Well 399-1-59 .............................................................. 3.10
3.7 Sediment from Well 339-2-32 (C7660) ............................................................................... 3.12 3.7.1 Moisture Content ....................................................................................................... 3.12 3.7.2 Uranium in Sediments from Well 399-2-32 .............................................................. 3.12
3.8 Sediment from Well 339-3-33 (C7663) ............................................................................... 3.14 3.8.1 Moisture Content ....................................................................................................... 3.14 3.8.2 Uranium in Sediments from Well 399-3-33 .............................................................. 3.14
3.9 Extraction Results for Temporary Borehole Sediments ....................................................... 3.16 3.10 Labile Uranium Leaching Using Bicarbonate Solution ....................................................... 3.17 3.11 Particle-Size Effect on Uranium Concentrations ................................................................. 3.18
4.0 Discussion ..................................................................................................................................... 4.1 5.0 References .................................................................................................................................... 5.1 Appendix A – Photographs of Sediments Used in the PNNL Laboratory Leach/Extraction
Studies ........................................................................................................................... A.1 Appendix B – Initial Sediment Characterization Data .......................................................................... B.1
Figures
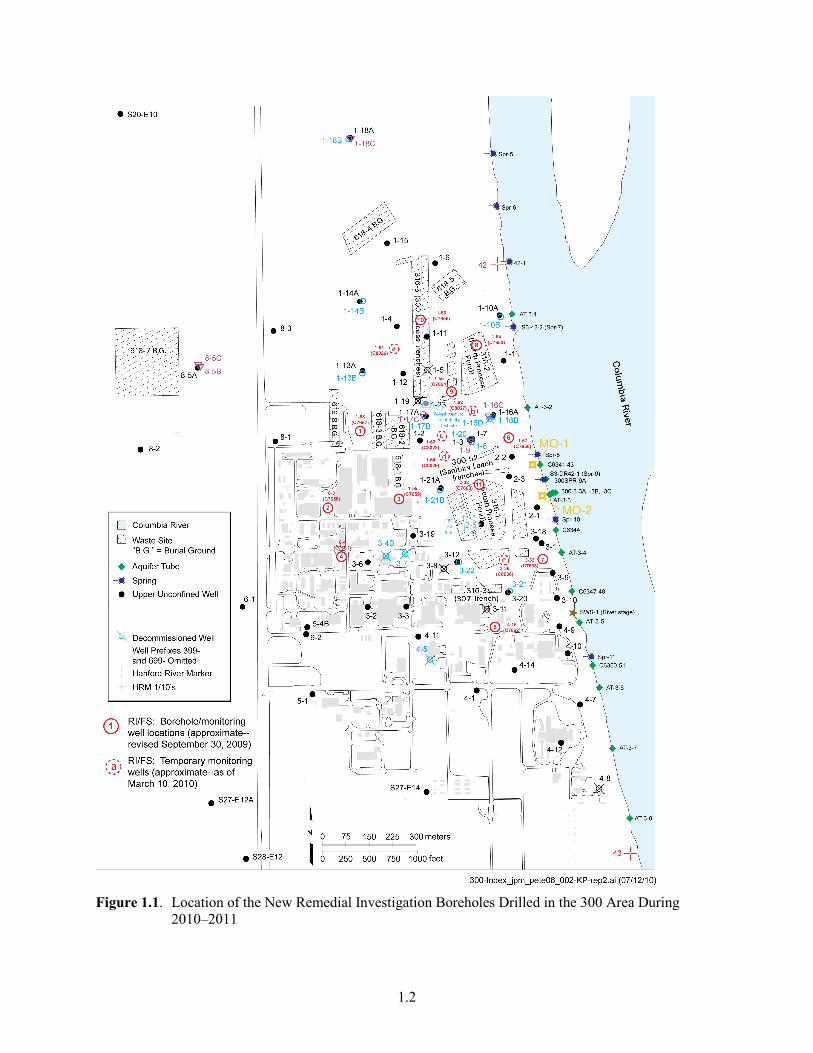
1.1 Location of the New Remedial Investigation Boreholes Drilled in the 300 Area During 2010–2011 ................................................................................................................................... 1.2
3.1 Concentrations of Acid-Extractable and Bicarbonate-Leachable Uranium, and Moisture Content versus Depth in Sediments from Well 399-1-54 ........................................................... 3.2
3.2 Concentrations of Acid-Extractable, Bicarbonate-Leachable Uranium, and Moisture Content versus Depth in Sediments from Well 399-1-55 ........................................................... 3.4
3.3 Concentrations of Acid-Extractable and Bicarbonate-Leachable Uranium, and Moisture Content versus Depth in Sediments from Well 399-1-56 ........................................................... 3.6
3.4 Concentrations of Acid-Extractable and Bicarbonate-Leachable Uranium, and Moisture Content versus Depth in Sediments from Well 399-1-57 ........................................................... 3.8
3.5 Concentrations of Acid-Extractable and Bicarbonate-Leachable Uranium, and Moisture Content versus Depth in Sediments from Well 399-1-58 ........................................................... 3.10
3.6 Concentrations of Acid-Extractable and Bicarbonate-Leachable Uranium, and Moisture Content versus Depth in Sediments from Well 399-1-59 ........................................................... 3.11
3.7 Concentrations of Acid-Extractable and Bicarbonate-Leachable Uranium, and Moisture Content versus Depth in Sediments from Well 399-2-32 ........................................................... 3.13
3.8 Concentrations of Acid-Extractable and Bicarbonate-Leachable Uranium, and Moisture Content versus Depth in Sediments from Well 399-3-33 ........................................................... 3.15
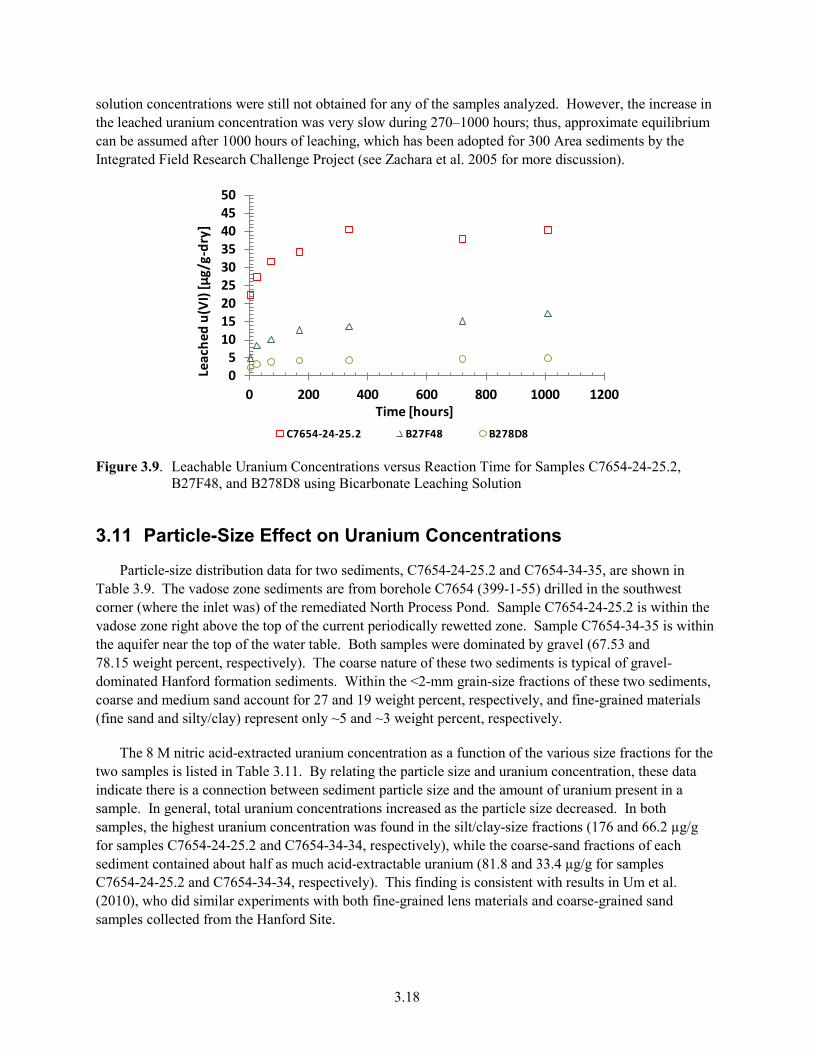
3.9 Leachable Uranium Concentrations versus Reaction Time for Samples C7654-24-25.2, B27F48, and B278D8 using Bicarbonate Leaching Solution ..................................................... 3.18
xi
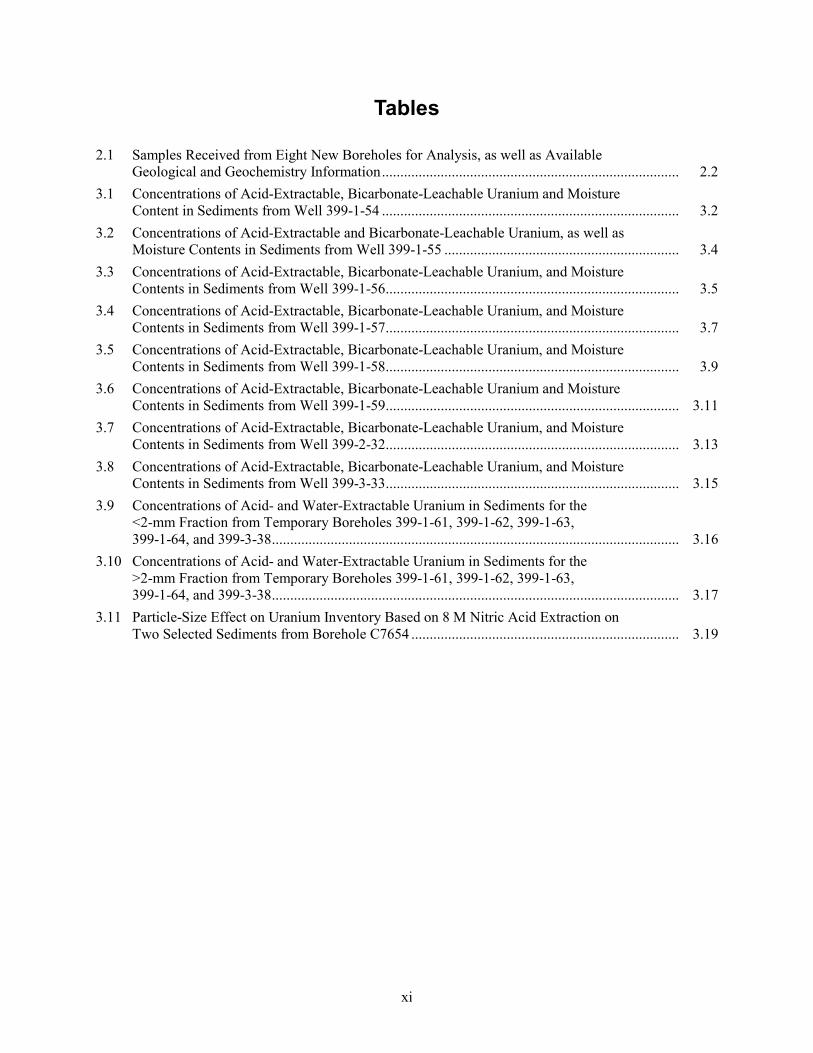
Tables
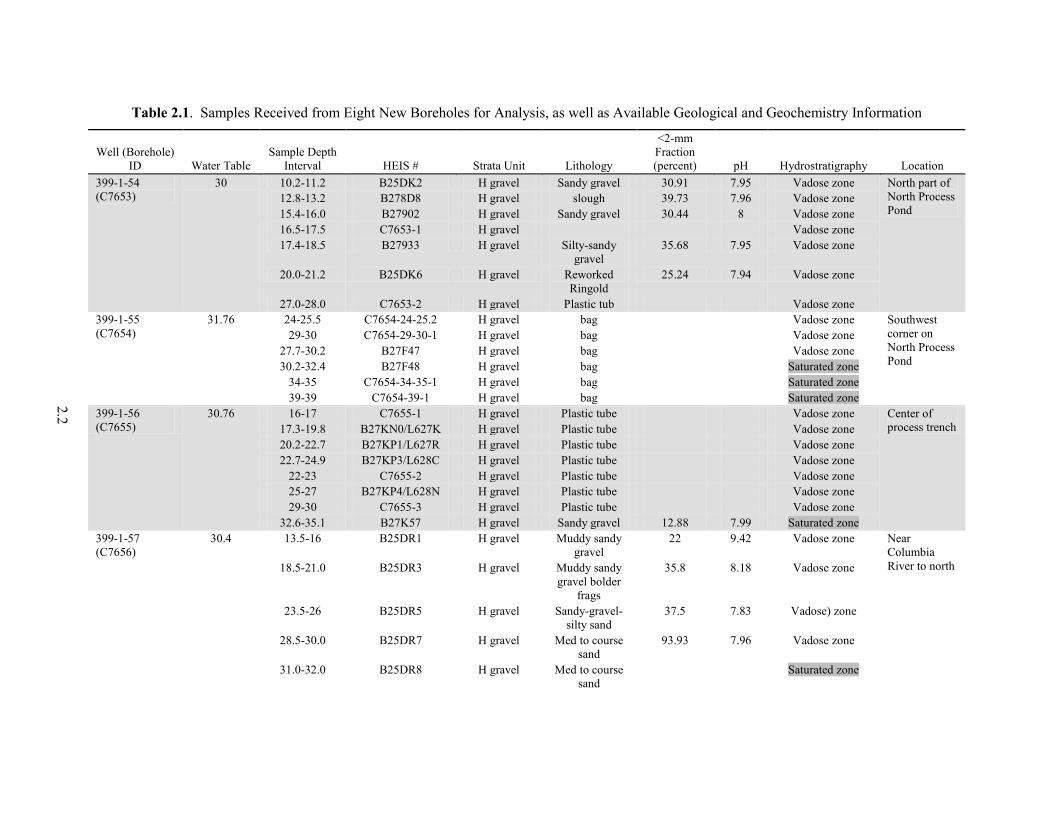
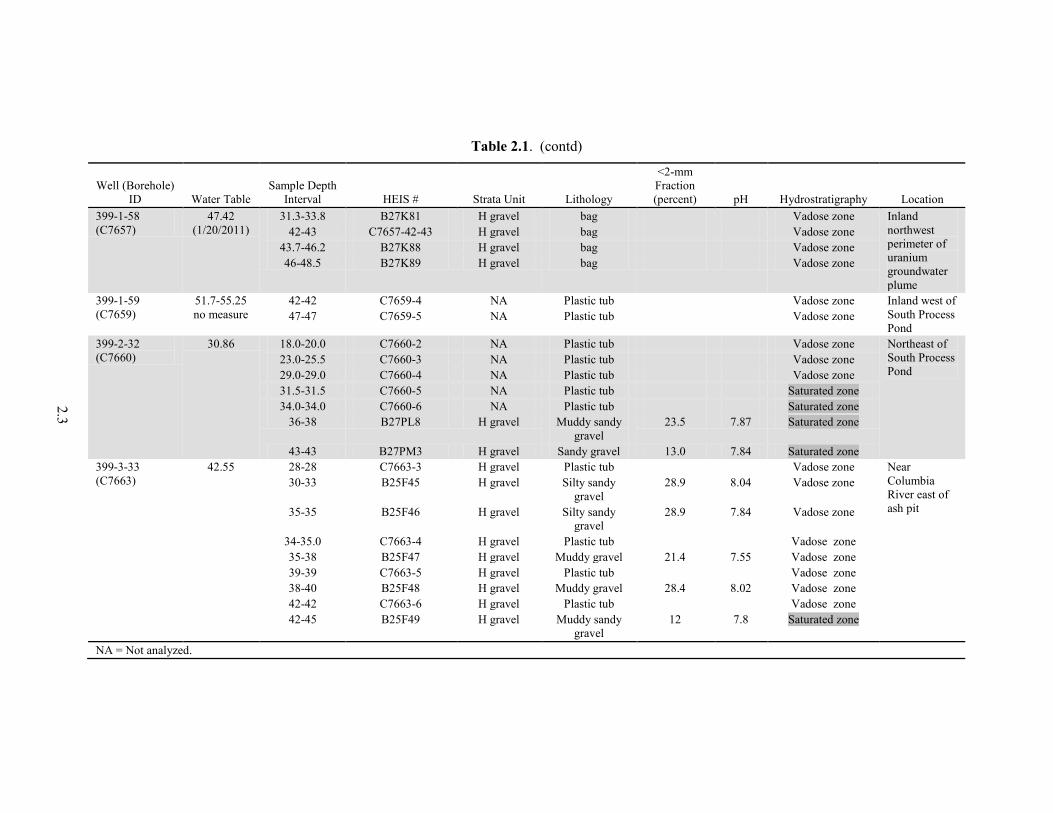
2.1 Samples Received from Eight New Boreholes for Analysis, as well as Available Geological and Geochemistry Information ................................................................................. 2.2
3.1 Concentrations of Acid-Extractable, Bicarbonate-Leachable Uranium and Moisture Content in Sediments from Well 399-1-54 ................................................................................. 3.2
3.2 Concentrations of Acid-Extractable and Bicarbonate-Leachable Uranium, as well as Moisture Contents in Sediments from Well 399-1-55 ................................................................ 3.4
3.3 Concentrations of Acid-Extractable, Bicarbonate-Leachable Uranium, and Moisture Contents in Sediments from Well 399-1-56 ................................................................................ 3.5
3.4 Concentrations of Acid-Extractable, Bicarbonate-Leachable Uranium, and Moisture Contents in Sediments from Well 399-1-57 ................................................................................ 3.7
3.5 Concentrations of Acid-Extractable, Bicarbonate-Leachable Uranium, and Moisture Contents in Sediments from Well 399-1-58 ................................................................................ 3.9
3.6 Concentrations of Acid-Extractable, Bicarbonate-Leachable Uranium and Moisture Contents in Sediments from Well 399-1-59 ................................................................................ 3.11
3.7 Concentrations of Acid-Extractable, Bicarbonate-Leachable Uranium, and Moisture Contents in Sediments from Well 399-2-32 ................................................................................ 3.13
3.8 Concentrations of Acid-Extractable, Bicarbonate-Leachable Uranium, and Moisture Contents in Sediments from Well 399-3-33 ................................................................................ 3.15
3.9 Concentrations of Acid- and Water-Extractable Uranium in Sediments for the <2-mm Fraction from Temporary Boreholes 399-1-61, 399-1-62, 399-1-63, 399-1-64, and 399-3-38 ............................................................................................................... 3.16
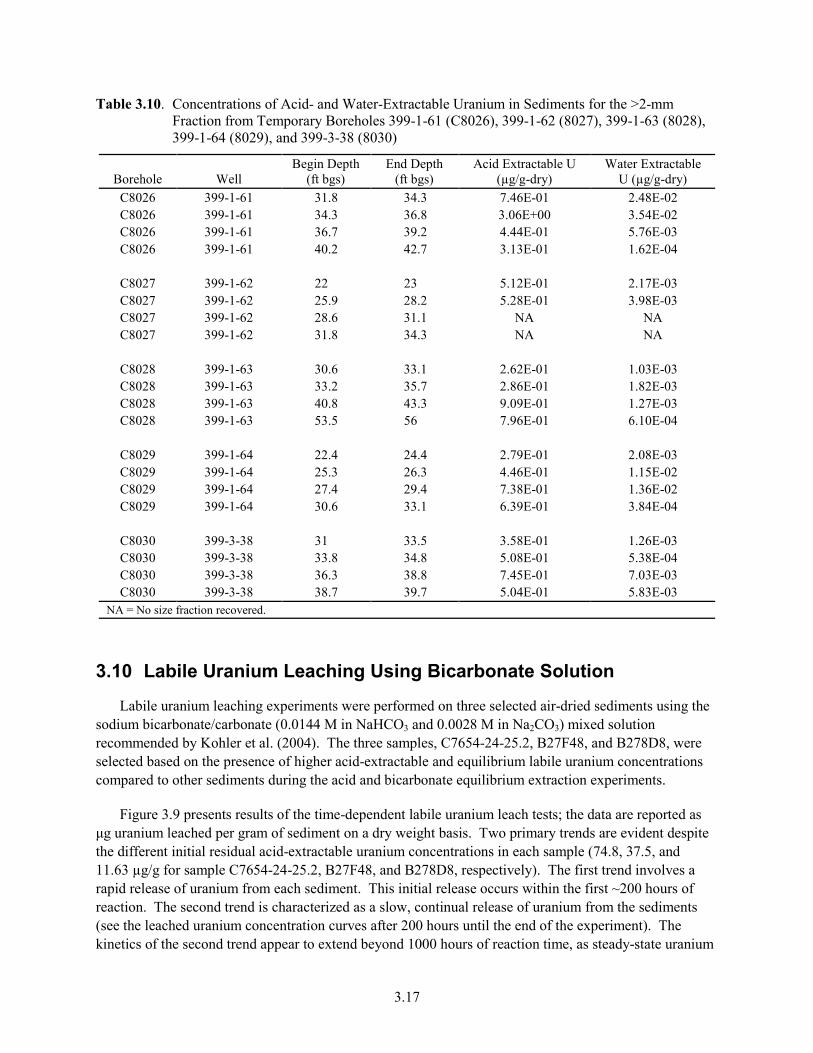
3.10 Concentrations of Acid- and Water-Extractable Uranium in Sediments for the >2-mm Fraction from Temporary Boreholes 399-1-61, 399-1-62, 399-1-63, 399-1-64, and 399-3-38 ............................................................................................................... 3.17
3.11 Particle-Size Effect on Uranium Inventory Based on 8 M Nitric Acid Extraction on Two Selected Sediments from Borehole C7654 ......................................................................... 3.19
1.1
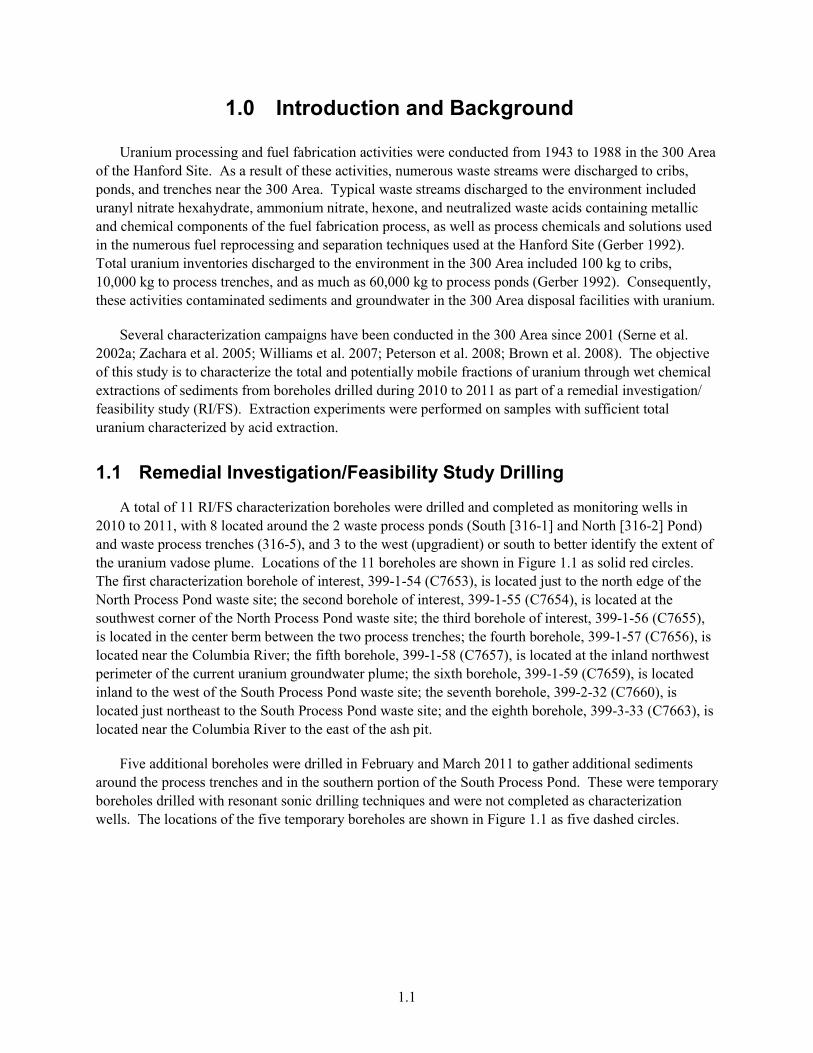
1.0 Introduction and Background
Uranium processing and fuel fabrication activities were conducted from 1943 to 1988 in the 300 Area of the Hanford Site. As a result of these activities, numerous waste streams were discharged to cribs, ponds, and trenches near the 300 Area. Typical waste streams discharged to the environment included uranyl nitrate hexahydrate, ammonium nitrate, hexone, and neutralized waste acids containing metallic and chemical components of the fuel fabrication process, as well as process chemicals and solutions used in the numerous fuel reprocessing and separation techniques used at the Hanford Site (Gerber 1992). Total uranium inventories discharged to the environment in the 300 Area included 100 kg to cribs, 10,000 kg to process trenches, and as much as 60,000 kg to process ponds (Gerber 1992). Consequently, these activities contaminated sediments and groundwater in the 300 Area disposal facilities with uranium.
Several characterization campaigns have been conducted in the 300 Area since 2001 (Serne et al. 2002a; Zachara et al. 2005; Williams et al. 2007; Peterson et al. 2008; Brown et al. 2008). The objective of this study is to characterize the total and potentially mobile fractions of uranium through wet chemical extractions of sediments from boreholes drilled during 2010 to 2011 as part of a remedial investigation/ feasibility study (RI/FS). Extraction experiments were performed on samples with sufficient total uranium characterized by acid extraction.
1.1 Remedial Investigation/Feasibility Study Drilling
A total of 11 RI/FS characterization boreholes were drilled and completed as monitoring wells in 2010 to 2011, with 8 located around the 2 waste process ponds (South [316-1] and North [316-2] Pond) and waste process trenches (316-5), and 3 to the west (upgradient) or south to better identify the extent of the uranium vadose plume. Locations of the 11 boreholes are shown in Figure 1.1 as solid red circles. The first characterization borehole of interest, 399-1-54 (C7653), is located just to the north edge of the North Process Pond waste site; the second borehole of interest, 399-1-55 (C7654), is located at the southwest corner of the North Process Pond waste site; the third borehole of interest, 399-1-56 (C7655), is located in the center berm between the two process trenches; the fourth borehole, 399-1-57 (C7656), is located near the Columbia River; the fifth borehole, 399-1-58 (C7657), is located at the inland northwest perimeter of the current uranium groundwater plume; the sixth borehole, 399-1-59 (C7659), is located inland to the west of the South Process Pond waste site; the seventh borehole, 399-2-32 (C7660), is located just northeast to the South Process Pond waste site; and the eighth borehole, 399-3-33 (C7663), is located near the Columbia River to the east of the ash pit.
Five additional boreholes were drilled in February and March 2011 to gather additional sediments around the process trenches and in the southern portion of the South Process Pond. These were temporary boreholes drilled with resonant sonic drilling techniques and were not completed as characterization wells. The locations of the five temporary boreholes are shown in Figure 1.1 as five dashed circles.
1.2
Figure 1.1. Location of the New Remedial Investigation Boreholes Drilled in the 300 Area During
2010–2011
1.3
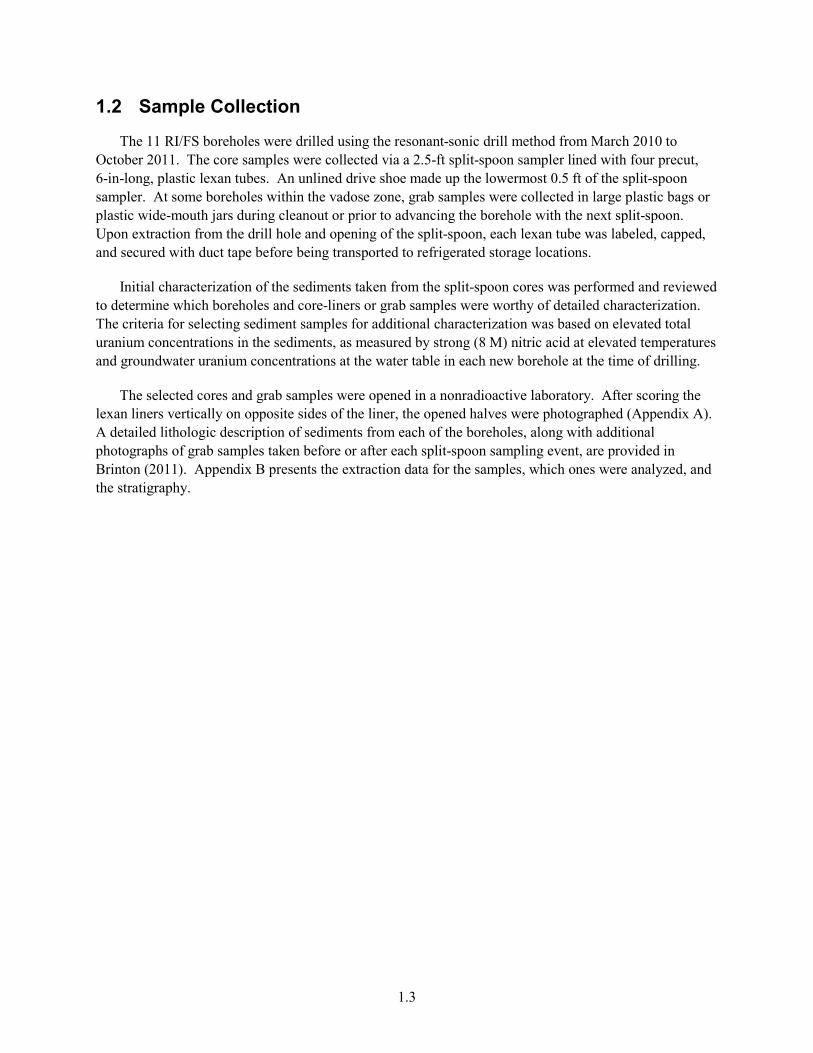
1.2 Sample Collection
The 11 RI/FS boreholes were drilled using the resonant-sonic drill method from March 2010 to October 2011. The core samples were collected via a 2.5-ft split-spoon sampler lined with four precut, 6-in-long, plastic lexan tubes. An unlined drive shoe made up the lowermost 0.5 ft of the split-spoon sampler. At some boreholes within the vadose zone, grab samples were collected in large plastic bags or plastic wide-mouth jars during cleanout or prior to advancing the borehole with the next split-spoon. Upon extraction from the drill hole and opening of the split-spoon, each lexan tube was labeled, capped, and secured with duct tape before being transported to refrigerated storage locations.
Initial characterization of the sediments taken from the split-spoon cores was performed and reviewed to determine which boreholes and core-liners or grab samples were worthy of detailed characterization. The criteria for selecting sediment samples for additional characterization was based on elevated total uranium concentrations in the sediments, as measured by strong (8 M) nitric acid at elevated temperatures and groundwater uranium concentrations at the water table in each new borehole at the time of drilling.
The selected cores and grab samples were opened in a nonradioactive laboratory. After scoring the lexan liners vertically on opposite sides of the liner, the opened halves were photographed (Appendix A). A detailed lithologic description of sediments from each of the boreholes, along with additional photographs of grab samples taken before or after each split-spoon sampling event, are provided in Brinton (2011). Appendix B presents the extraction data for the samples, which ones were analyzed, and the stratigraphy.

2.1
2.0 Materials and Methods
2.1 Sample Inventory
A total of 48 samples were selected for detailed analysis from the RI/FS boreholes (Table 2.1). Samples were numbered using Hanford Environmental Information System (HEIS)-specific sample names when available.1 The core samples from each sample interval were further identified by the numbers 1, 2, 3, or 4, where the number 1 liner was always in the deepest position closest to the drive shoe. Grab samples were numbered sequentially with #1 being the shallowest depth sampled.
2.1.1 Well 399-1-54 (Borehole C7653)
Five core samples were selected from the drilling of well 399-1-54. The water table in this borehole was 30 ft below ground surface (bgs) on January 19, 2011. In addition, two grab samples (labeled using borehole number and depth) were collected as part of the characterization campaign. The measured pore water pH was approximately 8, and all samples analyzed in this borehole were collected from the vadose zone. The <2-mm grain size fractions accounted for 25–40 weight percent of the bulk samples. Details about the core and grab samples received are listed in Table 2.1.
2.1.2 Well 399-1-55 (Borehole C7654)
Two core samples were selected from the drilling of well 399-1-55. The water table in this borehole was 31.76 ft bgs on January 19, 2011. In addition, four grab samples (labeled using borehole number and depth) were collected as part of the characterization campaign. All samples analyzed in this borehole were collected from the vadose zone, except samples of B27F48, C7654-34-35-1, and C7654-39-1 from the saturated zone. No pH and grain-size characterization tests were conducted on these borehole samples. Details about the core and grab samples received are listed in Table 2.1.
2.1.3 Well 399-1-56 (Borehole C7655)
Five core samples were selected from the drilling of well 399-1-56. The water table in this borehole was 30.76 ft bgs on January 19, 2011. In addition, three grab samples (labeled using borehole number and depth) were collected as part of the characterization campaign. All samples analyzed in this borehole were collected from the vadose zone, except one sample (B27K57) from the saturated zone. The pH and grain-size characterization were conducted only on sample B27K57; the pH = 7.99 and the <2-mm grain-size fractions were 12.88 weight percent. Details about the core and grab samples received are listed in Table 2.1.
1 For some boreholes, extra grab samples were collected in the field that were not preassigned HEIS numbers and sent to Pacific Northwest National Laboratory to assure adequate sample volume would be available for detailed characterization. The grab samples were numbered with the borehole ID number and sequentially from the shallowest depth sampled.
2.2
Table 2.1. Samples Received from Eight New Boreholes for Analysis, as well as Available Geological and Geochemistry Information
Well (Borehole) ID Water Table
Sample Depth Interval HEIS # Strata Unit Lithology
<2-mm Fraction (percent) pH Hydrostratigraphy Location
399-1-54 (C7653)
30 10.2-11.2 B25DK2 H gravel Sandy gravel 30.91 7.95 Vadose zone North part of North Process Pond
12.8-13.2 B278D8 H gravel slough 39.73 7.96 Vadose zone 15.4-16.0 B27902 H gravel Sandy gravel 30.44 8 Vadose zone 16.5-17.5 C7653-1 H gravel Vadose zone 17.4-18.5 B27933 H gravel Silty-sandy
gravel 35.68 7.95 Vadose zone
20.0-21.2 B25DK6 H gravel Reworked Ringold
25.24 7.94 Vadose zone
27.0-28.0 C7653-2 H gravel Plastic tub Vadose zone 399-1-55 (C7654)
31.76 24-25.5 C7654-24-25.2 H gravel bag Vadose zone Southwest corner on North Process Pond
29-30 C7654-29-30-1 H gravel bag Vadose zone 27.7-30.2 B27F47 H gravel bag Vadose zone 30.2-32.4 B27F48 H gravel bag Saturated zone
34-35 C7654-34-35-1 H gravel bag Saturated zone 39-39 C7654-39-1 H gravel bag Saturated zone
399-1-56 (C7655)
30.76 16-17 C7655-1 H gravel Plastic tube Vadose zone Center of process trench 17.3-19.8 B27KN0/L627K H gravel Plastic tube Vadose zone
20.2-22.7 B27KP1/L627R H gravel Plastic tube Vadose zone 22.7-24.9 B27KP3/L628C H gravel Plastic tube Vadose zone
22-23 C7655-2 H gravel Plastic tube Vadose zone 25-27 B27KP4/L628N H gravel Plastic tube Vadose zone 29-30 C7655-3 H gravel Plastic tube Vadose zone
32.6-35.1 B27K57 H gravel Sandy gravel 12.88 7.99 Saturated zone 399-1-57 (C7656)
30.4 13.5-16 B25DR1 H gravel Muddy sandy gravel
22 9.42 Vadose zone Near Columbia River to north 18.5-21.0 B25DR3 H gravel Muddy sandy
gravel bolder frags
35.8 8.18 Vadose zone
23.5-26 B25DR5 H gravel Sandy-gravel-silty sand
37.5 7.83 Vadose) zone
28.5-30.0 B25DR7 H gravel Med to course sand
93.93 7.96 Vadose zone
31.0-32.0 B25DR8 H gravel Med to course sand
Saturated zone
2.3
Table 2.1. (contd)
Well (Borehole) ID Water Table
Sample Depth Interval HEIS # Strata Unit Lithology
<2-mm Fraction (percent) pH Hydrostratigraphy Location
399-1-58 (C7657)
47.42 (1/20/2011)
31.3-33.8 B27K81 H gravel bag Vadose zone Inland northwest perimeter of uranium groundwater plume
42-43 C7657-42-43 H gravel bag Vadose zone 43.7-46.2 B27K88 H gravel bag Vadose zone 46-48.5 B27K89 H gravel bag Vadose zone
399-1-59 (C7659)
51.7-55.25 no measure
42-42 C7659-4 NA Plastic tub Vadose zone Inland west of South Process Pond
47-47 C7659-5 NA Plastic tub Vadose zone
399-2-32 (C7660)
30.86 18.0-20.0 C7660-2 NA Plastic tub Vadose zone Northeast of South Process Pond
23.0-25.5 C7660-3 NA Plastic tub Vadose zone 29.0-29.0 C7660-4 NA Plastic tub Vadose zone 31.5-31.5 C7660-5 NA Plastic tub Saturated zone 34.0-34.0 C7660-6 NA Plastic tub Saturated zone
36-38 B27PL8 H gravel Muddy sandy gravel
23.5 7.87 Saturated zone
43-43 B27PM3 H gravel Sandy gravel 13.0 7.84 Saturated zone 399-3-33 (C7663)
42.55 28-28 C7663-3 H gravel Plastic tub Vadose zone Near Columbia River east of ash pit
30-33 B25F45 H gravel Silty sandy gravel
28.9 8.04 Vadose zone
35-35 B25F46 H gravel Silty sandy gravel
28.9 7.84 Vadose zone
34-35.0 C7663-4 H gravel Plastic tub Vadose zone 35-38 B25F47 H gravel Muddy gravel 21.4 7.55 Vadose zone 39-39 C7663-5 H gravel Plastic tub Vadose zone 38-40 B25F48 H gravel Muddy gravel 28.4 8.02 Vadose zone 42-42 C7663-6 H gravel Plastic tub Vadose zone 42-45 B25F49 H gravel Muddy sandy
gravel 12 7.8 Saturated zone
NA = Not analyzed.
2.4
2.1.4 Well 399-1-57 (Borehole C7656)
Five core samples were selected from the drilling of well 399-1-57. The water table in this borehole was 30.4 ft bgs on January 19, 2011. All samples analyzed in this borehole were collected from the vadose zone except sample B25DR8, which was collected from the saturated zone. The measured pore water pH was 7.83–9.42. The <2-mm grain-size fractions accounted for 22–37.50% of the bulk samples by weight, except sample B25DR7, which contained 93.9% medium to course sand by weight. Similar lithology was observed in sample B25DR7. Details about the core and grab samples received are listed in Table 2.1.
2.1.5 Well 399-1-58 (Borehole C7657)
Three core samples were selected from the drilling of well 399-1-58. The water table in this borehole was 47.42 ft bgs on January 20, 2011. In addition, one grab samples (labeled using borehole number and depth) were collected as part of the characterization campaign. All samples analyzed in this borehole were collected from the vadose zone. No pH and grain-size characterizations were conducted on these borehole samples. Details about the core and grab samples received are listed in Table 2.1.
2.1.6 Well 399-1-59 (Borehole C7659)
No core samples were obtained from this borehole, but two grab samples (labeled using borehole number and depth) were selected during the characterization campaign. The water table in this borehole was about 51.7–55.25 ft bgs on January 19, 2011. All samples analyzed in this borehole were collected from the vadose zone. No pH and grain-size characterizations were conducted on these borehole samples.
2.1.7 Well 399-2-32 (Borehole C7660)
Two core samples were selected from the drilling of well 399-2-32. The water table in this borehole was 30.86 ft bgs on January 20, 2011. In addition, five grab samples (labeled using borehole number and depth) were collected as part of the characterization campaign. Three samples analyzed in this borehole were collected from the vadose zone while another four samples were collected from the saturated zone. For the two core samples, the measured pH values were about 7.8, and the <2-mm grain-size fractions accounted for 13–23.5 weight percent. Details about the core and grab samples received are listed in Table 2.1.
2.1.8 Well 399-3-33 (Borehole C7663)
Five core samples were selected from the drilling of well 399-2-32. The water table in this borehole was 42.55 ft bgs on January 20, 2011. In addition, four grab samples (labeled using borehole number and depth) were collected as part of the characterization campaign. All samples analyzed in this borehole were collected from the vadose zone, except sample B25F49 from the saturated zone. For the five core samples, the measured pH was 7.55-8.04, and the <2-mm grain-size fractions accounted for 12–28.9 weight percent. Details about the core and grab samples received are listed in Table 2.1.
2.5
2.2 Experimental Methods
This subsection presents the details on the test methods used on the selected 300 Area sediments.
2.2.1 Sample Characterization
2.2.1.1 Moisture Content
Gravimetric water contents of the sediment samples were determined using a procedure based on the American Society for Testing and Materials (ASTM), “Test Method for Laboratory Determination of Water (Moisture) Content of Soil and Rock by Mass” (ASTM D2216-98). One representative subsample of at least 15 to 70 g was used. Sediment aliquots were placed in containers, weighed, and dried in an oven at 105°C until a constant weight was achieved, which took 24 hours. The containers were removed from the oven, sealed, cooled, and then weighed at least twice to ensure that all moisture was removed. All sediments were weighed using a calibrated balance. A calibrated weight set was used to verify balance performance before weighing the samples. The gravimetric water content was computed as the percentage change in soil weight before and after oven drying.
Due to the high amount of gravel in most of the sediments (>80% in most cases), it might be more useful to measure the moisture contents of the fine-grained portions of the sample because of the less importance of gravel on uranium sorption. Therefore, in addition to moisture measurement on the bulk samples, the moisture content on <2-mm grain-size fractions of the sample was also conducted using the same measurement procedure as described above. The <2-mm grain-size fractions were roughly separated from the wet bulk sample by the “naked eye” without mesh sieving.
Note that all moisture contents presented in this report may be different from moisture contents under natural field conditions because all samples were stored in a refrigerator for 18 months before conducting the moisture measurement in July 2012.
2.2.1.2 8 M Nitric Acid Uranium Extraction (AE)
Approximately 10 g of air-dried sediment was contacted with 8 M nitric acid at a ratio of approximately 3.5 parts acid to one part sediment (10 g + 32 mL 8 M HNO3 + 3 mL concentrated HCl). The slurries were heated to about 95°C for several hours (3–4 h), after which the fluid was separated by filtration through 0.45-μm membranes. The acid extracts were analyzed for uranium using inductively coupled-plasma mass spectrometry (ICP-MS) techniques. The acid digestion procedure is based on U.S. Environmental Protection Agency SW-846 Method 3050B (EPA 2000).
Measuring uranium-238 does not address the other uranium isotopes that should be present in these samples. However, the total concentrations of uranium-235, uranium-234 (and possibly uranium-236) are expected to be sufficiently low that their contribution would add less than 1% to the total uranium mass calculation. For this report, the concentration of uranium-238 present in these samples is considered the same as total uranium on a mass basis.
2.6
2.2.1.3 Particle-Size Distribution and Uranium Contributions
Because a potential relationship exists between uranium concentrations and sediment particle size (Um et al. 2010), the particle-size distributions and the related uranium distribution between different grain-size fractions were examined. The dry sieving method was used to determine the particle-size distribution for two selected bulk sediment samples (C7654-24-25.5 and C7654-34-35). These two samples were selected to represent the gravel-dominated Hanford formation vadose sediments. The bulk sediments were separated by dry sieving into 5 size fractions through 4 standard meshes: the silt/clay (<0.075 mm), very fine and fine sand (0.075 mm <size <0.25 mm), medium sand (0.250 mm <size <0.500 mm), coarse and very coarse sand (0.5 mm <size <2.0 mm), and gravel (>2.0 mm). The uranium concentration in each separate size was determined using the 8-M nitric acid extraction method.
2.2.1.4 Bicarbonate Uranium Extraction (BC)
The bicarbonate extraction procedure (see Kohler et al. 2004 for details) was used in both equilibrium and kinetic leaching experiments as described in the following subsections.
Equilibrium Extraction Experiment
The concentration of labile (easily removable fraction) uranium in the sediment <2-mm grain-size fractions was determined using the sodium bicarbonate/carbonate mixed solution (0.0144 M in NaHCO3 and 0.0028 M in Na2CO3) in batch vials (60 mL). The reagent pH was 9.4, and the sediment-to-extractant ratio was 1:20 (2 g + 40 mL). The reaction batch vials were shaken at 120 revolutions per minute (RPM) on an orbital shaker for 42 d (1000 h) to obtain the leaching equilibrium. Two leachate aliquots were collected for measurement of uranium concentration and the second for pH monitoring. Solutions were filtered using 0.45-µm syringe filters, acidified (0.1-mL concentrated nitric acid into 10-mL subsamples), and analyzed for uranium using ICP-MS. As mentioned in Section 2.2, the relatively mild bicarbonate–carbonate solution is unlikely to liberate much uranium locked up in mineral matrices (Kohler et al. 2004) and is therefore considered to be a good index of easily removed uranium.
Kinetic Leaching Experiment
Three samples (C7654-2-25.2, B27F48, and B278D8) were selected to conduct the labile-uranium leaching kinetic experiments by using multiple batch reactors. Seven identical reactor vials for each sample were prepared as described above for the equilibrium leaching vials. The vials were shaken at 120 RPM on the orbital shaker. The leachate aliquots were collected from the individual vials at 2 h, 1 d, 3 d, 7 d, 14 d, 30 d, and 42 d (1000 h) for uranium analysis as mentioned in the above subsection. The goals of the time-dependent kinetic sampling are two-fold: 1) time-based sampling enables determination if equilibrium (with respect to uranium solution concentrations) has been achieved in the reactors; and 2) it allows the rate of uranium release from the sediments to be determined.
2.2.1.5 1:1 Sediment:Water Extraction
Most sediments recovered from Hanford Site vadose zone boreholes contain very little free aqueous solution. Attempts to separate adequate quantities of pore water fluid from the Hanford Site vadose zone sediments for analysis using ultracentrifugation (UFA) are time consuming and require up to 500 g of
2.7
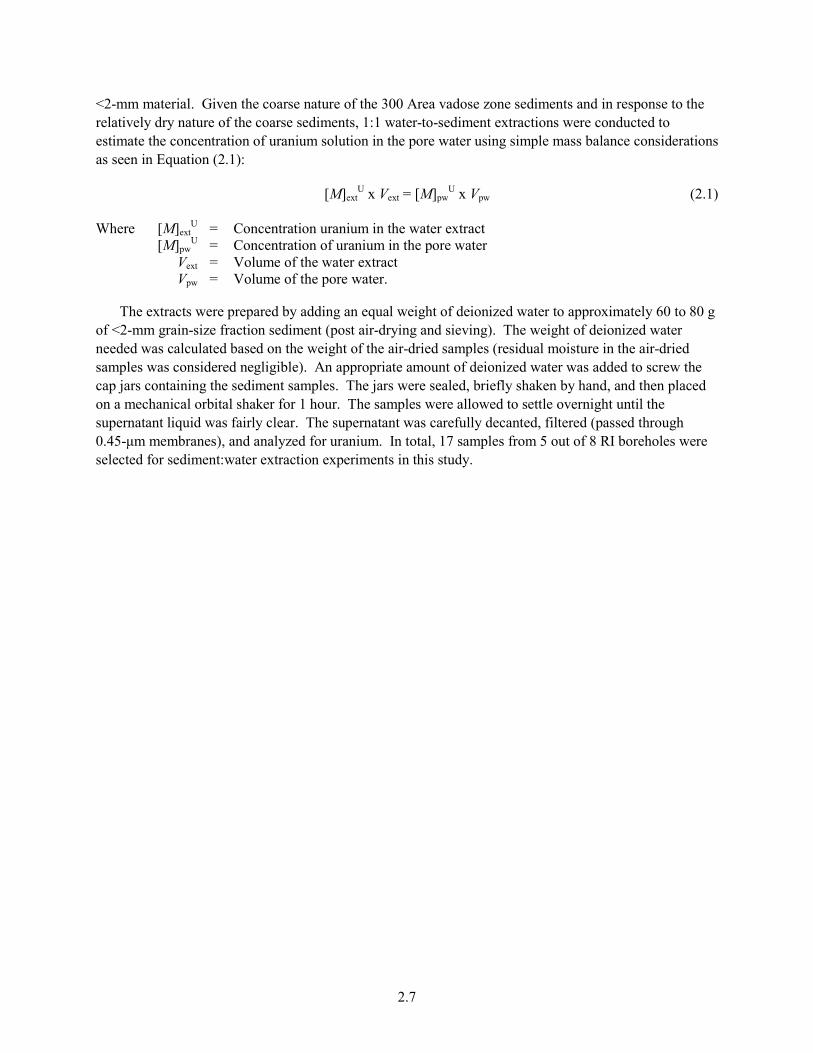
<2-mm material. Given the coarse nature of the 300 Area vadose zone sediments and in response to the relatively dry nature of the coarse sediments, 1:1 water-to-sediment extractions were conducted to estimate the concentration of uranium solution in the pore water using simple mass balance considerations as seen in Equation (2.1):
[M]extU x Vext = [M]pw
U x Vpw (2.1)
Where [M]extU = Concentration uranium in the water extract
[M]pwU = Concentration of uranium in the pore water
Vext = Volume of the water extract Vpw = Volume of the pore water.
The extracts were prepared by adding an equal weight of deionized water to approximately 60 to 80 g of <2-mm grain-size fraction sediment (post air-drying and sieving). The weight of deionized water needed was calculated based on the weight of the air-dried samples (residual moisture in the air-dried samples was considered negligible). An appropriate amount of deionized water was added to screw the cap jars containing the sediment samples. The jars were sealed, briefly shaken by hand, and then placed on a mechanical orbital shaker for 1 hour. The samples were allowed to settle overnight until the supernatant liquid was fairly clear. The supernatant was carefully decanted, filtered (passed through 0.45-μm membranes), and analyzed for uranium. In total, 17 samples from 5 out of 8 RI boreholes were selected for sediment:water extraction experiments in this study.
3.1
3.0 Analytical Results
This section presents uranium data collected on sediments from the 300 Area RI/FS boreholes drilled during 2010–201. Characterization activities emphasized two goals: to quantify the total uranium in the sediments as a function of depth in the borehole, and to quantify the labile concentration of uranium in the sediments estimated to contain Hanford Site-derived uranium. In addition to uranium speciation data, moisture content and particle size of the sediments, uranium leaching rates, leachability, and uranium distribution between sediment grain sizes were also discussed. Characterization results are presented by borehole. Summary tables with all the data generated are provided in Appendix B.
3.1 Sediment from Well 399-1-54 (C7653)
3.1.1 Moisture Content
The moisture contents of seven samples collected from well 399-1-54 is listed as a function of depth in Table 3.1 and Figure 3.1. Both moisture contents from bulk samples and from <2-mm grain-size fractions are reported. The gravel-dominated sediment of the Hanford formation had low moisture content. The moisture content of the bulk samples varied between ~3 weight percent and ~8 weight percent along the depth profile. In contrast, the moisture contents in the <2-mm grain-size fractions were from ~5 weight percent to ~14 weight percent, increased by a factor of ~2 compared to the values from bulk samples. Samples exhibiting relatively high moisture contents are generally related to fine-grained sediments. Thus, the samples collected within the vadose zone Hanford formation with higher moisture content could be a good indicator for fine-grained sediment.
3.1.2 Uranium in Sediments from Well 399-1-54
Table 3.1 and Figure 3.1 plot the total acid-extractable and bicarbonate-leachable uranium data (measured as μg uranium-238/g sediment on a dry weight basis) as a function of depth for sediments collected from well 399-1-54. Acid-extractable uranium concentrations ranged from a low of 1.11 to a maximum of 11.63 μg/g. In comparison, bicarbonate solution released much less uranium from the sediments, from 0.50 to 5.76 μg/g. In each case, the bicarbonate leaching removed lower uranium concentrations; in general, ~30% to ~70% as much soluble uranium as the nitric acid extracts. Figure 3.1 shows a general trend of increased uranium concentration along the depth above the groundwater elevation, while the maximum concentration was associated with the slough sample B278D8.
Well 399-1-54 was drilled at the north edge of the North Process Pond; therefore, it was hypothesized that sediments retrieved during drilling at this location would contain Hanford Site-derived (contaminant) uranium. Assuming this location had been previously remediated by excavation of near surface sediments, the decrease of uranium concentration as a function of depth down to 17.5 ft bgs would appear to represent backfilling with sediment that was not devoid of Hanford Site-derived uranium. The increase of uranium from 17.5 to 18.5 ft bgs might indicate the excavation depth was somewhere near 17.5 ft deep and the deeper sediments contain process pond sourced uranium, with lower concentrations down to the periodically rewetted zone and water table.

3.2
Table 3.1. Concentrations of Acid-Extractable, Bicarbonate-Leachable Uranium and Moisture Content (bulk sample and <2-mm grain-size fraction) in Sediments from Well 399-1-54 (Borehole C7653)
Sample Name
End Depth
AE-Extractable
Total U
Bicarbonate (BC)
Leachable U
BC Leachable/
AE Extracted U
Moisture Content
(bulk sample)
Moisture Content (<2-mm
fraction sample)
(HEIS ID) (ft bgs) (µg/g-dry) (µg/g-dry) (percent) (weight percent) (weight percent)
B25DK2 11.2 7.88 5.76 73 2.89 4.79 B278D8 13.2 11.63 5.29 45 4.04 5.60 B27902 16 6.07 2.66 44 3.19 5.054 C7653-1 17.5 1.43 1.01 71 3.89 10.77 B27933 18.5 7.47 2.05 27 3.22 5.11 B25DK6 21.2 4.46 1.33 30 7.53 13.72 B25C49 23 5.12 ND ND ND ND C7653-2 28 1.11 0.499 45 4.24 8.41 B25C51 28.6 2.41 ND ND ND ND AE = acid-extractable; BC = bicarbonate-leachable; HEIS = Hanford Environmental Information System; ND = not done. AE values in red type are from a commercial analytical laboratory.
10
15
20
25
30
35
40
45
50
55
0 5 10 15
Dep
th ft
bgs
Uranium-238 [µg/g]
Well 399-1-54 AE Uranium
BC Uranium
10
15
20
25
30
35
40
45
50
55
0 5 10 15 20 25 30 35
Dept
h ft
bgs
Moisture Content [%]
Well 399-1-54
<2 mm fraction sample
Bulk sample
Figure 3.1. Concentrations of Acid-Extractable (AE) and Bicarbonate-Leachable Uranium (left), and
Moisture Content (bulk sample versus <2-mm grain-size fraction) (right) versus Depth in Sediments from Well 399-1-54 (Borehole C7653). (The thick dash line indicates the groundwater elevation measured on January 19, 2011, while the dotted lines represent the periodically rewetted zone.)
3.3
3.2 Sediment from Well 339-1-55 (C7654)
3.2.1 Moisture Content
The moisture contents of six samples collected from well 399-1-55 are listed as a function of depth in Table 3.2 and Figure 3.2. Both moisture contents from bulk samples and <2-mm grain-size fractions are reported. As expected, the three gravel-dominated vadose zone Hanford formation sediments (C7654-24-25.2, C7654-29-30-1, and B27F47) had low moisture contents of about ~5.5 weight percent. The three deeper samples from saturated zones (B27F48, C7654-34-35-1, and C7654-39-1) also had low moisture contents. Although water saturated in the field, the three sediment core liners collected during the drilling of well 399-1-55 contained 6.01–7.42 weight percent moisture, likely because water drained out of the split-spoon during recovery and removal of the liners. The low moisture content can be explained by the poor ability of gravel to retain pore water after capture in the split-spoon. Compared to the bulk samples, the <2-mm grain-size fractions showed twice as much moisture from both vadose and saturated zones with values of 10–15 weight percent moisture. Higher moisture contents in the <2-mm grain-size fractions from unsaturated sediment C7654-24-25.2 (13.7 weight percent) was observed compared to the sample C7654-34-35-1 (10 weight percent) from the saturated zone. These moisture contents can be attributed to the fact there is more fine-grained material in C7654-24-25.2 compared to that of sample C7654-34-35-1, where 9.6 weight percent and 5.5 weight percent of <0.5-mm grain-size fractions were determined for C7654-24-25.2 and C7654-34-35-1, respectively. The measured moisture content of the samples can be used to qualitatively identify the location (depth) of finer-grained material in this borehole.
3.2.2 Uranium in Sediments from Well 399-1-55
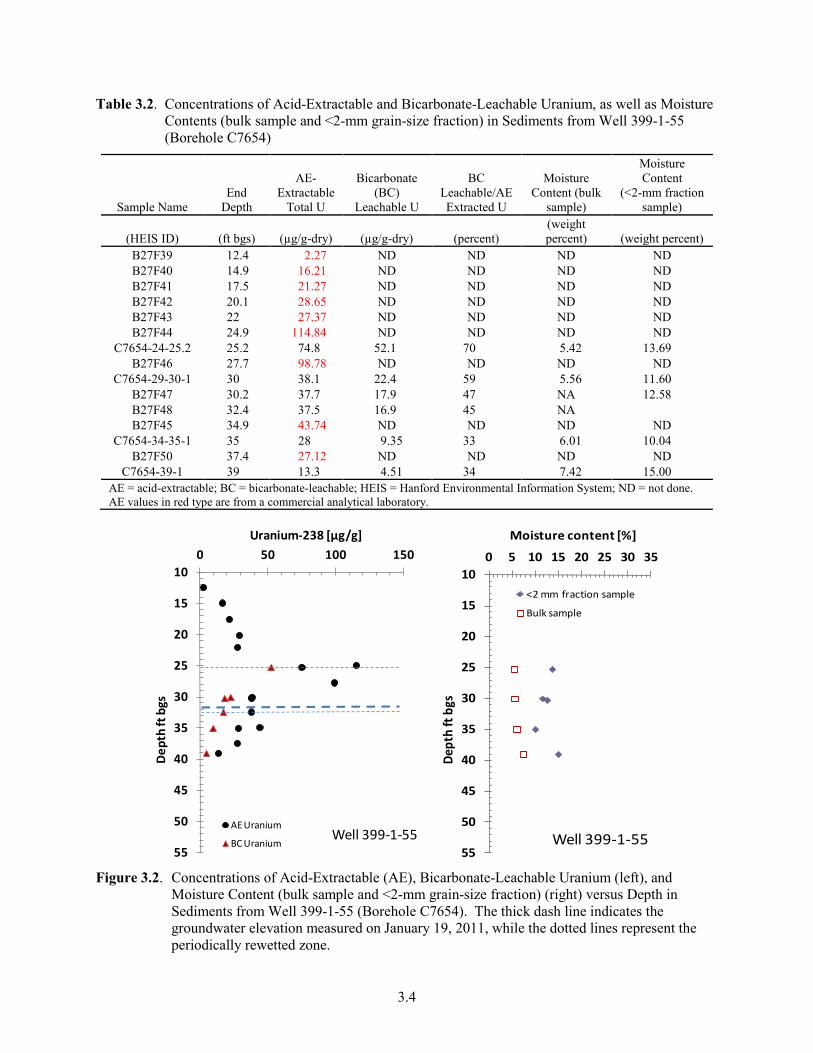
Table 3.2 and Figure 3.2 present the total acid-extractable and bicarbonate-leachable uranium data (measured as μg uranium-238/g sediment on a dry weight basis) as a function of depth for sediments collected from well 399-1-55. Acid-extractable uranium concentrations ranged from a low of 2.27 to a maximum of 114.84 μg/g. In comparison, bicarbonate leaching method released less uranium from the sediments, from 4.51 to 52.1 μg/g. In every case, the bicarbonate leaching contained lower uranium concentrations, generally ~33% to ~70% as much soluble uranium as the nitric acid extracts. Figure 3.2 shows a general trend of decreased uranium concentration versus depth, while the maximum concentration was associated with the sample C7654-24-25.2.
Well 399-1-55 was drilled within the southwest corner of the North Process Pond, where the original inlet was located. Therefore, sediments retrieved during drilling at this location were expected to contain significant concentrations of contaminant uranium. The increase in the acid-extractable uranium concentration from near ground surface to approximately 28 ft bgs suggests that sediments with residual uranium disposed to the pond remain in this location that was either not excavated or the backfill used contained more residual uranium than the backfill used near the northern end of the pond. Between 28 and 37 ft bgs, the residual uranium ranges from 40 down to 30 μg/g. The periodically rewetted zone (25.2 to 32.4 ft bgs) and upper portion of the aquifer (down to 39 ft bgs) contain significant residual uranium that likely contributes to the existing groundwater plume.
3.4
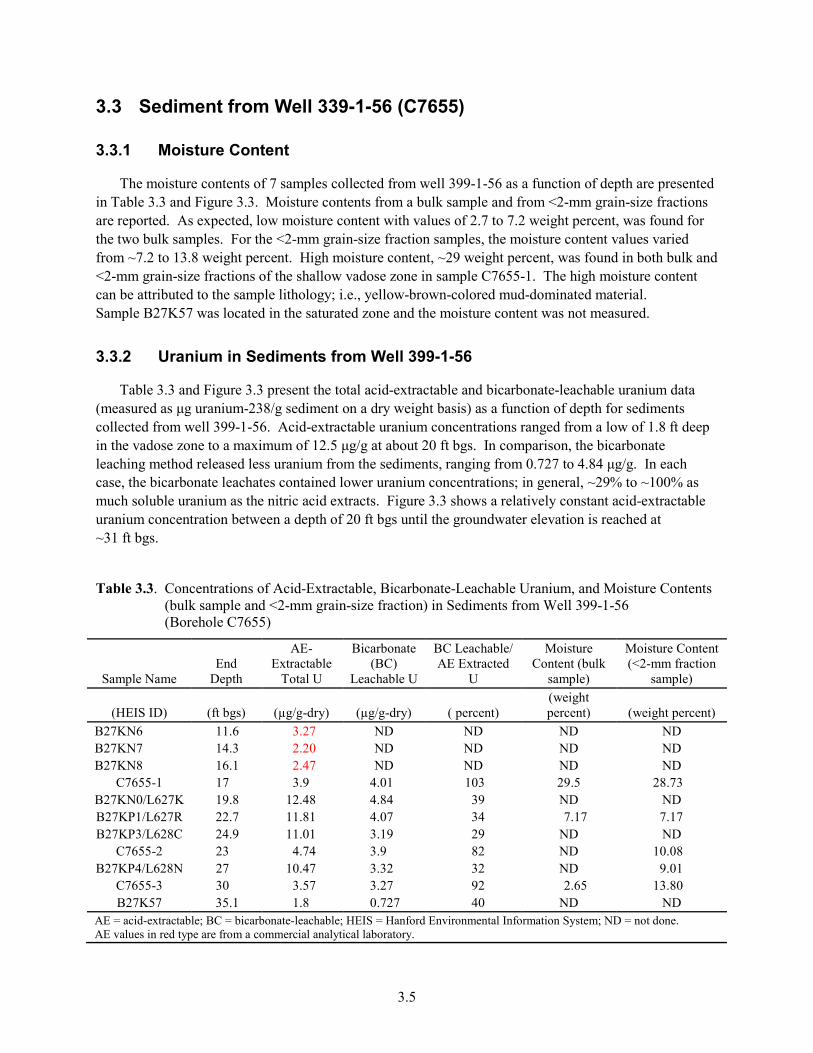
Table 3.2. Concentrations of Acid-Extractable and Bicarbonate-Leachable Uranium, as well as Moisture Contents (bulk sample and <2-mm grain-size fraction) in Sediments from Well 399-1-55 (Borehole C7654)
Sample Name End
Depth
AE-Extractable
Total U
Bicarbonate (BC)
Leachable U
BC Leachable/AE Extracted U
Moisture Content (bulk
sample)
Moisture Content
(<2-mm fraction sample)
(HEIS ID) (ft bgs) (µg/g-dry) (µg/g-dry) (percent) (weight percent) (weight percent)
B27F39 12.4 2.27 ND ND ND ND B27F40 14.9 16.21 ND ND ND ND B27F41 17.5 21.27 ND ND ND ND B27F42 20.1 28.65 ND ND ND ND B27F43 22 27.37 ND ND ND ND B27F44 24.9 114.84 ND ND ND ND
C7654-24-25.2 25.2 74.8 52.1 70 5.42 13.69 B27F46 27.7 98.78 ND ND ND ND
C7654-29-30-1 30 38.1 22.4 59 5.56 11.60 B27F47 30.2 37.7 17.9 47 NA 12.58 B27F48 32.4 37.5 16.9 45 NA B27F45 34.9 43.74 ND ND ND ND
C7654-34-35-1 35 28 9.35 33 6.01 10.04 B27F50 37.4 27.12 ND ND ND ND
C7654-39-1 39 13.3 4.51 34 7.42 15.00 AE = acid-extractable; BC = bicarbonate-leachable; HEIS = Hanford Environmental Information System; ND = not done. AE values in red type are from a commercial analytical laboratory.
10
15
20
25
30
35
40
45
50
55
0 50 100 150
Dep
th ft
bgs
Uranium-238 [µg/g]
Well 399-1-55 AE Uranium
BC Uranium
10
15
20
25
30
35
40
45
50
55
0 5 10 15 20 25 30 35
Dept
h ft
bgs
Moisture content [%]
Well 399-1-55
<2 mm fraction sample
Bulk sample
Figure 3.2. Concentrations of Acid-Extractable (AE), Bicarbonate-Leachable Uranium (left), and
Moisture Content (bulk sample and <2-mm grain-size fraction) (right) versus Depth in Sediments from Well 399-1-55 (Borehole C7654). The thick dash line indicates the groundwater elevation measured on January 19, 2011, while the dotted lines represent the periodically rewetted zone.
3.5
3.3 Sediment from Well 339-1-56 (C7655)
3.3.1 Moisture Content
The moisture contents of 7 samples collected from well 399-1-56 as a function of depth are presented in Table 3.3 and Figure 3.3. Moisture contents from a bulk sample and from <2-mm grain-size fractions are reported. As expected, low moisture content with values of 2.7 to 7.2 weight percent, was found for the two bulk samples. For the <2-mm grain-size fraction samples, the moisture content values varied from ~7.2 to 13.8 weight percent. High moisture content, ~29 weight percent, was found in both bulk and <2-mm grain-size fractions of the shallow vadose zone in sample C7655-1. The high moisture content can be attributed to the sample lithology; i.e., yellow-brown-colored mud-dominated material. Sample B27K57 was located in the saturated zone and the moisture content was not measured.
3.3.2 Uranium in Sediments from Well 399-1-56
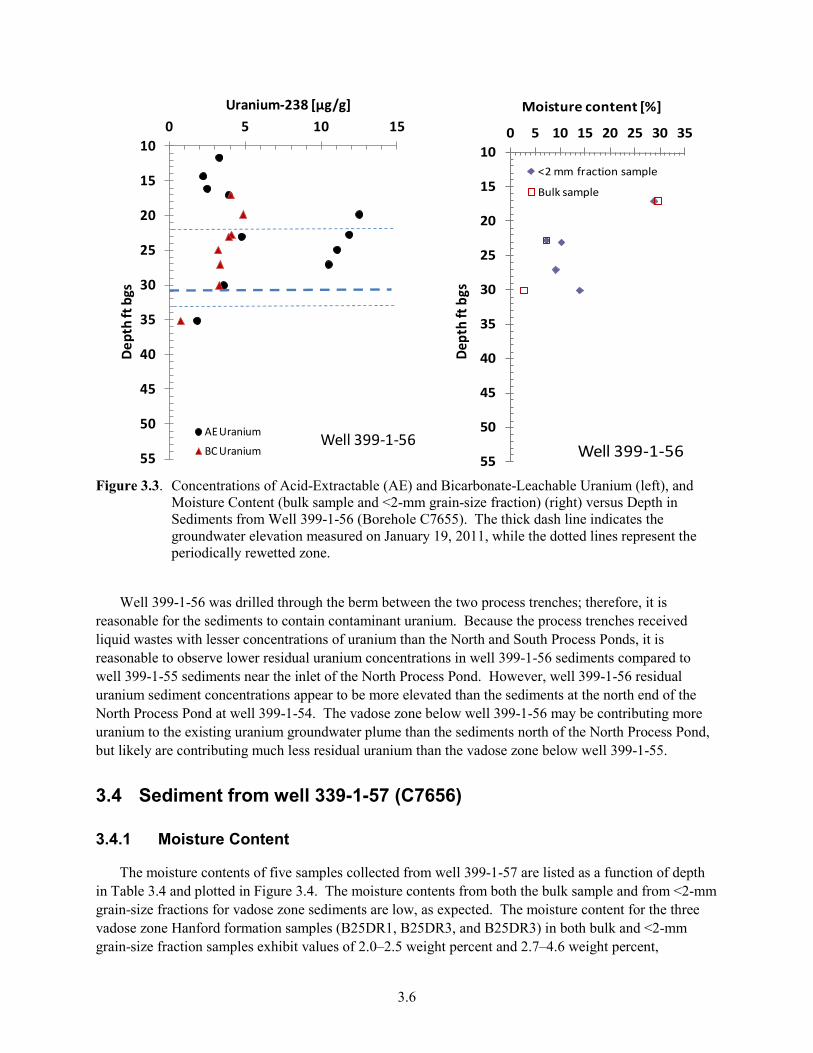
Table 3.3 and Figure 3.3 present the total acid-extractable and bicarbonate-leachable uranium data (measured as μg uranium-238/g sediment on a dry weight basis) as a function of depth for sediments collected from well 399-1-56. Acid-extractable uranium concentrations ranged from a low of 1.8 ft deep in the vadose zone to a maximum of 12.5 μg/g at about 20 ft bgs. In comparison, the bicarbonate leaching method released less uranium from the sediments, ranging from 0.727 to 4.84 μg/g. In each case, the bicarbonate leachates contained lower uranium concentrations; in general, ~29% to ~100% as much soluble uranium as the nitric acid extracts. Figure 3.3 shows a relatively constant acid-extractable uranium concentration between a depth of 20 ft bgs until the groundwater elevation is reached at ~31 ft bgs.
Table 3.3. Concentrations of Acid-Extractable, Bicarbonate-Leachable Uranium, and Moisture Contents (bulk sample and <2-mm grain-size fraction) in Sediments from Well 399-1-56 (Borehole C7655)
Sample Name End
Depth
AE-Extractable
Total U
Bicarbonate (BC)
Leachable U
BC Leachable/ AE Extracted
U
Moisture Content (bulk
sample)
Moisture Content (<2-mm fraction
sample)
(HEIS ID) (ft bgs) (µg/g-dry) (µg/g-dry) ( percent) (weight percent) (weight percent)
B27KN6 11.6 3.27 ND ND ND ND B27KN7 14.3 2.20 ND ND ND ND B27KN8 16.1 2.47 ND ND ND ND
C7655-1 17 3.9 4.01 103 29.5 28.73 B27KN0/L627K 19.8 12.48 4.84 39 ND ND B27KP1/L627R 22.7 11.81 4.07 34 7.17 7.17 B27KP3/L628C 24.9 11.01 3.19 29 ND ND
C7655-2 23 4.74 3.9 82 ND 10.08 B27KP4/L628N 27 10.47 3.32 32 ND 9.01
C7655-3 30 3.57 3.27 92 2.65 13.80 B27K57 35.1 1.8 0.727 40 ND ND
AE = acid-extractable; BC = bicarbonate-leachable; HEIS = Hanford Environmental Information System; ND = not done. AE values in red type are from a commercial analytical laboratory.
3.6
10
15
20
25
30
35
40
45
50
55
0 5 10 15D
epth
ft b
gsUranium-238 [µg/g]
Well 399-1-56 AE Uranium
BC Uranium
10
15
20
25
30
35
40
45
50
55
0 5 10 15 20 25 30 35
Dept
h ft
bgs
Moisture content [%]
Well 399-1-56
<2 mm fraction sample
Bulk sample
Figure 3.3. Concentrations of Acid-Extractable (AE) and Bicarbonate-Leachable Uranium (left), and
Moisture Content (bulk sample and <2-mm grain-size fraction) (right) versus Depth in Sediments from Well 399-1-56 (Borehole C7655). The thick dash line indicates the groundwater elevation measured on January 19, 2011, while the dotted lines represent the periodically rewetted zone.
Well 399-1-56 was drilled through the berm between the two process trenches; therefore, it is
reasonable for the sediments to contain contaminant uranium. Because the process trenches received liquid wastes with lesser concentrations of uranium than the North and South Process Ponds, it is reasonable to observe lower residual uranium concentrations in well 399-1-56 sediments compared to well 399-1-55 sediments near the inlet of the North Process Pond. However, well 399-1-56 residual uranium sediment concentrations appear to be more elevated than the sediments at the north end of the North Process Pond at well 399-1-54. The vadose zone below well 399-1-56 may be contributing more uranium to the existing uranium groundwater plume than the sediments north of the North Process Pond, but likely are contributing much less residual uranium than the vadose zone below well 399-1-55.
3.4 Sediment from well 339-1-57 (C7656)
3.4.1 Moisture Content
The moisture contents of five samples collected from well 399-1-57 are listed as a function of depth in Table 3.4 and plotted in Figure 3.4. The moisture contents from both the bulk sample and from <2-mm grain-size fractions for vadose zone sediments are low, as expected. The moisture content for the three vadose zone Hanford formation samples (B25DR1, B25DR3, and B25DR3) in both bulk and <2-mm grain-size fraction samples exhibit values of 2.0–2.5 weight percent and 2.7–4.6 weight percent,

3.7
respectively. For the samples collected near and below the groundwater elevation, the moisture contents were ~20 weight percent and 30 weight percent for samples B25DR7 and B25DR8, respectively.
3.4.2 Uranium in Sediments from Well 399-1-57
Table 3.4 and Figure 3.4 present the total acid-extractable and bicarbonate-leachable uranium data (measured as μg uranium-238/g sediment on a dry weight basis) as a function of depth for sediments collected from well 399-1-57. Acid-extractable uranium concentrations ranged from a low of 0.71 to a maximum of 2.45 μg/g. These concentrations are not significantly elevated in acid-extractable uranium concentrations. In comparison, bicarbonate leaching method released much less uranium from the sediments—from 0.024 to 0.186 μg/g. In each case, the bicarbonate leaching contained lower uranium concentrations; in general, ~1% to ~10% as much soluble uranium as the nitric acid extracts. The low percentage bicarbonate uranium extraction compared to the values reported in Tables 3.1, 3.2, and 3.3 also indicate there is little to no uranium from Hanford Site fuel fabrication activities in the sediments from this borehole. Figure 3.4 shows a slight trend of increasing uranium concentration versus depth until the water table is reached. The maximum concentration of acid-extractable uranium in the sediments was associated with sample B25DR7, which was located at the water table.
Well 399-1-57 was drilled near the Columbia River away from the process ponds and trenches; therefore, it was expected that sediments retrieved from this location during drilling would contain low concentrations of contaminant uranium.
Table 3.4. Concentrations of Acid-Extractable, Bicarbonate-Leachable Uranium, and Moisture Contents (bulk sample and <2-mm grain-size fraction) in Sediments from Well 399-1-57 (Borehole C7656)
Sample Name
End Depth
AE-Extractable
Total U
Bicarbonate (BC)
Leachable U
BC Leachable/AE Extracted U
Moisture Content (bulk
sample)
Moisture Content (<2-mm fraction
sample)
(HEIS ID) (ft bgs) (µg/g-dry) (µg/g-dry) (percent) (weight percent) (weight percent)
B25DR0 12.5 1.18 ND ND ND ND B25DR1 16 1.26 0.033 3 2.2 3.29 B25DM7 17.5 0.711 ND ND ND ND B25DR3 21 1.62 0.0242 1 2.04 2.66 B25DM9 22.5 1.1 ND ND ND ND B25DR5 26 2.02 0.0281 1 2.45 4.55 B25DN1 27.5 1.68 ND ND ND ND B25DR7 30 2.45 0.155 6 25.2 19.49 B25DR8 32 1.9 0.186 10 34.7 30.25 B261B8 35 1.44 ND ND ND ND
AE = acid-extractable; BC = bicarbonate-leachable; HEIS = Hanford Environmental Information System; ND = not done. AE values in red type are from a commercial analytical laboratory

3.8
10
15
20
25
30
35
40
45
50
55
0 1 2 3 4 5D
epth
ft b
gsUranium-238 [µg/g]
Well 399-1-57 AE UraniumBC Uranium
10
15
20
25
30
35
40
45
50
55
0 5 10 15 20 25 30 35
Dept
h ft
bgs
Moisture content [%]
Well 399-1-57
<2 mm fraction sample
Bulk sample
Figure 3.4. Concentrations of Acid-Extractable (AE) and Bicarbonate-Leachable Uranium (left), and
Moisture Content (bulk sample and <2-mm grain-size fraction) (right) versus Depth in Sediments from Well 399-1-57 (Borehole C7656). The thick dash line indicates the groundwater elevation measured on January 19, 2011, while the dotted lines represent the periodically rewetted zone.
3.5 Sediment from Well 339-1-58 (C7657)
3.5.1 Moisture Content
The moisture contents of four samples collected from well 399-1-58 are listed as a function of depth in Table 3.5 and plotted in Figure 3.5. Both moisture contents from bulk samples and from <2-mm grain-size fractions are reported. Low moisture content was observed for all Hanford formation samples in both bulk (only available for sample C7657-42-43) and <2-mm grain-size fraction samples with values of 2.0–6.8 weight percent. Sample B27K89 was collected below the water table, with a moisture content of only 5.05 weight percent, indicating that most water drained out of the split-spoon as the sampler was removed from the drill hole because the sediments are gravel-dominated.
3.5.2 Uranium in Sediments from Well 399-1-58
Table 3.5 and Figure 3.5 present the total acid-extractable and bicarbonate-leachable uranium data (measured as μg uranium-238/g sediment on a dry weight basis) as a function of depth for sediments collected from well 399-1-58. Acid-extractable uranium concentrations ranged from a low of 0.343 to a maximum of 2.41 μg/g. These uranium concentrations are not elevated and suggest that little of the uranium is from waste disposal activities. In comparison, bicarbonate leaching released much less
3.9
uranium from the sediments, from 0.025 to 0.062 μg/g. In every case, the bicarbonate leaching contained lower uranium concentrations; in general, ~2% to ~10% as much soluble uranium as the nitric acid extracts. Thus, the sediments at this location likely do not contain contaminant uranium and are not contributing to the existing groundwater plume.
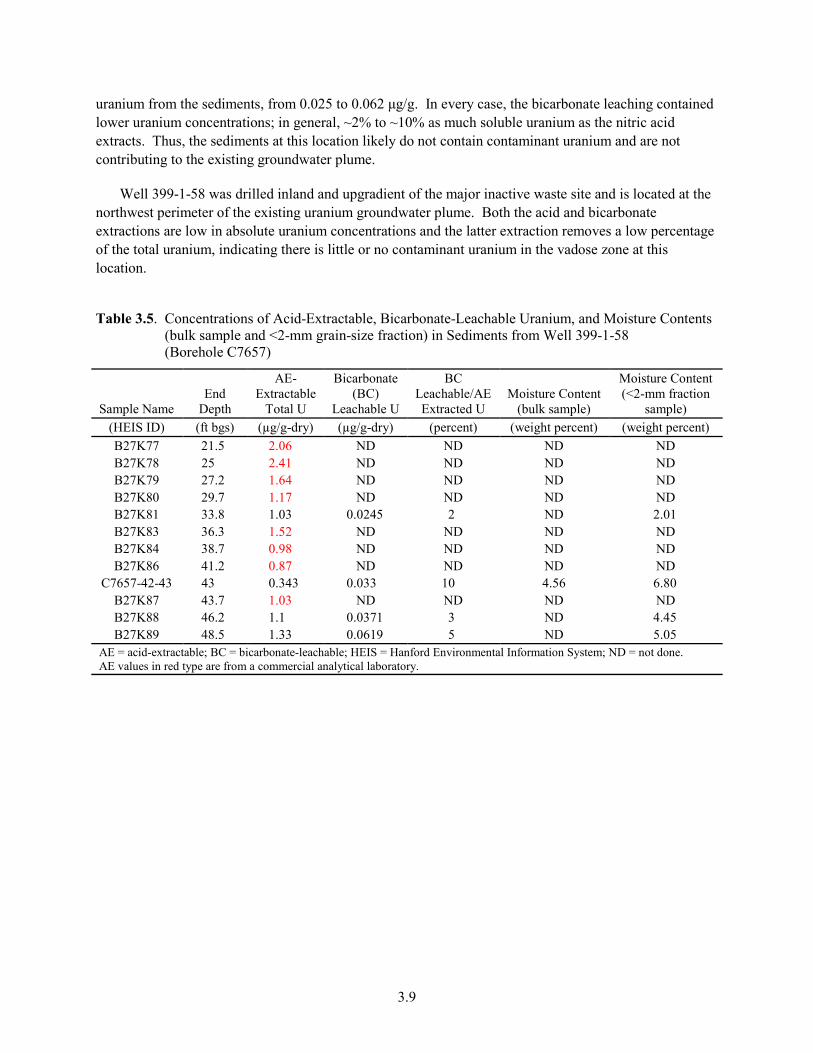
Well 399-1-58 was drilled inland and upgradient of the major inactive waste site and is located at the northwest perimeter of the existing uranium groundwater plume. Both the acid and bicarbonate extractions are low in absolute uranium concentrations and the latter extraction removes a low percentage of the total uranium, indicating there is little or no contaminant uranium in the vadose zone at this location.
Table 3.5. Concentrations of Acid-Extractable, Bicarbonate-Leachable Uranium, and Moisture Contents (bulk sample and <2-mm grain-size fraction) in Sediments from Well 399-1-58 (Borehole C7657)
Sample Name End
Depth
AE-Extractable
Total U
Bicarbonate (BC)
Leachable U
BC Leachable/AE Extracted U
Moisture Content (bulk sample)
Moisture Content (<2-mm fraction
sample) (HEIS ID) (ft bgs) (µg/g-dry) (µg/g-dry) (percent) (weight percent) (weight percent) B27K77 21.5 2.06 ND ND ND ND B27K78 25 2.41 ND ND ND ND B27K79 27.2 1.64 ND ND ND ND B27K80 29.7 1.17 ND ND ND ND B27K81 33.8 1.03 0.0245 2 ND 2.01 B27K83 36.3 1.52 ND ND ND ND B27K84 38.7 0.98 ND ND ND ND B27K86 41.2 0.87 ND ND ND ND
C7657-42-43 43 0.343 0.033 10 4.56 6.80 B27K87 43.7 1.03 ND ND ND ND B27K88 46.2 1.1 0.0371 3 ND 4.45 B27K89 48.5 1.33 0.0619 5 ND 5.05
AE = acid-extractable; BC = bicarbonate-leachable; HEIS = Hanford Environmental Information System; ND = not done. AE values in red type are from a commercial analytical laboratory.

3.10
10
15
20
25
30
35
40
45
50
55
0 1 2 3 4 5De
pth
ft b
gs
Uranium-238 [µg/g]
Well 399-1-58 AE UraniumBC Uranium
10
15
20
25
30
35
40
45
50
55
0 5 10 15 20 25 30 35
Dept
h ft
bgs
Moisture content [%]
Well 399-1-58
<2 mm fraction sample
Bulk sample
Figure 3.5. Concentrations of Acid-Extractable (AE) and Bicarbonate-Leachable Uranium (left), and
Moisture Content (bulk sample and <2-mm grain-size fraction) (right) versus Depth in Sediments from Well 399-1-58 (Borehole C7657). The thick dash line indicates the groundwater elevation measured on January 19, 2011, while the dotted lines represent the periodically rewetted zone.
3.6 Sediment from Well 339-1-59 (C7659)
3.6.1 Moisture Content
The moisture contents of two samples collected from well 399-1-59 are listed as a function of depth in Table 3.6 and plotted on Figure 3.6. Both moisture contents for bulk samples and the <2-mm grain-size fractions are reported. As expected, the gravel-dominated sediment of the vadose zone Hanford formation had low moisture content. The moisture content of the bulk samples was ~4 weight percent. In contrast, the moisture contents in the <2-mm grain-size sample fractions were ~9 weight percent to ~11 weight percent, increased by a factor of ~2 compared to the values from bulk samples.
3.6.2 Uranium in Sediments from Well 399-1-59
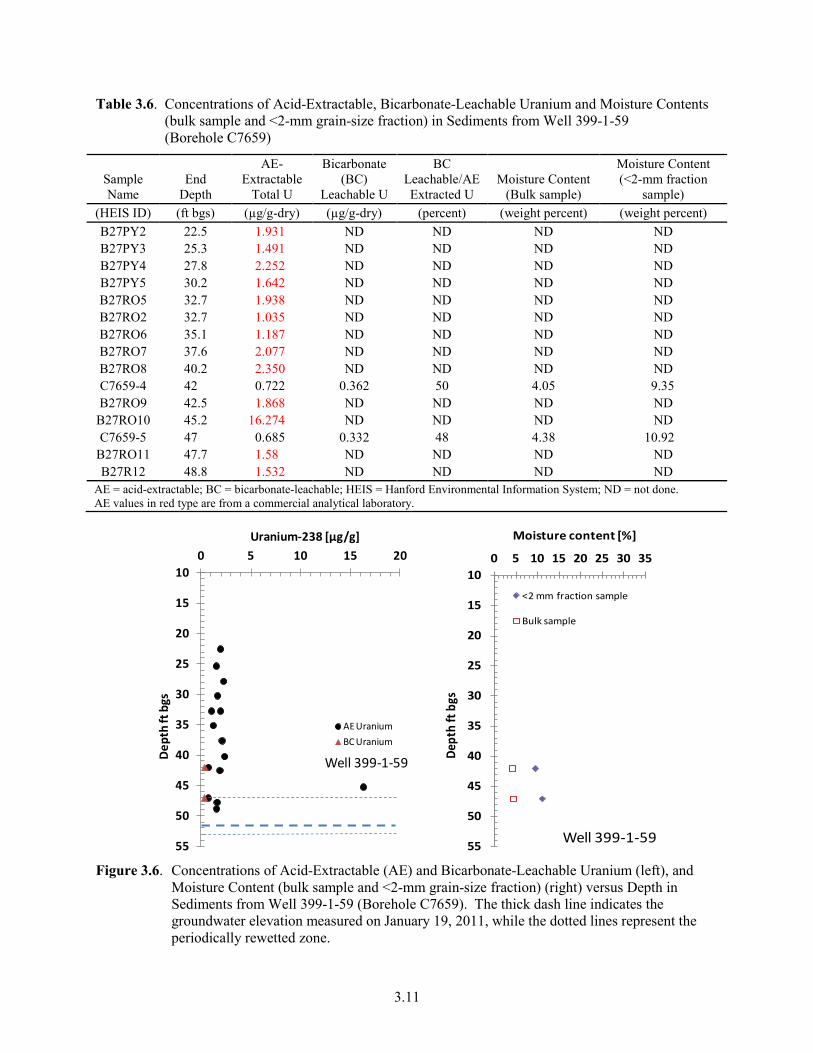
Table 3.6 and Figure 3.6 present the total acid-extractable and bicarbonate-leachable uranium data (measured as μg uranium-238/g sediment on a dry weight basis) as a function of depth for sediments collected from well 399-1-59. For the two samples that were bicarbonate leached, less uranium ranging from 0.332 to 0.362 μg/g was extracted. In both cases, the bicarbonate leaching contained 50% as much soluble uranium as the nitric acid extracts.
3.11
Table 3.6. Concentrations of Acid-Extractable, Bicarbonate-Leachable Uranium and Moisture Contents (bulk sample and <2-mm grain-size fraction) in Sediments from Well 399-1-59 (Borehole C7659)
Sample Name
End Depth
AE-Extractable
Total U
Bicarbonate (BC)
Leachable U
BC Leachable/AE Extracted U
Moisture Content (Bulk sample)
Moisture Content (<2-mm fraction
sample) (HEIS ID) (ft bgs) (µg/g-dry) (µg/g-dry) (percent) (weight percent) (weight percent) B27PY2 22.5 1.931 ND ND ND ND B27PY3 25.3 1.491 ND ND ND ND B27PY4 27.8 2.252 ND ND ND ND B27PY5 30.2 1.642 ND ND ND ND B27RO5 32.7 1.938 ND ND ND ND B27RO2 32.7 1.035 ND ND ND ND B27RO6 35.1 1.187 ND ND ND ND B27RO7 37.6 2.077 ND ND ND ND B27RO8 40.2 2.350 ND ND ND ND C7659-4 42 0.722 0.362 50 4.05 9.35 B27RO9 42.5 1.868 ND ND ND ND
B27RO10 45.2 16.274 ND ND ND ND C7659-5 47 0.685 0.332 48 4.38 10.92
B27RO11 47.7 1.58 ND ND ND ND B27R12 48.8 1.532 ND ND ND ND
AE = acid-extractable; BC = bicarbonate-leachable; HEIS = Hanford Environmental Information System; ND = not done. AE values in red type are from a commercial analytical laboratory.
10
15
20
25
30
35
40
45
50
55
0 5 10 15 20
Dep
th ft
bgs
Uranium-238 [µg/g]
Well 399-1-59
AE UraniumBC Uranium
10
15
20
25
30
35
40
45
50
55
0 5 10 15 20 25 30 35
Dept
h ft
bgs
Moisture content [%]
Well 399-1-59
<2 mm fraction sample
Bulk sample
Figure 3.6. Concentrations of Acid-Extractable (AE) and Bicarbonate-Leachable Uranium (left), and
Moisture Content (bulk sample and <2-mm grain-size fraction) (right) versus Depth in Sediments from Well 399-1-59 (Borehole C7659). The thick dash line indicates the groundwater elevation measured on January 19, 2011, while the dotted lines represent the periodically rewetted zone.

3.12
Well 399-1-59 was drilled inland to the west of the South Process Pond, so it was expected that low concentrations of contaminant uranium from the South Process Pond would be present in sediments. The observed high uranium concentration at 45.2 ft bgs is above the high water elevation postulated to have existed from high Columbia River stages prior to construction of upstream dams. It is possible high uranium concentration at 45.2 ft bgs is a remnant of contaminated fluids pushed upgradient during spring runoff of the Columbia River prior to construction of upstream dams.
3.7 Sediment from Well 339-2-32 (C7660)
3.7.1 Moisture Content
The moisture contents of seven samples collected from well 399-2-32 are listed as a function of depth in Table 3.7 and plotted in Figure 3.7. Moisture contents are reported for both bulk samples and for <2-mm grain-size fractions. Low moisture contents were reported for all seven samples (2.02–5.1 weight percent for bulk samples) although the four deeper samples were collected below the groundwater elevation. Compared to the bulk samples, the <2-mm grain-size fractions showed about twice as much moisture content (5.42–15.15 weight percent). The fact that the moisture content in the four samples from saturated zone (C7660-5, C7660-6, B27PL8, and B27PM3) was low can be attributed to the poor ability of gravel to retain pore water in the split-spoon sampler as it was being pulled up and out of the borehole.
3.7.2 Uranium in Sediments from Well 399-2-32
Table 3.7 and Figure 3.7 present the total acid-extractable and bicarbonate-leachable uranium data (measured as μg uranium-238/g sediment on a dry weight basis) as a function of depth for sediments collected from well 399-2-32. Acid-extractable uranium concentrations ranged from a low of 1.26 μg/g in the aquifer sediments at 43 ft bgs to a maximum of 27 μg/g at 18 ft bgs in the vadose zone. In comparison for those sediments that were extracted with both methods, bicarbonate leaching method released much less uranium from the sediments, from 0.57 to 5.29 μg/g. In each case, bicarbonate leaching contained lower uranium concentrations; in general, ~44% to ~95% as much soluble uranium as the nitric acid extracts. Figure 3.7 shows a general trend of decreasing uranium concentration with depth, except two samples in the aquifer (B27PF6 and B27PL8) that contained more <2-mm particles than the Hanford formation gravels above and below this depth. The maximum residual uranium concentration is associated with the shallowest vadose zone, well above the periodically rewetted zone.
Well 399-2-32 was drilled northeast and close to the South Process Pond. It was expected that sediments would contain concentrations of contaminant uranium. Elevated residual uranium concentrations were observed in the vadose zone between 15 and 25 ft bgs above the periodically rewetted zone (found between 23 and 34 ft bgs at this borehole).

3.13
Table 3.7. Concentrations of Acid-Extractable, Bicarbonate-Leachable Uranium, and Moisture Contents (bulk sample and <2-mm grain-size fraction) in Sediments from Well 399-2-32 (Borehole C7660)
Sample Name
End Depth
AE-Extractable
Total U
Bicarbonate (BC)
Leachable U
BC Leachable/A
E Extracted U Moisture Content
(bulk sample)
Moisture Content (<2-mm fraction
sample) (HEIS ID) (ft bgs) (µg/g-dry) (µg/g-dry) (percent) (weight percent) (weight percent) B27PD8 15.5 22.44 ND ND ND ND B27PD9 18 27.04 ND ND ND ND C7660-2 20 5.59 5.29 95 NA 15.15 B27PF0 20.5 6.43 ND ND ND ND B27PF1 23 5.14 ND ND ND ND C7660-3 25 3.13 2.33 74 2.02 5.42 B27PF3 25.5 7.62 ND ND ND ND B27PF4 28 3.42 ND ND ND ND C7660-4 29 2.19 1.86 85 3.78 8.91 B27PF5 30.5 5.30 ND ND ND ND C7660-5 31.5 2.27 2.02 89 3.49 8.39 B27PC5 33 3.15 ND ND ND ND C7660-6 34 1.81 0.945 52 4.94 9.51 B27PF6 35.5 4.20 ND ND ND ND B27PL8 38 4.2 1.84 44 4.99 13.52 B27PM3 43 1.26 0.572 45 5.1 10.26
AE = acid-extractable; BC = bicarbonate-leachable; HEIS = Hanford Environmental Information System; ND = not done. AE values in red type are from a commercial analytical laboratory.
10
15
20
25
30
35
40
45
50
55
0 10 20 30
Dep
th ft
bgs
Uranium-238 [µg/g]
Well 399-2-32 AE UraniumBC Uranium
10
15
20
25
30
35
40
45
50
55
0 5 10 15 20 25 30 35
Dept
h ft
bgs
Moisture content [%]
Well 399-2-32
<2 mm fraction sample
Bulk sample
Figure 3.7. Concentrations of Acid-Extractable (AE) and Bicarbonate-Leachable Uranium (left), and
Moisture Content (bulk sample and <2-mm grain-size fraction) (right) versus Depth in Sediments from Well 399-2-32 (Borehole C7660). The thick dash line indicates the groundwater elevation measured on January 19, 2011, while the dotted lines represent the periodically rewetted zone.
3.14
3.8 Sediment from Well 339-3-33 (C7663)
3.8.1 Moisture Content
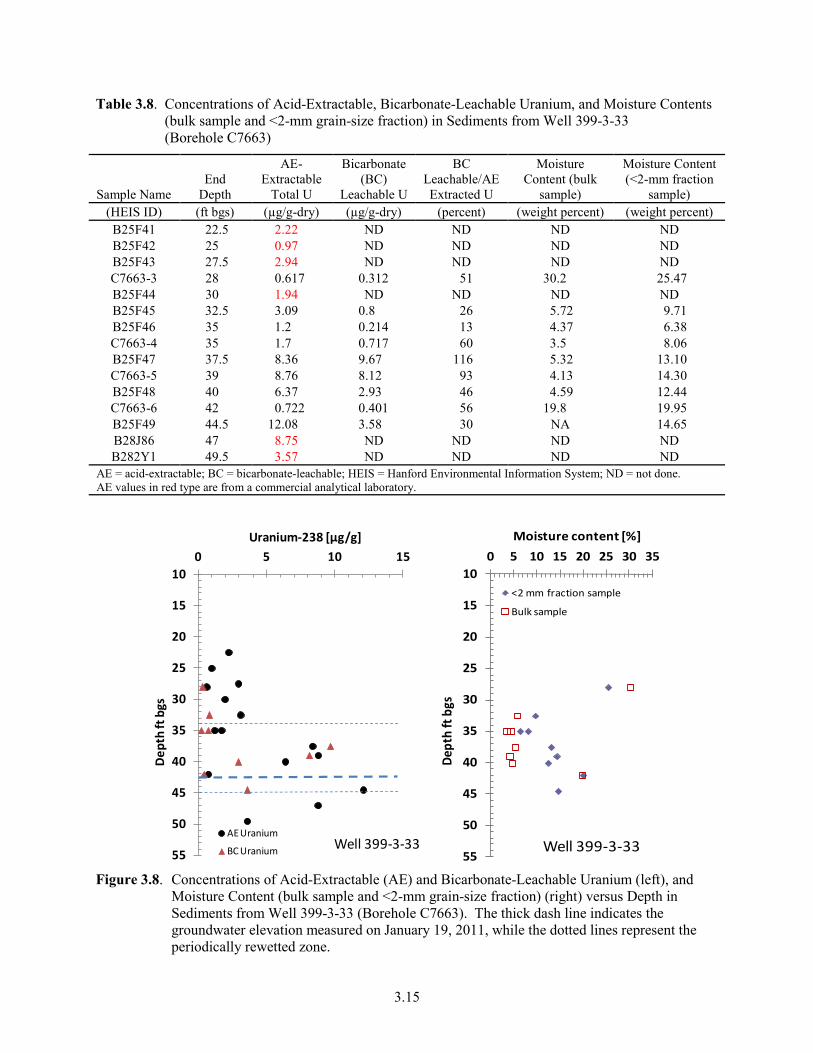
The moisture contents of nine samples collected from well 399-3-33 are listed as a function of depth in Table 3.8 and plotted in Figure 3.8. Moisture contents from both bulk samples and from <2-mm grain-size fractions are reported. Low moisture contents were reported for six out of seven samples (3.5–5.72 weight percent for bulk samples) collected in the vadose zone. Compared to the bulk samples, the <2-mm grain-size fractions from these six samples showed about twice as much moisture content (6.38–14.3 weight percent).
The two samples from grab sample C7663-3 (from 28 ft bgs) showed similar high moisture contents for both bulk and <2-mm grain-size fraction samples (25.47–30.2 weight percent). The high moisture contents could be explained by the dominance of yellow-brown-colored clay material within the sediment. Two other high moisture (~15–20 weight percent) containing samples were collected (C7663-6) near and (B25F49) below the groundwater elevation, while water-saturated sample B25F49 showed less water content compared to sample C7663-6. These might reflect different sediment lithology where sample C7663-6 might contain more fine-grained sediments.
3.8.2 Uranium in Sediments from Well 399-3-33
Table 3.8 and Figure 3.8 present the total acid-extractable and bicarbonate-leachable uranium data (measured as μg uranium-238/g sediment on a dry weight basis) as a function of depth for sediments collected from well 399-3-33. Acid-extractable uranium concentrations ranged from a low of 0.62 to a maximum of 12.08 μg/g. There appears to be two regions with relatively elevated acid-extractable uranium—one in the periodically rewetted zone (35 to 45 ft bgs) and one in the upper aquifer sediments (44 to 49 ft bgs). In comparison, bicarbonate leaching released much less uranium from the sediments, from 0.312 to 9.67 μg/g. In most cases, bicarbonate leachates contained lower uranium concentrations; in general, ~18% to ~93% as much soluble uranium as the nitric acid extracts. In sample B25F47, the bicarbonate solution-leached uranium concentration was higher than that of acid-extracted uranium in the same sample, which may be attributed to measurement errors. A maximum acid-extractable and bicarbonate-leachable uranium concentration was found at depths of 37.5-39 ft bgs.
Well 399-3-33 was drilled near the Columbia River, east of the ash pit. Coal ash disposed in the pit may have contained labile uranium that was not associated with Hanford Site fuel fabrication activities. Alternatively, the elevated residual acid-leachable uranium and slightly elevated labile uranium concentrations may represent contaminant uranium from the South Process Pond.
3.15
Table 3.8. Concentrations of Acid-Extractable, Bicarbonate-Leachable Uranium, and Moisture Contents (bulk sample and <2-mm grain-size fraction) in Sediments from Well 399-3-33 (Borehole C7663)
Sample Name End
Depth
AE-Extractable
Total U
Bicarbonate (BC)
Leachable U
BC Leachable/AE Extracted U
Moisture Content (bulk
sample)
Moisture Content (<2-mm fraction
sample) (HEIS ID) (ft bgs) (µg/g-dry) (µg/g-dry) (percent) (weight percent) (weight percent) B25F41 22.5 2.22 ND ND ND ND B25F42 25 0.97 ND ND ND ND B25F43 27.5 2.94 ND ND ND ND C7663-3 28 0.617 0.312 51 30.2 25.47 B25F44 30 1.94 ND ND ND ND B25F45 32.5 3.09 0.8 26 5.72 9.71 B25F46 35 1.2 0.214 13 4.37 6.38 C7663-4 35 1.7 0.717 60 3.5 8.06 B25F47 37.5 8.36 9.67 116 5.32 13.10 C7663-5 39 8.76 8.12 93 4.13 14.30 B25F48 40 6.37 2.93 46 4.59 12.44 C7663-6 42 0.722 0.401 56 19.8 19.95 B25F49 44.5 12.08 3.58 30 NA 14.65 B28J86 47 8.75 ND ND ND ND B282Y1 49.5 3.57 ND ND ND ND
AE = acid-extractable; BC = bicarbonate-leachable; HEIS = Hanford Environmental Information System; ND = not done. AE values in red type are from a commercial analytical laboratory.
10
15
20
25
30
35
40
45
50
55
0 5 10 15
Dep
th ft
bgs
Uranium-238 [µg/g]
Well 399-3-33 AE Uranium
BC Uranium
10
15
20
25
30
35
40
45
50
55
0 5 10 15 20 25 30 35
Dept
h ft
bgs
Moisture content [%]
Well 399-3-33
<2 mm fraction sample
Bulk sample
Figure 3.8. Concentrations of Acid-Extractable (AE) and Bicarbonate-Leachable Uranium (left), and
Moisture Content (bulk sample and <2-mm grain-size fraction) (right) versus Depth in Sediments from Well 399-3-33 (Borehole C7663). The thick dash line indicates the groundwater elevation measured on January 19, 2011, while the dotted lines represent the periodically rewetted zone.
3.16
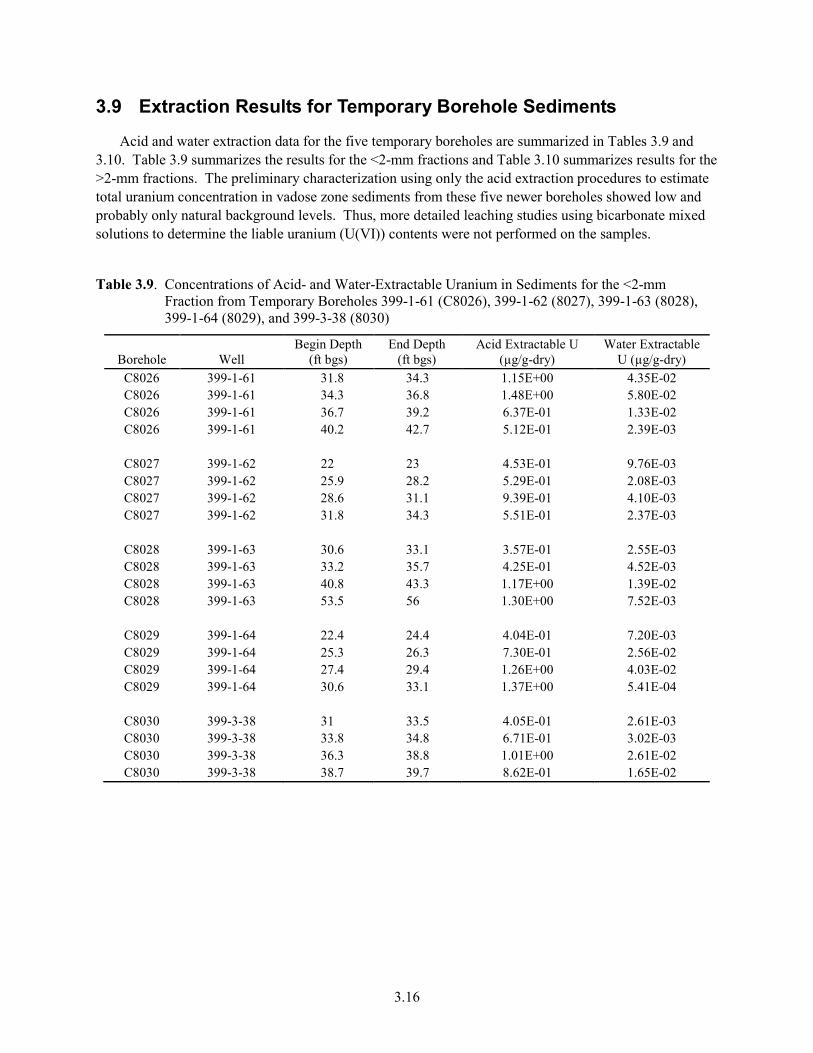
3.9 Extraction Results for Temporary Borehole Sediments
Acid and water extraction data for the five temporary boreholes are summarized in Tables 3.9 and 3.10. Table 3.9 summarizes the results for the <2-mm fractions and Table 3.10 summarizes results for the >2-mm fractions. The preliminary characterization using only the acid extraction procedures to estimate total uranium concentration in vadose zone sediments from these five newer boreholes showed low and probably only natural background levels. Thus, more detailed leaching studies using bicarbonate mixed solutions to determine the liable uranium (U(VI)) contents were not performed on the samples.
Table 3.9. Concentrations of Acid- and Water-Extractable Uranium in Sediments for the <2-mm Fraction from Temporary Boreholes 399-1-61 (C8026), 399-1-62 (8027), 399-1-63 (8028), 399-1-64 (8029), and 399-3-38 (8030)
Borehole Well Begin Depth
(ft bgs) End Depth
(ft bgs) Acid Extractable U
(µg/g-dry) Water Extractable
U (µg/g-dry) C8026 399-1-61 31.8 34.3 1.15E+00 4.35E-02 C8026 399-1-61 34.3 36.8 1.48E+00 5.80E-02 C8026 399-1-61 36.7 39.2 6.37E-01 1.33E-02 C8026 399-1-61 40.2 42.7 5.12E-01 2.39E-03
C8027 399-1-62 22 23 4.53E-01 9.76E-03 C8027 399-1-62 25.9 28.2 5.29E-01 2.08E-03 C8027 399-1-62 28.6 31.1 9.39E-01 4.10E-03 C8027 399-1-62 31.8 34.3 5.51E-01 2.37E-03
C8028 399-1-63 30.6 33.1 3.57E-01 2.55E-03 C8028 399-1-63 33.2 35.7 4.25E-01 4.52E-03 C8028 399-1-63 40.8 43.3 1.17E+00 1.39E-02 C8028 399-1-63 53.5 56 1.30E+00 7.52E-03
C8029 399-1-64 22.4 24.4 4.04E-01 7.20E-03 C8029 399-1-64 25.3 26.3 7.30E-01 2.56E-02 C8029 399-1-64 27.4 29.4 1.26E+00 4.03E-02 C8029 399-1-64 30.6 33.1 1.37E+00 5.41E-04
C8030 399-3-38 31 33.5 4.05E-01 2.61E-03 C8030 399-3-38 33.8 34.8 6.71E-01 3.02E-03 C8030 399-3-38 36.3 38.8 1.01E+00 2.61E-02 C8030 399-3-38 38.7 39.7 8.62E-01 1.65E-02
3.17
Table 3.10. Concentrations of Acid- and Water-Extractable Uranium in Sediments for the >2-mm Fraction from Temporary Boreholes 399-1-61 (C8026), 399-1-62 (8027), 399-1-63 (8028), 399-1-64 (8029), and 399-3-38 (8030)
Borehole Well Begin Depth
(ft bgs) End Depth
(ft bgs) Acid Extractable U
(µg/g-dry) Water Extractable
U (µg/g-dry) C8026 399-1-61 31.8 34.3 7.46E-01 2.48E-02 C8026 399-1-61 34.3 36.8 3.06E+00 3.54E-02 C8026 399-1-61 36.7 39.2 4.44E-01 5.76E-03 C8026 399-1-61 40.2 42.7 3.13E-01 1.62E-04
C8027 399-1-62 22 23 5.12E-01 2.17E-03 C8027 399-1-62 25.9 28.2 5.28E-01 3.98E-03 C8027 399-1-62 28.6 31.1 NA NA C8027 399-1-62 31.8 34.3 NA NA
C8028 399-1-63 30.6 33.1 2.62E-01 1.03E-03 C8028 399-1-63 33.2 35.7 2.86E-01 1.82E-03 C8028 399-1-63 40.8 43.3 9.09E-01 1.27E-03 C8028 399-1-63 53.5 56 7.96E-01 6.10E-04
C8029 399-1-64 22.4 24.4 2.79E-01 2.08E-03 C8029 399-1-64 25.3 26.3 4.46E-01 1.15E-02 C8029 399-1-64 27.4 29.4 7.38E-01 1.36E-02 C8029 399-1-64 30.6 33.1 6.39E-01 3.84E-04
C8030 399-3-38 31 33.5 3.58E-01 1.26E-03 C8030 399-3-38 33.8 34.8 5.08E-01 5.38E-04 C8030 399-3-38 36.3 38.8 7.45E-01 7.03E-03 C8030 399-3-38 38.7 39.7 5.04E-01 5.83E-03
NA = No size fraction recovered.
3.10 Labile Uranium Leaching Using Bicarbonate Solution
Labile uranium leaching experiments were performed on three selected air-dried sediments using the sodium bicarbonate/carbonate (0.0144 M in NaHCO3 and 0.0028 M in Na2CO3) mixed solution recommended by Kohler et al. (2004). The three samples, C7654-24-25.2, B27F48, and B278D8, were selected based on the presence of higher acid-extractable and equilibrium labile uranium concentrations compared to other sediments during the acid and bicarbonate equilibrium extraction experiments.
Figure 3.9 presents results of the time-dependent labile uranium leach tests; the data are reported as μg uranium leached per gram of sediment on a dry weight basis. Two primary trends are evident despite the different initial residual acid-extractable uranium concentrations in each sample (74.8, 37.5, and 11.63 µg/g for sample C7654-24-25.2, B27F48, and B278D8, respectively). The first trend involves a rapid release of uranium from each sediment. This initial release occurs within the first ~200 hours of reaction. The second trend is characterized as a slow, continual release of uranium from the sediments (see the leached uranium concentration curves after 200 hours until the end of the experiment). The kinetics of the second trend appear to extend beyond 1000 hours of reaction time, as steady-state uranium
3.18
solution concentrations were still not obtained for any of the samples analyzed. However, the increase in the leached uranium concentration was very slow during 270–1000 hours; thus, approximate equilibrium can be assumed after 1000 hours of leaching, which has been adopted for 300 Area sediments by the Integrated Field Research Challenge Project (see Zachara et al. 2005 for more discussion).
05
101520253035404550
0 200 400 600 800 1000 1200
Leac
hed
u(VI
) [µg
/g-d
ry]
Time [hours]C7654-24-25.2 B27F48 B278D8
Figure 3.9. Leachable Uranium Concentrations versus Reaction Time for Samples C7654-24-25.2,
B27F48, and B278D8 using Bicarbonate Leaching Solution
3.11 Particle-Size Effect on Uranium Concentrations
Particle-size distribution data for two sediments, C7654-24-25.2 and C7654-34-35, are shown in Table 3.9. The vadose zone sediments are from borehole C7654 (399-1-55) drilled in the southwest corner (where the inlet was) of the remediated North Process Pond. Sample C7654-24-25.2 is within the vadose zone right above the top of the current periodically rewetted zone. Sample C7654-34-35 is within the aquifer near the top of the water table. Both samples were dominated by gravel (67.53 and 78.15 weight percent, respectively). The coarse nature of these two sediments is typical of gravel-dominated Hanford formation sediments. Within the <2-mm grain-size fractions of these two sediments, coarse and medium sand account for 27 and 19 weight percent, respectively, and fine-grained materials (fine sand and silty/clay) represent only ~5 and ~3 weight percent, respectively.
The 8 M nitric acid-extracted uranium concentration as a function of the various size fractions for the two samples is listed in Table 3.11. By relating the particle size and uranium concentration, these data indicate there is a connection between sediment particle size and the amount of uranium present in a sample. In general, total uranium concentrations increased as the particle size decreased. In both samples, the highest uranium concentration was found in the silt/clay-size fractions (176 and 66.2 µg/g for samples C7654-24-25.2 and C7654-34-34, respectively), while the coarse-sand fractions of each sediment contained about half as much acid-extractable uranium (81.8 and 33.4 µg/g for samples C7654-24-25.2 and C7654-34-34, respectively). This finding is consistent with results in Um et al. (2010), who did similar experiments with both fine-grained lens materials and coarse-grained sand samples collected from the Hanford Site.
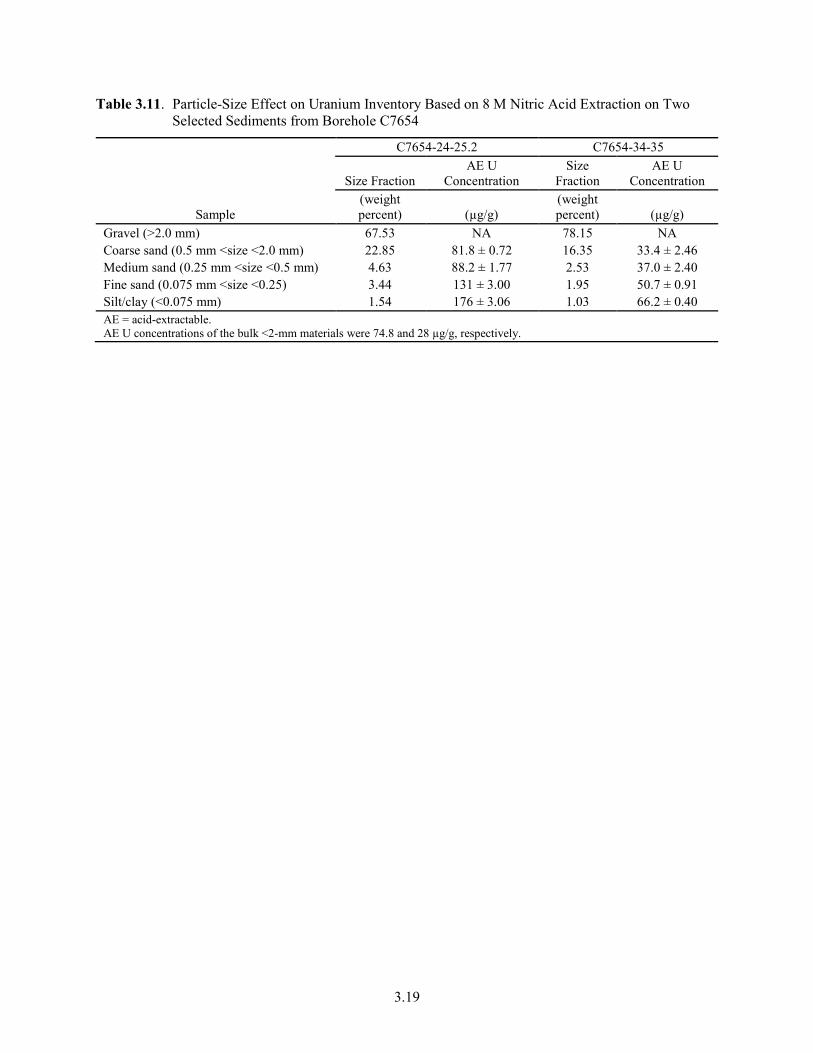
3.19
Table 3.11. Particle-Size Effect on Uranium Inventory Based on 8 M Nitric Acid Extraction on Two Selected Sediments from Borehole C7654
Sample
C7654-24-25.2 C7654-34-35
Size Fraction AE U
Concentration Size
Fraction AE U
Concentration (weight percent) (µg/g)
(weight percent) (µg/g)
Gravel (>2.0 mm) 67.53 NA 78.15 NA Coarse sand (0.5 mm <size <2.0 mm) 22.85 81.8 ± 0.72 16.35 33.4 ± 2.46 Medium sand (0.25 mm <size <0.5 mm) 4.63 88.2 ± 1.77 2.53 37.0 ± 2.40 Fine sand (0.075 mm <size <0.25) 3.44 131 ± 3.00 1.95 50.7 ± 0.91 Silt/clay (<0.075 mm) 1.54 176 ± 3.06 1.03 66.2 ± 0.40 AE = acid-extractable. AE U concentrations of the bulk <2-mm materials were 74.8 and 28 µg/g, respectively.

4.1
4.0 Discussion
The total concentrations of Hanford Site fuel-fabrication derived (anthropogenic) labile uranium in the sediments varied among the investigated boreholes and depth within each borehole. The peak 8-M acid-extractable uranium concentration (114.84 µg/g) was found in borehole 399-1-55, which was drilled directly in the southwest corner of the North Process Pond. This is the location where waste fluids entered the pond. Lower acid-extractable uranium concentrations (~0.3-2.5 µg/g) were found throughout boreholes 399-1-57, 399-1-58, and 399-1-59, which were drilled either near Columbia River or inland and upgradient of any waste process ponds or trenches. A general trend of “total” uranium concentrations that increased as the particle size decreased was observed.
The labile uranium as defined by bicarbonate leaching indicated a two-step leaching rate: an initial rapid release, followed by a slow continual release of uranium from the sediment. A quasi-leaching-equilibrium could be assumed after 1000 hours reaction using <2-mm size fractions in this study.
Although not studied in the same detail, sediments from boreholes 399-1-54 (C7653), 399-6-5 (C8285), and 399-4-15 (C7662) that contain low 8-M nitric acid extractable uranium are likely not contaminated with uranium.

5.1
5.0 References
ASTM D2216-98. 1998. “Test Method for Laboratory Determination of Water (Moisture) Content of Soil and Rock by Mass.” ASTM International, West Conshohocken, Pennsylvania, DOI:10.1520/D2216-98.
Brinton SK. 2011. Borehole Summary Report for the Installation of Eleven Wells to Support RI/FS in the 300-FF-5 Operable Unit. SGW-50054, Revision 0, CH2M HILL Plateau Remediation Company, Richland, Washington.
Brown CF, W Um, and RJ Serne. 2008. Uranium Contamination in the 300 Area: Emergent Data and Their Impact on the Source Term Conceptual Model. PNNL-17793, Pacific Northwest National Laboratory, Richland, Washington.
Environmental Protection Agency – EPA. 2000. “Acid Digestion of Sediments, Sludges, and Soils.” Test Methods for Evaluating Solid Waste, Physical/Chemical Methods. EPA Publication SW-846, Method 3050B. Environmental Protection Agency, Washington, D.C. Accessed October 29, 2012, at http://www.epa.gov/epaoswer/hazwaste/test/sw846.htm.
Gerber MS. 1992. Past Practices Technical Characterization Study – 300 Area –Hanford Site. WHC-MR-0388, Westinghouse Hanford Company, Richland, Washington.
Kohler M, GP Curtis, DE Meece, and JA Davis. 2004. “Methods for Estimating Adsorbed Uranium (VI) and Distribution Coefficients of Contaminated Sediments.” Environmental Science & Technology 38:240–247.
Peterson RE, RJ Serne, PD Thorne, MD Williams, and ML Rockhold. 2008. Uranium Contamination in the Subsurface Beneath the 300 Area, Hanford Site, Washington. PNNL-17034, Pacific Northwest National Laboratory, Richland, Washington.
Serne RJ, CF Brown, HT Schaef, EM Pierce, MJ Lindberg, Z Wang, PL Gassman, and JG Catalano. 2002. 300 Area Leach and Adsorption Project. PNNL-14022, Pacific Northwest National Laboratory, Richland, Washington.
Um W, JP Icenhower, CF Brown, RJ Serne, Z Wang, CJ Dodge, and AJ Francis. 2010. “Characterization of Uranium-Contaminated Sediments from beneath a Nuclear Waste Storage Tank from Hanford, Washington: Implications for Contaminant Transport and Fate.” Geochimica et Cosmochimica Acta 74: 1363–1380.
Williams BA, CF Brown, W Um, MJ Nimmons, RE Peterson, NA Bjornstad, DC Lanigan, RJ Serne, FA Spane, and ML Rockhold. 2007. Limited Field Investigation Report for Uranium Contamination in the 300-FF-5 Operable Unit at the 300 Area, Hanford Site, Washington. PNNL-16435, Pacific Northwest National Laboratory, Richland, Washington.
Zachara JM, JA Davis, C Liu, JP McKinley, N Qafoku, DM Wellman, and SB Yabusaki. 2005. Uranium Geochemistry in Vadose Zone and Aquifer Sediments from the 300 Area Uranium Plume. PNNL-15121, Pacific Northwest National Laboratory, Richland, Washington.
Appendix A –
Photographs of Sediments Used in the PNNL Laboratory Leach/Extraction Studies
A.1
Appendix A
Photographs of Sediments Used in the PNNL Laboratory Leach/Extraction Studies
This appendix contains photographs of sediments in the studied boreholes. Additional photographs and detailed field geologist descriptions, borehole/well construction and geophysical logging for gamma emitters and moisture (using neutron logging) are found in Brinton (2011).
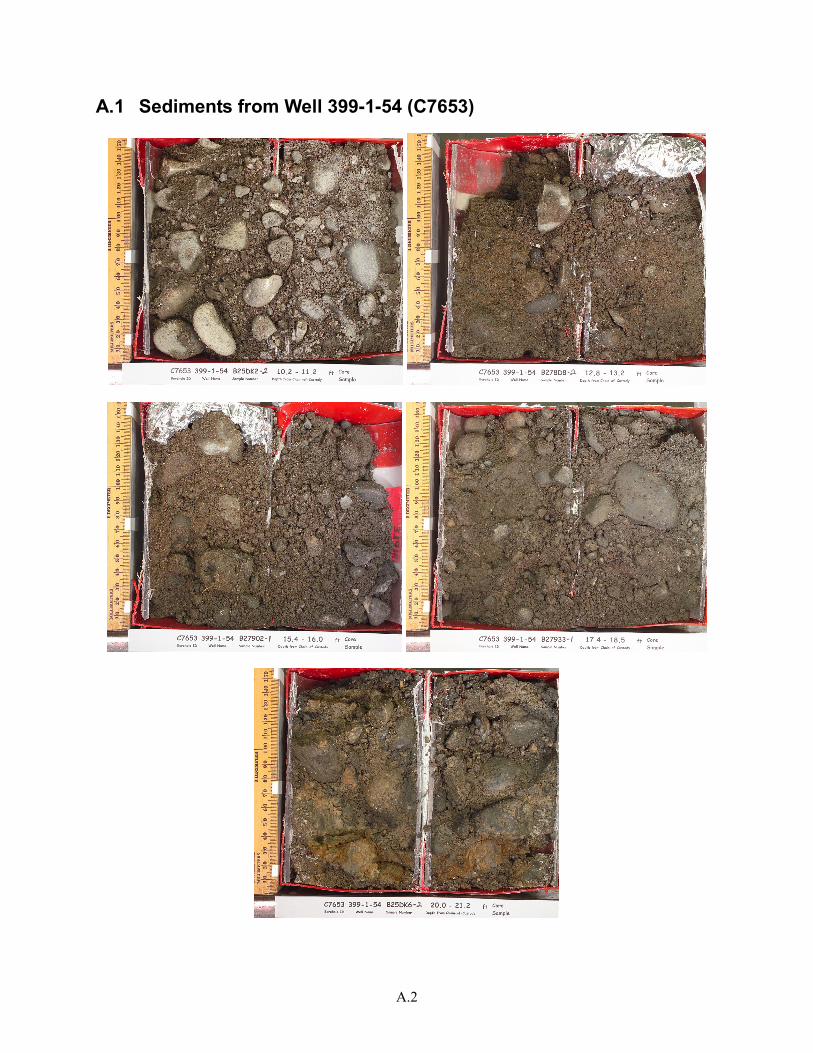
A.2
A.1 Sediments from Well 399-1-54 (C7653)
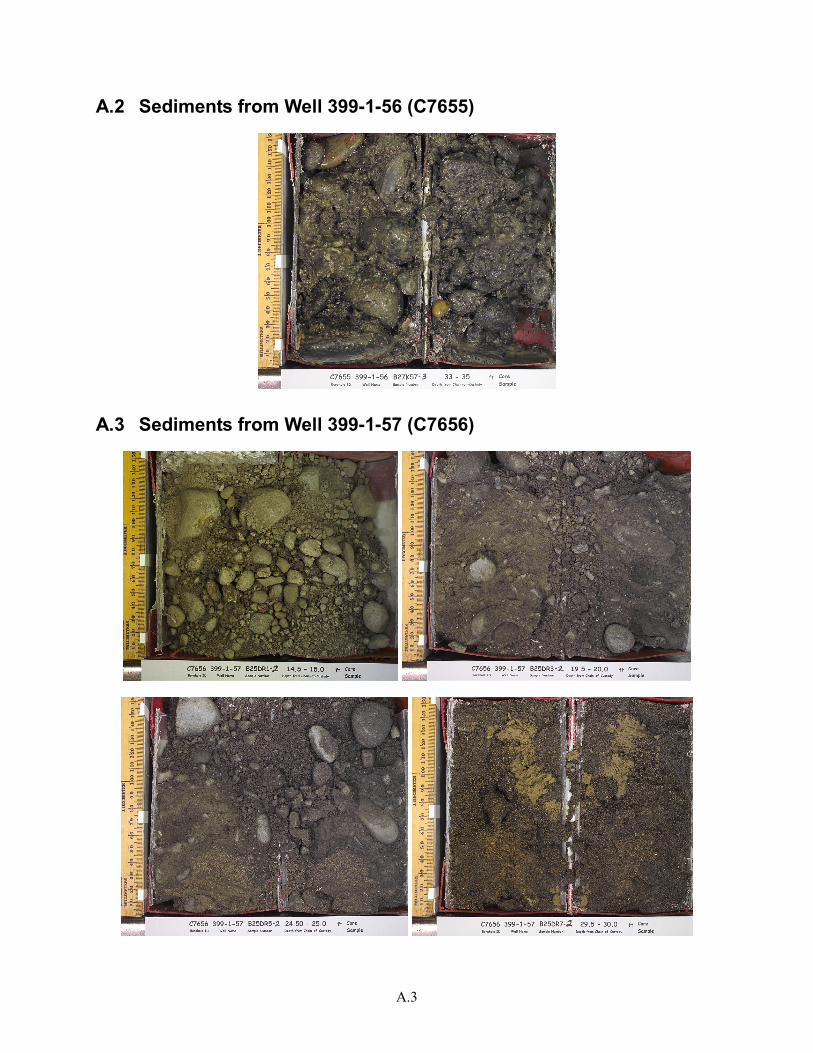
A.3
A.2 Sediments from Well 399-1-56 (C7655)
A.3 Sediments from Well 399-1-57 (C7656)
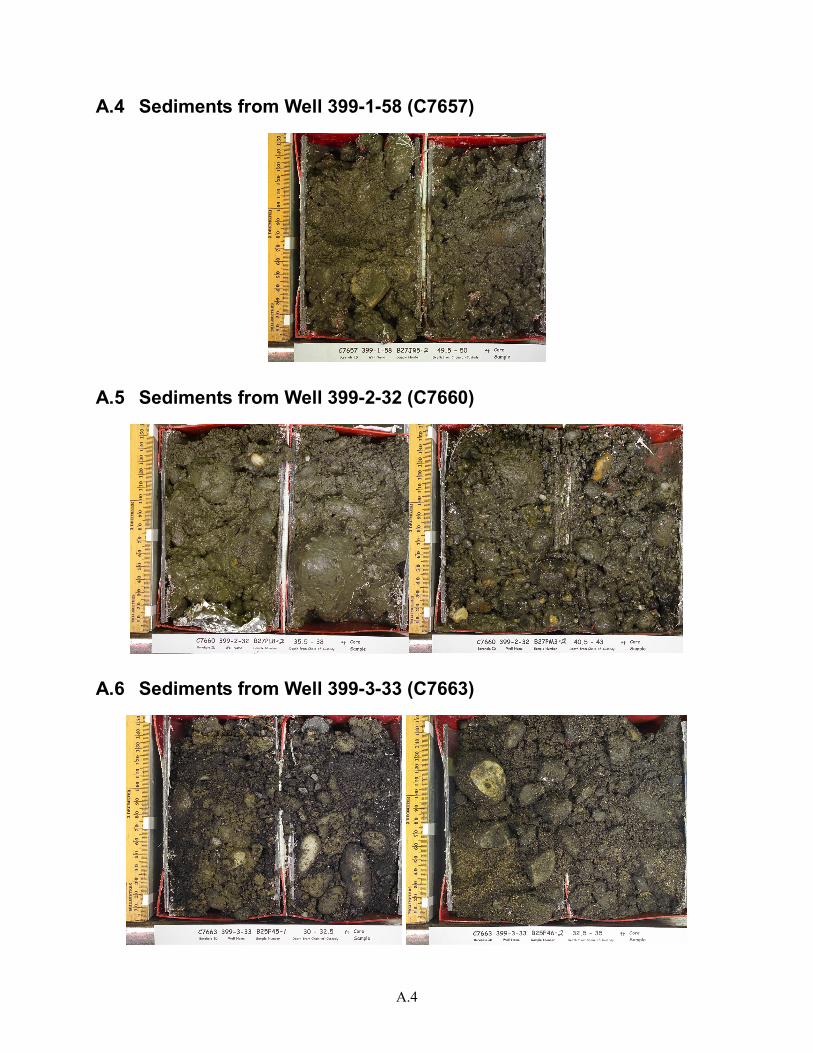
A.4
A.4 Sediments from Well 399-1-58 (C7657)
A.5 Sediments from Well 399-2-32 (C7660)
A.6 Sediments from Well 399-3-33 (C7663)
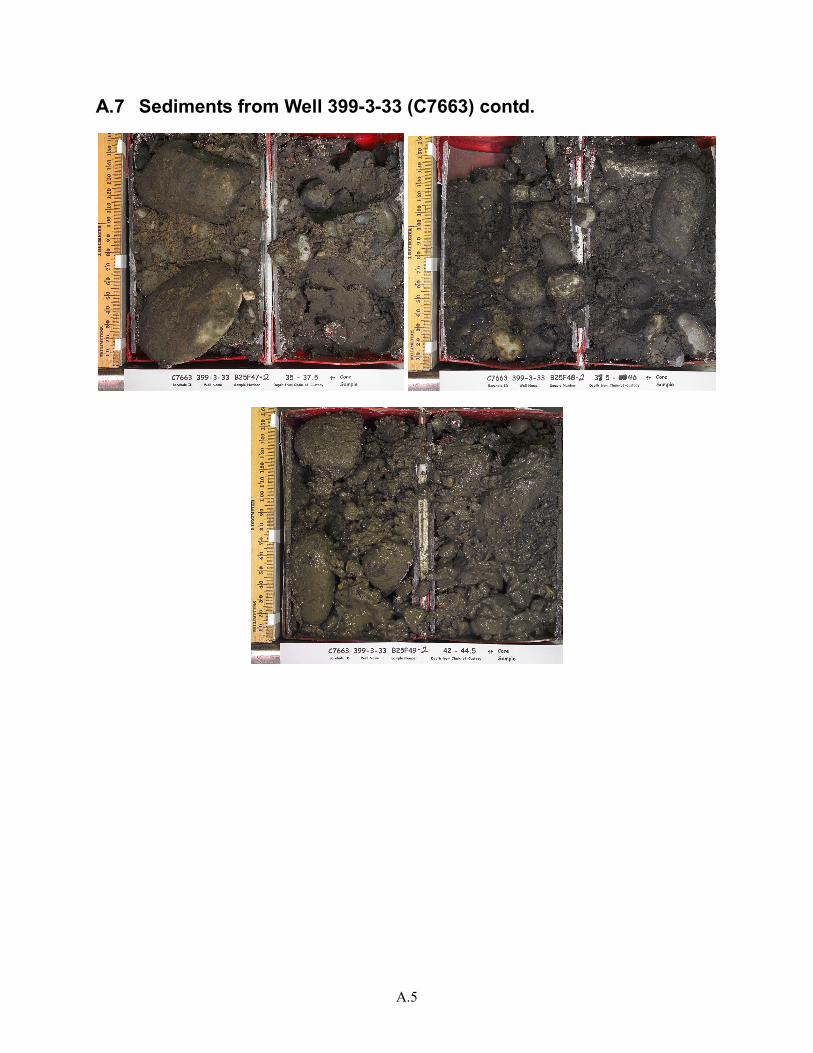
A.5
A.7 Sediments from Well 399-3-33 (C7663) contd.

Appendix B –
Initial Sediment Characterization Data
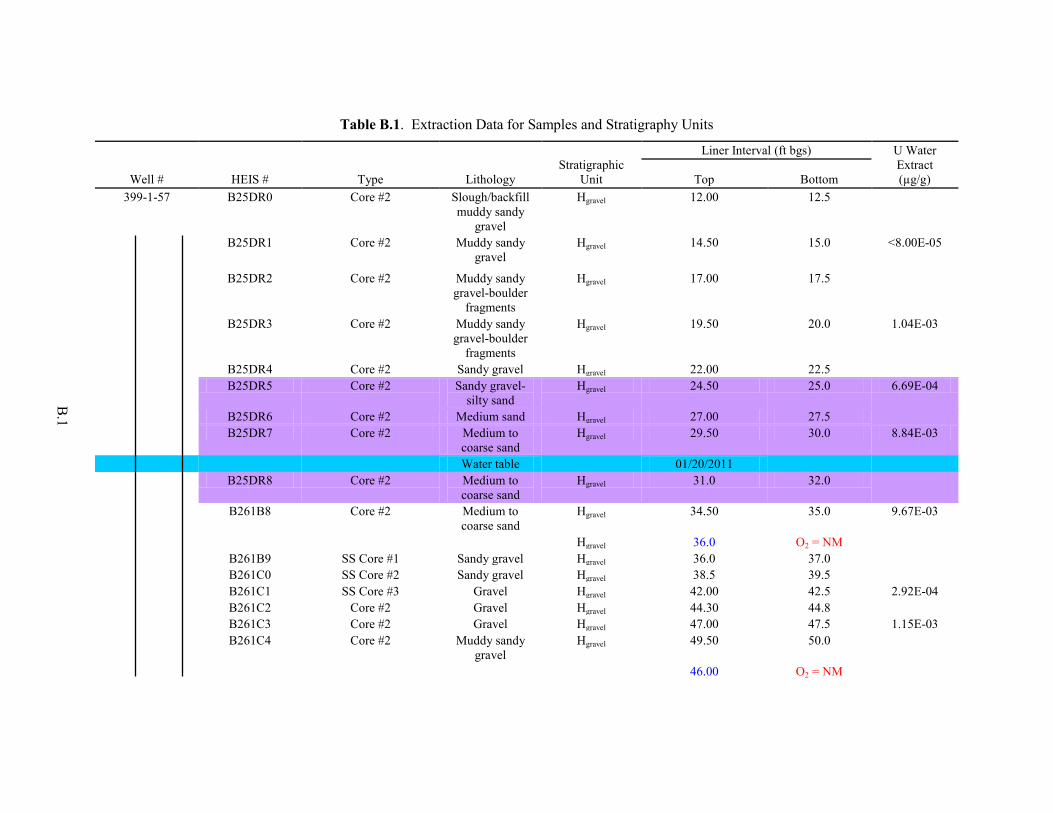
B.1
Table B.1. Extraction Data for Samples and Stratigraphy Units
Well # HEIS # Type Lithology Stratigraphic
Unit
Liner Interval (ft bgs) U Water Extract (µg/g) Top Bottom
399-1-57 B25DR0 Core #2 Slough/backfill muddy sandy
gravel
Hgravel 12.00 12.5
B25DR1 Core #2 Muddy sandy gravel
Hgravel 14.50 15.0 <8.00E-05
B25DR2 Core #2 Muddy sandy gravel-boulder
fragments
Hgravel 17.00 17.5
B25DR3 Core #2 Muddy sandy gravel-boulder
fragments
Hgravel 19.50 20.0 1.04E-03
B25DR4 Core #2 Sandy gravel Hgravel 22.00 22.5 B25DR5 Core #2 Sandy gravel-
silty sand Hgravel 24.50 25.0 6.69E-04
B25DR6 Core #2 Medium sand Hgravel 27.00 27.5 B25DR7 Core #2 Medium to
coarse sand Hgravel 29.50 30.0 8.84E-03
Water table 01/20/2011 B25DR8 Core #2 Medium to
coarse sand Hgravel 31.0 32.0
B261B8 Core #2 Medium to coarse sand
Hgravel 34.50 35.0 9.67E-03
Hgravel 36.0 O2 = NM B261B9 SS Core #1 Sandy gravel Hgravel 36.0 37.0 B261C0 SS Core #2 Sandy gravel Hgravel 38.5 39.5 B261C1 SS Core #3 Gravel Hgravel 42.00 42.5 2.92E-04 B261C2 Core #2 Gravel Hgravel 44.30 44.8 B261C3 Core #2 Gravel Hgravel 47.00 47.5 1.15E-03 B261C4 Core #2 Muddy sandy
gravel Hgravel 49.50 50.0
46.00 O2 = NM

B.2
Table B.1. (contd)
Well # HEIS # Type Lithology Stratigraphic
Unit
Liner Interval (ft bgs) U Water Extract (µg/g) Top Bottom
B261C5 Core #2 Sandy gravel Hgravel 52.00 52.5 1.92E-04 B261C6 Core #2 Muddy sandy
gravel Hgravel 54.50 55.0 1.84E-02
B261C7 Core N/A Rgravel 57.00 57.5 B261C8 Core N/A Rgravel 59.50 60.0 B261C9 Core N/A Rgravel 62.00 62.5 B261D0 Core N/A Rgravel 64.50 65.0 B261D1 Core N/A Rgravel 67.00 67.5 B261D2 Core N/A Rgravel 69.30 69.8 Rgravel 66 O2 = NM B276R1 Core N/A Rgravel 72.00 72.5 B276R2 Core N/A Rsand 74.20 74.7 B276R3 Core N/A Rsand 77.00 77.5 B276R4 Core N/A Rsand 79.50 80.0 Rsand 76 O2 = 1.17 B276R5 Core N/A Rsand 82.00 82.5 B276R6 Core N/A Rgravel 84.20 84.7 B276R7 Core N/A Rgravel 87.00 87.5 B276R8 Core N/A Rgravel 89.50 90.0 B276R9 Core N/A Rgravel 92.00 92.5 B276T0 Core N/A Rgravel 94.60 95.1 B276T1 Core N/A Rgravel 97.00 97.5 B276T2 Core N/A Rgravel 99.50 100.0 B276T3 Core N/A Rgravel 102.00 102.5 B276T4 Core N/A Rgravel 104.70 105.2 B276T5 Core N/A Rgravel 107.00 107.5 106 O2 = 1.06 B276T6 Core N/A Rlwr-mud 117.00 117.5

B.3
Table B.1. (contd)
Well # HEIS # Type Lithology Stratigraphic
Unit
Liner Interval (ft bgs) U Water Extract (µg/g) Top Bottom
399-1-55 I-001 Core N/A Bk-Fill 10.2 12.4
I-002 Core N/A Bk-Fill 12.4 14.9 None Grab sample N/A 13 14 Core N/A Hgravel 15.6 17.5 None Grab sample N/A Hgravel 16.5 17.5 B27F42 Core N/A Hgravel 17.6 20.1 B27F43 Core N/A Hgravel 20.1 22 B27F44 Core N/A 22.4 24.9 None Grab sample N/A Hgravel 24 25.2 I-007 Core N/A Hgravel 25.2 27.7 B27F47 Core N/A Hgravel 27.7 30.2 None Grab sample N/A Hgravel 29 30 B27F48 Core N/A Hgravel 30.2 32.4 Water table
31.76 01/19/2011
I-008 Core N/A Hgravel 32.4 34.9 None Grab sample N/A Hgravel 34 35 B27F50 Core N/A Hgravel 34.9 37.4 None Grab sample N/A Hgravel 39 39 Rgravel 47 O2 = 0.17 B27F36 Core #2 Sandy muddy
gravel Rgravel 56.00 56.5 5.82E-02
67 O2 = 0.22 B27F37 Core #2 Muddy sandy
gravel Rgravel 68.20 68.7 4.81E-03
Rgravel 80–85 O2 = 2.82 Rgravel 98.8–105 O2 = NM Rgravel 105.6–113 O2 = 2.56 B27F38 Core #2 Clayey silty fine
sand Rsand 111.50 112.0 5.92E-02
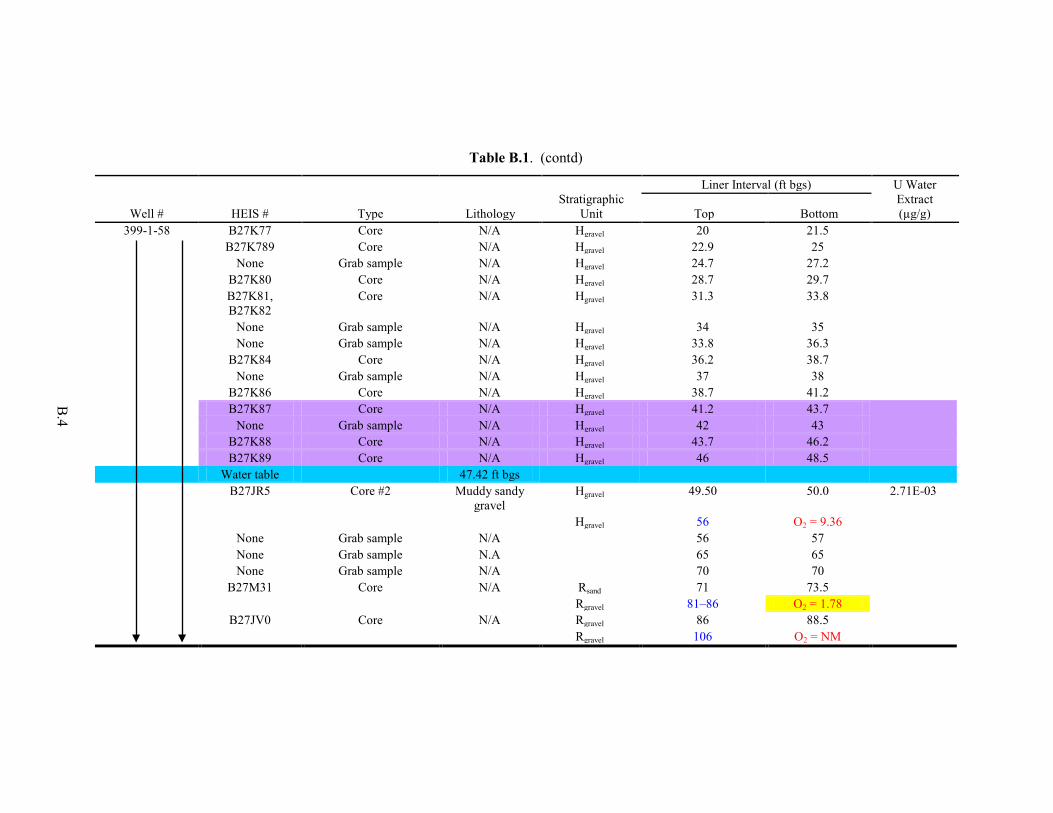
B.4
Table B.1. (contd)
Well # HEIS # Type Lithology Stratigraphic
Unit
Liner Interval (ft bgs) U Water Extract (µg/g) Top Bottom
399-1-58 B27K77 Core N/A Hgravel 20 21.5
B27K789 Core N/A Hgravel 22.9 25 None Grab sample N/A Hgravel 24.7 27.2 B27K80 Core N/A Hgravel 28.7 29.7 B27K81,
B27K82 Core N/A Hgravel 31.3 33.8
None Grab sample N/A Hgravel 34 35 None Grab sample N/A Hgravel 33.8 36.3 B27K84 Core N/A Hgravel 36.2 38.7 None Grab sample N/A Hgravel 37 38 B27K86 Core N/A Hgravel 38.7 41.2 B27K87 Core N/A Hgravel 41.2 43.7 None Grab sample N/A Hgravel 42 43 B27K88 Core N/A Hgravel 43.7 46.2 B27K89 Core N/A Hgravel 46 48.5 Water table 47.42 ft bgs B27JR5 Core #2 Muddy sandy
gravel Hgravel 49.50 50.0 2.71E-03
Hgravel 56 O2 = 9.36 None Grab sample N/A 56 57 None Grab sample N.A 65 65 None Grab sample N/A 70 70 B27M31 Core N/A Rsand 71 73.5 Rgravel 81–86 O2 = 1.78 B27JV0 Core N/A Rgravel 86 88.5 Rgravel 106 O2 = NM
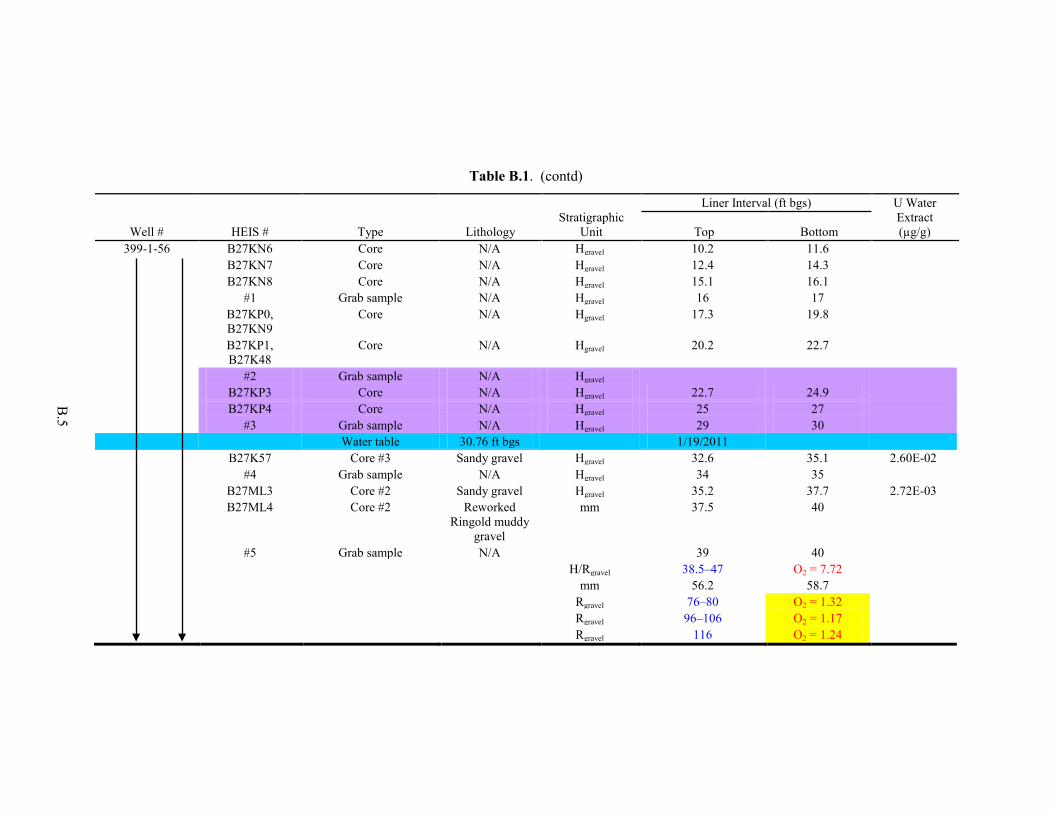
B.5
Table B.1. (contd)
Well # HEIS # Type Lithology Stratigraphic
Unit
Liner Interval (ft bgs) U Water Extract (µg/g) Top Bottom
399-1-56 B27KN6 Core N/A Hgravel 10.2 11.6 B27KN7 Core N/A Hgravel 12.4 14.3 B27KN8 Core N/A Hgravel 15.1 16.1 #1 Grab sample N/A Hgravel 16 17 B27KP0,
B27KN9 Core N/A Hgravel 17.3 19.8
B27KP1, B27K48
Core N/A Hgravel 20.2 22.7
#2 Grab sample N/A Hgravel B27KP3 Core N/A Hgravel 22.7 24.9 B27KP4 Core N/A Hgravel 25 27 #3 Grab sample N/A Hgravel 29 30 Water table 30.76 ft bgs 1/19/2011 B27K57 Core #3 Sandy gravel Hgravel 32.6 35.1 2.60E-02 #4 Grab sample N/A Hgravel 34 35 B27ML3 Core #2 Sandy gravel Hgravel 35.2 37.7 2.72E-03 B27ML4 Core #2 Reworked
Ringold muddy gravel
mm 37.5 40
#5 Grab sample N/A 39 40 H/Rgravel 38.5–47 O2 = 7.72 mm 56.2 58.7 Rgravel 76–80 O2 = 1.32 Rgravel 96–106 O2 = 1.17 Rgravel 116 O2 = 1.24
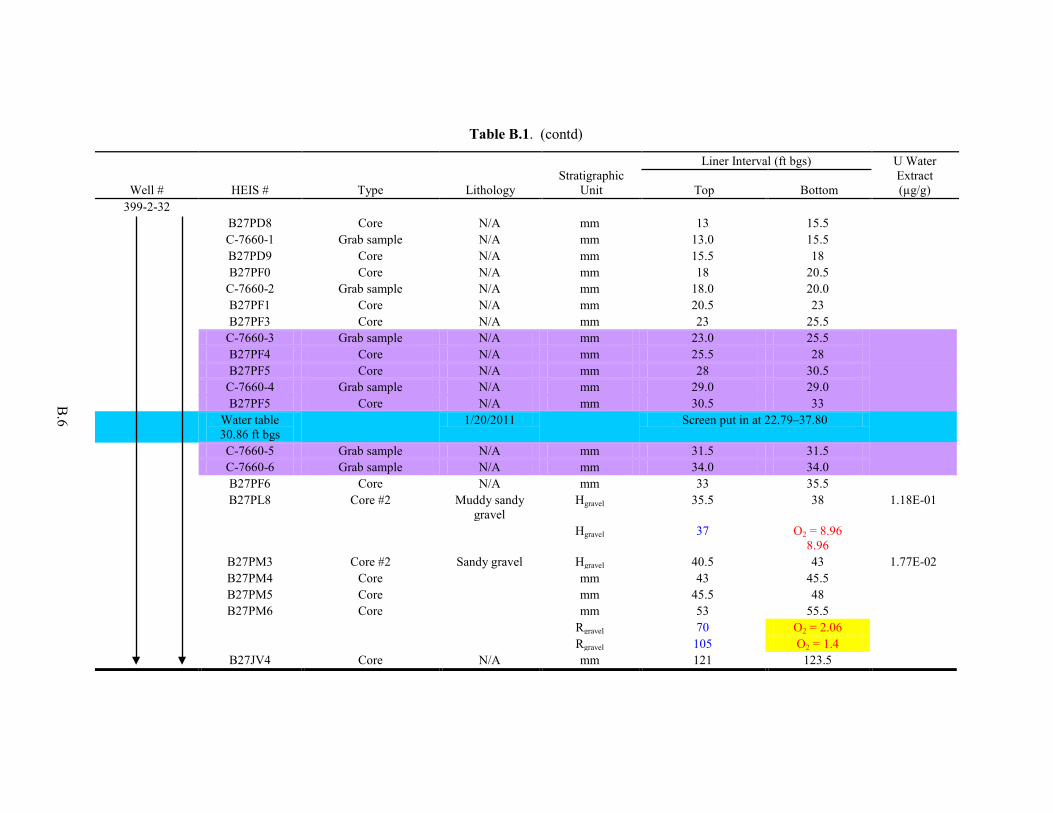
B.6
Table B.1. (contd)
Well # HEIS # Type Lithology Stratigraphic
Unit
Liner Interval (ft bgs) U Water Extract (µg/g) Top Bottom
399-2-32
B27PD8 Core N/A mm 13 15.5 C-7660-1 Grab sample N/A mm 13.0 15.5 B27PD9 Core N/A mm 15.5 18 B27PF0 Core N/A mm 18 20.5 C-7660-2 Grab sample N/A mm 18.0 20.0 B27PF1 Core N/A mm 20.5 23 B27PF3 Core N/A mm 23 25.5 C-7660-3 Grab sample N/A mm 23.0 25.5 B27PF4 Core N/A mm 25.5 28 B27PF5 Core N/A mm 28 30.5 C-7660-4 Grab sample N/A mm 29.0 29.0 B27PF5 Core N/A mm 30.5 33 Water table
30.86 ft bgs 1/20/2011 Screen put in at 22.79–37.80
C-7660-5 Grab sample N/A mm 31.5 31.5 C-7660-6 Grab sample N/A mm 34.0 34.0 B27PF6 Core N/A mm 33 35.5 B27PL8 Core #2 Muddy sandy
gravel Hgravel 35.5 38 1.18E-01
Hgravel 37 O2 = 8.96 8.96
B27PM3 Core #2 Sandy gravel Hgravel 40.5 43 1.77E-02 B27PM4 Core mm 43 45.5 B27PM5 Core mm 45.5 48 B27PM6 Core mm 53 55.5 Rgravel 70 O2 = 2.06 Rgravel 105 O2 = 1.4 B27JV4 Core N/A mm 121 123.5

B.7
Table B.1. (contd)
Well # HEIS # Type Lithology Stratigraphic
Unit
Liner Interval (ft bgs) U Water Extract (µg/g) Top Bottom
399-1-54
B25DK2 Core #2 Sandy gravel Hgravel 10.2 11.2 4.25E-01
B278D8 Core #2 Slough Hgravel 12.8 13.2 4.20E-01 B27902 Core #1 Sandy gravel Hgravel 15.4 16 2.27E-01 #1 Grab sample N/A Hgravel 16 17 B27933 Core #1 Silty-sandy
gravel Hgravel 17.4 18.5 1.45E-01
B25DK6 Core #2 Reworked Ringold
Hgravel 20.0 21.2 3.44E-02
B25C49 Core N/A Hgravel 22.3 23 C-7653 #2 Grab sample N/A Hgravel 27.0 28.0 Core N/A Hgravel 28 28.6 Tried split spoon between no recovery Water table 30.49 ft bgs 1/19/2011 Screen B282X3 Core #2 Sandy gravel Hgravel 33.0 34.0 1.64E-04 C-7653 #3 Grab sample N/A Hgravel 35.0 36.0 B282X4 Core #2 Clayey silt Rclaysiltr 36.0 38.5 <8.00E-05 C-7653 #4 Grab sample N/A Rgravel 36 38.5 B282X5 Core #2 Muddy sandy
gravel Rgravel 38.5 41 2.91E-04
Rgravel 36 O2 = ~9.4 B282X6 Core N/A Rgravel 41.5 43 B282X7 Core N/A Rgravel 44 46.5 B282X8 Core N/A Rgravel 47.2 49.7 B28305 Core N/A Rgravel 68.2 70.7 Rgravel 67 O2 = 1.84 Rgravel 110 O2 = 0.21
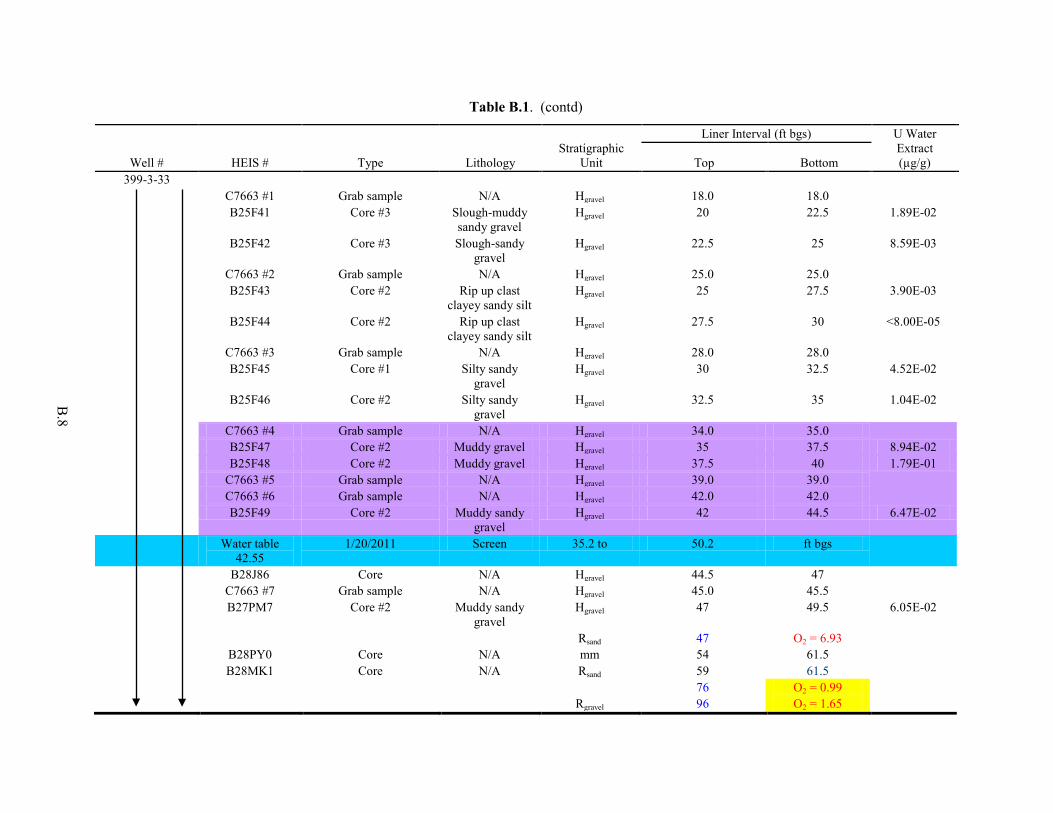
B.8
Table B.1. (contd)
Well # HEIS # Type Lithology Stratigraphic
Unit
Liner Interval (ft bgs) U Water Extract (µg/g) Top Bottom
399-3-33
C7663 #1 Grab sample N/A Hgravel 18.0 18.0 B25F41 Core #3 Slough-muddy
sandy gravel Hgravel 20 22.5 1.89E-02
B25F42 Core #3 Slough-sandy gravel
Hgravel 22.5 25 8.59E-03
C7663 #2 Grab sample N/A Hgravel 25.0 25.0 B25F43 Core #2 Rip up clast
clayey sandy silt Hgravel 25 27.5 3.90E-03
B25F44 Core #2 Rip up clast clayey sandy silt
Hgravel 27.5 30 <8.00E-05
C7663 #3 Grab sample N/A Hgravel 28.0 28.0 B25F45 Core #1 Silty sandy
gravel Hgravel 30 32.5 4.52E-02
B25F46 Core #2 Silty sandy gravel
Hgravel 32.5 35 1.04E-02
C7663 #4 Grab sample N/A Hgravel 34.0 35.0 B25F47 Core #2 Muddy gravel Hgravel 35 37.5 8.94E-02 B25F48 Core #2 Muddy gravel Hgravel 37.5 40 1.79E-01 C7663 #5 Grab sample N/A Hgravel 39.0 39.0 C7663 #6 Grab sample N/A Hgravel 42.0 42.0 B25F49 Core #2 Muddy sandy
gravel Hgravel 42 44.5 6.47E-02
Water table 42.55
1/20/2011 Screen 35.2 to 50.2 ft bgs
B28J86 Core N/A Hgravel 44.5 47 C7663 #7 Grab sample N/A Hgravel 45.0 45.5 B27PM7 Core #2 Muddy sandy
gravel Hgravel 47 49.5 6.05E-02
Rsand 47 O2 = 6.93 B28PY0 Core N/A mm 54 61.5 B28MK1 Core N/A Rsand 59 61.5 76 O2 = 0.99 Rgravel 96 O2 = 1.65

B.9
Table B.1. (contd)
Well # HEIS # Type Lithology Stratigraphic
Unit
Liner Interval (ft bgs) U Water Extract (µg/g) Top Bottom
399-1-59
C7659#1 Grab sample N/A mm 10 12 B27PY2 Core N/A mm 20 22.5 B27PY3 Core N/A mm 22.8 25.3 P27PY4 Core N/A mm 25.3 27.8 P27PY5 Core N/A mm 27.7 30.2 P27R02,
B27R05 Core N/A mm 30.2 32.7
B27R06 Core N/A mm 32.6 35.1 C7659#2 Grab sample N/A mm 35 36 B27R07 Core N/A mm 35.1 37.6 B27R08 Core N/A mm 37.7 40.2 C7659#3 Grab sample N/A mm 40 40 B27R09 Core N/A mm 40 42.5 C7659#4 Grab sample N/A mm 42 42 B27R10 Core N/A mm 42.7 45.2 B27R11 Core N/A mm 45.2 47.7 C7659#5 Grab sample N/A mm 47 47 B27R12 Core N/A mm 47.3 48.8 C7659#6 Grab sample N/A mm 50 51 N/A mm 50.4 52.4 Water table 51.7 to 55.25 range Screen 41.61–56.57 B2B1L5 Core N/A mm 52.7 55.2 C7659#7 Grab sample N/A mm 55 55 B27R67 Core N/A mm 55.4 56.4 Hgravel 56 O2 = 9.48
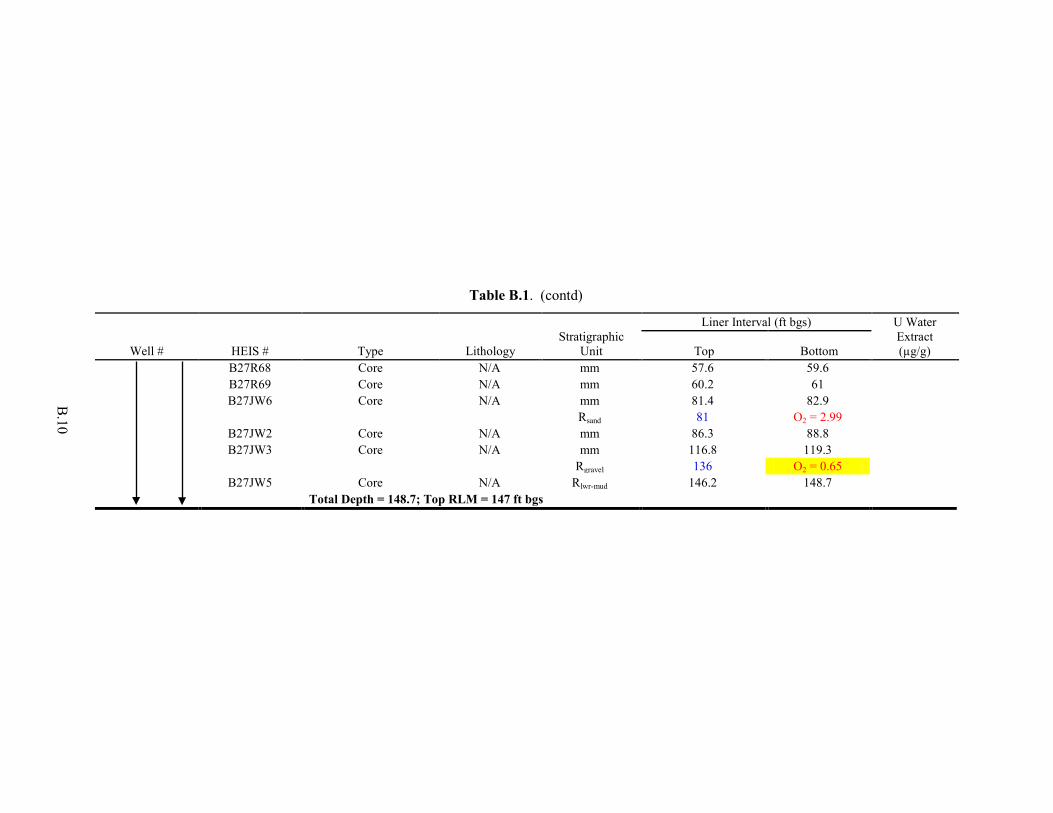
B.10
Table B.1. (contd)
Well # HEIS # Type Lithology Stratigraphic
Unit
Liner Interval (ft bgs) U Water Extract (µg/g) Top Bottom
B27R68 Core N/A mm 57.6 59.6 B27R69 Core N/A mm 60.2 61 B27JW6 Core N/A mm 81.4 82.9 Rsand 81 O2 = 2.99 B27JW2 Core N/A mm 86.3 88.8 B27JW3 Core N/A mm 116.8 119.3
Rgravel 136 O2 = 0.65 B27JW5 Core N/A Rlwr-mud 146.2 148.7
Total Depth = 148.7; Top RLM = 147 ft bgs
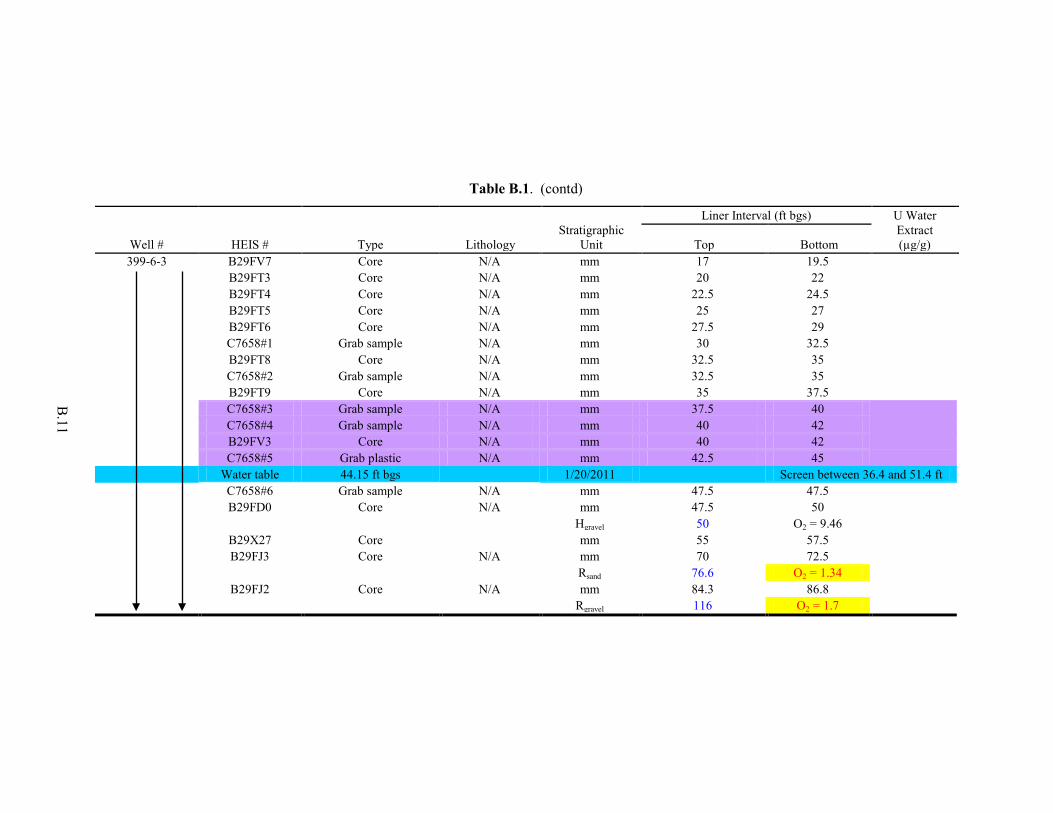
B.11
Table B.1. (contd)
Well # HEIS # Type Lithology Stratigraphic
Unit
Liner Interval (ft bgs) U Water Extract (µg/g) Top Bottom
399-6-3 B29FV7 Core N/A mm 17 19.5
B29FT3 Core N/A mm 20 22 B29FT4 Core N/A mm 22.5 24.5 B29FT5 Core N/A mm 25 27 B29FT6 Core N/A mm 27.5 29 C7658#1 Grab sample N/A mm 30 32.5 B29FT8 Core N/A mm 32.5 35 C7658#2 Grab sample N/A mm 32.5 35 B29FT9 Core N/A mm 35 37.5 C7658#3 Grab sample N/A mm 37.5 40 C7658#4 Grab sample N/A mm 40 42 B29FV3 Core N/A mm 40 42 C7658#5 Grab plastic N/A mm 42.5 45 Water table 44.15 ft bgs 1/20/2011 Screen between 36.4 and 51.4 ft C7658#6 Grab sample N/A mm 47.5 47.5 B29FD0 Core N/A mm 47.5 50 Hgravel 50 O2 = 9.46 B29X27 Core mm 55 57.5 B29FJ3 Core N/A mm 70 72.5 Rsand 76.6 O2 = 1.34 B29FJ2 Core N/A mm 84.3 86.8 Rgravel 116 O2 = 1.7
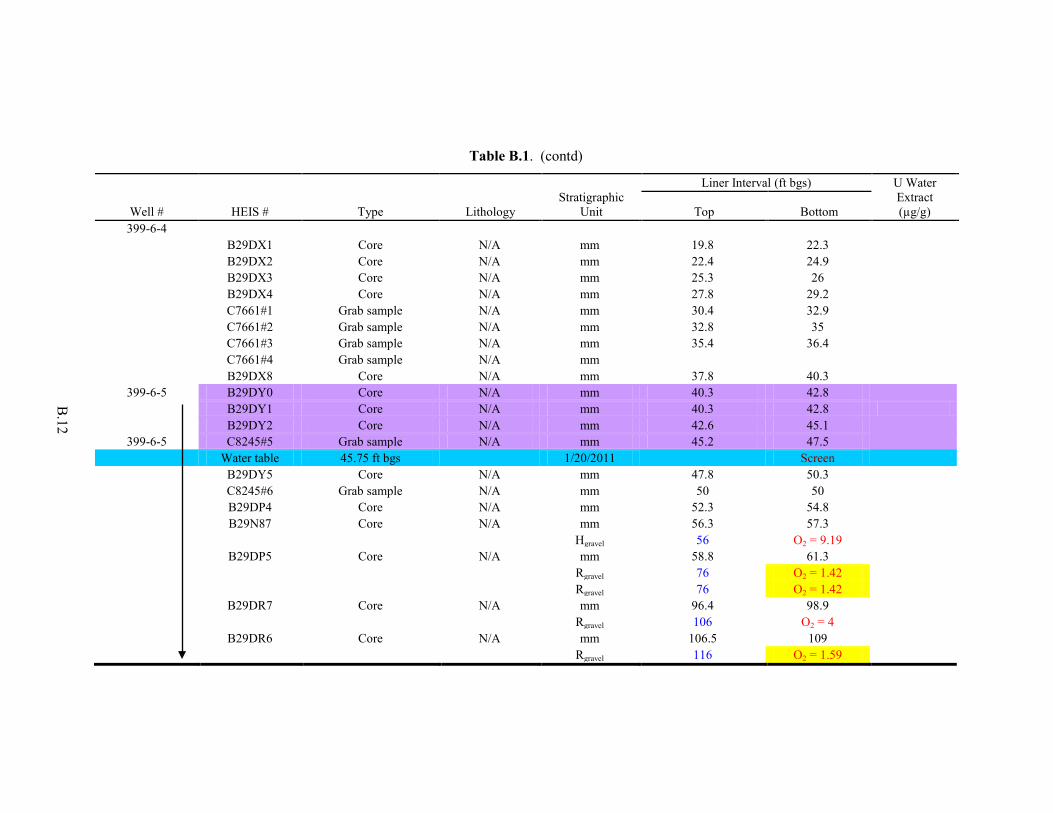
B.12
Table B.1. (contd)
Well # HEIS # Type Lithology Stratigraphic
Unit
Liner Interval (ft bgs) U Water Extract (µg/g) Top Bottom
399-6-4 B29DX1 Core N/A mm 19.8 22.3 B29DX2 Core N/A mm 22.4 24.9 B29DX3 Core N/A mm 25.3 26 B29DX4 Core N/A mm 27.8 29.2 C7661#1 Grab sample N/A mm 30.4 32.9 C7661#2 Grab sample N/A mm 32.8 35 C7661#3 Grab sample N/A mm 35.4 36.4 C7661#4 Grab sample N/A mm B29DX8 Core N/A mm 37.8 40.3
399-6-5 B29DY0 Core N/A mm 40.3 42.8 B29DY1 Core N/A mm 40.3 42.8 B29DY2 Core N/A mm 42.6 45.1
399-6-5 C8245#5 Grab sample N/A mm 45.2 47.5 Water table 45.75 ft bgs 1/20/2011 Screen B29DY5 Core N/A mm 47.8 50.3 C8245#6 Grab sample N/A mm 50 50 B29DP4 Core N/A mm 52.3 54.8 B29N87 Core N/A mm 56.3 57.3 Hgravel 56 O2 = 9.19 B29DP5 Core N/A mm 58.8 61.3 Rgravel 76 O2 = 1.42 Rgravel 76 O2 = 1.42 B29DR7 Core N/A mm 96.4 98.9 Rgravel 106 O2 = 4 B29DR6 Core N/A mm 106.5 109 Rgravel 116 O2 = 1.59
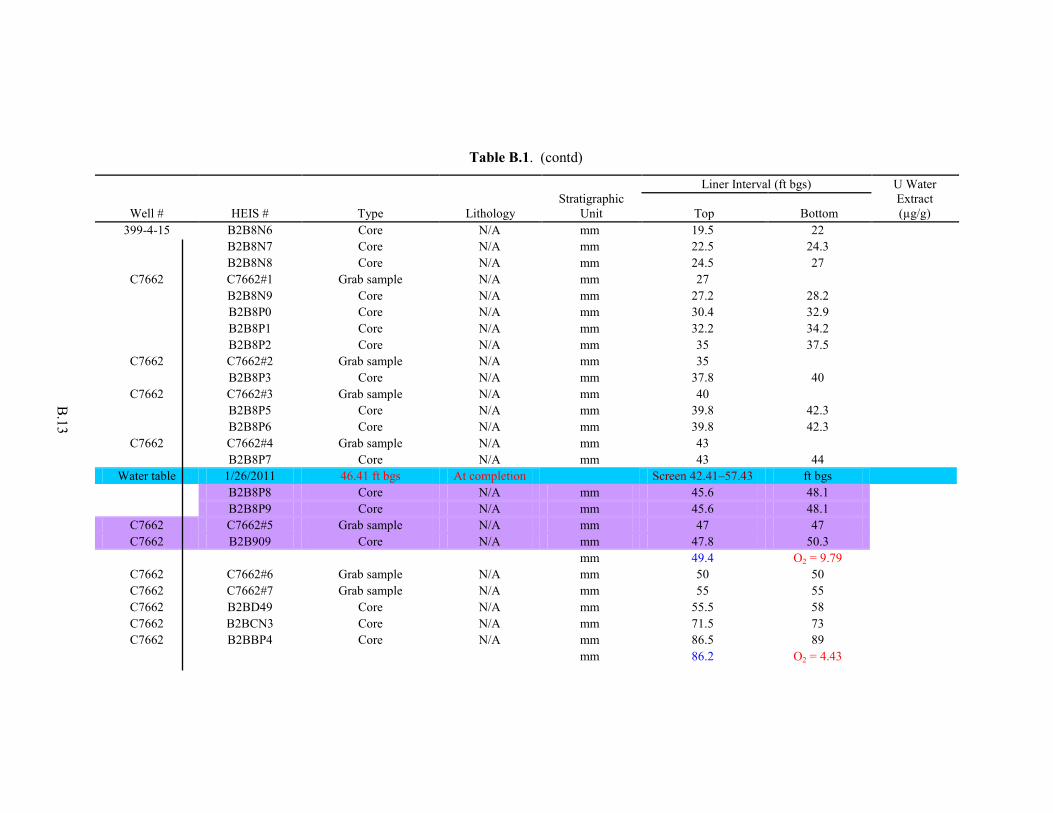
B.13
Table B.1. (contd)
Well # HEIS # Type Lithology Stratigraphic
Unit
Liner Interval (ft bgs) U Water Extract (µg/g) Top Bottom
399-4-15 B2B8N6 Core N/A mm 19.5 22
B2B8N7 Core N/A mm 22.5 24.3 B2B8N8 Core N/A mm 24.5 27
C7662 C7662#1 Grab sample N/A mm 27 B2B8N9 Core N/A mm 27.2 28.2 B2B8P0 Core N/A mm 30.4 32.9 B2B8P1 Core N/A mm 32.2 34.2 B2B8P2 Core N/A mm 35 37.5
C7662 C7662#2 Grab sample N/A mm 35 B2B8P3 Core N/A mm 37.8 40
C7662 C7662#3 Grab sample N/A mm 40 B2B8P5 Core N/A mm 39.8 42.3 B2B8P6 Core N/A mm 39.8 42.3
C7662 C7662#4 Grab sample N/A mm 43 B2B8P7 Core N/A mm 43 44
Water table 1/26/2011 46.41 ft bgs At completion Screen 42.41–57.43 ft bgs B2B8P8 Core N/A mm 45.6 48.1 B2B8P9 Core N/A mm 45.6 48.1
C7662 C7662#5 Grab sample N/A mm 47 47 C7662 B2B909 Core N/A mm 47.8 50.3
mm 49.4 O2 = 9.79 C7662 C7662#6 Grab sample N/A mm 50 50 C7662 C7662#7 Grab sample N/A mm 55 55 C7662 B2BD49 Core N/A mm 55.5 58 C7662 B2BCN3 Core N/A mm 71.5 73 C7662 B2BBP4 Core N/A mm 86.5 89
mm 86.2 O2 = 4.43
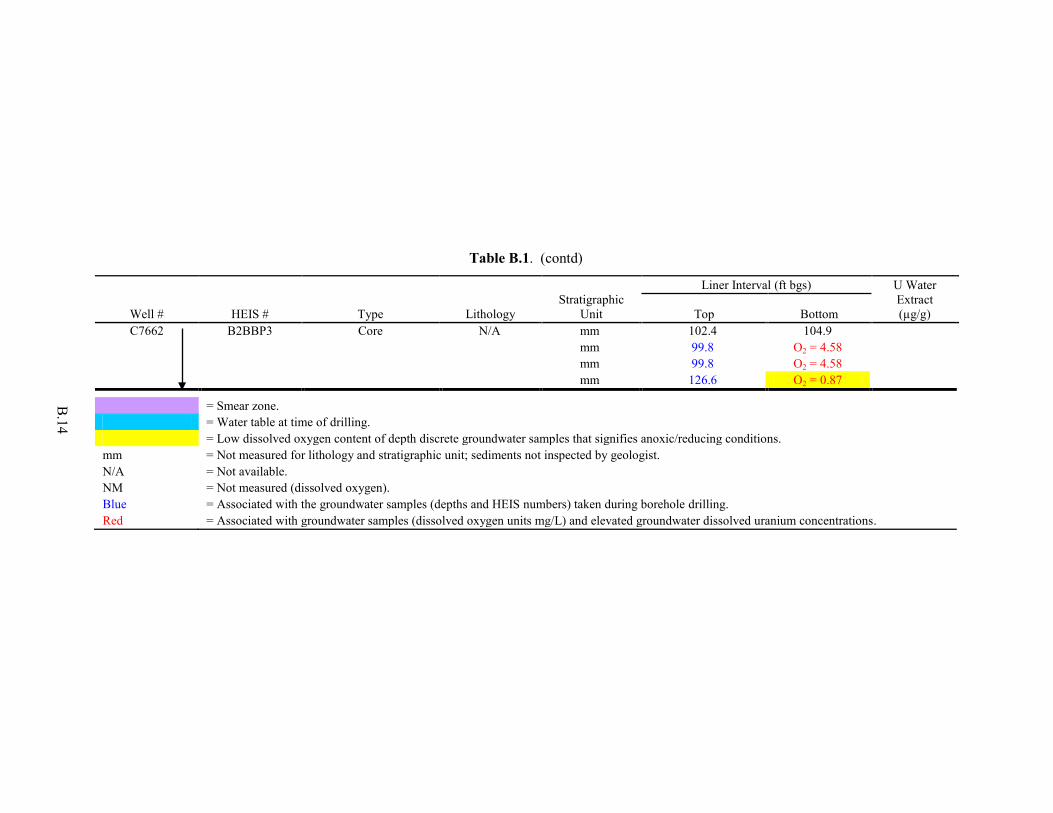
B.14
Table B.1. (contd)
Well # HEIS # Type Lithology Stratigraphic
Unit
Liner Interval (ft bgs) U Water Extract (µg/g) Top Bottom
C7662 B2BBP3 Core N/A mm 102.4 104.9 mm 99.8 O2 = 4.58 mm 99.8 O2 = 4.58 mm 126.6 O2 = 0.87
= Smear zone.
= Water table at time of drilling. = Low dissolved oxygen content of depth discrete groundwater samples that signifies anoxic/reducing conditions. mm = Not measured for lithology and stratigraphic unit; sediments not inspected by geologist. N/A = Not available. NM = Not measured (dissolved oxygen). Blue = Associated with the groundwater samples (depths and HEIS numbers) taken during borehole drilling. Red = Associated with groundwater samples (dissolved oxygen units mg/L) and elevated groundwater dissolved uranium concentrations.