a site wide perspective on uranium geochemistry at the hanford site
TRANSCRIPT
PNNL-17031
A Site-Wide Perspective on Uranium Geochemistry at the Hanford Site J. Zachara C. Liu C. Brown S. Kelly1 J. Christensen2 J. McKinley J.A. Davis3 J. Serne E. Dresel W. Um 1 Argonne National Laboratory, Argonne, IL 2 Lawrence Berkeley National Laboratory, Berkeley, CA 3 U.S. Geological Survey, Menlo Park, CA October 2007 Report written for CH2M HILL Hanford Group, Inc. and funded by DOE Office of River Protection (ORP)
PNNL-17031
A Site-Wide Perspective on Uranium Geochemistry at the Hanford Site J. Zachara S. Kelly1 C. Brown C. Liu J. Christensen2 J. McKinley J.A. Davis3 J. Serne E. Dresel W. Um 1 Argonne National Laboratory, Argonne, IL 2 Lawrence Berkeley National Laboratory, Berkeley, CA 3 U.S. Geological Survey, Menlo Park, CA October 2007 Report written for CH2M HILL Hanford Group, Inc. and funded by DOE Office of River Protection (ORP) Pacific Northwest National Laboratory Richland, Washington 99352

iii
Executive Summary
Uranium (U) is an important risk-driving contaminant at the Hanford Site. Over 200,000 kg have been released to the vadose zone over the course of site operations, and a number of vadose zone and groundwater plumes containing the uranyl cation [UO2
2+, U(VI)] have been identified. U is recognized to be of moderate-to-high mobility, conditions dependent. The site is currently making decisions on several of these plumes with long-lasting implications, and others are soon to come.
Uranium is one of nature’s most intriguing and chemically complex elements. The fate and transport of U(VI) has been studied over the long lifetime of the Hanford Site by various contractors, along with the Pacific Northwest National Laboratory (PNNL) and its collaborators. Significant research has more recently been contributed by the national scientific community with support from the U.S. Department of Energy’s (DOE) Office of Science through its Environmental Remediation Sciences Division (ERSD). This report represents a first attempt to integrate these findings into a cohesive view of the subsurface geochemistry of U at the Hanford Site. The objective is to inform all interested Hanford parties about the in-ground inventory of U and its geochemical behavior. This report also comments on the prospects for the development of a robust generic model to more accurately forecast future U(VI) migration at different Hanford waste sites, along with further research necessary to reach this goal.
To accomplish the report objectives, the environmental geochemistry of U at the Hanford Site is discussed in terms of both the vadose and saturated zone, to the extent that it is known. Hexavalent uranium [U(VI)] is the dominant valence form of U under the predominantly oxidizing subsurface conditions at the Hanford Site, and the researchers’ analyses consequently emphasize this species. The nature and concentration of background U in Hanford subsurface sediments is identified to place contaminant U(VI) concentrations and behavior in perspective to the natural system. In-ground U-waste inventories are quantified and characterized with regard to source term, to the extent possible, and the most important sites from an inventory perspective are identified. The U-isotopic content of various waste streams are discussed from the perspective of waste-source tracking. The geochemical attenuation processes responsible for slowing the rate of subsurface U migration, relative to the transporting water front, are illustrated through careful consideration of both field characterization studies of existing U vadose-zone and groundwater plumes, and laboratory studies of derived contaminated and uncontaminated sediments. Both empirical and more mechanistic models of these attenuation processes are considered as well as the parameters that define attenuation magnitude. Attention is given to the behavior of contaminant U(VI) that has been in contact with Hanford sediments for extended periods (circa 10–50 years), as long contact imparts unique character to U(VI) geochemical behavior by allowing 1) slow reactions to reach completion, and 2) diffusional access to intra-grain fractures and pores.
This report focuses on two tank farm sites in the 200 Area Plateau (BX-102/E33-45, TX-104/B3238) and a U waste site in the Columbia River Corridor (316-1/2), as these areas are representative of the population being sampled. Comprehensive field and laboratory studies have been performed on materials from these locations. Characterization and research results from these sites have been individually reported; however, there have been no previous attempts to reconcile this data within a common perspective. Important commonalities were observed between these different sites because of gross similarities in sediment properties, pore-water composition, and controlling-geochemical processes. Significant differences were also found as a result of variations in source-waste chemistry, including pH

iv
extremes, U concentration, and the presence of reactive co-contaminants. These findings support the feasibility of a generic reactive-transport model for U(VI), based on fundamental geochemical principles, that can complement performance-assessment models of more common configuration (e.g., Kd-based) and higher uncertainty.
The report concludes that additional sampling and analysis of high-inventory U-containing sites, the underlying vadose zones, and associated groundwater plumes (if present) are essential to develop a comprehensive integrated conceptual model of U geochemistry at the Hanford Site. While significant knowledge exists regarding the geochemical behavior of U(VI) at the Hanford Site, this knowledge is not sufficiently robust to allow defensible a priori predictions of U(VI) subsurface-migration velocity. The desired conceptual model would contain all relevant processes and reactions controlling the subsurface migration of waste-derived U(VI). This standard would comprehensively inform modeling and decisions pertaining to monitored natural attenuation and engineered remediation of U-containing plumes and waste sites at Hanford. The report also deduces that a generic, predictive reactive-transport model, applicable to all Hanford U-containing waste sites, is feasible. However, this would require a well-conceived and integrated experimental and modeling activity to fill remaining knowledge gaps, determine statistically meaningful model parameters, and establish defensible correlations between model parameters and sediment properties.
The following are important findings from the report: 1. More than 85% of the total in-ground, estimated contaminant-U mass (202,703 kg) is present in
10 high-inventory sites. U-plant wastes were a common inventory source, suggesting that U(VI) may exhibit similar behavior in sites receiving these materials.
2. Several waste sites are projected to contain significant amounts of precipitated or solid-phase U from the original waste stream. These projections have strong implications to future mobility and have not been substantiated by field measurement.
3. The original chemical nature and current geochemical speciation of U in many of Hanford’s highest-inventory waste sites is unknown. Estimates of the future mobility of U(VI) from these sites are consequently not possible without this essential information.
4. The distribution of uranium isotopes (e.g., 235U, 236U, 238U) in different waste streams varied in complex but predictable fashion over the history of the Hanford Site, reflecting factors such as degree of fuel enrichment, reactor neutron flux, and specialized site operations. Quantification of these various isotopes in sediments and waters of contaminant U-plumes can be used to pinpoint waste sources and facility origins where uncertainty exists. Important subtleties, however, must be considered for proper interpretation.
5. U(VI) forms neutral and anionic aqueous-carbonate complexes in Hanford Site pore and groundwaters that suppress adsorption, enhance U(VI)-precipitate solubility, and lower retardation factors.
6. The current geochemical speciation and behavior in different Hanford U(VI) plumes is strongly influenced by the original temperature and chemical composition of the waste streams.
7. The migration of U(VI) in the Hanford subsurface is retarded by both adsorption (complexation to mineral surfaces) and precipitation (formation of U-containing mineral phases). Precipitation was important in the near-to-intermediate field when U(VI) waste concentrations were relatively high
v
(>1 mmol/L) and where pH differed significantly from ambient conditions. Adsorption predominates in the far field, and throughout for dilute waste streams.
8. Precipitated U(VI) has been observed in the forms of silicates (Na-boltwoodite) and phosphates (metatorbernite) in two specific waste sites. Other precipitate types are present in these and other locations that have not yet been identified. The precipitates were found in restricted physical environments of sediments, suggesting specialized-formation conditions.
9. The rate of U(VI) precipitate dissolution as required for plume migration, where these phases exist, is slow and controlled by intra-grain diffusion. With sufficient and possibly long residence times, contacting pore waters will attain thermodynamic solubility equilibrium with these phases.
10. Adsorption and desorption reactions in Hanford sediment are generally rapid. However, a small and variable subset of adsorption sites exist in poorly accessible physical domains, and adsorption to and desorption from these sites occurs slowly. These locales are filled during long in-ground contact periods in U(VI) plumes. The distribution of fast and slow sites in specific Hanford sediments are not yet predictable.
11. The slowest rates of adsorption and desorption have been observed for sediments collected from beneath the 300 Area Process Ponds for reasons that are not fully resolved. The suspicion is that waste-sediment reactions resulting from pH extremes during site operation created unique micro-porous domains with slow exchange rates.
12. U(VI) Kd values for Hanford sediments show significant variability (0 to >100 mL/g). The primary factors affecting Kd are a) sediment texture, as a control on reactive-surface area and adsorption-site concentration, b) clay and silt fraction mineralogy, as a control on adsorption-site strength, and c) pH and dissolved inorganic carbon, as a control on U(VI) aqueous speciation. Kd is a qualitative concept for Hanford sediments because of the variation in these factors over relatively small transport distances.
13. Under conditions where adsorption controls solid-liquid distribution, laboratory U(VI)-Kd measurements from simulated vadose-zone pore water or unconfined groundwater display comparable ranges for >2.0-mm vadose zone (0.5–5 mL/g) and aquifer sediments (0.2–4 mL/g), with occasional outliers observed (e.g., paleosols with high calcite content). In-situ Kd values [as derived from total contaminant U(VI) measurements and pore water quantification of field samples] from plume regions—where adsorption is suspected—display generally comparable values to the laboratory-measured values.
14. Adsorption isotherms for U(VI) display a linear character on most Hanford sediments below adsorption-site saturation. A constant Kd value can, therefore, be used to describe adsorption magnitude over transport domains where sediment properties and pore-water composition remain constant, and where dissolved-U(VI) concentrations are below that causing site saturation.
15. Modelers should seek the input of geochemical experts when attempting to describe the attenuation of U(VI) in performance-assessment models, as opposed to extracting U(VI) Kd values from available reports in the Hanford Virtual Library Kd database.
16. The complex effects of variable pH and carbonate concentration on U(VI) adsorption to specific Hanford sediments can be well described with a three to four-parameter surface-complexation model. A uniform set of model parameters, scalable by sediment texture and sorbent type, has not been finalized to allow generic Kd predictions.
vi
17. Complications arising from solid-phase carbonate content and uncertainty in natural and waste-impacted carbon dioxide partial pressures in the vadose zone challenge quantitative predictions of pore-water compositions. Pore-water composition and in-situ Kd estimates for U(VI), based on deionized water extractions, are consequently qualitative.
18. Improved predictions of subsurface U(VI) migration will require explicit consideration of aqueous- and surface-complexation reactions of U(VI), precipitation or dissolution reactions of U(VI), and the specific factors that control pore-water pH and carbonate content. These cannot be accomplished with a constant Kd approach.

vii
Acknowledgements
This report was written with primary support from the Tank Farm Vadose Zone Project led by CH2M HILL Hanford Group, Inc., in support of the U.S. Department of Energy (DOE) Office of River Protection (ORP); and secondary support from DOE’s Office of Science, Environmental Remediation Sciences Division (ERSD). The authors thank Frank J. Anderson, Fredrick M. Mann, and John G. Kristofzski with the CH2M HILL Hanford Group, Inc. for encouraging the integration and analysis activity in this report as a basis for developing a generalized understanding of uranium geochemistry at Hanford. The report relies heavily on research supported by 1) the CH2M HILL Tank Farm Vadose Zone Project, 2) DOE’s Office of Biological and Environmental Research (OBER) through its Environmental Remediation Sciences Division (ERSD), 3) DOE’s EM-40 300-FF-5 Remediation Project, and 4) the Pacific Northwest National Laboratory (PNNL) Remediation and Closure Science (RACS) Project supported by Flour-Hanford. The authors thank Mark Freshley for his guidance on, and review of, this document.


ix
Contents
Executive Summary ..................................................................................................................................... iii Acknowledgements.....................................................................................................................................vii Acronyms and Abbreviations .................................................................................................................... xix 1.0 Introduction ..................................................................................................................................... 1.1 2.0 Background U in Hanford Sediments and Waters........................................................................... 2.1
2.1 Background Uranium Concentrations in Hanford Media....................................................... 2.1 2.2 Mineral Form of Background U............................................................................................. 2.2
3.0 Inventory and Character of U-Containing Wastes........................................................................... 3.1 4.0 Aqueous Speciation of the Uranyl Cation ....................................................................................... 4.1
4.1 Computerized Aqueous Speciation Calculations ................................................................... 4.2 4.2 Experimental Verification of Aqueous Species in Hanford Pore water ................................. 4.6 4.3 Summary and Implications..................................................................................................... 4.8
5.0 Empirical Distribution Coefficients................................................................................................. 5.1 5.1 The Kd Construct .................................................................................................................... 5.1 5.2 Variable Kd versus Constant Value Kd ................................................................................... 5.5 5.3 Generic Kd Values Based on Waste Type and Impact Zones................................................. 5.7 5.4 Case Studies of Different Hanford Disposal Sites ............................................................... 5.10 5.5 Sensitivity of U(VI) Kd Values to Key Parameters at the Hanford Site ............................... 5.17 5.6 Summary and Implications................................................................................................... 5.21
6.0 Lessons Learned from Field-Sampling Campaigns of Uranium Plumes ....................................... 6.1 6.1 241-BX Tank Farm ................................................................................................................ 6.1 6.2 241-TX Tank Farm................................................................................................................. 6.7 6.3 300 Area (316-1/2) ............................................................................................................... 6.10
6.3.1 Extent of Uranium Contamination in the 300 Area................................................. 6.13 6.3.2 Apparent Mobility of Uranium in Sediment from the 300 Area ............................. 6.18
6.4 Summary and Implications................................................................................................... 6.20 7.0 Uranium Isotopics and Waste-Site Tracking in Pore Water and Groundwater .............................. 7.1
7.1 Natural Uranium..................................................................................................................... 7.1 7.1.1 Uranium Decay Series and Natural Isotopic Ratios .................................................. 7.1 7.1.2 Alpha-Recoil and Uranium Series Disequilibrium.................................................... 7.3 7.1.3 Uranium Series Disequilibrium at Hanford............................................................... 7.5
7.2 Hanford Nuclear Reactors and Operations............................................................................. 7.6 7.2.1 Nuclear Modeling of Hanford Plutonium Production ............................................... 7.8 7.2.2 Depleted Uranium ................................................................................................... 7.12 7.2.3 Uranium-233 and Tritium Production..................................................................... 7.13
7.3 Analytical Methods .............................................................................................................. 7.13

x
7.4 WMA-B-BX-BY.................................................................................................................. 7.14 7.5 WMA-T and WMA-TX-TY................................................................................................. 7.22 7.6 618-10 Burial Ground and 316-4 Crib ................................................................................. 7.29 7.7 Summary and Implications................................................................................................... 7.31
8.0 Uranium Precipitation from Waste Streams .................................................................................... 8.1 8.1 Waste-Site Materials and Experimental and Analytical Methods.......................................... 8.1
8.1.1 241-BX-102 Overfill Event....................................................................................... 8.2 8.1.2 316-1/2 Process Ponds............................................................................................... 8.3 8.1.3 Instrumental Analysis................................................................................................ 8.4
8.2 Precipitation Processes and Products Controlling Subsurface U Migration .......................... 8.5 8.2.1 241-BX-102 Overfill Event....................................................................................... 8.6 8.2.2 316-1/2 Process Ponds............................................................................................. 8.13
8.3 Conceptual Models of U Precipitation Processes................................................................. 8.18 8.4 Summary and Implications................................................................................................... 8.19
9.0 Adsorption and Surface Complexation............................................................................................ 9.1 9.1 Uranium (VI) Adsorption on Various Adsorbents ................................................................. 9.1 9.2 The Surface-Complexation Model (SCM) ............................................................................. 9.2 9.3 Identification of U(VI) Surface Complexing Species ............................................................ 9.4 9.4 Application of the U(VI) SCM to Hanford Sediments........................................................... 9.9
9.4.1 The SCM of U(VI) Adsorption to Integrated Disposal Facility (IDF) Sediment.................................................................................................................. 9.10
9.4.2 The SCM of U(VI) Adsorption/Desorption to NPP/SPP 300 Area Sediments ....... 9.13 9.4.3 The U(VI) SCM Coupled with U(VI) Kinetic and Transport on TX-104
Sediments ................................................................................................................ 9.17 9.5 Summary and Implications................................................................................................... 9.20
10.0 Kinetic and Mass Transfer Processes ............................................................................................ 10.1 10.1 Influence of Diffusion and Dissolution Kinetics on U(VI) Release from 241-BX-102
Sediments ............................................................................................................................. 10.2 10.1.1 Advective Dissolution Experiments at Different Solution-Saturation States.......... 10.3 10.1.2 Modeling U(VI) Release Rates from Intra-grain Precipitates ................................. 10.7 10.1.3 Findings Regarding Intra-grain, Metal-Waste Precipitates ..................................... 10.9
10.2 U(VI) Desorption and Adsorption in a Deep Vadose-Zone Plume Displaying Marked Lithologic Variations............................................................................................................ 10.9 10.2.1 Column Experiments to Assess the Influence of Lithology on U(VI) Mass
Transfer ................................................................................................................. 10.11 10.2.2 Modeling to Reconcile Batch and Column Desorption Behavior of Sediment
69........................................................................................................................... 10.15 10.2.3 Findings Regarding Mass Transfer and Plume Migration in Calcite-
Containing Sediments from Tank Farm Core 3832 .............................................. 10.17 10.3 Scale-Dependent U(VI) Desorption in the 300 Area Sediment ......................................... 10.18
10.3.1 Experimental Results............................................................................................. 10.20 10.3.2 Modeling ............................................................................................................... 10.22
xi
10.3.3 Findings Regarding the Scale-Up of Mass Transfer Parameters to Field-Textured Contaminated Sediments ....................................................................... 10.26
10.4 Importance of Kinetic and Mass-Transfer Processes in U(VI) Migration at Hanford ....... 10.27 10.5 Summary and Implications................................................................................................. 10.28
11.0 Status of a Generalized Reactive Transport Model for Uranium .................................................. 11.1 11.1 Concept of a Generalized Model.......................................................................................... 11.1 11.2 Envisioned Model Capability and Content........................................................................... 11.2 11.3 Modeling Challenges and Needed Research ........................................................................ 11.4
12.0 References ..................................................................................................................................... 12.1 13.0 Bibliography .................................................................................................................................. 13.1
xii
Figures
2.1 XRF Distributions Showing the U, Fe, and Ca Signals From TX-104 69A and TX-104 110A................................................................................................................................ 2.4
2.2 XANES Spectra From Sample Regions Similar to the U(VI) Standard (A) and Regions Similar to the U(IV) Standard (B) ................................................................................................ 2.5
2.3 U μEXAFS χ(k) Spectra and Model for S13, R1, R2, R3, and S5............................................... 2.6 2.4 Magnitude (A) and Real Part (B) of the Fourier Transform of the μEXAFS Spectra and
Models for R1, R2, S5, and R3..................................................................................................... 2.6 2.5 Crystal Structure of betafite C, Based on Previous XRD Measurements ..................................... 2.7 4.1 Aqueous U(VI) Speciation as a function of pH, total aqueous U(VI) and carbonate
concentrations ............................................................................................................................... 4.3 4.2 Aqueous U(VI) Speciation in Presence of Ca, Ca and Mg, and Ca and Phosphate...................... 4.4 4.3 Fluorescence Spectra of the Aqueous Uranyl-Carbonate/Phosphate Complexes at 6 K .............. 4.7 4.4 Fluorescence Spectra of the Vadose-Zone Pore-Water Samples at 6 K ....................................... 4.8 5.1 Hypothetical equilibrium contaminant partitioning curve for a generic, Sorbing inorganic
contaminant................................................................................................................................... 5.4 5.2 U(VI) Adsorption Isotherms on Uncontaminated 300 Area Vadose-Zone and Aquifer
Materials from Limited Field Investigation Cores...................................................................... 5.11 5.3 Adsorption and Desorption Isotherms Measured on Vadose-Zone Sediments Collected
Beneath the North and South 300 Area Process Ponds .............................................................. 5.13 5.4 Dependence of U(VI) Kd on pH for the Hanford Silty Clay Composite from the S-SX
Tank Farm................................................................................................................................... 5.14 5.5 Breakthrough Curve for U(VI) with Measured Data and CXTFIT Model Fits for Three
Equilibrium Sorption-Desorption Retardation Values................................................................ 5.16 5.6 Photograph of Hydrous-Oxide-Coated Ringold Formation Unit E Gravel from 200-UP-1 ....... 5.18 5.7 Generic Plot of U(VI) Log Kd Versus Mineral Type and Solution pH....................................... 5.19 6.1 Distribution of Uranium in Borehole 299-E33-45........................................................................ 6.2 6.2 Distribution of Technetium-99 in Borehole 299-E33-45.............................................................. 6.3 6.3 Uranyl-Silicate Precipitates Found Within Granitic-Lithic Fragments of Sample 67 From
E33-45........................................................................................................................................... 6.6 6.4 Extractable U(VI) From TX-104 .................................................................................................. 6.7 6.5 Photograph of Core Sample from Borehole 3832......................................................................... 6.8 6.6 Concentration Distribution of Acid-Extractable U(VI) and Water-Extractable Tc(VII) in
Borehole 3832............................................................................................................................... 6.9 6.7 Backscattered Electron Micrograph (a) and Wavelength Dispersive Spectroscopy (WDS)
Analyses (b) of Sediment 69A Thin Section .............................................................................. 6.10 6.8 Backscattered Electron Micrograph and Wavelength Dispersive Spectroscopy Analysis of
Sediment 110A Thin Section ...................................................................................................... 6.11 6.9 Arial Photograph of 300-FF-5 Looking South with the Columbia River on the Left................. 6.12
xiii
6.10 Seasonal Dynamics of 300 Area Uranium Plume....................................................................... 6.13 6.11 Excavation Through South Process Pond Sediments Display Coarse Texture........................... 6.14 6.12 Documented Locations of Solid-Associated U That Represent Potential Continued
Sources of U(VI) to Groundwater............................................................................................... 6.16 6.13 U(VI) Concentrations in LFI Borehole C5000 ........................................................................... 6.17 6.14 Conceptual Model of U(VI) Geochemical Speciation in 300 Area Process Pond
Sediments Based on XAS and CLIFS Spectroscopic Measurements ......................................... 6.18 7.1 U-238 and U-234 Decay Series .................................................................................................... 7.3 7.2 U-235 Decay Series ...................................................................................................................... 7.4 7.3 Uranium Concentration Versus U-234/U-238 Activity Ratio for Groundwater Samples ............ 7.5 7.4 (a) Model for Pore Water (U-234/U-238) (b) Model for U infiltration Flux and Bulk
Mineral Dissolution Rate, Skf, Compared to Rates from Sr Isotopes .......................................... 7.6 7.5 Uranium Concentration Versus U-234/U-238 Activity Ratio for Hanford Groundwater
Samples......................................................................................................................................... 7.7 7.6 Plutonium Production at Hanford (from DOE/RL 1996a)............................................................ 7.9 7.7 Variation in Uranium Isotopic Ratios Versus Time for Hanford Plutonium Processing............ 7.11 7.8 U-236/U-238 Versus U-235/U-238 Modeled for Hanford-Processed Fuels7.12 7.9 Fiscal Year 2006 Average Uranium Concentrations in Northwest 200 East Area, Upper
Part of the Unconfined Aquifer................................................................................................... 7.15 7.10 Uranium Concentration in Pore Water and Stratigraphy of Borings 299-E33-45 and
299-E33-46 ................................................................................................................................. 7.17 7.11 U-236/U-238 Versus U-235/U-238 for Vadose Zone and Groundwater Samples in the
Vicinity of WMA-B-BX-BY Compared to Modeled Composition of Fuel Processed Through B Plant.......................................................................................................................... 7.17
7.12 U-236/U-238 Versus U-234/U-238 for Vadose Zone and Groundwater Samples in the Vicinity of WMA-B-BX-BY Compared to Modeled Composition of Fuel Processed Through B Plant, and to Estimated Isotopic Ratios for Discharges at Tanks BX-102 and B-110 .......................................................................................................................................... 7.18
7.13 Detail of U-236/U-238 Versus U-234/U-238 for Vadose-Zone and Groundwater Samples in the Vicinity of WMA-B-BX-BY ............................................................................................ 7.20
7.14 Cross Plots of Uranium Isotopes from Spectral Gamma Log Data ............................................ 7.21 7.15 Profiles for the C3832 and C4104 cores of Uranium concentration and 236U/238U from
Christensen et al. 2007................................................................................................................ 7.25 7.16 Plots of Uranium Isotopic Data................................................................................................... 7.27 7.17 Plot of 236U/238U Versus pH for Core C4104 in the WMA-T................................................. 7.28 7.18 Groundwater Monitoring Wells in the Vicinity of the 618-10 Burial Ground and 316-4
Crib ............................................................................................................................................. 7.29 7.19 Uranium Isotopic Composition of Groundwater and Soil-Water Extract Samples Near the
316-4 Crib and 618-10 Burial Ground........................................................................................ 7.31 8.1 Layout of the Completed B-BX-BY Tank Farm .......................................................................... 8.2 8.2 Uranium Contaminant Plume Concentrations in the 300 Area..................................................... 8.3

xiv
8.3 Uranium Silicate Mineralization in Core Samples Was Confined to Intra-Grain Microfractures in Granitic Lithic Clasts ....................................................................................... 8.7
8.4 Observed and Modeled Uranyl Silicate Dissolution Results ........................................................ 8.8 8.5 Spectral Gamma Logging Results for Borehole 299-E33-18, Showing the Accumulation
of Vadose-Zone Uranium and Cobalt ......................................................................................... 8.10 8.6 Log-Log plot of 235U Versus 238U for Boreholes 299-E33-45, 299-E33-41, and 299-E33-
18- 238U is Derived from 234Pa Activity ..................................................................................... 8.11 8.7 Results of Timed Imbibation Experiments Using Hanford Formation Sediment Samples
and Simulated Waste Solutions .................................................................................................. 8.13 8.8. Electron Microprobe Comparisons of Uranium, Calcium, and Silicon Concentrations in
Process Pond Materials (NP4-1) and in Sediments Excavated From Beneath the Process Ponds........................................................................................................................................... 8.14
8.9 Electron Microprobe and X-Ray Microprobe Analyses of Copper and Uranium in Deeper NPP Sediments ........................................................................................................................... 8.16
8.10 X-ray Diffraction Analysis Over the Two-Theta Range of 5–10 Degrees; C: Chlinochlore; M: Muscovite ....................................................................................................... 8.16
8.11 Fourier Transformed EXAFS Spectra for 300 Area Uranium Contaminated Sediments ........... 8.17 8.12 Slab of Metatorbernite From NPP2-4, Thinned by Focused-Ion-Beam Milling and
Examined by TEM...................................................................................................................... 8.18 9.1 Laser-Induced Florescence Spectroscopic Analyses of the Fine-Grained Samples in the
NPP 300 Area Sediment, Showing Two Distinct U(VI) Spectra Resembling Uranyl Carbonate Species and Uranyl Hydroxide .................................................................................... 9.8
9.2 Normalized TRLIF Spectra for TX-104-69A and -110A Sediments and Selected Standard Minerals (λex=415); Normalized TRLIF Spectra for TX-104-110A at Different Delay Times (λex=415) ............................................................................................................................ 9.9
9.3 Distribution Coefficients (Kd) for U(VI) as a Function of Total U(VI) Concentration in Synthetic-IDF Pore Water with pH=7.2±0.1 (■) ........................................................................ 9.12
9.4 Uranium(VI)-Kd Values from IDF Pore Water with Varying Alkalinity (mg/L as CaCO3) (U(VI) = 10-6 M, pH=7.6-9.2, and Solid Concentration = 300 g/L............................................. 9.13
9.5 Uranium(VI)-Adsorption Isotherms for Deeper-Pit Sediment Samples Suspended in AGW4 or AGW9 ........................................................................................................................ 9.15
9.6 Alkalinity Dependence of Log Kd Values for U(VI) Sorption for Deeper 300 Area Process Pond Sediment Samples Equilibrated in Artificial-Groundwater Solutions of Varying Composition.................................................................................................................. 9.15
9.7 U(VI) Desorption from Sediment TX104-69 in Five Electrolytes in Batch System .................. 9.17 9.8 Batch-U(VI) Desorption from Sediment TX104-110................................................................. 9.18 10.1 Effluent Data for Uranium Release from Sediment E33-45-53AB ............................................ 10.4 10.2 Effluent Data for Uranium Release from Sediment E33-45-61AB ............................................ 10.5 10.3 Effluent-U(VI) Concentration in TX Sediment 3832-69.......................................................... 10.12 10.4 Effluent U(VI) Concentration in TX Sediment 3832-110 ........................................................ 10.13 10.5 Effluent U(VI) Concentration after Contaminant U(VI) Desorption........................................ 10.14
xv
10.6 Effluent U(VI) Concentrations (a) and Br breakthrough Curve (b) in a Column with <2-mm NPP1-14 Sediment ....................................................................................................... 10.20
10.7 U(VI) Desorption from the Field-Textured NPP1-14 Sediment in the Large Column............. 10.21 10.8 The Breakthrough Curves of PFBA, Tritium and Br in Field-Textured NPP1-14 Sediment
in the Large Column Showing Non-ideal Transport Behavior ................................................. 10.22

xvi
Tables
2.1 Background Uranium-Sediment Concentrations .......................................................................... 2.2 2.2 Background Uranium-Groundwater Concentrations .................................................................... 2.2 2.3 U(IV) Structures Compared to μEXAFS Spectra ......................................................................... 2.7 2.4 XRD and Best-Fit μEXAFS Structural Parameters for Betafite-C Model Refined to
Spectra R1, R2, R3, and S5........................................................................................................... 2.8 2.5 Best-Fit μEXAFS Parameters for Spectra R1, R2, S5, and R3, Modeled with Betafite C
Structure........................................................................................................................................ 2.9 3.1 Waste Sites with High U Inventories as Projected by SIM .......................................................... 3.2 4.1 U(VI) Aqueous Speciation Reactions ........................................................................................... 4.1 4.2 Uranyl and Major Chemical Components (M) in BX-102 Pore-Water Samples ......................... 4.6 4.3 Uranyl Speciation of Pore Water from BX-102............................................................................ 4.7 5.1 Waste Stream Designation and Assumed Compositions for Determination of Kd Values ........... 5.7 5.2 Kd Ranges for U(VI) by Waste Chemistry/Source Category........................................................ 5.9 5.3 U(VI) Adsorption on 300 Area Sediments from Different Groundwaters.................................. 5.13 5.4 U(VI) Kd Data for Aquifer Sediments from 200 W Area ........................................................... 5.15 5.5 Recommended Kd Values for Aquifer Sediments from 200 W for Two Scenarios.................... 5.17 6.1 Selected Parameters and Properties of E33-45 Core Samples ...................................................... 6.4 6.2 U(VI) Concentrations and Chemical Parameters From Borehole 3832........................................ 6.8 6.3 Total Uranium Concentrations in 300 Area Sediment and Groundwater Fines Measured
by X-ray Fluorescence ................................................................................................................ 6.15 6.4 Desorption Kd Values for Uranium in Long-Term Contact Experiments With Sediment
From the 300 Area ...................................................................................................................... 6.15 6.5 Comparison of U(VI) Extraction Techniques............................................................................. 6.19 7.1 Properties of Long-lived Isotopes of Uranium ............................................................................ 7.1 7.2 Ratios of Natural Uranium Isotopes ............................................................................................. 7.2 7.3 Definition of Fuel Types and Fuel Codes for Radionuclide Inventory Modeling ...................... 7.10 7.4 Uranium Fuel Initial Isotopic Compositions............................................................................... 7.10 7.5 Uranium Isotopic Ratio and Concentrations for Boreholes C3832, Near Tank TX-104 and
C4104, Near Tank T-106 ............................................................................................................ 7.23 7.6 Uranium-Isotopic Composition for Groundwater and Soil Samples Near the 316-4 Crib
and 618-10 Burial Ground .......................................................................................................... 7.30 9.1 Dominant U(VI) surface-complexing species on varying adsorbents .......................................... 9.6 9.2 U(VI) Surface Reactions and Formation Constants.................................................................... 9.10 9.3 Composition of Synthetic-IDF Pore Water and Glass Leachates ............................................... 9.11 9.4 Composition of Artificial Groundwaters .................................................................................... 9.14
xvii
9.5 Fractional Dissolution of Uranium in Extractions, Fraction of Total U Exchanged in Isotopic-Exchange Experiments, and Model-Estimated Fraction of Total U Present as Adsorbed U(VI) .......................................................................................................................... 9.16
10.1 Compositions of Electrolytes used in Dissolution Experiments with BX Sediments from Borehole E33-45 ......................................................................................................................... 10.3
10.2 Effluent Compositions and U Saturation Index From E33-45 Dissolution Experiments ........... 10.6 10.3 Parameters and Compositions Used in Modeling E33-45 Sediment Effluent Data.................... 10.7 10.4 Properties of Sediments from TX Borehole 3832..................................................................... 10.10 10.5 Chemical Compositions Used in Modeling Batch U(VI) Desorption from TX Sediments...... 10.11 10.6 Physical and Chemical Properties used in Modeling TX Column Results ............................... 10.14 10.7 Size and U(VI) Distributions in NPP1-14 Sediment ................................................................ 10.19 10.8 Average Electrolyte Compositions for NPP1-14 Small and Large Desorption Columns......... 10.19 10.9 Parameters in Modeling U(VI) Desorption from NPP1-14 Sediment in Small and Large
Columns .................................................................................................................................... 10.24 11.1 Essential Components of a Generalized Geochemical Model1 for U at Hanford ....................... 11.3

xix
Acronyms and Abbreviations
SOH Surface Complexation Site for Uranium Adsorption µEXAFS Micro Extended X-ray Absorption Fine Structure µg Microgram µm Micrometer µmol Micromole µXANES Micro X-ray Absorption Near Edge Structure µXAS Micro X-ray Absorption Spectroscopy µXRF Micro X-ray Fluorescence ACS American Chemical Society AGW Artificial Groundwater APS Advanced Photon Source atm Atmosphere(s) ATR-FTIR Attenuated Total Reflectance Fourier Transform Infrared Spectroscopy bgs Below Ground Surface BHI Bechtel Hanford Inc BTC Breakthrough Curve C Celsius CA Component Additive CCM Constant Capacitance Model CCU Cold Creek Unit CERCLA Comprehensive Environmental Response Compensation and Liability Act CLIFS Cryogenic Laser Induced Fluorescence Spectroscopy DF Degree of Freedom DIC Dissolved Inorganic Carbon DLM Diffuse Layer Model DOE Department of Energy DP Domain Porosity DPM Disintegrations per Minute DR Distributed Rate DRM Distributed Rate Model EDL Electrical Double Layer EDS Energy-Dispersive Spectroscopy EDTA Ethylenediaminetetraacetic Acid ED-XRF Energy-Dispersive X-Ray Fluorescence EMP Electron Microprobe EPA U.S. Environmental Protection Agency ERSD Environmental Remediation Sciences Division EXAFS Extended X-Ray Absorption Fine Structure g Gram GC General Composite GCSCM Generalized Composite Surface Complexation Model GIF Gatan Imaging Filter

xx
GUM Generalized Uranium Model GWB Geochemical Workbench HDWM Hanford Defined Waste Model HEIS Hanford Environmental Information System HFO Hydrous Ferric Oxide HSC Hanford Silty Clay Composite Sediment HSIM Hanford Soil Inventory Model IC Ion Chromatography ICP-MS Inductively Coupled Plasma Mass Spectrometry IDF Integrated Disposal Facility Kd Distribution Coefficient kg Kilogram KPA Kinetic Phosphorescence Analyzer L Liter LAW Low Activity Waste LFI Limited Field Investigation MCL Maximum Contaminant Level mg Milligram mm Millimeter mM Millimolar mmol Millimole mol mole MS Mass Spectrometry NA Not Available/Not Applicable ND Not Determined NEA Nuclear Energy Agency NMR Nuclear Magnetic Resonance NPP North Process Pond OBER Office of Biological and Environmental Research ORP Office of River Protection PA Performance Assessment PFBA Pentafluorobenzoic Acid PGSE Pulse Gradient Spin Echo PNC-CAT Pacific Northwest Consortium Collaborative Access Team PNNL Pacific Northwest National Laboratory ppb Parts Per Billion ppm Parts Per Million PV Pore Volume R Retardation Factor RACS Remediation and Closure Science RCRA Resource Conservation and Recovery Act SAC System Assessment Capability SAED Selected Area Electron Diffraction SC Surface Complexation SC-DR Surface Complexation and Distributed Rate Model SC-DR-DP Surface Complexation, Distributed Rate and Dual-Doman Porosity Model

xxi
SCM Surface Complexation Model SEM Scanning Electron Microscopy SF Stop Flow SGW Synthetic Groundwater SI Saturation Index SIM Soil Inventory Model SPP South Process Pond Tc Technetium TEM Transmission Electron Microscopy TIMS Thermal Ionization Mass Spectrometry TLM Triple Layer Model TRLFS Time Resolved Laser Fluorescence Spectroscopy U Uranium UMTRA Uranium Mill Tailings Remedial Action UNH Uranium Nitrate Hexahydrate WDS Wavelength Dispersive Spectroscopy WHC Westinghouse Hanford Company WMA Waste Management Area WSOS Weighed Sum of Squares XAS X-Ray Absorption Spectroscopy XMP X-Ray Microprobe XRD X-Ray Diffraction XRF X-Ray Fluorescence

1.1
1.0 Introduction
Uranium (U) is the central element of the nuclear-fuel cycle, with 235U being the fissile isotope, 238U being a reactant for the formation of 239Pu, and other U isotopes formed during fission. Uranium was handled in massive quantities during production years at the Hanford Site, as uranium fuels were assembled in the 300 Area, irradiated by eight nuclear reactors in the 100 Areas, and reprocessed to recover U and produce plutonium in the 200 Areas. During the course of these and associated waste-disposal activities, an estimated 202,703 kg of U was discharged to the ground in the Hanford 200 and 300 Areas (Corbin et al. 2005).
The large inventory of U released to the vadose zone, combined with its sometimes significant mobility under the oxidizing, circumneutral-to-mildly-basic geochemical conditions found at Hanford has led to the creation of three identified groundwater plumes (Hartman et al. 2007). These plumes have a combined area of 1.6 square kilometers with dissolved U concentrations that are above the U.S. Environmental Protection Agency’s established maximum-contaminant level (MCL) of 30 ppb (1.2 x10⁻⁷ mol/L). The migration of U to groundwater was facilitated by large volumetric releases of process waters, and by magnified natural infiltration, as a result of ponding and the use of gravel covers that enhanced transport through the vadose zone. The groundwater-U plume near Waste Management Area (WMA) B-BX-BY continues to grow in size (Hartman et al. 2007), indicating sustained flux from the vadose zone. A significantly larger number of vadose-zone plumes of U exist beneath cribs, trenches, and retention basins that have not yet migrated to groundwater. Concern exists over future disposition, and knowledge is sought to predict the migration behavior of both vadose- and saturated-zone U(VI) plumes, within acceptable levels of uncertainty, in support of both risk assessment and remedial action.
Generally, all Hanford nuclear fuels contained U in the metallic state, which was oxidized to the hexavalent state [U(VI)] during fuel-rod dissolution and reprocessing. The environmental chemistry of U is complex (note recent book devoted to subject; [Burns 1999]), and is dominated by two stable-valence states [U(IV) and U(VI)] depending on redox conditions. Under oxidizing conditions (e.g., in contact with the atmosphere or waters with >1 ppm dissolved O2), U exists in the hexavalent state [U(VI)] as the uranyl cation (UO2
2+). Uranyl transforms to the tetravalent state [U(IV)] as the insoluble-uranous cation (U4+) under reducing conditions (e.g., Eh less than approximately 0.25 V). The formal electrode potential for this redox reaction may be stated as follows for two dominant aqueous forms of U(VI) (from Grenthe et al. 1992; 1995):
0.5U(VI)O2(OH)2(aq) + H+ + e- = 0.5 U(IV)O2(s) + H2O Eo = 0.757 V (1.1)
0.5U(VI)O2(CO3)34- + 1.5 H+ + e- = 0.5U(IV)O2(s) + 1.5 HCO3
- + e- Eo = 0.687 V (1.2)
The tendency for these reactions to proceed to the right is a strong function of the dissolved-U concentration, the aqueous-fluid composition that influences the aqueous speciation of the two U forms, and the concentration of oxidants [e.g., O2, Mn(III/IV)] or reductants [e.g., Fe(II)] that may function as electron acceptors or donors for the reaction (see for example, Langmuir 1997; Ginder-Vogel et al. 2006). The dissolution of fuel rods and the reprocessing of irradiated-nuclear fuels were performed under oxidizing conditions that generally transformed and maintained U in the hexavalent state. Consequently, most environmental releases of dissolved U at Hanford were dominated by U(VI) (Corbin et al. 2005).
1.2
Thus, and to large degree, the behavior of contaminant U at the Hanford Site as a reactive solute is dominated by the geochemistry of the uranyl ion (UO2
2+).
This report will demonstrate that the subsurface mobility of U(VI) at Hanford is strongly dependent on waste and geochemical conditions. The uranyl ion extensively hydrolyzes at higher pH, and forms stable aqueous complexes of varied composition with dissolved carbonate and other aqueous anions (Grenthe et al. 1992; 1995), complicating its aqueous speciation and reactivity. The uranyl cation exhibits extensive crystal chemistry (Burns 1999) and forms precipitates with many natural-anionic ligands present in Hanford wastes (e.g., PO4
3-, OH-) and others liberated by waste-sediment reaction (e.g., SiO44-,
CO32-) (Finch and Murikami 1999). Moreover, the dissolved uranyl cation, and its various hydrolysis and
aqueous complexes react with hydroxylated surface sites on various mineral phases that are common in Hanford sediments (e.g., phyllosilicates, including smectite and clinochlore, Al and Fe(III) oxides, and others) to yield adsorbed surface complexes (see for example, Pabalan et al. 1997; 1998; Davis 2001; Davis et al. 2004a). The formation of both U(VI) precipitates and surface complexes slow the rate of U(VI) migration through Hanford’s vadose and saturated zones. The characterization and understanding of these two processes as they occur at Hanford, the parameterization of associated networks of reactions that define them, and the integration of resulting information into reactive transport models (e.g., Steefel et al. 2005) are key steps (see Davis et al. 2004b) in predicting the long-term fate and mobility of contaminant U in both the unsaturated and saturated zones.
The writing of this report has been motivated, to a large degree, by recent comprehensive studies of three sites that have contained U(VI) contamination for extended periods. A combination of field-characterization studies and laboratory research on obtained core materials have significantly advanced understanding of U(VI) geochemistry at the Hanford Site; and demonstrated that unique, and poorly understood phenomena are controlling U(VI) migration velocities. These unique phenomena result from the combined effects of the chemical and thermal characteristics of the U-containing waste streams, the site-specific mineralogic and aqueous chemical conditions of the Hanford subsurface, and the time-frame of subsurface reaction periods (e.g., 30–50 years). The sites studied include deep vadose-zone plumes nearby tanks BX-102 (E33-45) and TX-104 (C3832) in the 200 Area Plateau, with research supported by the CH2M HILL Hanford Group, and the linked vadose-zone, saturated-zone U plume in the 300 Area (300-FF-5), with research supported by DOE’s EM-40 and the Environmental Remediation Sciences Division (ERSD) within DOE’s Office of Science. While these individual research campaigns have yielded important results and insights that are being published in the open literature, no attempts have been made to reconcile or synthesize the results from these three site studies to yield a common, more broad-ranging perspective on U(VI) geochemistry at Hanford.
This report seeks to integrate existing knowledge and information on the subsurface-migration behavior of U(VI) at Hanford, as developed by the comprehensive experimental campaigns noted above, and others. Additionally, progress is defined toward developing a generalized model of U(VI) geochemical behavior that can be applied site-wide at Hanford for predicting U(VI) migration in disposal sites of varied waste chemistry and sediment properties. Additional field sampling, laboratory experimental, and new modeling activities are identified that must be performed to finalize a site-wide geochemical model for U at Hanford.
The following subject areas will be addressed to accomplish the goals of the report:
• background U in Hanford sediments, pore water, and groundwater
1.3
• U waste-site characteristics and inventory
• U(VI) aqueous speciation
• empirical distribution measurements for U(VI)
• knowledge learned from field sampling of U(VI)-contaminant plumes
• uranium isotopics and waste-source tracking
• retardation processes and mechanistic models for U(VI) in Hanford sediments, including precipitation-dissolution, adsorption-desorption, and mass transfer
• prospects for and status of a generalized predictive model.
• key additional research needs.
As much research on U(VI) geochemical behavior is ongoing because of its inherent complexity and relatively recent initiation (e.g., the Hanford-ERSD Integrated Field Challenge and EM-20 Polyphosphate Field Demonstration Project at the 300 Area uranium plume), this report will be considered an interim effort, to be finalized in the future, as more comprehensive results become available.

2.1
2.0 Background U in Hanford Sediments and Waters
Uranium is a naturally occurring element that is present as a trace constituent in the earth’s crust. The fabrication of natural and slightly enriched uranium into fuel elements for nuclear reactors in Hanford’s 300 Area, and the reprocessing of irradiated fuel in Hanford’s 200 Areas to obtain plutonium and other useful radioisotopes, has led to significant uranium contamination in the vadose zone and groundwater at the Hanford Site. As a result of these activities, uranium is considered to be one of the primary risk drivers associated with long-term stewardship of the site. To monitor and assess the environmental impact associated with contaminant uranium at Hanford, a clear understanding of the natural (background) uranium contribution must be known. Section 6 highlights lessons learned from field-sampling campaigns performed at the Hanford Site. As part of those field campaigns, sediments and groundwater samples were analyzed for background or “natural” uranium concentrations. A summary of these efforts—in addition to an overview of existing Hanford literature dealing with background-uranium concentrations—is presented in the following section.
2.1 Background Uranium Concentrations in Hanford Media
Table 2.1 contains the concentration of uranium as measured in uncontaminated or background sediment samples. The data has been gathered either via recent field-sampling and characterization campaigns or is based on historical analyses of site-wide samples (near-surface soils/sediments/rocks and groundwaters) from the early 1990s, specifically to establish statistically based Hanford Site background data. Based on the information contained in Table 2.1, the background uranium concentration in sediment collected throughout the Hanford Site ranges from a low of 0.392 mg/kg to a high of 5.10 mg/kg. However, the two lowest concentrations reported in Table 2.1 were generated via strong-acid digestion of the sediment, which does not solubilize all the crystalline uranium in the sample. Thus, including only the data from those analyses that quantitatively measure the entire uranium content of the sample would be most accurate. Based on this restriction, the range of background-uranium concentrations in Hanford sediment is 1.47 to 5.10 mg/kg.
Table 2.2 contains the concentration of uranium as measured in uncontaminated or background groundwater samples. The data contained in Table 2.2 has been gathered via historical analyses of site-wide groundwater samples. Based on the information contained in Table 2.2, the average background uranium-groundwater concentration in samples collected from the unconfined aquifer throughout the Hanford Site was 2.57 μg/L. This data is based on the analysis of 25 unconfined aquifer samples, which had an overall range of 0.5 to 12.8 μg/L. Also contained in Table 2.2 is data from Pacific Northwest National Laboratory’s (PNNL’s) most recent annual groundwater-monitoring report (Hartman et al. 2006). These data are specific to uranium in the 300 Area, and show a range of 5 to 8 μg/L for uncontaminated unconfined-aquifer groundwater samples. Based on these data, uncontaminated Hanford groundwater could contain as much as 12.8 μg/L uranium.
Conversely, the total uranium concentration measured in the confined aquifer underlying the Hanford Site is quite low. As seen in Table 2.2, the average uranium concentration in the confined aquifer was 0.01 μg/L. This data indicates that uranium contamination presently residing in the unconfined aquifer has not seeped into the deeper, confined aquifer (i.e., there is presently isolation between the two hydrologic systems).

2.2
Table 2.1. Background Uranium-Sediment Concentrations.
Location Average Uranium
Concentration (mg/kg)Standard Deviation Method Reference
WMA-B/BX/BY 1.47E+00 5.46E-01 Fusion Lindenmeier et al. (2003) WMA-C 3.92E-01 6.20E-02 SW-846 Brown et al. (2006)
WMA-S-SX 9.03E-01 8.44E-01 SW-846 Serne et al. (2002a) WMA-T 2.59E+00 9.48E-01 Fusion Serne et al. (2004b)
WMA-TX/TY 2.31E+00 5.66E-01 Fusion Serne et al. (2004a) 300 Area 5.10E+00 1.37E+00 GEA Serne et al. (2002b)
Hanford Site 2.27E+00 6.42E-01 Alpha Spectroscopy DOE/RL-96-12 (1996b)
Table 2.2. Background Uranium-Groundwater Concentrations.
Location Average Uranium
Concentration (μg/L) Standard Deviation Method Reference
Hanford Site (unconfined aquifer)
2.57E+00 2.85E+00 Unknown DOE/RL-96-61 (1997a)
Hanford Site (confined aquifer)
1E-02 9E-03 Unknown DOE/RL-93-21 (1994)
300 Area 5E+00 to 8E+00 NA ICP-MS Hartman et al. (2006) NA indicates not available
2.2 Mineral Form of Background U
Projecting how contaminant U(VI) may move in the future is contingent on understanding its molecular speciation (elements to which it is chemically bound and the resulting structure), and identifying the mineral phases with which it associates. This information is fundamental to the development of an appropriate conceptual geochemical model of contaminant reactivity. Furthermore, because uncontaminated Hanford sediments contain approximately 1 to 5 mg/kg of background U, and many contaminated sediments contain from 5 to 25 mg/kg of total U, distinguishing between the chemical forms of background and contaminant U becomes important. These may exhibit different molecular speciation and mineral residence.
Before the studies described below, no information was available regarding the valence or mineral form of background U in Hanford sediments. Background U was analytically inaccessible to the most powerful synchrotron techniques, which are typically used for these measurements, because of its low concentration. Collaborators at the Argonne National Laboratory, in association with the Advanced Photon Source (APS) (a synchrotron light source), worked on this problem, and devised a method employing unusually thick-sediment thin sections that have allowed unequivocal identification of the nature of background U.
Sediment samples (<2-mm size fraction) from beneath the tank farms in the 200 Area Plateau (C3832 69A, C3832 110A) and the Columbia River Corridor [300 Area vadose zone (NPP1-16)] were embedded in epoxy, microtomed, and polished into non-standard thin sections—approximately 300 μm thick—each containing approximately 0.25 g of sediment. The average [U] in the sediments, as determined by bulk analysis, was approximately 15 mg/kg for C3832 69A, 8 mg/kg for C3832 110A, and 17 mg/kg for NPP1-16. The samples were analyzed at the Advanced Photon Source on the PNC-XOR and the MR-CAT beamlines. Microprobe x-ray fluorescence (μXRF) maps were made to determine the

2.3
distribution of U, Fe, Ca, and several other metals. Then, the specific locations of the samples were investigated further with microprobe x-ray absorption spectroscopy (μXAS) techniques, including x-ray absorption near edge structure (μXANES) measurements to determine the average valence state of U, and microprobe extended x-ray absorption fine structure (μEXAFS) measurements to determine the chemical speciation of U.
The μXRF distributions in Figure 2.1 show the relative concentrations of U, Fe, and Ca in three areas of C3832 69A and one area of C3832 110A. Within these areas, several locations were further interrogated with μXAS measurements. The μXAS spectra are denoted with the letter R or S, followed by a numeral, to specify the location of data collection for sample C3832 69A or C3832 110A, respectively. The locations included four with intense U μXRF signals (R1, R2, R3, and S5, which show spatial correlations with Fe and Ca) and four more with diffuse-U μXRF signals (R5, R6, R7, and S13). The μXANES spectra from these regions are demonstrated in Figure 2.2. Virtually identical results were obtained for 300 Area sediment NPP1-16, and these will not be presented here for expediency. The spectra from locations with diffuse U μXRF signals (Figure 2.2A) are consistent with contaminant-U(VI) species, as they display the resonance feature above the adsorption edge (indicated by the arrow in Figure 2.2A) of a typical U(VI) uranyl moiety (Hudson et al. 1995). The μXANES spectra from locations with intense U μXRF signals (Figure 2.2B) do not contain the resonance feature above the absorption edge and are, therefore, more consistent with a U(IV) species that could be reduced-contaminant U or primary-mineral-associated background U. The U chemical speciation of the areas with an intense U μXRF signal (R1, R2, R3, S5) was further investigated with μEXAFS.
The μEXAFS spectra for the locations with intense U μXRF signals (R1, R2, R3, S5) are shown in Figure 2.3. The shape of the signal is similar for all four spectra, although the amplitude (maximum and minimum values) of the R3-spectrum signal is larger than that for the R1, R2, and S5 spectra signals. For example, Figure 2.3 shows that the maximum oscillation at 7.5 Å reaches approximately 0.8 Å-2 from the midpoint (-2.0 + 2.8 Å-2) for the R3 spectrum, as compared to 0.4 Å-2 from the midpoint for the R1, R2, and S5 spectra. The Fourier transforms of the μEXAFS spectra have peak intensities at large radial distances of 3 Å, 3.5 Å, and 5.5 Å, indicating a mineral form rather than an adsorbed species (Figure 2.4). The differences in the signal strength (Figure 2.3) are reflected as differences in some of the peak heights in the Fourier transform (Figure 2.4). Smaller-amplitude extended x-ray absorption fine structure (EXAFS) signals can be caused by a decrease in the local structural order, a nanometer particle-size effect of the U(IV) mineral, or both (O'Loughlin et al. 2003).
The μEXAFS spectra for the regions with intense μXRF signals were compared to spectra for more than 20 known U(IV) minerals, including the common minerals of uraninite, coffinite, and brannerite (see Table 2.3). The only mineral with a theoretical spectrum similar to the measured spectra was betafite C (Dickson et al. 1989), with a chemical formula of Ca0.92U1.08(Ti2O7). In the betafite C structure, Ca may substitute for U in approximately one-half of the U sites. The betafite C structure is shown in Figure 2.5, and the radial distribution of atoms about U, as predicted by XRD (Dickson et al. 1989), is given in Table 2.4.

2.4
Figure 2.1. XRF Distributions Showing the U (left), Fe (middle), and Ca (right) Signals From
TX-104 69A (A, B, C) and TX-104 110A (D). Positions of μXAS data collection from R1 (A), R2 and R7 (B), R3 and R5 (C), and S5 and S13 (D) are denoted.

2.5
17125 17150 17175 17200 172250.0
0.5
1.0
1.5
2.0
0.0
0.5
1.0
1.5
2.0
B TX-104 69A R1 TX-104 69A R2 TX-104 69A R3 TX-104 110A S5 U(VI) Std U(IV) Std
Nor
mal
ized
X-r
ay A
bsor
ptio
n
X-ray Energy (eV)
A TX-104 69A R5 TX-104 69A R6 TX-104 69A R7 TX-104 110A S13 U(VI) Std U(IV) Std
Nor
mal
ized
X-ra
y Ab
sorp
tion
Figure 2.2. XANES Spectra From Sample Regions Similar to the U(VI) Standard (A) and Regions
Similar to the U(IV) Standard (B). The arrows shows the position of the resonance feature common to U(VI) uranyl species.

2.6
0 2 4 6 8-4
-3
-2
-1
0
1
2
3
χ(k
)·k2 (Å
-2)
k (Å-1) Figure 2.3. U μEXAFS χ(k) Spectra (symbols) and Model (lines) for S13, R1, R2, R3, and S5 (top
to bottom).
0 2 4 6 8-1.5
-1.0
-0.5
0.0
0.5
1.0
0 2 4 6 8
-3
-2
-1
0
R (Å)
A
|FT(
χ(k)
k2 )|
(Å-3)
Re
(FT(
χ(k)
k2 ))
(Å-3)
B
R (Å)
Figure 2.4. Magnitude (A) and Real Part (B) of the Fourier Transform of the μEXAFS Spectra (symbols) and Models (lines) for R1, R2, S5, and R3 (top to bottom).

2.7
Table 2.3. U(IV) Structures Compared to μEXAFS Spectra.
Mineral Name Composition ICSD Number and Reference
Uraninite UO2 ICSD-24850 Coffinite USiO4 ICSD-15484 Brannerite (U0.54Y0.46)(Ti2O6) ICSD-97424 Brannerite U0.74Ca0.26Ti2O6 ICSD-59579 Brannerite UTi2O6 (without Ca) ICSD-59579 Brannerite UTi2O6 ICSD-201342 Cheralite (Ce 0.41 Ca 0.29 Th 0.26 U 0.4 )(P 0.95 Si 0.05)O4 ICSD-81115 Hellandite Ca5.24(Y2.62La 2.62) (Al1.1Fe0.9) (O H)4 (Si 8B8O40(O H)4) ICSD-100145 Ianthinite (U2(UO2)4O6(OH)4(H2O)4)(H2O)5 ICSD-84442 Sr2FeUO6 ICSD-61291 Sr3UFe2O9 ICSD-28470 U(PO3)4 ICSD-20673 Uranopolycrase (U0.46Y0.42Th0.06Mn0.06)(Ta0.16Ti0.96Nb 0.84)O6 ICSD-66690 Wyartite CaU(UO2)2(CO3)O4(OH)(H2O)7 ICSD-87691 Aeschynite (Y0.64Gd0.22Th0.06U0.04Ca0.01) (Ti1.95Nb0.05)W0.03O5.23(O H)0.77 ICSD-87837 Betafite C Ca0.92U1.08(Ti2O7) ICSD-40264 Betafite Ca1.29 Na 0.18U0.50Ce 0.03) (Ti1.09Nb0.79Zr0.14Fe0.04Ta0.01) O6(O 0.98F0.02) ICSD-151522 Cliffordite UTe3O9 ICSD-9080 Uranmicrolite U(Ta2O7) ICSD-27778 Davidite Ti12.67Fe6.15La0.91Ca0.20U0.33Y0.30Mg0.24Cr0.21Sr0.09O38 ICSD-100554
Figure 2.5. Crystal Structure of betafite C, Based on Previous XRD Measurements. The blue, dark
gray, light gray, and red spheres represent U, Ca, Ti, and O atoms, respectively. The numeric labels correspond with designations in Table 2.1.

2.8
Table 2.4. XRD and Best-Fit μEXAFS Structural Parameters for Betafite-C Model Refined to Spectra R1, R2, R3, and S5.
XRD μEXAFS Path Ndegen R (Å) R (Å) σ2 (·10-3 Å2)
Comparison of XRD and μEXAFS ΔR (%)
U-O1 2 2.20 -a -a - U-O2 6 2.49 2.28 ± 0.12 -a 8 U-U1 3 3.59 3.65 ± 0.04 2.6 ± 3.8 2 U-Ca1 3 3.59 3.48 ± 0.03 2.6 ± 3.8 -3 U-Ti1 6 3.59 3.42 ± 0.01 9.2 ± 3.6 -5 U-O3 12 4.10 4.15 ± 0.04 12.7 ± 7.5 1 U-O4 6 4.63 4.68 ± 0.04 12.7 ± 7.5 1 U-Ti2 6 5.08 4.90 ± 0.02 4.9 ± 3.3 -4 U-O5 12 5.23 5.05 ± 0.10 12.7 ± 7.5 -3
U-O5-O1 24 5.33 5.15 ± 0.10 12.7 ± 7.5 -3 U-O5-Ti1 24 5.40 5.22 ± 0.10 12.7 ± 7.5 -3
U-U2 12 6.22 6.35 ± 0.02 2.7 ± 3.8 -2 U-Ti3 12 6.22 6.18 ± 0.03 4.9 ± 3.3 -1
All four measured μEXAFS spectra were simultaneously refined with many common parameters based on the betafite C structure. The average distances from the U atoms to the neighboring atoms, as determined from μEXAFS for the betafite C structure, are listed in Table 2.4. The difference between the XRD- and μEXAFS-predicted values for these distances is as much as 8%. The difference between these values becomes smaller as the distance between the U atom and the neighboring atom increases. This trend is expected, as XRD measures the long-range order of the mineral, while EXAFS measures the immediate atomic environment about the U atoms. The substitution of Ca for U will likely cause differences in bond lengths that are partially responsible for the differences in the μEXAFS and XRD values.
The betafite structural model includes one fractional amplitude term (f1) for the metal shells at less than 6 Å (U1, U2, Ca1, Ti1, Ti2) and another (f2) for the two more distant metal shells (U2, Ti3), to account for the differences in the amplitudes of the signals in each of the measured spectra (see arrows in Figure 2.4). The fractional amplitude values are listed in Table 2.5. The fractional values for the R3 spectrum were constrained to 1.0, as these values were consistent with 1.0 when variation was allowed. The values for f1 and f2 are 0.7 ± 0.2 and 0.5 ± 0.3 for the R1 spectrum, 1.0 ± 0.3 and 0.6 ± 0.4 for the R2 spectrum, and 1.0 ± 0.2 and 0.5 ± 0.2 for the S5 spectrum. The smaller values for f2, as compared to f1, are consistent with an effect due to nanometer-particle size.
Betafite is structurally similar to more common brannerite, which is a frequently observed accessory U mineral in granites, granitic pegmatites, and uraninite/coffinite U deposits (Finch 1996). More specifically, betafite is found principally in carbonatite, calcite-fluorite-apatite-amphibole veins, and subalkaline to peralkaline anorogenic granitic pegmatites (Kennedy 1979; Cery and Ercit 1989). Its origin in Hanford sediments ostensibly derives from the ubiquitous and substantial content of granitic lithic fragments (e.g., 15%–35%) that are common to all Hanford sediments. The provenance of some of these granitic fragments could be northwestern Washington, where a major uranium deposit containing both uraninite and coffinite exists. The identification of this phase in Hanford sediments with low overall total U content was allowed by its presence as discrete mineral grains with high U concentration.

2.9
Table 2.5. Best-Fit μEXAFS Parameters for Spectra R1, R2, S5, and R3, Modeled with Betafite C Structure.
Spectra Parameter R1 R2 S5 R3
f1 0.7 ± 0.2 1.0 ± 0.3 1.0 ± 0.2 1.0a f2 0.5 ± 0.3 0.6 ± 0.4 0.5 ± 0.2 1.0a
σ2o1i 13 ± 3 11 ± 3 13 ± 2 6 ± 12 Ro1i 2.3 ± 0.3 2.2 ± 0.3
Betafite itself is highly resistant to weathering (Lumpkin and Ewing 1995, 1996), an observation that possibly explains its apparent long-term stability in Hanford sediments. This mineralogic stability has led to suggestions that betafite may be an effective radioactive waste-isolation form (Harker 1988). Further research is necessary to determine if betafite, or a more rapidly weathering accessory-U(IV) phase, is the primary source of background U(VI) to Hanford vadose zone and groundwaters. Nevertheless, the apparent frequent occurrence of this mineral phase in low concentration needs to be explicitly considered when attempting to interpret speciation measurements of contaminant U in Hanford sediments.


3.1
3.0 Inventory and Character of U-Containing Wastes
An estimated 202,703 kg of U was released to the ground surface at Hanford through disposal of waste solutions to cribs, trenches, and process ponds as well as through the inadvertent release of tank waste. An analysis of this inventory was recently performed (Simpson et al. 2006) using the Hanford Soil Inventory Model (SIM) (Corbin et al. 2005). The objectives of this analysis were to 1) identify the specific sites containing the most U, 2) determine the fraction of high inventory sites receiving U in acidic and/or basic-waste streams as a fundamental characteristic controlling U mobility, and 3) establish which sites received reactive organic (e.g., complexants citrate, EDTA/HEDTA) or inorganic ligands (e.g., CO3, PO4) that may modify expected geochemical behavior.
Key results and implications of the Simpson et al. (2006) analysis pertaining to the top 10 inventory sites are discussed here, especially in terms of the identification of common elements and unique aspects. Readers seeking the comprehensive analysis of all sites, including waste-stream loadings and waste-stream compositions, should consult Simpson et al. (2006), the SIM source document (Corbin et al. 2005) and citations therein, and Higley et al. (2004). The inventory analysis discussed here is constrained by the assumptions of the SIM (Corbin et al. 2005) and the Hanford Defined Waste Model (HDWM) (Higley et al. 2004), and the process-related databases from which the models were derived. For example, a key assumption in this modeling for U was the nominal or average solubility limit of U in Hanford waste streams (approximately 860 mg/L), which determined the distribution between dissolved and solid U forms. It is important to recognize that reconstructing the waste-stream compositions and loadings that went to the various waste sites is challenging and uncertain. Unfortunately, there are very few direct and comprehensive analyses of Hanford waste streams during the early production years that can be used to verify waste-stream character and composition used in current model projections. Among other things, waste-stream pH and solids’ mass and composition were rarely measured. Corrosive or acidic-waste streams were also commonly neutralized to undocumented end-states, as directed by empirically established processing or flow-chart considerations.
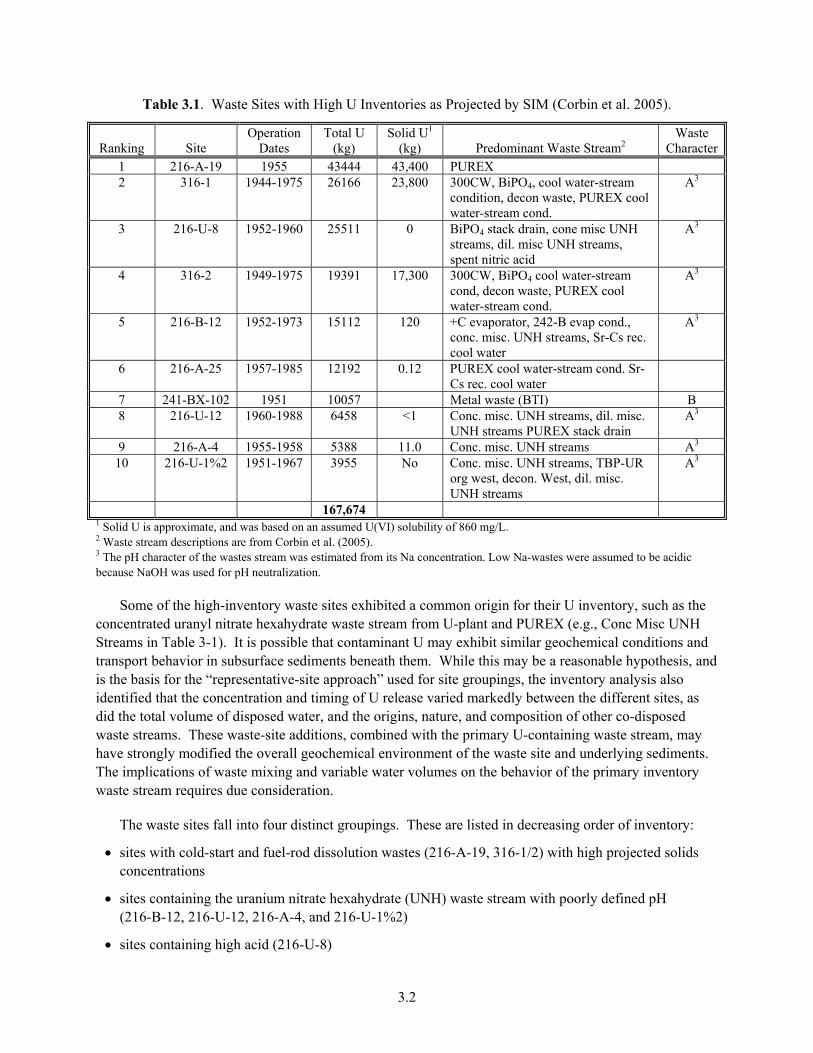
Close to 81.4% of the total U inventory was projected to reside in 10 high-inventory sites (Table 3.1). Within these sites, the total U inventory was observed to vary by a decade from a high of 43,444 kg in 216-A-19 to 3955 kg in 216-U-1%2. The next 10 sites in ranking (not shown) contained an additional 9.7% of the inventory. Generally, the high-U sites were localized to areas used for disposing 1) cold-start waste from REDOX and PUREX (where separations plants were beginning production, and unirradiated fuel was used to establish production benchmarks or procedures) (e.g., 216-A-19), 2) fuel-rod production wastes in the 300 Area (316-1 and 316-2), and 3) uranium recovery and recycling byproduct waste from U-plant (e.g., 216-U-8). A few U releases have also occurred in the tank farms, primarily through leakage of metal or first-cycle BiPO4 wastes (e.g., 241-BX-102). Other smaller U releases have occurred in the tank farms that could possibly impact groundwater quality, and a study of one of these (TX-104-C3832) (Myers 2005; Serne et al. 2004) is presented in later sections of this report. Of critical note, these inventories are model projections. Only one of these (241-BX-102) has been qualitatively documented by field sampling (Knepp 2002). Verification is a challenge because of difficulties in characterizing a three-dimensional subsurface plume with complex structure, with a limited number of boreholes, or geophysical measurements primarily sensitive to total salt content. Field-sampling campaigns at 316-1/2 (Zachara et al. 2005; Williams et al. 2007) have successfully intersected core zones of the U inventory, while those at 216-A-19 and 216-A-4 (Chris Brown, personal communication, 2007) did not.
3.2
Table 3.1. Waste Sites with High U Inventories as Projected by SIM (Corbin et al. 2005).
Ranking Site Operation
Dates Total U
(kg) Solid U1
(kg) Predominant Waste Stream2 Waste
Character1 216-A-19 1955 43444 43,400 PUREX 2 316-1 1944-1975 26166 23,800 300CW, BiPO4, cool water-stream
condition, decon waste, PUREX cool water-stream cond.
A3
3 216-U-8 1952-1960 25511 0 BiPO4 stack drain, cone misc UNH streams, dil. misc UNH streams, spent nitric acid
A3
4 316-2 1949-1975 19391 17,300 300CW, BiPO4 cool water-stream cond, decon waste, PUREX cool water-stream cond.
A3
5 216-B-12 1952-1973 15112 120 +C evaporator, 242-B evap cond., conc. misc. UNH streams, Sr-Cs rec. cool water
A3
6 216-A-25 1957-1985 12192 0.12 PUREX cool water-stream cond. Sr-Cs rec. cool water
7 241-BX-102 1951 10057 Metal waste (BTI) B 8 216-U-12 1960-1988 6458 <1 Conc. misc. UNH streams, dil. misc.
UNH streams PUREX stack drain A3
9 216-A-4 1955-1958 5388 11.0 Conc. misc. UNH streams A3 10 216-U-1%2 1951-1967 3955 No Conc. misc. UNH streams, TBP-UR
org west, decon. West, dil. misc. UNH streams
A3
167,674 1 Solid U is approximate, and was based on an assumed U(VI) solubility of 860 mg/L. 2 Waste stream descriptions are from Corbin et al. (2005). 3 The pH character of the wastes stream was estimated from its Na concentration. Low Na-wastes were assumed to be acidic because NaOH was used for pH neutralization.
Some of the high-inventory waste sites exhibited a common origin for their U inventory, such as the concentrated uranyl nitrate hexahydrate waste stream from U-plant and PUREX (e.g., Conc Misc UNH Streams in Table 3-1). It is possible that contaminant U may exhibit similar geochemical conditions and transport behavior in subsurface sediments beneath them. While this may be a reasonable hypothesis, and is the basis for the “representative-site approach” used for site groupings, the inventory analysis also identified that the concentration and timing of U release varied markedly between the different sites, as did the total volume of disposed water, and the origins, nature, and composition of other co-disposed waste streams. These waste-site additions, combined with the primary U-containing waste stream, may have strongly modified the overall geochemical environment of the waste site and underlying sediments. The implications of waste mixing and variable water volumes on the behavior of the primary inventory waste stream requires due consideration.
The waste sites fall into four distinct groupings. These are listed in decreasing order of inventory:
• sites with cold-start and fuel-rod dissolution wastes (216-A-19, 316-1/2) with high projected solids concentrations
• sites containing the uranium nitrate hexahydrate (UNH) waste stream with poorly defined pH (216-B-12, 216-U-12, 216-A-4, and 216-U-1%2)
• sites containing high acid (216-U-8)
3.3
• sites containing high-base and inorganic complexants (CO32- and PO4
3-; 241-BX-102).
Significant concentrations of organic complexants were projected for only a few of the lower-inventory sites (Simpson et al. 2006), which were not significant to the analysis. Although unstudied, acidic U-bearing waste streams undoubtedly underwent waste-sediment reactions that moderated waste pH and lowered sediment pH by coupled dissolution and precipitation reactions. The converse-reaction suite, where high-pH tank waste reacts with Hanford sediment, in contrast, has been well studied and is complex (see literature summarized in Zachara et al. 2007a). The speculation is that acidic wastes would drive the dissolution of carbonates and fine-grained phyllosilicates in Hanford sediments, and that crystalline oxides would precipitate. These reactions and the resulting aqueous and solid-phase byproducts, along with attendant changes to the original mineralogy and surface characteristics of the sediments, could strongly influence the post-disposal migration of contaminant U, both in positive and negative directions. Relict phases and surface complexes resulting from these past pH-neutralizing, sediment-waste reactions may be evident in the current chemical speciation of sorbed U.
The waste materials at sites 241-BX-102, 216-A-19, and 316-1/2 each exhibited unique characteristics that distinguish them from the others. The BX-102 event resulted from overfill of a single-shell storage tank with first-cycle BiPO4 metal waste (RPP, 2002) (Serne et al. 2002). The metal waste was a metastable liquid that was created using phosphate and carbonate complexants at elevated temperature (e.g., 80oC) to temporarily increase the solubility of U(VI) to high levels. The high U solution degraded to a complex-colloidal suspension (of U phosphate precipitates and dissolved U carbonates) with time and temperature change. This waste form has proven very difficult to synthesize or simulate for studies of geochemical mobility (Serne et al. 2007). Although fascinating, this waste form is not necessarily representative of Hanford U-waste streams. Sites containing PUREX cold-start wastes (216-A-19) and fuel-rod production wastes (316-1/2) were projected by SIM to have received large amounts of solid phase U. This projection resulted from consideration of the total U inventories disposed, the known volumes of waste fluids released, and an assumed value of U(VI) solubility in the waste stream (e.g., approximately 860 ppm). An increased value of the assumed-solubility limit, as would occur under acidic conditions, would significantly lower the projected inventory of U solids. It is plausible that initially acidic, high-U(VI) fuel-rod dissolution waste streams were neutralized before disposal, leading to the hydrolysis and precipitation of a variety of U(VI) oxyhydroxides. At this point, however, the presence of such waste-stream U solids, and the nature of those solids [e.g., metallic U, mixed U(IV) and U(VI), or U(VI)] remains undefined through the course of field sampling. Waste-stream solids would significantly affect the long-term behavior of contaminant U present in these sites. All other known environmental U releases at Hanford have been dominated by dissolved U(VI).
There are spatial correlations between waste sites of high-U inventory, and existing groundwater U plumes. This correlation is not expected to be exact because the waste sites exhibit markedly different hydrologic (e.g., process-water disposal and natural or enhanced recharge) and waste-chemical histories, and the underlying vadose zones display great differences in lithologic, geochemical, and hydrophysical properties, influencing both physical and chemical retardation and migration vectors. The principal U plumes reside in three areas: 1) the north-northwest of the 200 East Area in WMA B-BX-BY, with a localized hot spot near 241-BX-102, 2) the south portion of the 200 West Area (200-UP-1 Operable Unit) near the 216-U1,2 Crib, and 3) along the Columbia River shoreline in the 300 Area, beneath and surrounding 316-1 and 316-2 (Hartman et al. 2007).

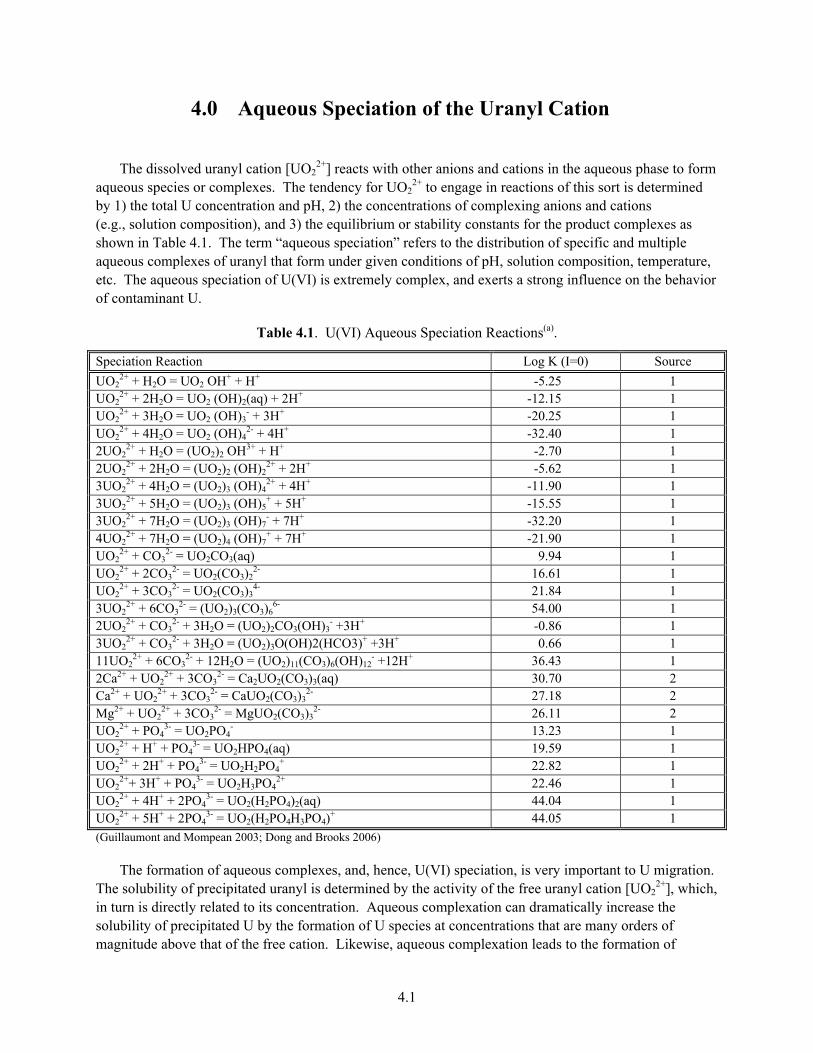
4.1
4.0 Aqueous Speciation of the Uranyl Cation
The dissolved uranyl cation [UO22+] reacts with other anions and cations in the aqueous phase to form
aqueous species or complexes. The tendency for UO22+ to engage in reactions of this sort is determined
by 1) the total U concentration and pH, 2) the concentrations of complexing anions and cations (e.g., solution composition), and 3) the equilibrium or stability constants for the product complexes as shown in Table 4.1. The term “aqueous speciation” refers to the distribution of specific and multiple aqueous complexes of uranyl that form under given conditions of pH, solution composition, temperature, etc. The aqueous speciation of U(VI) is extremely complex, and exerts a strong influence on the behavior of contaminant U.
Table 4.1. U(VI) Aqueous Speciation Reactions(a).
Speciation Reaction Log K (I=0) Source UO2
2+ + H2O = UO2 OH+ + H+ -5.25 1 UO2
2+ + 2H2O = UO2 (OH)2(aq) + 2H+ -12.15 1 UO2
2+ + 3H2O = UO2 (OH)3- + 3H+ -20.25 1
UO22+ + 4H2O = UO2 (OH)4
2- + 4H+ -32.40 1 2UO2
2+ + H2O = (UO2)2 OH3+ + H+ -2.70 1 2UO2
2+ + 2H2O = (UO2)2 (OH)22+ + 2H+ -5.62 1
3UO22+ + 4H2O = (UO2)3 (OH)4
2+ + 4H+ -11.90 1 3UO2
2+ + 5H2O = (UO2)3 (OH)5+ + 5H+ -15.55 1
3UO22+ + 7H2O = (UO2)3 (OH)7
- + 7H+ -32.20 1 4UO2
2+ + 7H2O = (UO2)4 (OH)7+ + 7H+ -21.90 1
UO22+ + CO3
2- = UO2CO3(aq) 9.94 1 UO2
2+ + 2CO32- = UO2(CO3)2
2- 16.61 1 UO2
2+ + 3CO32- = UO2(CO3)3
4- 21.84 1 3UO2
2+ + 6CO32- = (UO2)3(CO3)6
6- 54.00 1 2UO2
2+ + CO32- + 3H2O = (UO2)2CO3(OH)3
- +3H+ -0.86 1 3UO2
2+ + CO32- + 3H2O = (UO2)3O(OH)2(HCO3)+ +3H+ 0.66 1
11UO22+ + 6CO3
2- + 12H2O = (UO2)11(CO3)6(OH)12- +12H+ 36.43 1
2Ca2+ + UO22+ + 3CO3
2- = Ca2UO2(CO3)3(aq) 30.70 2 Ca2+ + UO2
2+ + 3CO32- = CaUO2(CO3)3
2- 27.18 2 Mg2+ + UO2
2+ + 3CO32- = MgUO2(CO3)3
2- 26.11 2 UO2
2+ + PO43- = UO2PO4
- 13.23 1 UO2
2+ + H+ + PO43- = UO2HPO4(aq) 19.59 1
UO22+ + 2H+ + PO4
3- = UO2H2PO4+ 22.82 1
UO22++ 3H+ + PO4
3- = UO2H3PO42+ 22.46 1
UO22+ + 4H+ + 2PO4
3- = UO2(H2PO4)2(aq) 44.04 1 UO2
2+ + 5H+ + 2PO43- = UO2(H2PO4H3PO4)+ 44.05 1
(Guillaumont and Mompean 2003; Dong and Brooks 2006)
The formation of aqueous complexes, and, hence, U(VI) speciation, is very important to U migration. The solubility of precipitated uranyl is determined by the activity of the free uranyl cation [UO2
2+], which, in turn is directly related to its concentration. Aqueous complexation can dramatically increase the solubility of precipitated U by the formation of U species at concentrations that are many orders of magnitude above that of the free cation. Likewise, aqueous complexation leads to the formation of
4.2
dissolved U species with very different charges, sizes, chemical bonding behavior, and aqueous diffusivities as compared to the free cation. These differences exert a profound influence on the extent that U(VI) adsorbs to mineral surfaces by ion exchange or surface complexation, and the rates of diffusive exchange between pore waters and reactive pore spaces or particle interiors. The establishment and verification of an appropriate speciation or aqueous thermodynamic model is a critical first step in the development of more involved reaction models for U(VI) adsorption/desorption and precipitation/dissolution in Hanford sediments (Liu et al. 2004b; Bond et al. 2007; Ilton et al. 2006, 2007; Dong et al. 2005).
4.1 Computerized Aqueous Speciation Calculations
The computation of U(VI)-aqueous speciation is fundamental to the interpretation of U(VI) geochemical and transport behavior in laboratory and field systems. Such computations are often performed with geochemical-speciation models, such as MINTEQA2 (Allison et al. 1998), Geochemical Workbench (GWB) (Bethke 2005), or equivalent. The basis for these calculations is well described in a variety of environmental chemistry texts (Sposito 1981; Langmuir 1997; Benjamin 2002). Aqueous-complexation reactions proceed rapidly, and aqueous speciation is, therefore, generally calculated for equilibrium conditions. Reaction stoichiometries and stability constants, as summarized in Table 4.1, represent the thermodynamic data needed for the speciation calculation. These are derived from experimental measurements of variable quality. Grenthe et al. (1992, 1995) and Guillaumont and Mompean (2003) have extensively reviewed the literature database on aqueous-complexation reactions of U(VI) and, from these, suggest the most experimentally robust and statistically defensible values. These accepted and reviewed values have been used for all calculations in this report.
The thermodynamic data recommended by the above authors, and as summarized in Table 4, were used in a series of calculations to illustrate the U(VI) species that form in Hanford pore waters (Figures 4.1 and 4.2). Key parameters influencing U(VI) speciation in Hanford vadose zone and groundwater {pH, [U(VI)tot], CO3
2-, Ca2+, Mg2+, and PO43-} were varied over relevant concentration ranges to ascertain
the effects. The aqueous carbonate concentration was assumed to be in equilibrium with atmospheric CO2(g) partial pressure, with the consequent result that the total aqueous-carbonate concentration increased with pH through carbonic-acid dissociation. The calculations were made with the equilibrium speciation computer code, GWB.
In the absence of Ca, Mg, and phosphate, U(VI) aqueous speciation at low concentration (0.1 μmol/L, a concentration approximately equal to the maximum contaminant level [MCL]) was dominated by a mononuclear hydrolysis species [UO2OH+] below pH 6.5, a binuclear species [(UO2)2CO3(OH)3
-] from pH 6.5 to 7.8, and a mononuclear species [UO2(CO3)2
2- and UO2(CO3)34-] above pH 7.8 (top panel in
Figure 4.1). Increasing the U(VI) concentration expanded the region dominated by species (UO2)2CO3(OH)3
- at the expense of mononuclear species in both lower and higher pH regions (Figure 4.1). When U(VI)tot was above 10 μmol/L (i.e., >100 times the MCL), the multinuclear uranyl species, including (UO2)3(OH)5
+ (bottom panel in Figure 4.1), became important at lower pH. The effect of U(VI)tot was minor above pH 7.0, as U(VI) aqueous speciation was stabilized by high carbonate concentrations and very strong carbonate complexes [e.g., UO2(CO3)2
2- and UO2(CO3)34-]. The calculated
total dissolved-carbonate concentration increased continuously from 0.02 mmol/L at pH 6.0 to 7 mmol/L at pH 9.0 (Figure 4.1).

4.3
U(VI)tot = 0.1 μMpCO2 = 10-3.5atmI = 0.05 M NaNO3
log
(C, M
)
-9.0
-8.5
-8.0
-7.5
-7.0
-6.5
-6.0
CO
2(aq
, tot
) (m
M)
0.01
0.1
1
10
U(VI)tot = 1 μMpCO2 = 10-3.5atmI = 0.05 M NaNO3
log
(C, M
)
-8.0
-7.5
-7.0
-6.5
-6.0
-5.5
-5.0
CO
2(aq
, tot
) (m
M)
0.01
0.1
1
10
U(VI)tot = 10 μMpCO2 = 10-3.5atmI = 0.05 M NaNO3
pH6.0 6.5 7.0 7.5 8.0 8.5 9.0
log
(C, M
)
-7.0
-6.5
-6.0
-5.5
-5.0
-4.5
-4.0
CO
2(aq
, tot
) (m
M)
0.01
0.1
1
10
(UO2)2CO3(OH)3-
UO2(CO3)34-
UO2(CO3)22-
UO2OH+
UO2CO3(aq)
UO2(OH)2(aq)UO22+
CO2(aq, tot) (right axis)
(UO2)2CO3(OH)3-
UO2OH+
UO2(CO3)34-
UO2(CO3)22-
UO2CO3(aq)
UO2(OH)2(aq)
UO22+ (UO2)3(OH)5
+
CO2(aq, tot) (right axis)
CO2(aq, tot) (right axis)
(UO2)2CO3(OH)3-
(UO2)3(OH)5+
UO2CO3(aq)
UO2(CO3)34-
UO2(CO3)22-
UO2OH+
UO2(OH)2(aq)UO22+
Figure 4.1. Aqueous U(VI) Speciation as a function of pH, total aqueous U(VI) and carbonate
concentrations. The carbonate concentration is in equilibrium with CO2(g) pressure of 10-3.5 atm.

4.4
U(VI)tot = 1 μM Catot = 10 mM
log
(C, M
)
-8
-7
-6
-5
C, m
M
0.01
0.1
1
10
log
(C, M
)
-8
-7
-6
-5
C, m
M
0.01
0.1
1
10
U(VI)tot = 1 μMCatot = 10 mMPtot = 10 μM
pH6.0 6.5 7.0 7.5 8.0 8.5 9.0
log
(C, M
)
-8
-7
-6
-5
C, m
M
10-5
10-4
10-3
10-2
10-1
100
101
(UO2)2CO3(OH)3-
UO2(CO3)34-
UO2(CO3)22-
UO2OH+
UO2CO3(aq)
UO22+
CO2(aq, tot) (right axis)
(UO2)2CO3(OH)3-
UO2OH+
UO2(CO3)34-
UO2(CO3)22-
UO2CO3(aq)
UO22+
CO2(aq, tot) (right axis)
CO2(aq, tot) (right axis)
(UO2)2CO3(OH)3-
UO2CO3(aq)
UO2(CO3)34-UO2(CO3)2
2-
UO2OH+
UO22+
Ca2UO2(CO3)3(aq)
aqueous Ca (right axis)
CaUO2(CO3)32-
MgUO2(CO3)32-
CaUO2(CO3)32-Ca2UO2(CO3)3(aq)
aqueous Ca(right axis)
U(VI)tot = 1 μM Catot = 10 mM Mgtot = 10 mM
aqueous Mg (right axis)
UO2PO4-
UO2HPO4(aq) Ca2UO2(CO3)3(aq) CaUO2(CO3)32-
Aqueous P (right axis)
aqueous Ca (right axis)
Figure 4.2. Aqueous U(VI) Speciation in Presence of Ca, Ca and Mg (middle panel), and Ca and
Phosphate (bottom panel). The total concentration of Ca was 10 mmol,, including both aqueous and solid phases in equilibrium. The solid calcium was represented by calcite. Total Mg concentration was 10 mM including both aqueous and solid-phase dolomite in equilibrium. The phosphate concentration was in equilibrium with mineral hydroxy apatite.
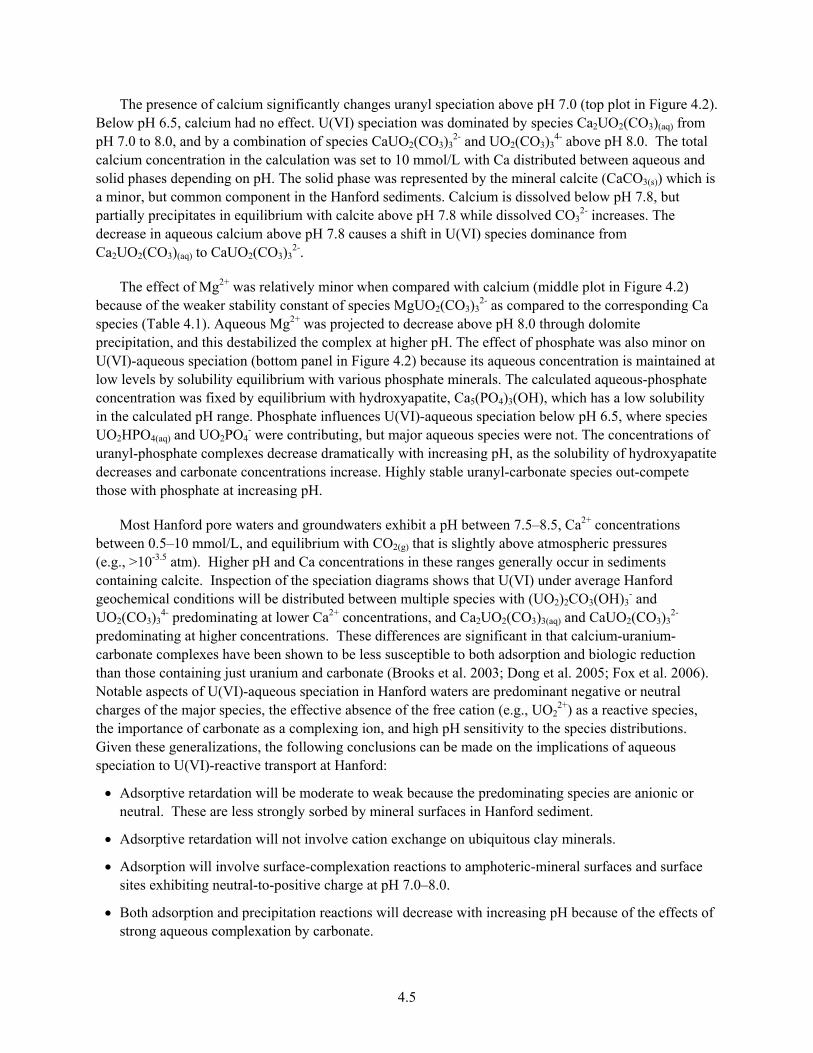
4.5
The presence of calcium significantly changes uranyl speciation above pH 7.0 (top plot in Figure 4.2). Below pH 6.5, calcium had no effect. U(VI) speciation was dominated by species Ca2UO2(CO3)(aq) from pH 7.0 to 8.0, and by a combination of species CaUO2(CO3)3
2- and UO2(CO3)34- above pH 8.0. The total
calcium concentration in the calculation was set to 10 mmol/L with Ca distributed between aqueous and solid phases depending on pH. The solid phase was represented by the mineral calcite (CaCO3(s)) which is a minor, but common component in the Hanford sediments. Calcium is dissolved below pH 7.8, but partially precipitates in equilibrium with calcite above pH 7.8 while dissolved CO3
2- increases. The decrease in aqueous calcium above pH 7.8 causes a shift in U(VI) species dominance from Ca2UO2(CO3)(aq) to CaUO2(CO3)3
2-.
The effect of Mg2+ was relatively minor when compared with calcium (middle plot in Figure 4.2) because of the weaker stability constant of species MgUO2(CO3)3
2- as compared to the corresponding Ca species (Table 4.1). Aqueous Mg2+ was projected to decrease above pH 8.0 through dolomite precipitation, and this destabilized the complex at higher pH. The effect of phosphate was also minor on U(VI)-aqueous speciation (bottom panel in Figure 4.2) because its aqueous concentration is maintained at low levels by solubility equilibrium with various phosphate minerals. The calculated aqueous-phosphate concentration was fixed by equilibrium with hydroxyapatite, Ca5(PO4)3(OH), which has a low solubility in the calculated pH range. Phosphate influences U(VI)-aqueous speciation below pH 6.5, where species UO2HPO4(aq) and UO2PO4
- were contributing, but major aqueous species were not. The concentrations of uranyl-phosphate complexes decrease dramatically with increasing pH, as the solubility of hydroxyapatite decreases and carbonate concentrations increase. Highly stable uranyl-carbonate species out-compete those with phosphate at increasing pH.
Most Hanford pore waters and groundwaters exhibit a pH between 7.5–8.5, Ca2+ concentrations between 0.5–10 mmol/L, and equilibrium with CO2(g) that is slightly above atmospheric pressures (e.g., >10-3.5 atm). Higher pH and Ca concentrations in these ranges generally occur in sediments containing calcite. Inspection of the speciation diagrams shows that U(VI) under average Hanford geochemical conditions will be distributed between multiple species with (UO2)2CO3(OH)3
- and UO2(CO3)3
4- predominating at lower Ca2+ concentrations, and Ca2UO2(CO3)3(aq) and CaUO2(CO3)32-
predominating at higher concentrations. These differences are significant in that calcium-uranium-carbonate complexes have been shown to be less susceptible to both adsorption and biologic reduction than those containing just uranium and carbonate (Brooks et al. 2003; Dong et al. 2005; Fox et al. 2006). Notable aspects of U(VI)-aqueous speciation in Hanford waters are predominant negative or neutral charges of the major species, the effective absence of the free cation (e.g., UO2
2+) as a reactive species, the importance of carbonate as a complexing ion, and high pH sensitivity to the species distributions. Given these generalizations, the following conclusions can be made on the implications of aqueous speciation to U(VI)-reactive transport at Hanford:
• Adsorptive retardation will be moderate to weak because the predominating species are anionic or neutral. These are less strongly sorbed by mineral surfaces in Hanford sediment.
• Adsorptive retardation will not involve cation exchange on ubiquitous clay minerals.
• Adsorption will involve surface-complexation reactions to amphoteric-mineral surfaces and surface sites exhibiting neutral-to-positive charge at pH 7.0–8.0.
• Both adsorption and precipitation reactions will decrease with increasing pH because of the effects of strong aqueous complexation by carbonate.
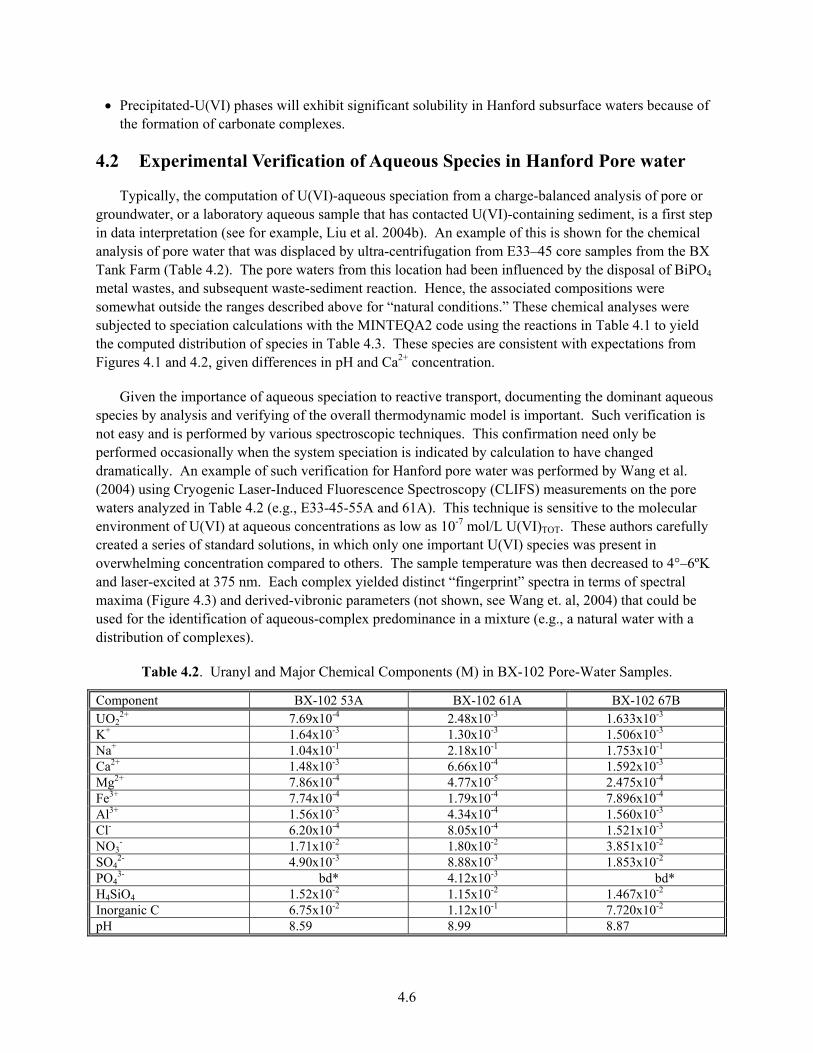
4.6
• Precipitated-U(VI) phases will exhibit significant solubility in Hanford subsurface waters because of the formation of carbonate complexes.
4.2 Experimental Verification of Aqueous Species in Hanford Pore water
Typically, the computation of U(VI)-aqueous speciation from a charge-balanced analysis of pore or groundwater, or a laboratory aqueous sample that has contacted U(VI)-containing sediment, is a first step in data interpretation (see for example, Liu et al. 2004b). An example of this is shown for the chemical analysis of pore water that was displaced by ultra-centrifugation from E33–45 core samples from the BX Tank Farm (Table 4.2). The pore waters from this location had been influenced by the disposal of BiPO4 metal wastes, and subsequent waste-sediment reaction. Hence, the associated compositions were somewhat outside the ranges described above for “natural conditions.” These chemical analyses were subjected to speciation calculations with the MINTEQA2 code using the reactions in Table 4.1 to yield the computed distribution of species in Table 4.3. These species are consistent with expectations from Figures 4.1 and 4.2, given differences in pH and Ca2+ concentration.
Given the importance of aqueous speciation to reactive transport, documenting the dominant aqueous species by analysis and verifying of the overall thermodynamic model is important. Such verification is not easy and is performed by various spectroscopic techniques. This confirmation need only be performed occasionally when the system speciation is indicated by calculation to have changed dramatically. An example of such verification for Hanford pore water was performed by Wang et al. (2004) using Cryogenic Laser-Induced Fluorescence Spectroscopy (CLIFS) measurements on the pore waters analyzed in Table 4.2 (e.g., E33-45-55A and 61A). This technique is sensitive to the molecular environment of U(VI) at aqueous concentrations as low as 10-7 mol/L U(VI)TOT. These authors carefully created a series of standard solutions, in which only one important U(VI) species was present in overwhelming concentration compared to others. The sample temperature was then decreased to 4°–6ºK and laser-excited at 375 nm. Each complex yielded distinct “fingerprint” spectra in terms of spectral maxima (Figure 4.3) and derived-vibronic parameters (not shown, see Wang et. al, 2004) that could be used for the identification of aqueous-complex predominance in a mixture (e.g., a natural water with a distribution of complexes).
Table 4.2. Uranyl and Major Chemical Components (M) in BX-102 Pore-Water Samples.
Component BX-102 53A BX-102 61A BX-102 67B UO2
2+ 7.69x10⁻⁴ 2.48x10⁻³ 1.633x10⁻³ K+ 1.64x10⁻³ 1.30x10⁻³ 1.506x10⁻³ Na+ 1.04x10⁻¹ 2.18x10⁻¹ 1.753x10⁻¹ Ca2+ 1.48x10⁻³ 6.66x10⁻⁴ 1.592x10⁻³ Mg2+ 7.86x10⁻⁴ 4.77x10⁻⁵ 2.475x10⁻⁴ Fe3+ 7.74x10⁻⁴ 1.79x10⁻⁴ 7.896x10⁻⁴ Al3+ 1.56x10⁻³ 4.34x10⁻⁴ 1.560x10⁻³ Cl- 6.20x10⁻⁴ 8.05x10⁻⁴ 1.521x10⁻³ NO3
- 1.71x10⁻² 1.80x10⁻² 3.851x10⁻² SO4
2- 4.90x10⁻³ 8.88x10⁻³ 1.853x10⁻² PO4
3- bd* 4.12x10⁻³ bd* H4SiO4 1.52x10⁻² 1.15x10⁻² 1.467x10⁻² Inorganic C 6.75x10⁻² 1.12x10⁻¹ 7.720x10⁻² pH 8.59 8.99 8.87
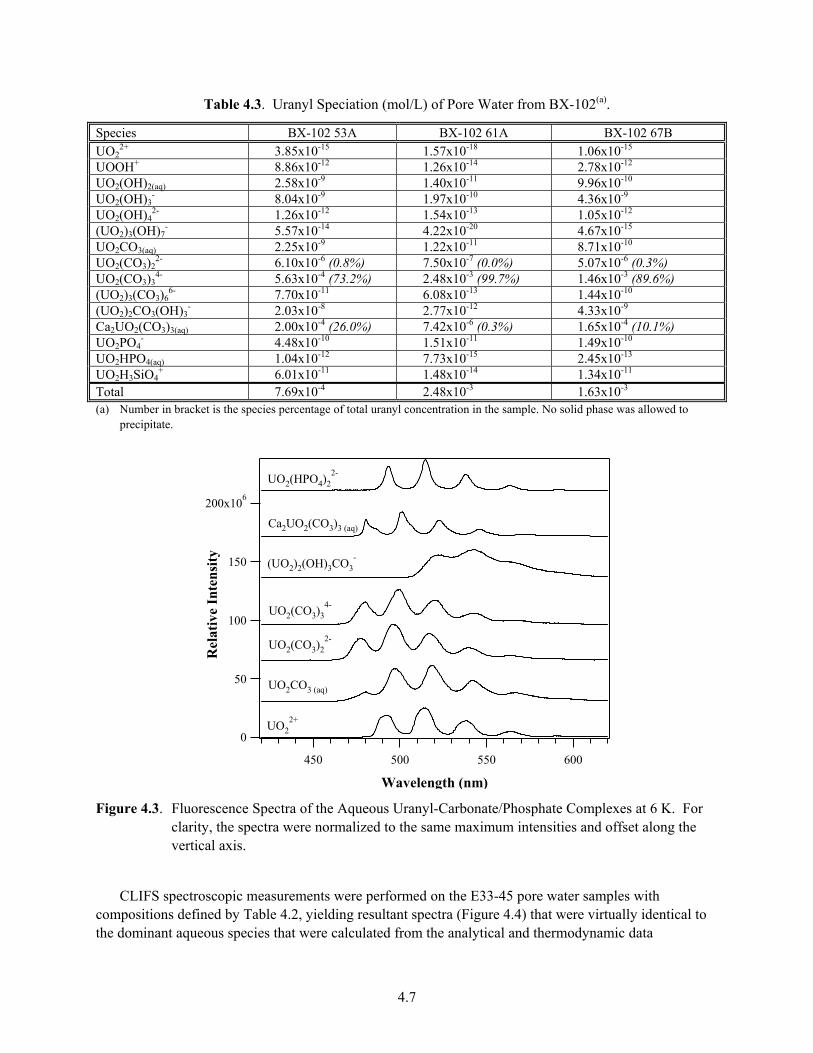
4.7
Table 4.3. Uranyl Speciation (mol/L) of Pore Water from BX-102(a).
Species BX-102 53A BX-102 61A BX-102 67B UO2
2+ 3.85x10⁻¹⁵ 1.57x10⁻¹⁸ 1.06x10⁻¹⁵ UOOH+ 8.86x10⁻¹² 1.26x10⁻¹⁴ 2.78x10⁻¹² UO2(OH)2(aq) 2.58x10⁻⁹ 1.40x10⁻¹¹ 9.96x10⁻¹⁰ UO2(OH)3
- 8.04x10⁻⁹ 1.97x10⁻¹⁰ 4.36x10⁻⁹ UO2(OH)4
2- 1.26x10⁻¹² 1.54x10⁻¹³ 1.05x10⁻¹² (UO2)3(OH)7
- 5.57x10⁻¹⁴ 4.22x10⁻²⁰ 4.67x10⁻¹⁵ UO2CO3(aq) 2.25x10⁻⁹ 1.22x10⁻¹¹ 8.71x10⁻¹⁰ UO2(CO3)2
2- 6.10x10⁻⁶ (0.8%) 7.50x10⁻⁷ (0.0%) 5.07x10⁻⁶ (0.3%) UO2(CO3)3
4- 5.63x10⁻⁴ (73.2%) 2.48x10⁻³ (99.7%) 1.46x10⁻³ (89.6%) (UO2)3(CO3)6
6- 7.70x10⁻¹¹ 6.08x10⁻¹³ 1.44x10⁻¹⁰ (UO2)2CO3(OH)3
- 2.03x10⁻⁸ 2.77x10⁻¹² 4.33x10⁻⁹ Ca2UO2(CO3)3(aq) 2.00x10⁻⁴ (26.0%) 7.42x10⁻⁶ (0.3%) 1.65x10⁻⁴ (10.1%) UO2PO4
- 4.48x10⁻¹⁰ 1.51x10⁻¹¹ 1.49x10⁻¹⁰ UO2HPO4(aq) 1.04x10⁻¹² 7.73x10⁻¹⁵ 2.45x10⁻¹³ UO2H3SiO4
+ 6.01x10⁻¹¹ 1.48x10⁻¹⁴ 1.34x10⁻¹¹ Total 7.69x10⁻⁴ 2.48x10⁻³ 1.63x10⁻³ (a) Number in bracket is the species percentage of total uranyl concentration in the sample. No solid phase was allowed to
precipitate.
200x106
150
100
50
0
Rel
ativ
e In
tens
ity
600550500450
Wavelength (nm)
UO22+
UO2(CO3)22-
UO2(CO3)34-
(UO2)2(OH)3CO3-
Ca2UO2(CO3)3 (aq)
UO2CO3 (aq)
UO2(HPO4)22-
Figure 4.3. Fluorescence Spectra of the Aqueous Uranyl-Carbonate/Phosphate Complexes at 6 K. For
clarity, the spectra were normalized to the same maximum intensities and offset along the vertical axis.
CLIFS spectroscopic measurements were performed on the E33-45 pore water samples with compositions defined by Table 4.2, yielding resultant spectra (Figure 4.4) that were virtually identical to the dominant aqueous species that were calculated from the analytical and thermodynamic data
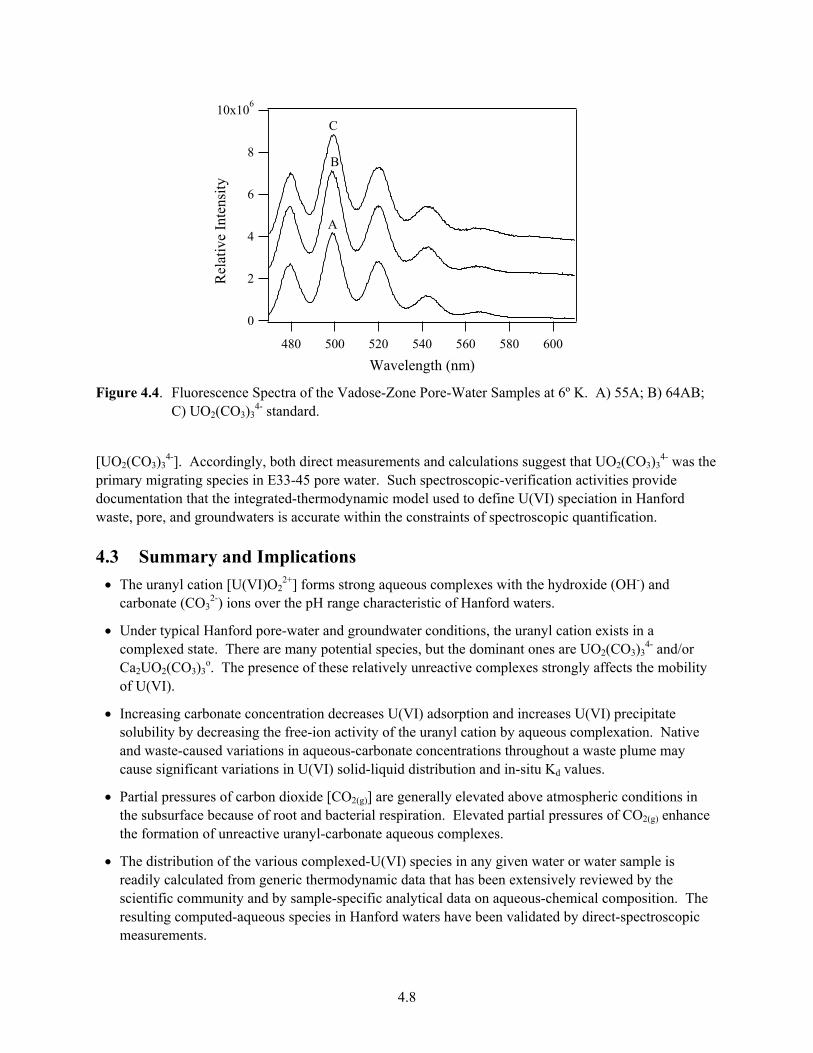
4.8
10x106
8
6
4
2
0
Rel
ativ
e In
tens
ity
600580560540520500480
Wavelength (nm)
A
B
C
Figure 4.4. Fluorescence Spectra of the Vadose-Zone Pore-Water Samples at 6º K. A) 55A; B) 64AB;
C) UO2(CO3)34- standard.
[UO2(CO3)34-]. Accordingly, both direct measurements and calculations suggest that UO2(CO3)3
4- was the primary migrating species in E33-45 pore water. Such spectroscopic-verification activities provide documentation that the integrated-thermodynamic model used to define U(VI) speciation in Hanford waste, pore, and groundwaters is accurate within the constraints of spectroscopic quantification. 4.3 Summary and Implications
• The uranyl cation [U(VI)O22+] forms strong aqueous complexes with the hydroxide (OH-) and
carbonate (CO32-) ions over the pH range characteristic of Hanford waters.
• Under typical Hanford pore-water and groundwater conditions, the uranyl cation exists in a complexed state. There are many potential species, but the dominant ones are UO2(CO3)3
4- and/or Ca2UO2(CO3)3
o. The presence of these relatively unreactive complexes strongly affects the mobility of U(VI).
• Increasing carbonate concentration decreases U(VI) adsorption and increases U(VI) precipitate solubility by decreasing the free-ion activity of the uranyl cation by aqueous complexation. Native and waste-caused variations in aqueous-carbonate concentrations throughout a waste plume may cause significant variations in U(VI) solid-liquid distribution and in-situ Kd values.
• Partial pressures of carbon dioxide [CO2(g)] are generally elevated above atmospheric conditions in the subsurface because of root and bacterial respiration. Elevated partial pressures of CO2(g) enhance the formation of unreactive uranyl-carbonate aqueous complexes.
• The distribution of the various complexed-U(VI) species in any given water or water sample is readily calculated from generic thermodynamic data that has been extensively reviewed by the scientific community and by sample-specific analytical data on aqueous-chemical composition. The resulting computed-aqueous species in Hanford waters have been validated by direct-spectroscopic measurements.

5.1
5.0 Empirical Distribution Coefficients
This section discusses the use of empirical distribution coefficients, Kd, to quantify the interactions of dissolved U(VI) at mineral-water interfaces, and tabulates available U(VI)-Kd values for Hanford. This tabulation focuses solely on U(VI) because it is the most-dominant valence form of uranium found in solution in Hanford’s subsurface. In addition, background information is provided on the derivation of Kd, and guidance given on the use of the Kd construct, especially in light of concerns regarding the applicability the Kd approach in performance and risk assessments (Bethke and Brady 2000 and Section 11). The chapter begins with a discussion of the Kd construct and the ongoing “controversy” over the applicability of the constant-Kd approach for modeling the future migration of uranium at Hanford. Subsequent sections tabulate Kd values for Hanford subsurface sediments and describe the influence of solution parameters (e.g., pH, dissolved ligands, competing cations, and U(VI) concentrations) and solid-phase properties (e.g., mineral types, specific surface areas, or particle size) on their value.
5.1 The Kd Construct
The goal of performance and risk assessments is to quantitatively assess the retention of contaminants in different environmental compartments encountered from source to receptors. The compositions of both pore water and solid phases for any given locale can only be determined to a limited range of certainty because of analytical variance, sample heterogeneity, and sampling access. Although challenging, estimating potential future conditions is necessary. The usual approach is to define a reference case or scenario, and to predict contaminant fate and transport for this specific case. Once an initial reference case has been generated, alternative scenarios (i.e., “what ifs”) are posed and predictions are performed, either deterministically or probabilistically [for examples see Kincaid et. al. (2000); Mann et al. (2001; 2003a; b), and DOE/ORP (2006)].
Quantitative contaminant-transport modeling relies on using computer codes to perform the performance or risk assessments. Through the use of the computer codes, the assessor seeks to integrate groundwater flow with retardation of contaminants caused by fluid-sediment interactions. To this end, computer codes should be capable of predicting spatial and temporal variations in the distribution of contaminants. The typical approach is to establish parameters describing fluid-solute/contaminant-sediment interactions based on data from the literature. Preferably, however, the parameters are defined based on site-specific measurements. Contaminant interactions may consist of competitive adsorption-desorption, multi-component ion exchange, and precipitation-dissolution reactions. Some models consider these reactions separately. However, a common approach is to incorporate all of these “sorption” reactions into one Kd value to describe the distribution of a solute or contaminant between the fluid and solid phase. Sorption, as expressed by Kd values, is normalized by mass, not volume (used by transport modelers) or surface area (used by surface chemists). It is also important to note that Kd is not applicable to precipitation or dissolution and is valid only for adsorption and ion-exchange reactions under limiting and unchanging conditions. Unfortunately, some risk assessments have ignored these limitations.
Contaminant-transport modelers commonly use Kd values to account for all chemical interactions between the contaminant and all potential solid absorbents along the flow path, such as the sediment, soil, waste form, and engineered materials. The Kd value is used to quantify the retardation factor (Rf,
5.2
unitless), which is the ratio of the average linear velocity of water (υw, m/s) divided by the average linear velocity of the contaminant (υc, m/s). For water-saturated systems, the Kd value is related to the Rf by the bulk density (ρb, g/cm) and the porosity (η, cm3/cm3) as follows (Valocchi 1984; Bower 1991):
⎟⎟⎠
⎞⎜⎜⎝
⎛+==
ηρK
1υυ
R bd
c
wf (5.1)
The bulk density and porosity terms in Equation 5.1 convert the mass-normalized Kd value into a volume-normalized unitless value. For partially saturated sediments, such as in the Hanford vadose zone, the porosity term, η, is replaced by the volumetric-water content (θv, cm3 of water/cm3 of porous media) of the sediments. The retardation factor consequently increases with decreasing water content even as Kd
remains constant.
The retardation factor is a term found in the classical advective-dispersion equation used in almost all transport codes that facilitate the performance or risk assessments for reactive contaminants [e.g., see Kincaid et. al. (2000); Mann et al. (2001; 2003a, b); DOE/ORP (2006)]. Equation 5.2 is the advective-dispersion equation for one-dimensional flow of a reactive contaminant
fw2
2
RxCυ
xCD
tC
÷⎟⎟⎠
⎞⎜⎜⎝
⎛∂∂
−∂∂
=∂∂ (5.2)
where C = aqueous contaminant concentration (mass/length3)
D = hydrodynamic dispersion coefficient (length2/time)
V = average pore-water velocity (length/time).
For an adsorption reaction between a contaminant and sediment, Kd represents the sum of all adsorbed-contaminant species divided by the sum of all aqueous-contaminant species. Using U(VI) as an example, the definition of the theoretical Kd construct for a common system can be formulated. Assuming the system has circumneutral pH, dissolved carbonate controlled by atmospheric CO2, and calcium as the major dissolved cation, the major dissolved U species would include UO2(CO3)3
4-, CaUO2(CO3)3
2-, and Ca2UO2(CO3)30 (see Section 4 for discussion of Hanford-relevant U(VI)-aqueous
speciation). For the sake of example, only one surface-adsorption site is assumed, X≡, which is capable of forming surface complexes with multiple dissolved U(VI) species (Equation 5.3):
03322
-2332
4332
03322
-2332
4332
ltheoreticad,)(COUO)(COUO)(UO
)(COUOX)(COUOX)(UOXSpeciesUDissolvedSpeciesUAdsorbed
KCaCaCO
CaCaCO++
≡+≡+≡== −
−
∑∑ (5.3)
The numerator and denominator in Equation 5.3 are summed over all dissolved- and adsorbed-contaminant species on different reactive surfaces. More than one sorbent site-type is expected in a soil or sediment because of the presence of numerous minerals and coatings, each with potentially different sorption properties. Unlike shown in Equation 5.3, the adsorbed species need not be the same as the dominant solution species—the preferred surface species vary with both sorbate and surface. The aqueous species that adsorb are typically those with unfilled ligation spheres, and/or structural attributes
5.3
conducive to surface bonding in mono- or bidentate fashion. These surface species are often identified spectroscopically (e.g., Chisholm-Brause et al. 2004; Kowal-Fouchard et al. 2004) and calculated with surface-complexation models (SCM) (Davis and Kent 1990; Zachara and Westall 1998). The “empirical” Kd equation becomes (Equation 5.4):
[ ][ ]entsemass
solutionvolumesolutioninVIUtotalsorbedVIUtotal
dim)()(
empiricald,K ⎥⎦
⎤⎢⎣
⎡= (5.4)
In an attempt to distinguish Kd,theroretical from Kd,empirical, researchers, especially in Europe, referred to the latter term as Rd (e.g., Bradbury and Sarott 1995). This term is rarely used any longer, and Kd,empirical is referred to simply as Kd in this report and in nearly all the waste-management literature.
Therefore, in its simplest construct, the Kd value is the ratio of the contaminant concentration sorbed to the solid phase, divided by the contaminant concentration in the liquid surrounding the solid phase (Equation 5.5):
liquid
solidd C
CK = (5.5)
where Csolid (mol/g) and Cliquid (mol/mL) are the concentrations of the contaminant in the solid and liquid phases at equilibrium, respectively. The distribution coefficient (Kd) is a commonly used measurement of solid-liquid distribution in the environmental-science literature. This measurement is highly sensitive to experimental and mineralogic factors that control sorption, (adsorption or precipitation unspecified) and its magnitude is often graphed as a function of, or correlated with, the magnitude of these factors to establish conceptual models of retardation processes (see for example, Zachara et al. 1995a; b). This measurement is accepted for these purposes, and this practice will be followed in Section 6 to evaluate the extent of solid-liquid distribution in contaminant plumes. At issue is whether a single value of Kd can be used under any circumstance to semi-quantitatively describe solid-liquid distribution along a subsurface-flow path during a performance assessment where significant natural spatial variability in physical and chemical parameters inevitably occurs (see for example, Brady and Bethke 2000).
In order to place the Kd concept and its criticisms into some perspective, it is useful to view a hypothetical contaminant-partitioning curve for a generic, sorbing, ionic, inorganic contaminant such as U(VI) (Figure 5.1). The system is closed and there is no water advection. Figure 5.1 depicts the equilibrium distribution of contaminant between the liquid and solid phase as the contaminant concentration increases in the aqueous or liquid phase. The assumption, for argument, is that pH, ionic strength, and the distribution of competitive solutes remain constant over the plot domain. In the environment, however, conditions are more complex. Liquid concentration increases to the right, while solid concentration increases toward the page top. At low liquid concentration, the contaminant or sorbate is adsorbed by the mineral phase through ion exchange or surface complexation reactions. Over a range of low aqueous concentrations, the adsorption reaction may define a linear distribution curve with constant slope (or adsorption isotherm) between liquid and solid. This region of the isotherm is termed the Henry’s law region, and its slope is Kd (e.g., S=KdC). The concentration range for the Henry’s law region may be extensive for soils or sediments that have a significant total adsorption site concentration

5.4
Solid
(S, m
ol/g
)
Liquid (C, mol/L)
adsorption
precipitation
surface precipitation
site saturation
Henry’s law
Figure 5.1. Hypothetical equilibrium contaminant partitioning curve for a generic, Sorbing inorganic
contaminant. The curve is determined by adsorption at low concentration and precipitation at high concentration. At each concentration point Kd = S/C. Kd exhibits constant value for the Henry’s law region of adsorption only.
and one primary sorbent. In contrast, the concentration range may be quite small for soils or sediments that have low total site concentrations and a mixture of active adsorbents with different properties and individual site concentrations. The slope of the Henry’s law region invariably lessens as adsorption sites become filled or saturated, and Kd for this region decreases in comparison to that for the Henry’s law domain. Increasing sorbate concentrations above those that cause site saturation may result in surface precipitation and then homogeneous precipitation of a discrete contaminant-bearing solid phase (e.g., Na-boltwoodite or metatorbernite, Section 8). Precipitation causes the slope of the distribution curve to increase toward verticality. At verticality, the liquid concentration is fixed by the solubility of the precipitated phase as defined by the equilibrium ion-activity product. Additional contaminant inputs to the system do not increase the aqueous concentration, but lead to further precipitation and enrichment of the solid phase. It is readily seen that under conditions of surface precipitation and homogeneous precipitation, there is no extended region of constant Kd values. In fact, Kd is different in value at each unique concentration point. Moreover, Kd increases dramatically for precipitation as solid phase concentrations increase.
Any performance assessment modeling that seeks to compute contaminant attenuation by a sorption process (e.g., adsorption or precipitation) using Kd must take these considerations in mind. It is clear that Kd is a valid descriptor of adsorption in Henry’s law, or linear region of the isotherm, if geochemical and mineralogic conditions do not change or vary along the modeled flowpath. It is also clear that Kd is not, and cannot be an appropriate descriptor of sorption if the Henry’s law adsorption region exhibits minimal concentration range, or if precipitation/dissolution is occurring. The argument, therefore, is that Kd be used to describe U(VI) solid-liquid distribution in performance-assessment models only for those conditions where Henry’s law adsorption behavior is observed and documented.

5.5
Another limitation of Kd,empirical is that it describes solid-liquid distribution for a specified set of conditions. When correctly applied, it describes adsorption for a specific contaminant onto a particular solid adsorbent with fixed properties (e.g., cation-exchange capacity, clay content, soil organic matter, etc.) in contact with an aqueous solution of defined composition. Among the reasons for selecting the “empirical” Kd construct, as exemplified by Equation 5.5, for fate and transport prediction are
• a large literature base exists on Kd values for radionuclide sorption (although many of these may include unspecified contributions from precipitation)
• under dilute low-contamination concentrations, adsorption can be independent of contaminant concentration as described above, and Kd may be presumed to be constant with fixed geochemical, textural, and mineralogic properties
• the Kd can be used directly in all performance-assessment transport codes, and is , for this reason, easy and tractable.
5.2 Variable Kd versus Constant Value Kd
By using site-specific materials, namely sediments and soils or engineered materials, such as cement, concrete, grout, and/or steel liners, and pore water or groundwater from disposal areas, it is possible to directly gather relevant adsorption data and negate the need to rely on extrapolation from other sediment and aqueous systems reported in the literature. Until recently, the thermodynamic-species-based approach to sorption description (Equation 5.3) has been a research as opposed to an applied practice (see for example, Davis and Kent 1990). Modeling the adsorption process in mineralogically complex sediments, can be a multifaceted endeavor, requiring a significant database and many assumptions (see Zachara and Westall, 1998).
However, significant progress has been made over the past 10 years in the application of more complex adsorption models (e.g., the surface-complexation model) to soils and sediments (Turner et al. 1996; Davis et al. 1998; Zachara and Westall 1998; Prikryl et al. 2001; Arnold et al. 2001; Curtis et al. 2004; Davis et al. 2004a; Barnett et al. 2002), leading to the use of these codes and associated application approaches for radionuclide-performance assessment (Turner and Pabalan 1999; Davis et al. 2005). Moreover, such codes have been applied to describe U(VI) groundwater-contaminant-plume dynamics associated with uranium-mill tailings (Curtis et al. 2006), and are, therefore, applicable to field-scale migration processes. In addition, mechanistic models and sorption data collected in an appropriate fashion provide the necessary paradigms upon which technically defensible “empirical” Kd values can be defended. For most of the Kd data used in Hanford Site performance and risk assessments, sorption experiments have been conducted with site-specific sediment and groundwater, or simulated vadose-zone pore water spiked with appropriate levels of contaminants, or with actual waste-form leachates. By performing such empirical laboratory experiments in a systematic fashion, the necessary parameters to populate a more robust adsorption model can be developed (Section 9).
Kinetics is an important variable that is often not considered in the empirical Kd construct. Adsorption equilibrium will not be attained if the contact time between the solution and the sediment is limited by hydrologic and physical factors (e.g., preferential flow through fractures or diffusion into intra-grain fractures and micropores). In this case, modeling with equilibrium Kd values will overestimate the degree of adsorption. An excellent example of this situation for U(VI) is provided by Qafoku et al. (2005) using sediment from the South Process Pond in the 300 Area (316-1). These non-equilibrium processes are further described in Section 10.

5.6
The Kd approach can be made more defensible if complementary information is developed on the chemical nature or mechanism of the retardation process, and the range of sorbate concentrations and other variables over which linear partitioning or distribution is observed. When used in conventional performance-assessment calculations, Kd is taken to represent an equilibrium sorption site (mechanism unspecified) that exhibits linear partitioning and is reversible to aqueous-concentration change caused by fluid advection. If appropriate care is not taken in choosing the range of variables used in the laboratory measurements, the resulting Kd may reflect not only adsorption (specific/inner sphere, or non-specific/outer sphere) and ion-exchange reactions, but also absorption and varying degrees of co-precipitation or precipitation. The single most important task for estimating and choosing appropriate Kd values for performance and risk-assessment activities is the identification of the important processes that govern radionuclide-chemical behavior. Once the dominant geochemical process(es) is identified for a specific geological and chemical environment, the range of relevant “empirical” Kd values can be narrowed. Radionuclide-geochemical processes have been determined primarily through experiments in which a key parameter is systematically varied ( e.g., pH or contaminant concentration), and where sorption products are identified using spectroscopic and microscopic techniques (e.g., Arai et al. 2007). The solid-liquid distribution trends and associated reaction-product identifications displayed during these experiments provide key information regarding contaminant behavior, and also shed light on controlling processes over different parameter ranges. The complex geochemistry of U(VI), however, sometimes makes it difficult to determine whether adsorption/surface complexation or precipitation/dissolution dominates the sorption process (Bond et al. 2007).
The Kd is assumed to be at equilibrium and reversible in most performance-assessment modeling. This is not always valid. For example, desorption-Kd values are frequently higher than adsorption-Kd values (Um et al. 2004; Um et al. 2007a). Phase changes on or within the sediment over extended contact periods or subsequent surface precipitation are examples of chemical alterations that could lead to slow desorption and, thus, higher desorption Kd values. In addition to chemical effects, physical processes, such as diffusion, can be important. Contaminants can diffuse through micropores within sediment grains over time to redistribute to adsorption sites that were not initially accessible. This can result in a slow increase in Kd values over time and higher desorption-Kd values (see Liu et al. 2003). Diffusion of dissolved uranium into micro-fractures in sediment grains and precipitation of discrete uranium phases was a key process that sequestered uranium in the vadose zone after the BX-102 Tank overfill event in 1951—see Sections 8 and 10, McKinely et al. (2006), and Serne et al. (2002a) for more discussion.
To recap, the constant-Kd model is generally applicable when the contaminant of concern is present at low concentrations and the geochemical environment being modeled does not exhibit spatial or temporal variations in aqueous chemistry, mineralogy, or sediment texture. This general statement requires that the contaminant concentration is not so large as to cause adsorption-isotherm non-linearity as a result of surface saturation or precipitation. In addition, the concentration of other constituents, including the proton (H+) and potentially competitive or complexing anions (CO3
2-, H3SiO4-, PO4
3-) or cations (Ca2+, Mg2+, etc.) must remain constant. At the Hanford Site, geochemical conditions are such that the sorption traits of U(VI) are extraordinarily sensitive to pH, total dissolved carbonate, calcium, and uranium concentrations. Thus, for all but qualitative performance and risk assessments, fate and transport calculations for U(VI) based on more rigorous sorption models than the constant Kd is recommended. However, for completeness and with some resignation that performance assessments will continue to be performed at Hanford using the constant Kd approach, the authors tabulated the available values and offered ideas on using spatially variable geologic (i.e., stratigraphic layers) and waste-sediment impact
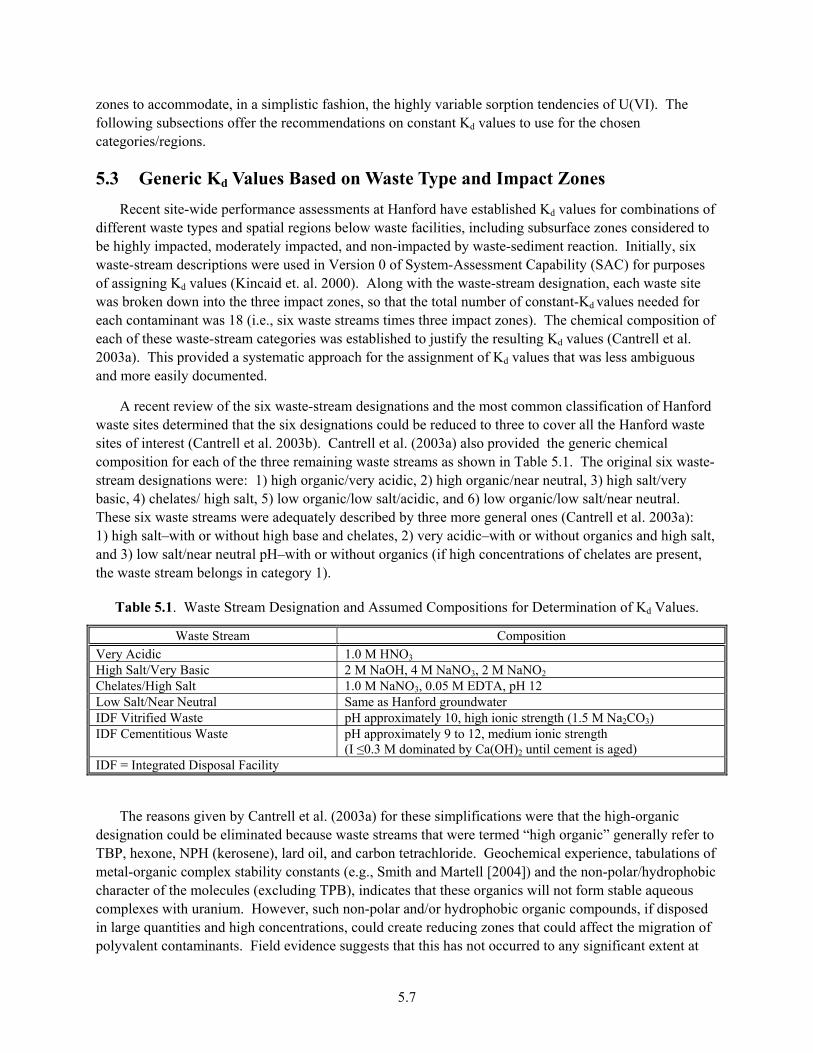
5.7
zones to accommodate, in a simplistic fashion, the highly variable sorption tendencies of U(VI). The following subsections offer the recommendations on constant Kd values to use for the chosen categories/regions.
5.3 Generic Kd Values Based on Waste Type and Impact Zones Recent site-wide performance assessments at Hanford have established Kd values for combinations of
different waste types and spatial regions below waste facilities, including subsurface zones considered to be highly impacted, moderately impacted, and non-impacted by waste-sediment reaction. Initially, six waste-stream descriptions were used in Version 0 of System-Assessment Capability (SAC) for purposes of assigning Kd values (Kincaid et. al. 2000). Along with the waste-stream designation, each waste site was broken down into the three impact zones, so that the total number of constant-Kd values needed for each contaminant was 18 (i.e., six waste streams times three impact zones). The chemical composition of each of these waste-stream categories was established to justify the resulting Kd values (Cantrell et al. 2003a). This provided a systematic approach for the assignment of Kd values that was less ambiguous and more easily documented.
A recent review of the six waste-stream designations and the most common classification of Hanford waste sites determined that the six designations could be reduced to three to cover all the Hanford waste sites of interest (Cantrell et al. 2003b). Cantrell et al. (2003a) also provided the generic chemical composition for each of the three remaining waste streams as shown in Table 5.1. The original six waste-stream designations were: 1) high organic/very acidic, 2) high organic/near neutral, 3) high salt/very basic, 4) chelates/ high salt, 5) low organic/low salt/acidic, and 6) low organic/low salt/near neutral. These six waste streams were adequately described by three more general ones (Cantrell et al. 2003a): 1) high salt–with or without high base and chelates, 2) very acidic–with or without organics and high salt, and 3) low salt/near neutral pH–with or without organics (if high concentrations of chelates are present, the waste stream belongs in category 1).
Table 5.1. Waste Stream Designation and Assumed Compositions for Determination of Kd Values.
Waste Stream Composition Very Acidic 1.0 M HNO3 High Salt/Very Basic 2 M NaOH, 4 M NaNO3, 2 M NaNO2 Chelates/High Salt 1.0 M NaNO3, 0.05 M EDTA, pH 12 Low Salt/Near Neutral Same as Hanford groundwater IDF Vitrified Waste pH approximately 10, high ionic strength (1.5 M Na2CO3) IDF Cementitious Waste pH approximately 9 to 12, medium ionic strength
(I ≤0.3 M dominated by Ca(OH)2 until cement is aged) IDF = Integrated Disposal Facility
The reasons given by Cantrell et al. (2003a) for these simplifications were that the high-organic designation could be eliminated because waste streams that were termed “high organic” generally refer to TBP, hexone, NPH (kerosene), lard oil, and carbon tetrachloride. Geochemical experience, tabulations of metal-organic complex stability constants (e.g., Smith and Martell [2004]) and the non-polar/hydrophobic character of the molecules (excluding TPB), indicates that these organics will not form stable aqueous complexes with uranium. However, such non-polar and/or hydrophobic organic compounds, if disposed in large quantities and high concentrations, could create reducing zones that could affect the migration of polyvalent contaminants. Field evidence suggests that this has not occurred to any significant extent at

5.8
the Hanford Site (see Serne and Wood 1990 and references therein). There is also no evidence of organic-complexing agent impacts on radionuclide mobility beyond several hundred meters at other nuclear waste sites (Serne et al. 1990; 1995).
Because waste streams that are not strongly acidic are neutralized rapidly by waste-sediment reaction, the acidic waste stream was combined with the near-neutral waste stream. The chelates/high-salt category was simplified to just high salt because the effect of high salt is generally greater than that of the chelating agents, and chelating agents were released at a relatively small number of sites. Chelating agents are only capable of mobilizing radionuclides and metals when they are present at high concentration. In addition, the chelates themselves can adsorb on adsorbents. These arguments are supported by Kd measurements made in the presence of ethylenediaminetetraacetic acid (EDTA) and other chelating agents (Cantrell et al. 2003a; Serne et al. 2002c).
Unfortunately, the assignment of Kd values for the very acidic waste stream was problematic. At Hanford, it is believed that the only very acidic waste streams to be disposed were at U-Plant and Z-Plant. The waste sites believed to have received very acidic waste are trenches 216-U-1, 216-U-2, U-8, U-12, 216-Z1A, 216-Z9, and possibly 216-U-171. Some of these sites contain significant inventory of U (Section 3). Due to a relatively wide range in pH values of the disposed acidic wastes and a lack of information on the relative amounts of wastes for a particular pH value, appropriate Kd values for this waste category, and the above disposal facilities in particular are difficult to estimate.
The current tabulation of Kd values for the different waste categories and impact zones were presented in Last et al. (2006), and further modified by Cantrell et al. (2007) to include Integrated Disposal Facility (IDF) waste streams and impact zones beneath the facility (Table 5.2). These values are considered most probable for each waste type and impact level. The upper portion of Table 5.2 presents the U(VI) Kd values for the various waste categories and the high- and intermediate-impact zones. Because some sediments below Hanford waste facilities consist of coarse, gravel-dominated material, a separate category is provided for these regions. Kd values for gravel-dominated sediments are, in general, not directly measured in the laboratory because it is standard soil-chemistry convention to remove particles >2 mm before characterization. The fact that that gravel particles exhibit low contaminant sorption affinity because of small surface area is generally accepted. More discussion on gravel corrections can be found in Cantrell et al. (2007) and Krupka et al. (2004) and references therein. The bottom of Table 5.2 lists U(VI) Kd values for Hanford sediments that have not been impacted by waste-sediment reaction. Both vadose-zone and aquifer sediments are assumed to exhibit comparable sorptivity for U(VI).
In some cases, the U(VI) Kd estimates in Table 5.2 were based on limited available data that were not of commensurate quality or quantity as those of other waste-chemistry/source categories. In addition, these compartmentalized Kd values do not account for future changes in chemical conditions that could occur as the impact zones evolve, and such changes could significantly impact Kd values. Finally, these compartmentalized Kd values should be considered as generic Hanford Kd values for use in the absence of disposal facility site-specific data.
1 In August 2006, while digging near 618-2 facility, north of 300 Area, sediment acidic-pH values and yellow-orange staining
was observed in sediments several meters above the shallow water table. This suggests the presence of some acidic-waste disposal or interactions after disposal/burial.

5.9
Table 5.2. Kd Ranges for U(VI) by Waste Chemistry/Source Category.
High Impact Intermediate Impact–Sand Intermediate Impact–Gravel Kd Estimate (mL/g) Kd Estimate (mL/g) Kd Estimate (mL/g)
Waste Category Best Min Max Best Min Max Best Min Max
Very Acidic 0.2 0 4 0.8 0.2 4 0.08 0.02 0.4 Very High Salt/Very Basic 0.8 0.2 4 0.8 0.2 4 0.08 0.02 0.4 Chelates/High Salts 0.2 0 4 0.8 0.2 4 0.08 0.02 0.4 Low Organic/Low Salt/Near Neutral
0.8 0.2 4 0.8 0.2 4 0.08 0.02 0.4
IDF Vitrified Waste 0.2 0 800 0.2 0 500 0.2 0.02 5 IDF Cementitious Waste 100 70 250 1 0.1 4 1 0.01 7
No Impact Zone for All Waste Chemistry/Source Categories Kd Estimate (mL/g)
Best Min Max No Impact Zone 0.8 0.2 4
5.10
More details on the laboratory measurements from which the U(VI) Kd values found in Table 5.2 were chosen can be found in a Hanford computerized database (known as the Hanford Virtual Library) at http://vlprod.rl.gov/vlib/app/index.cfm. Access to the virtual library for non-Hanford persons may require obtaining a password from an administrator—at the time of the creation of this report, the administrator is Bill Webber of the Fluor Hanford Company. The database lists the measured Kd value, along with details on the Hanford Site sediment, actual or simulated groundwater or waste solution used, equilibration times, solution-to-solid ratios, and other pertinent details. In general, the database is dominated by adsorption studies onto Hanford Site sediments from the upper vadose zone in contact with simulated Hanford groundwater. However, there are a few studies that employed more saline solutions representative of disposed waste streams, simulated mildly acidic waste streams, and less-saline solutions representative of Columbia River water.
5.4 Case Studies of Different Hanford Disposal Sites
Over the past 30 years, field studies at specific waste sites and/or laboratory studies using sediment (contaminated or uncontaminated) from Hanford disposal facilities or leak events have been performed. For some of the laboratory studies, actual or simulated groundwater, solid-waste leachate, or facility-specific waste streams have been used to determine adsorption or desorption Kd values for U(VI). Many of the measurements discussed in Section 5.3 used uncontaminated Hanford Site sediments taken from convenient locations or sediments collected offsite, but of the same lithology as found below the Hanford facilities of interest. These “generic” sediments were used in laboratory studies, wherein simulated groundwater or simplified simulated-waste liquids spiked with uranium were contacted with the uncontaminated sediments to measure adsorption Kd or, less frequently, retardation factors directly from flow-through column experiments.
At the single-shell tank farms, many of the largest known leak events have been characterized by drilling boreholes through vadose-zone contaminant plumes (see Section 6). Both intact core and grab samples of the contaminated sediments have been obtained. Using two aliquots of the contaminated sediments, a strong acid extract (generally 3 to 5 g 8 M nitric acid per g of sediment) and a deionized water extract (1 g of total water [existing pore water plus deionized water] per g of sediment) were performed to determine in-situ Kd values for U(VI). The calculation assumes that the acid extract removes sorbed and aqueous-phase U(VI). The water extract is assumed to remove pore water U(VI) without change. From knowledge of the sediment moisture content, the concentration of U(VI) and all other solutes in the extant pore water can be estimated, assuming that the water extract does not 1) dissolve precipitated solids, 2) remove exchangeable or adsorbed species from the solids, or 3) induce other chemical changes, such as re-adsorption. These are significant uncertainties associated with the estimation of pore-water composition, some of which were discussed by Liu et al. (2004b) and McKinley et al. (2007). The acid-extracted mass removed from the sediment is then corrected by subtracting the estimated solute mass in pore water to obtain the mass of contaminant “sorbed” to the sediment. From knowledge of the starting mass of sediment in the acid extract, the concentration of sorbed contaminant can be calculated. The in-situ Kd value is calculated from Equation 5.4.
Adsorption and desorption U(VI) Kd values for various 300 Area sediments (including uncontaminated vadose-zone and aquifer sediments, and contaminated vadose-zone sediments collected from beneath the North and South Process Ponds) display a large range of results (Sections 6 and 9). These variations are exemplified by the U(VI)-adsorption isotherms in Figure 5.2 on <2-mm,
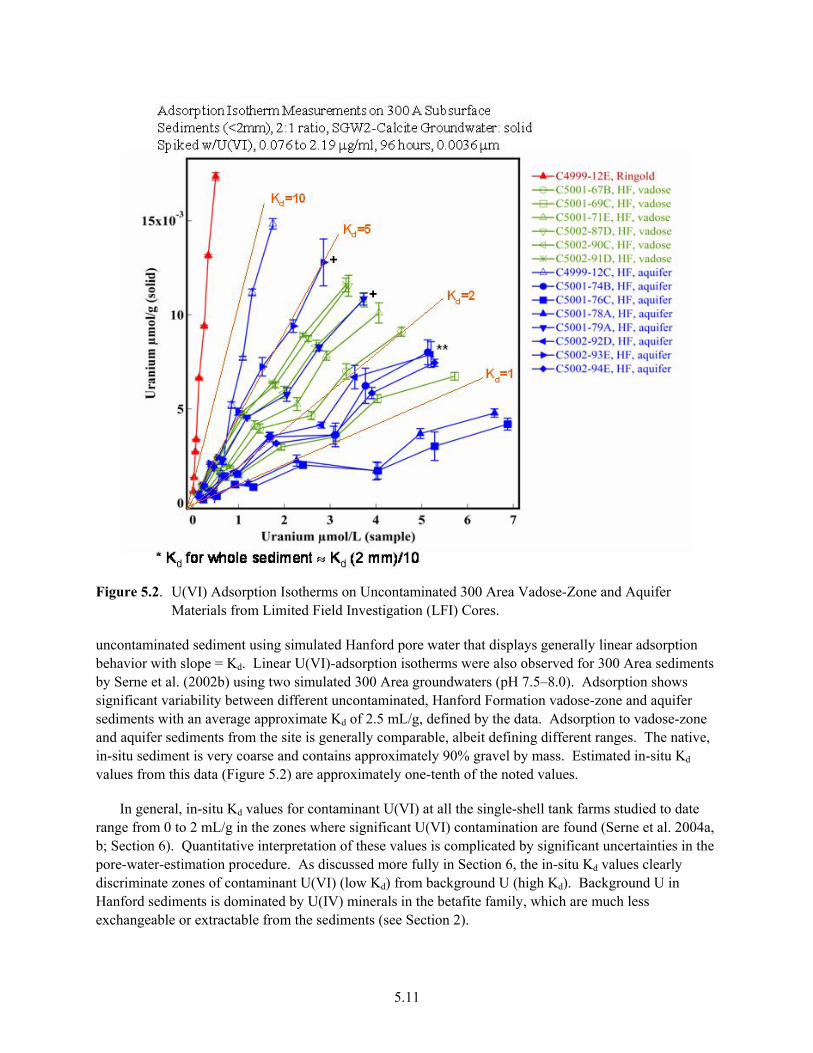
5.11
Figure 5.2. U(VI) Adsorption Isotherms on Uncontaminated 300 Area Vadose-Zone and Aquifer
Materials from Limited Field Investigation (LFI) Cores.
uncontaminated sediment using simulated Hanford pore water that displays generally linear adsorption behavior with slope = Kd. Linear U(VI)-adsorption isotherms were also observed for 300 Area sediments by Serne et al. (2002b) using two simulated 300 Area groundwaters (pH 7.5–8.0). Adsorption shows significant variability between different uncontaminated, Hanford Formation vadose-zone and aquifer sediments with an average approximate Kd of 2.5 mL/g, defined by the data. Adsorption to vadose-zone and aquifer sediments from the site is generally comparable, albeit defining different ranges. The native, in-situ sediment is very coarse and contains approximately 90% gravel by mass. Estimated in-situ Kd values from this data (Figure 5.2) are approximately one-tenth of the noted values.
In general, in-situ Kd values for contaminant U(VI) at all the single-shell tank farms studied to date range from 0 to 2 mL/g in the zones where significant U(VI) contamination are found (Serne et al. 2004a, b; Section 6). Quantitative interpretation of these values is complicated by significant uncertainties in the pore-water-estimation procedure. As discussed more fully in Section 6, the in-situ Kd values clearly discriminate zones of contaminant U(VI) (low Kd) from background U (high Kd). Background U in Hanford sediments is dominated by U(IV) minerals in the betafite family, which are much less exchangeable or extractable from the sediments (see Section 2).
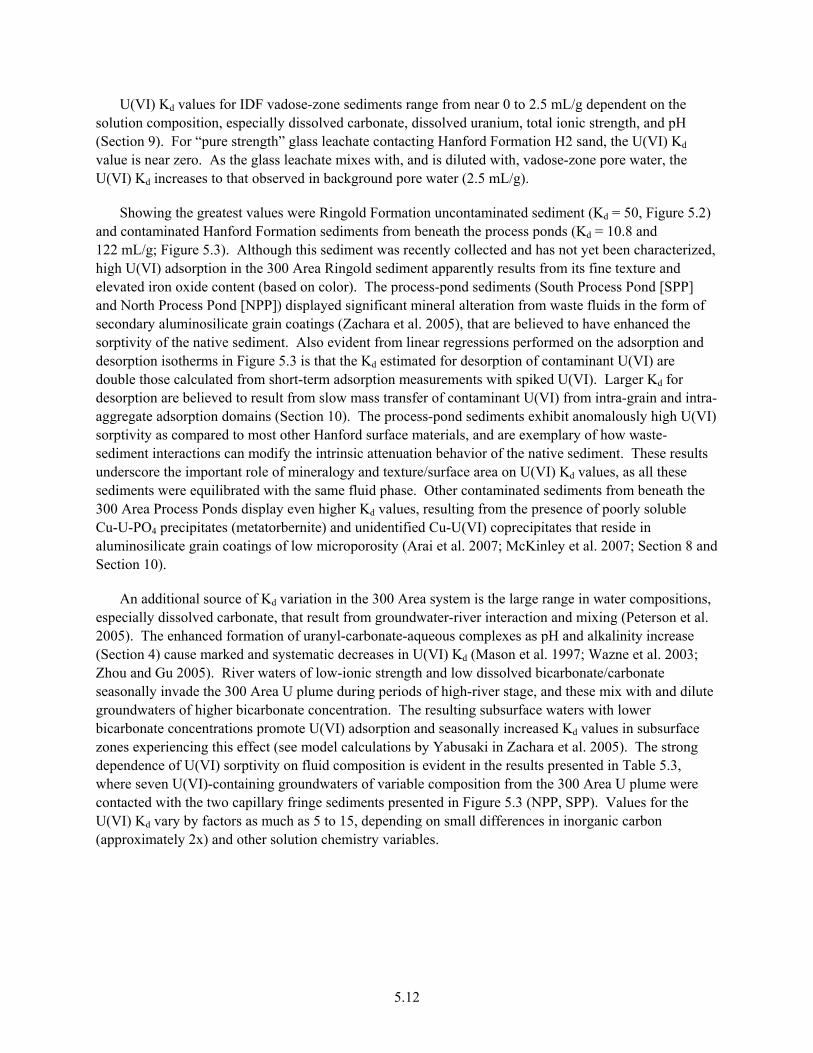
5.12
U(VI) Kd values for IDF vadose-zone sediments range from near 0 to 2.5 mL/g dependent on the solution composition, especially dissolved carbonate, dissolved uranium, total ionic strength, and pH (Section 9). For “pure strength” glass leachate contacting Hanford Formation H2 sand, the U(VI) Kd value is near zero. As the glass leachate mixes with, and is diluted with, vadose-zone pore water, the U(VI) Kd increases to that observed in background pore water (2.5 mL/g).
Showing the greatest values were Ringold Formation uncontaminated sediment (Kd = 50, Figure 5.2) and contaminated Hanford Formation sediments from beneath the process ponds (Kd = 10.8 and 122 mL/g; Figure 5.3). Although this sediment was recently collected and has not yet been characterized, high U(VI) adsorption in the 300 Area Ringold sediment apparently results from its fine texture and elevated iron oxide content (based on color). The process-pond sediments (South Process Pond [SPP] and North Process Pond [NPP]) displayed significant mineral alteration from waste fluids in the form of secondary aluminosilicate grain coatings (Zachara et al. 2005), that are believed to have enhanced the sorptivity of the native sediment. Also evident from linear regressions performed on the adsorption and desorption isotherms in Figure 5.3 is that the Kd estimated for desorption of contaminant U(VI) are double those calculated from short-term adsorption measurements with spiked U(VI). Larger Kd for desorption are believed to result from slow mass transfer of contaminant U(VI) from intra-grain and intra-aggregate adsorption domains (Section 10). The process-pond sediments exhibit anomalously high U(VI) sorptivity as compared to most other Hanford surface materials, and are exemplary of how waste-sediment interactions can modify the intrinsic attenuation behavior of the native sediment. These results underscore the important role of mineralogy and texture/surface area on U(VI) Kd values, as all these sediments were equilibrated with the same fluid phase. Other contaminated sediments from beneath the 300 Area Process Ponds display even higher Kd values, resulting from the presence of poorly soluble Cu-U-PO4 precipitates (metatorbernite) and unidentified Cu-U(VI) coprecipitates that reside in aluminosilicate grain coatings of low microporosity (Arai et al. 2007; McKinley et al. 2007; Section 8 and Section 10).
An additional source of Kd variation in the 300 Area system is the large range in water compositions, especially dissolved carbonate, that result from groundwater-river interaction and mixing (Peterson et al. 2005). The enhanced formation of uranyl-carbonate-aqueous complexes as pH and alkalinity increase (Section 4) cause marked and systematic decreases in U(VI) Kd (Mason et al. 1997; Wazne et al. 2003; Zhou and Gu 2005). River waters of low-ionic strength and low dissolved bicarbonate/carbonate seasonally invade the 300 Area U plume during periods of high-river stage, and these mix with and dilute groundwaters of higher bicarbonate concentration. The resulting subsurface waters with lower bicarbonate concentrations promote U(VI) adsorption and seasonally increased Kd values in subsurface zones experiencing this effect (see model calculations by Yabusaki in Zachara et al. 2005). The strong dependence of U(VI) sorptivity on fluid composition is evident in the results presented in Table 5.3, where seven U(VI)-containing groundwaters of variable composition from the 300 Area U plume were contacted with the two capillary fringe sediments presented in Figure 5.3 (NPP, SPP). Values for the U(VI) Kd vary by factors as much as 5 to 15, depending on small differences in inorganic carbon (approximately 2x) and other solution chemistry variables.
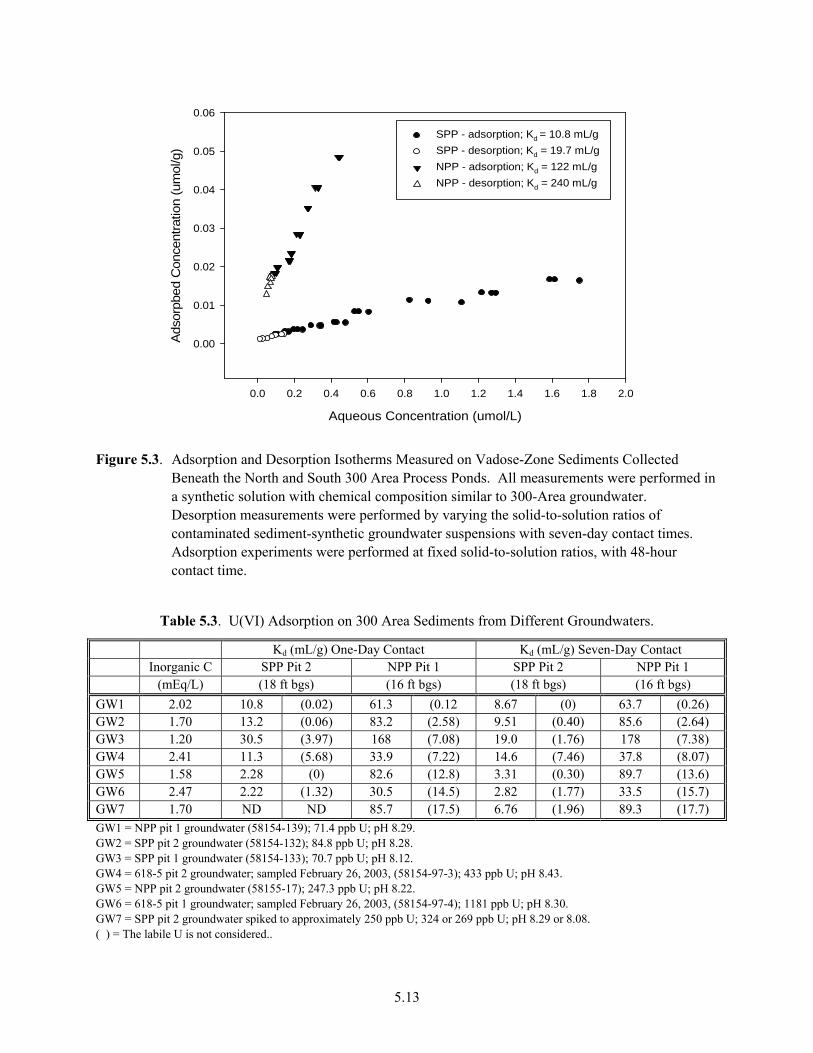
5.13
Aqueous Concentration (umol/L)
0.0 0.2 0.4 0.6 0.8 1.0 1.2 1.4 1.6 1.8 2.0
Ads
orpb
ed C
once
ntra
tion
(um
ol/g
)
0.00
0.01
0.02
0.03
0.04
0.05
0.06
SPP - adsorption; Kd = 10.8 mL/gSPP - desorption; Kd = 19.7 mL/g NPP - adsorption; Kd = 122 mL/gNPP - desorption; Kd = 240 mL/g
Figure 5.3. Adsorption and Desorption Isotherms Measured on Vadose-Zone Sediments Collected
Beneath the North and South 300 Area Process Ponds. All measurements were performed in a synthetic solution with chemical composition similar to 300-Area groundwater. Desorption measurements were performed by varying the solid-to-solution ratios of contaminated sediment-synthetic groundwater suspensions with seven-day contact times. Adsorption experiments were performed at fixed solid-to-solution ratios, with 48-hour contact time.
Table 5.3. U(VI) Adsorption on 300 Area Sediments from Different Groundwaters.
Kd (mL/g) One-Day Contact Kd (mL/g) Seven-Day Contact Inorganic C SPP Pit 2 NPP Pit 1 SPP Pit 2 NPP Pit 1 (mEq/L) (18 ft bgs) (16 ft bgs) (18 ft bgs) (16 ft bgs) GW1 2.02 10.8 (0.02) 61.3 (0.12 8.67 (0) 63.7 (0.26) GW2 1.70 13.2 (0.06) 83.2 (2.58) 9.51 (0.40) 85.6 (2.64) GW3 1.20 30.5 (3.97) 168 (7.08) 19.0 (1.76) 178 (7.38) GW4 2.41 11.3 (5.68) 33.9 (7.22) 14.6 (7.46) 37.8 (8.07) GW5 1.58 2.28 (0) 82.6 (12.8) 3.31 (0.30) 89.7 (13.6) GW6 2.47 2.22 (1.32) 30.5 (14.5) 2.82 (1.77) 33.5 (15.7) GW7 1.70 ND ND 85.7 (17.5) 6.76 (1.96) 89.3 (17.7) GW1 = NPP pit 1 groundwater (58154-139); 71.4 ppb U; pH 8.29. GW2 = SPP pit 2 groundwater (58154-132); 84.8 ppb U; pH 8.28. GW3 = SPP pit 1 groundwater (58154-133); 70.7 ppb U; pH 8.12. GW4 = 618-5 pit 2 groundwater; sampled February 26, 2003, (58154-97-3); 433 ppb U; pH 8.43. GW5 = NPP pit 2 groundwater (58155-17); 247.3 ppb U; pH 8.22. GW6 = 618-5 pit 1 groundwater; sampled February 26, 2003, (58154-97-4); 1181 ppb U; pH 8.30. GW7 = SPP pit 2 groundwater spiked to approximately 250 ppb U; 324 or 269 ppb U; pH 8.29 or 8.08. ( ) = The labile U is not considered..
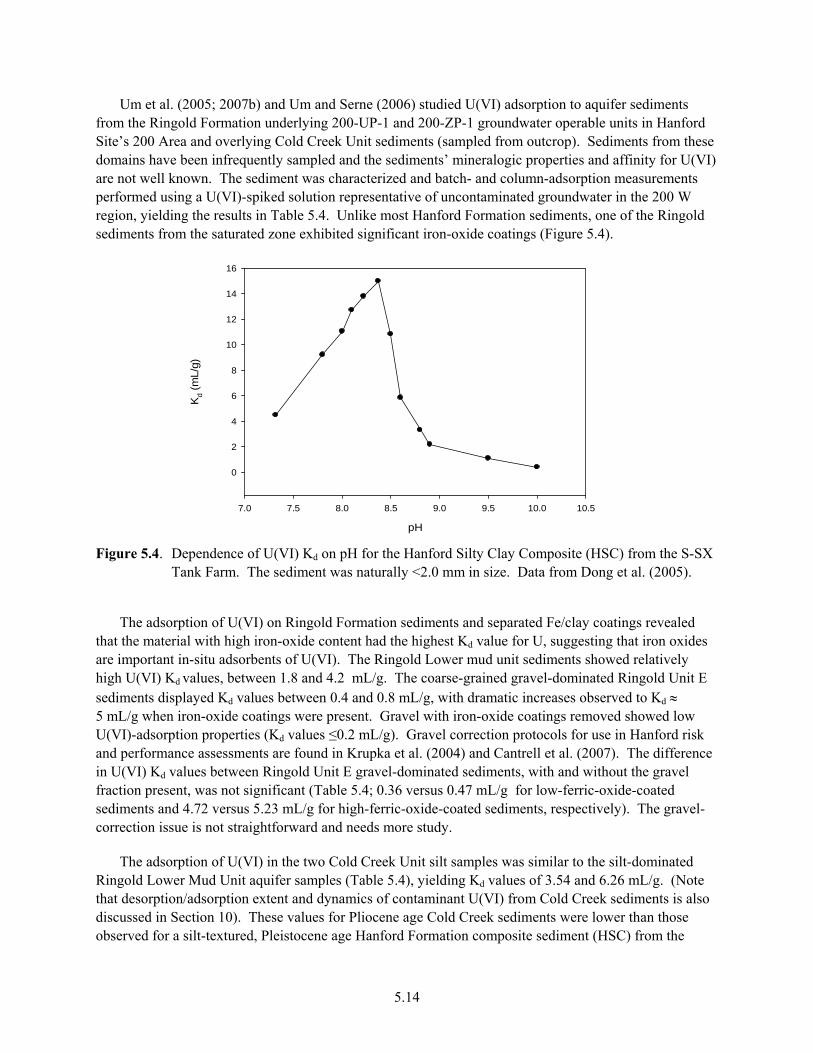
5.14
Um et al. (2005; 2007b) and Um and Serne (2006) studied U(VI) adsorption to aquifer sediments from the Ringold Formation underlying 200-UP-1 and 200-ZP-1 groundwater operable units in Hanford Site’s 200 Area and overlying Cold Creek Unit sediments (sampled from outcrop). Sediments from these domains have been infrequently sampled and the sediments’ mineralogic properties and affinity for U(VI) are not well known. The sediment was characterized and batch- and column-adsorption measurements performed using a U(VI)-spiked solution representative of uncontaminated groundwater in the 200 W region, yielding the results in Table 5.4. Unlike most Hanford Formation sediments, one of the Ringold sediments from the saturated zone exhibited significant iron-oxide coatings (Figure 5.4).
pH
7.0 7.5 8.0 8.5 9.0 9.5 10.0 10.5
Kd (
mL/
g)
0
2
4
6
8
10
12
14
16
Figure 5.4. Dependence of U(VI) Kd on pH for the Hanford Silty Clay Composite (HSC) from the S-SX
Tank Farm. The sediment was naturally <2.0 mm in size. Data from Dong et al. (2005).
The adsorption of U(VI) on Ringold Formation sediments and separated Fe/clay coatings revealed that the material with high iron-oxide content had the highest Kd value for U, suggesting that iron oxides are important in-situ adsorbents of U(VI). The Ringold Lower mud unit sediments showed relatively high U(VI) Kd values, between 1.8 and 4.2 mL/g. The coarse-grained gravel-dominated Ringold Unit E sediments displayed Kd values between 0.4 and 0.8 mL/g, with dramatic increases observed to Kd ≈ 5 mL/g when iron-oxide coatings were present. Gravel with iron-oxide coatings removed showed low U(VI)-adsorption properties (Kd values ≤0.2 mL/g). Gravel correction protocols for use in Hanford risk and performance assessments are found in Krupka et al. (2004) and Cantrell et al. (2007). The difference in U(VI) Kd values between Ringold Unit E gravel-dominated sediments, with and without the gravel fraction present, was not significant (Table 5.4; 0.36 versus 0.47 mL/g for low-ferric-oxide-coated sediments and 4.72 versus 5.23 mL/g for high-ferric-oxide-coated sediments, respectively). The gravel-correction issue is not straightforward and needs more study.
The adsorption of U(VI) in the two Cold Creek Unit silt samples was similar to the silt-dominated Ringold Lower Mud Unit aquifer samples (Table 5.4), yielding Kd values of 3.54 and 6.26 mL/g. (Note that desorption/adsorption extent and dynamics of contaminant U(VI) from Cold Creek sediments is also discussed in Section 10). These values for Pliocene age Cold Creek sediments were lower than those observed for a silt-textured, Pleistocene age Hanford Formation composite sediment (HSC) from the
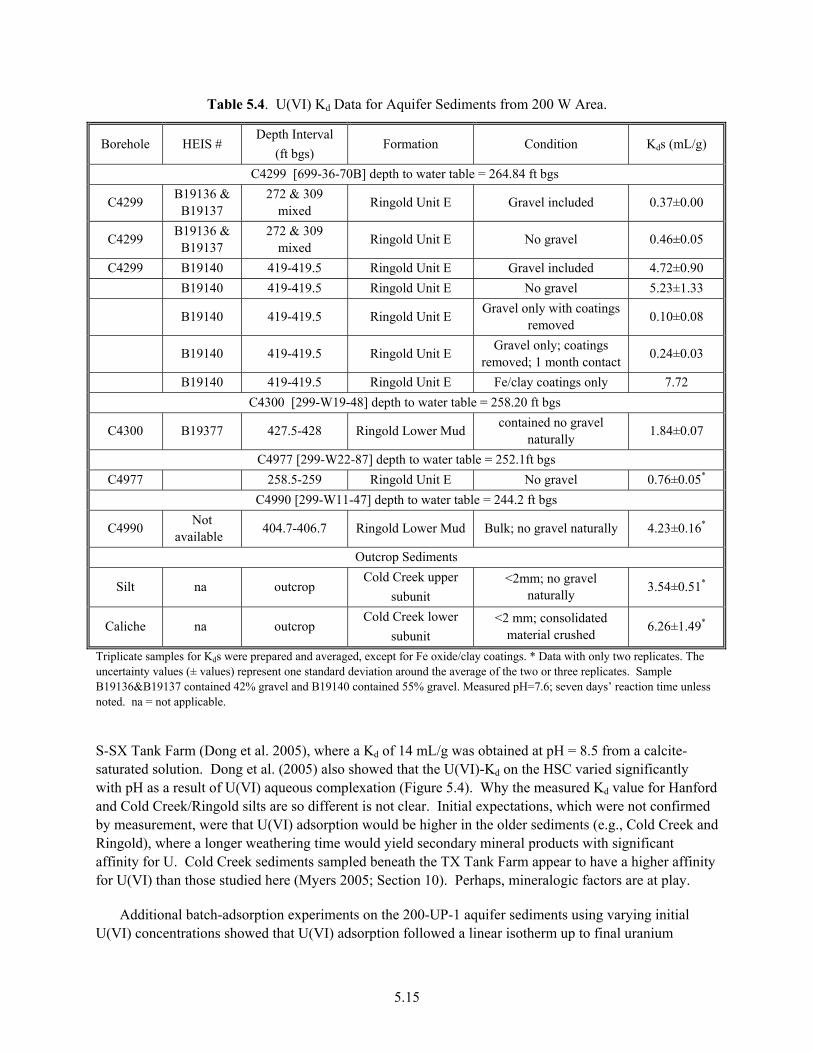
5.15
Table 5.4. U(VI) Kd Data for Aquifer Sediments from 200 W Area.
Borehole HEIS # Depth Interval
(ft bgs) Formation Condition Kds (mL/g)
C4299 [699-36-70B] depth to water table = 264.84 ft bgs
C4299 B19136 & B19137
272 & 309 mixed Ringold Unit E Gravel included 0.37±0.00
C4299 B19136 & B19137
272 & 309 mixed Ringold Unit E No gravel 0.46±0.05
C4299 B19140 419-419.5 Ringold Unit E Gravel included 4.72±0.90 B19140 419-419.5 Ringold Unit E No gravel 5.23±1.33
B19140 419-419.5 Ringold Unit E Gravel only with coatings removed 0.10±0.08
B19140 419-419.5 Ringold Unit E Gravel only; coatings removed; 1 month contact 0.24±0.03
B19140 419-419.5 Ringold Unit E Fe/clay coatings only 7.72 C4300 [299-W19-48] depth to water table = 258.20 ft bgs
C4300 B19377 427.5-428 Ringold Lower Mud contained no gravel naturally 1.84±0.07
C4977 [299-W22-87] depth to water table = 252.1ft bgs C4977 258.5-259 Ringold Unit E No gravel 0.76±0.05*
C4990 [299-W11-47] depth to water table = 244.2 ft bgs
C4990 Not available 404.7-406.7 Ringold Lower Mud Bulk; no gravel naturally 4.23±0.16*
Outcrop Sediments
Silt na outcrop Cold Creek upper
subunit <2mm; no gravel
naturally 3.54±0.51*
Caliche na outcrop Cold Creek lower
subunit <2 mm; consolidated
material crushed 6.26±1.49*
Triplicate samples for Kds were prepared and averaged, except for Fe oxide/clay coatings. * Data with only two replicates. The uncertainty values (± values) represent one standard deviation around the average of the two or three replicates. Sample B19136&B19137 contained 42% gravel and B19140 contained 55% gravel. Measured pH=7.6; seven days’ reaction time unless noted. na = not applicable.
S-SX Tank Farm (Dong et al. 2005), where a Kd of 14 mL/g was obtained at pH = 8.5 from a calcite-saturated solution. Dong et al. (2005) also showed that the U(VI)-Kd on the HSC varied significantly with pH as a result of U(VI) aqueous complexation (Figure 5.4). Why the measured Kd value for Hanford and Cold Creek/Ringold silts are so different is not clear. Initial expectations, which were not confirmed by measurement, were that U(VI) adsorption would be higher in the older sediments (e.g., Cold Creek and Ringold), where a longer weathering time would yield secondary mineral products with significant affinity for U. Cold Creek sediments sampled beneath the TX Tank Farm appear to have a higher affinity for U(VI) than those studied here (Myers 2005; Section 10). Perhaps, mineralogic factors are at play.
Additional batch-adsorption experiments on the 200-UP-1 aquifer sediments using varying initial U(VI) concentrations showed that U(VI) adsorption followed a linear isotherm up to final uranium
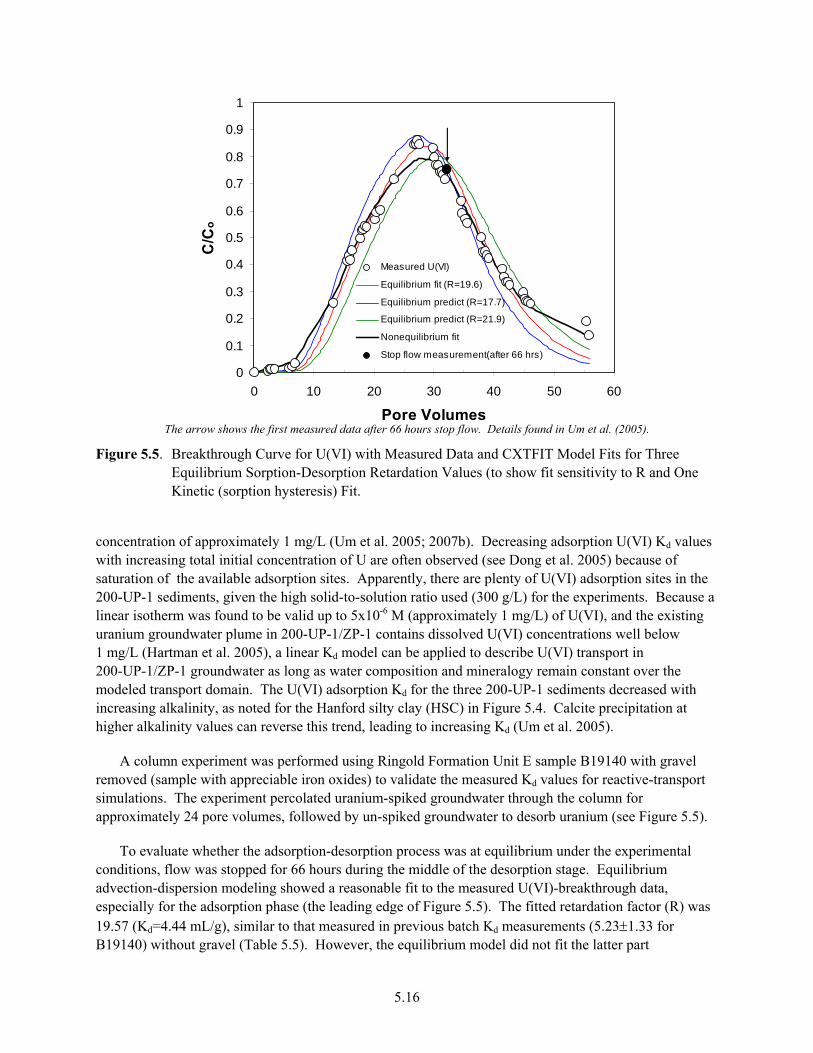
5.16
0
0.1
0.2
0.3
0.4
0.5
0.6
0.7
0.8
0.9
1
0 10 20 30 40 50 60
Pore Volumes
C/C
o
Measured U(VI)
Equilibrium fit (R=19.6)
Equilibrium predict (R=17.7)
Equilibrium predict (R=21.9)
Nonequilibrium fit
Stop flow measurement(after 66 hrs)
The arrow shows the first measured data after 66 hours stop flow. Details found in Um et al. (2005).
Figure 5.5. Breakthrough Curve for U(VI) with Measured Data and CXTFIT Model Fits for Three Equilibrium Sorption-Desorption Retardation Values (to show fit sensitivity to R and One Kinetic (sorption hysteresis) Fit.
concentration of approximately 1 mg/L (Um et al. 2005; 2007b). Decreasing adsorption U(VI) Kd values with increasing total initial concentration of U are often observed (see Dong et al. 2005) because of saturation of the available adsorption sites. Apparently, there are plenty of U(VI) adsorption sites in the 200-UP-1 sediments, given the high solid-to-solution ratio used (300 g/L) for the experiments. Because a linear isotherm was found to be valid up to 5x10⁻⁶ M (approximately 1 mg/L) of U(VI), and the existing uranium groundwater plume in 200-UP-1/ZP-1 contains dissolved U(VI) concentrations well below 1 mg/L (Hartman et al. 2005), a linear Kd model can be applied to describe U(VI) transport in 200-UP-1/ZP-1 groundwater as long as water composition and mineralogy remain constant over the modeled transport domain. The U(VI) adsorption Kd for the three 200-UP-1 sediments decreased with increasing alkalinity, as noted for the Hanford silty clay (HSC) in Figure 5.4. Calcite precipitation at higher alkalinity values can reverse this trend, leading to increasing Kd (Um et al. 2005).
A column experiment was performed using Ringold Formation Unit E sample B19140 with gravel removed (sample with appreciable iron oxides) to validate the measured Kd values for reactive-transport simulations. The experiment percolated uranium-spiked groundwater through the column for approximately 24 pore volumes, followed by un-spiked groundwater to desorb uranium (see Figure 5.5).
To evaluate whether the adsorption-desorption process was at equilibrium under the experimental conditions, flow was stopped for 66 hours during the middle of the desorption stage. Equilibrium advection-dispersion modeling showed a reasonable fit to the measured U(VI)-breakthrough data, especially for the adsorption phase (the leading edge of Figure 5.5). The fitted retardation factor (R) was 19.57 (Kd=4.44 mL/g), similar to that measured in previous batch Kd measurements (5.23±1.33 for B19140) without gravel (Table 5.5). However, the equilibrium model did not fit the latter part
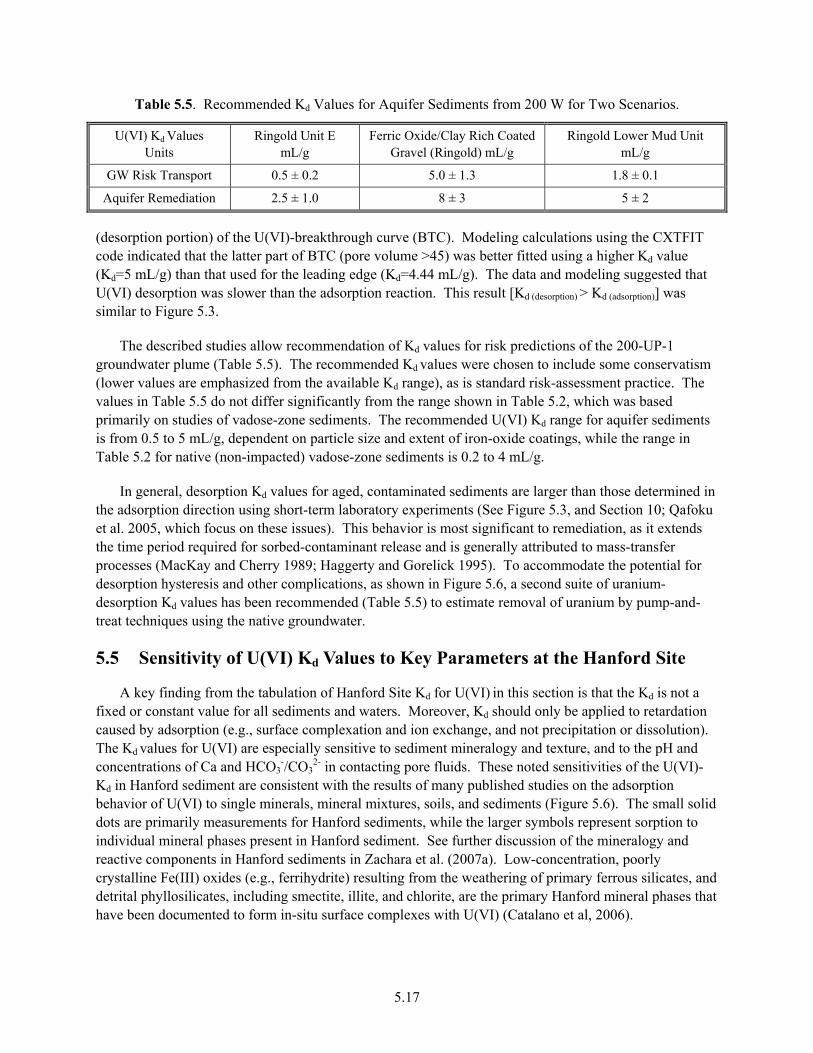
5.17
Table 5.5. Recommended Kd Values for Aquifer Sediments from 200 W for Two Scenarios.
U(VI) Kd Values Units
Ringold Unit E mL/g
Ferric Oxide/Clay Rich Coated Gravel (Ringold) mL/g
Ringold Lower Mud Unit mL/g
GW Risk Transport 0.5 ± 0.2 5.0 ± 1.3 1.8 ± 0.1
Aquifer Remediation 2.5 ± 1.0 8 ± 3 5 ± 2
(desorption portion) of the U(VI)-breakthrough curve (BTC). Modeling calculations using the CXTFIT code indicated that the latter part of BTC (pore volume >45) was better fitted using a higher Kd value (Kd=5 mL/g) than that used for the leading edge (Kd=4.44 mL/g). The data and modeling suggested that U(VI) desorption was slower than the adsorption reaction. This result [Kd (desorption) > Kd (adsorption)] was similar to Figure 5.3.
The described studies allow recommendation of Kd values for risk predictions of the 200-UP-1 groundwater plume (Table 5.5). The recommended Kd values were chosen to include some conservatism (lower values are emphasized from the available Kd range), as is standard risk-assessment practice. The values in Table 5.5 do not differ significantly from the range shown in Table 5.2, which was based primarily on studies of vadose-zone sediments. The recommended U(VI) Kd range for aquifer sediments is from 0.5 to 5 mL/g, dependent on particle size and extent of iron-oxide coatings, while the range in Table 5.2 for native (non-impacted) vadose-zone sediments is 0.2 to 4 mL/g.
In general, desorption Kd values for aged, contaminated sediments are larger than those determined in the adsorption direction using short-term laboratory experiments (See Figure 5.3, and Section 10; Qafoku et al. 2005, which focus on these issues). This behavior is most significant to remediation, as it extends the time period required for sorbed-contaminant release and is generally attributed to mass-transfer processes (MacKay and Cherry 1989; Haggerty and Gorelick 1995). To accommodate the potential for desorption hysteresis and other complications, as shown in Figure 5.6, a second suite of uranium-desorption Kd values has been recommended (Table 5.5) to estimate removal of uranium by pump-and-treat techniques using the native groundwater.
5.5 Sensitivity of U(VI) Kd Values to Key Parameters at the Hanford Site
A key finding from the tabulation of Hanford Site Kd for U(VI) in this section is that the Kd is not a fixed or constant value for all sediments and waters. Moreover, Kd should only be applied to retardation caused by adsorption (e.g., surface complexation and ion exchange, and not precipitation or dissolution). The Kd values for U(VI) are especially sensitive to sediment mineralogy and texture, and to the pH and concentrations of Ca and HCO3
-/CO32- in contacting pore fluids. These noted sensitivities of the U(VI)-
Kd in Hanford sediment are consistent with the results of many published studies on the adsorption behavior of U(VI) to single minerals, mineral mixtures, soils, and sediments (Figure 5.6). The small solid dots are primarily measurements for Hanford sediments, while the larger symbols represent sorption to individual mineral phases present in Hanford sediment. See further discussion of the mineralogy and reactive components in Hanford sediments in Zachara et al. (2007a). Low-concentration, poorly crystalline Fe(III) oxides (e.g., ferrihydrite) resulting from the weathering of primary ferrous silicates, and detrital phyllosilicates, including smectite, illite, and chlorite, are the primary Hanford mineral phases that have been documented to form in-situ surface complexes with U(VI) (Catalano et al, 2006).

5.18
Figure 5.6. Photograph of Hydrous-Oxide-Coated Ringold Formation Unit E Gravel from 200-UP-1.
The Kd shows an inverted U-shape that is caused by changes in the aqueous speciation of dissolved U(VI) and mineral surface charge as a function of pH (Figure 5.6). This curve can be different below pH = 6.0, provided phyllosilicates (smectite, illite) are present and the ionic strength is sufficiently low to allow ion exchange of the free uranyl cation (McKinley et al. 1995; Turner et al. 1996). The dominant aqueous species of U(VI) in water at equilibrium with atmospheric carbon dioxide changes from being predominately cationic at low pH, to neutral or anionic at neutral-to-basic pH values (Section 4). The surface charge on metal oxides (including ferrihydrite, quartz, and alumina) also varies from being positively charged at low pH to being negatively charged at higher pH. Thus, at low pH, the dominant U(VI) species and metal oxide surfaces are both positively charged, leading to net repulsion tendencies. The opposite behavior, attraction, holds true for phyllosilicates with fixed-negative charge, leading to significant sorption at this pH. As pH increases, the dominant U(VI) aqueous species becomes less positive, while the net surface charges on adsorbents become more negative. The result is an increase in adsorption. Finally, as the pH increases above neutrality, the dominant aqueous-U(VI) species become anionic and are repulsed by the negatively charged surfaces. This complex pH dependency to Kd is well described by surface-complexation models (SCM; Section 9) that integrate surface charging, aqueous speciation, and adsorption reactions (Waite et al. 1994; McKinley et al. 1995; Turner et al. 1996; Pabalan and Turner 1997; Pabalan et al. 1998; Payne et al. 1998).
This generalized U(VI) adsorption trend is followed at Hanford and in most subsurface sediments in equilibrium with air, Hanford subsurface environments exist in the pH range from 7.5 to 8.5, and, in the extreme, 7.5 to 10.0. This pH range falls on the steep downward-trending right-hand portion of Figures 5.4 and 5.7. The main solution parameter that controls U(VI)-aqueous speciation and adsorption at Hanford is carbonate, which is related to pH. The activity of carbonate in solution increases with

5.19
-2
-1
0
1
2
3
4
5
6
7
2 3 4 5 6 7 8 9 10 11
pH
Log
Kd (m
l/g)
Figure 5.7. Generic Plot of U(VI) Log Kd Versus Mineral Type and Solution pH. Filled circles represent
values for generic studies. Most of the data found in the Hanford Virtual Library Kd Database and other non-Hanford relevant studies from Table J.5 in EPA (1999). Open symbols (joined by dotted lines) represent Kd maximum and minimum values for ferrihydrite (open squares), kaolinite (open circles), and quartz (open triangles) taken from Waite et al. (1992). The limits for Hanford relevant maximum and minimum U(VI) Kd values are given by the “x” symbols, joined by solid lines.
increasing pH as a result of CO2(g) adsorption into the aqueous phase and its subsequent ionization to HCO3
- and CO32-. Consequently, carbonate and pH exhibit an interdependent effect on U(VI) adsorption.
A plot of log Kd - U(VI) versus dissolved carbonate would appear similar to the right-hand portion of Figure 5.6 (Section 9). Not adequately captured in Figure 5.5 is the observation that if the carbonate content of the solutions increases to the point that calcium carbonate precipitates, there is often an increase in Kd that is caused by co-precipitation (see more discussion in Sections 9 and 10.).
The trend in Kd as shown in Figure 5.7 has important implications to the initial and long-term subsurface migration behavior of certain U(VI)-containing Hanford waste streams. The pH of U(VI)-containing waste streams varied between acid and basic pH (Section 3). Under acidic and basic conditions, U(VI) is mobile (Figure 5.7), and dissolved U(VI) in these waste streams may have migrated rapidly with the waste-water front. However, waste-sediment reactions (dissolution and precipitation primarily) appear to occur relatively rapidly in Hanford sediments, which neutralize waste pH toward ambient conditions (e.g., pH = 7.5–8.5), where U(VI) is more strongly adsorbed. This change in U(VI) solid-liquid distribution during waste neutralization causes time- and space-variable U(VI) retardation behavior as plumes migrate through the vadose zone. Additionally, U(VI) becomes progressively concentrated on sediment surfaces, and more susceptible to incorporation into major ion precipitates that form as products of waste-sediment reaction and pH neutralization.
5.20
In summary, the U(VI) Kd for Hanford Site vadose-zone and aquifer sediments interacting with disposed-waste fluids, solid-waste leachates, native groundwaters, and Columbia River water can vary significantly because of high sensitivity to sediment properties and interacting water composition. The sensitivity of the U(VI) Kd to these parameters is fairly well known and quantified. However, these dependencies are not sufficiently understood to allow a priori prediction of the adsorptivity of a given Hanford-sediment facies for U(VI). Such prediction can only be accomplished if well-planned studies of Hanford sediments are performed over an appropriate range of properties with this goal in mind.
A significant challenge for performance assessment is to determine the range of environments or subsurface conditions that exist now, existed since the time of disposal, and may exist in the future. This would serve as a basis for more accurate parameter estimation and selection. An expert geochemist can help modelers to choose reasonable empirical U(VI)-Kd values to use in the assessments if these conditions or scenarios are understood,. The authors highly recommend modelers seek the input of geochemical experts, as opposed to attempting to extract U(VI) Kd values from available reports or the Hanford Virtual Library Kd database. Moreover, research described in Sections 9, 10, and 11 seeks to yield a scientifically credible modeling capability to accurately predict U(VI)-Kd, given the knowledge of sediment properties and waste or pore-fluid composition.
The most important factors controlling U(VI)-Kd in Hanford sediments are pH and dissolved inorganic carbon, as a control on U(VI)-aqueous speciation, and sediment texture and surface area, as a determinant of the total concentration of adsorption sites. Beyond these, several other aqueous- and solid-phase properties are important. Dissolved-calcium concentration, dissolved-uranium concentration, presence or absence of other inorganic ligands (phosphate, sulfate, fluoride), total ionic strength (other anions and cations, especially Mg) and the presence or absence of natural or industrial organic complexants all influence U(VI) aqueous speciation, isotherm linearity, and saturation state with respect to U(VI) minerals, thereby requiring consideration. The mineralogy of the sediment fine fraction (e.g., silt and clay) must be explicitly considered because some adsorbing phases (e.g., ferrihydrite and smectite) are more selective than others (e.g., calcite) on a site-concentration basis that is directly related to surface area.
As shown in this section, there may be small differences between the U(VI) adsorption capacity of vadose-zone sediments (generally, Hanford Formation materials that are less weathered) and aquifer sediments (generally, Ringold Formation, older, more weathered) of similar particle-size distribution. A key parameter that may cause differences between sediments is the presence of authigenic-weathering products, including Fe(III) and Mn(III/IV) oxides, aluminosilicates, and mixed Ca/Mg carbonate precipitates at relatively low concentration (e.g., <1 mass %). These secondary-mineral products result from the oxidative weathering of basaltic-lithic fragments containing relatively soluble Fe(II)- and Mn(II)- basaltic glasses; and granitic-lithic fragments with feldspars, chlorite, and serpentiniferrous phases (Zachara et al. 2007a). The authigenic phases exist in complex-physicochemical associations that are difficult to characterize, including 1) particle or grain coatings (Zachara et al. 1995a, b), 2) nanoprecipitates in intra-aggregate domains of phyllosilicates (Qafoku et al. 2005), and 3) discrete precipitates of complex and unexpected compositions and morphologies (Zachara et al. 1995a, b). Measurements performed to date have not demonstrated noticeable differences between U(VI)-Kd values for shallow-versus-deep vadose-zone sediments in the 200 Area Central Plateau. Any differences observed can be explained by differences in particle size, carbonate content, and composition of pore water within the sediments.

5.21
U(VI) Kd values found for 300 Area sediments seem to have a larger range than values for comparable sediments (both age and particle size) from the 200 Area Central Plateau. The dissolved-carbonate concentration of fluids in 300 Area sediments also range to lower values than those in the central plateau because of Columbia River influences in the 300 Area. More details on U(VI) adsorption-desorption properties of 300 Area sediments are found in Serne et al. (2002b), Zachara et al. (2005), Qafoku et al. (2005), Bond et al. (2007), and ongoing work to be published in the future. The fate of U in the 300 Area may be the most challenging uranium issue at Hanford because of the large variations in natural and waste-induced sediment weathering, the relatively wide range of dissolved-carbonate concentrations that result from seasonal Columbia River water and groundwater mixing, and the seasonal reversals of uranium adsorption-desorption that result from groundwater compositional changes.
5.6 Summary and Implications • The distribution coefficient (Kd) is used to describe solid-liquid distribution for a wide range of
environmental chemistry applications. Kd is directly related to the retardation factor and the relative velocity of a reactive solute as compared to a conservative tracer. In its most general application, the Kd can be applied to any contaminant-sediment-water system as an empirical measure of solid-liquid distribution. This approach has been taken in the analysis of field data described in Section 6.
• The distribution coefficient (Kd) is frequently used in performance-assessment transport modeling to describe attenuation by adsorption processes (ion exchange, surface complexation). The validity of this approach requires that the adsorption isotherm be linear over the modeled contaminant-concentration range, and that aqueous conditions and sediment properties do not change over the assumed domain of constant Kd. Precipitation and dissolution processes cannot be modeled by Kd in transport models because of nonconformity to a linear isotherm. As such, sorbate-mass balance cannot be maintained.
• Distribution coefficients have been frequently measured for U(VI) on Hanford Site sediments for use in transport model calculations. These adsorption and desorption Kd values represent empirical measurements of the extent of surface complexation under the specific conditions of measurement. Kd varies strongly with pH, total dissolved carbonate, and dissolved Ca2+ as a result of aqueous speciation effects, and with sediment texture, mineralogy, and surface area because of the influence on reactive surface-site concentration. This strong dependency of Kd on system geochemical parameters requires that these values, when needed for performance-assessment calculations, be carefully and intelligently selected with advice from geochemical experts.
• Under conditions where adsorption controls solid-liquid distribution, U(VI) Kd measurements from simulated vadose-zone pore water or unconfined groundwater display comparable ranges for >2.0-mm vadose zone (0.5–5 mL/g) and aquifer sediments (0.2–4 mL/g) with occasional outliers observed. Gravel-sized materials exhibit low-sorption reactivity for U(VI) and act as a diluent for the <2.0 mm materials. Fine-textured sediments with high calcite content (paleosols) or infrequent zones with high Fe(III) oxide content may exhibit Kd values well in excess of these ranges (e.g., >100 mL/g).


6.1
6.0 Lessons Learned from Field-Sampling Campaigns of Uranium Plumes
Field-sampling campaigns have been performed to collect and characterize sediments from uranium plumes associated with representative waste releases. These have included two locations in the 200 Area Tank Farms and one location in the river corridor. The four primary objectives of the characterization campaigns were to:
1. identify the type, quantity, and vertical or spatial distribution of contamination present
2. determine the physical and geological characteristics of the subsurface associated with regions of contaminant accumulation
3. establish the source(s) of the contamination found in the sediment samples
4. ascertain linkage between vadose-zone and groundwater contamination.
These characterization studies were motivated by corrective-action assessments in the 200 Area Tank Farms, and remediation-action assessments in the Columbia River Corridor. A goal of these activities was to establish improved geologic and hydrogeochemical conceptual models of characteristic Hanford waste sites that could inform future waste-management decisions.
This section will present and discuss selected results from field-sampling and characterization campaigns completed on U(VI) plumes in the 241-BX Tank Farm, the 241-TX Tank Farm, and 300-FF-5 (e.g., 316-1/2). To the extent possible, similar results will be presented for each site, including sorbed and pore water U(VI) compositions and concentrations, computed in-situ U(VI)-Kd values as an empirical measure of the strength of U(VI) sorption, and mobility relative to unretarded 99Tc(VII) to allow meaningful comparisons between sites. The authors attempt to assess the extent to which these three sites are comparable, and determine the causes for differences when observed. The results underscore the extent of variability in U(VI) mobility that can result from variations in waste composition, sediment mineralogy, subsurface geology, and pore-water and groundwater composition. Samples from these sites have been used extensively in research described in Sections 8, 9, and 10, and readers will be directed to these sections when appropriate.
6.1 241-BX Tank Farm
The 241-BX Tank Farm was constructed between 1953 and 1954, and consists of twelve 23-meter (75-feet) diameter underground tanks. These tanks had a capacity of 2,006,050 L (530,000 gallons) and were used to store tank wastes for several decades. Six of the twelve 241-BX Farm single-shell tanks are on the confirmed or assumed list of leaking tanks—BX-101, BX-102, BX-103, BX-108, BX-110, and BX-111. Of the six confirmed or assumed leaking tanks, the overfill event associated with tank BX-102 is most significant, based on the presence of high uranium activities in nearby drywells. This overfill event was categorized as the seventh-highest inventory of uranium released to the subsurface at Hanford (Section 3). To better investigate the extent of contamination in the vicinity of Tank BX-102, a vertical borehole (299-E33-45) was installed approximately 70 feet east of the tank between November 2000 and January 2001. The borehole was extended to a total depth of 260 feet below ground surface (bgs). Full details of the analyses can be found in Serne et al. (2002a).
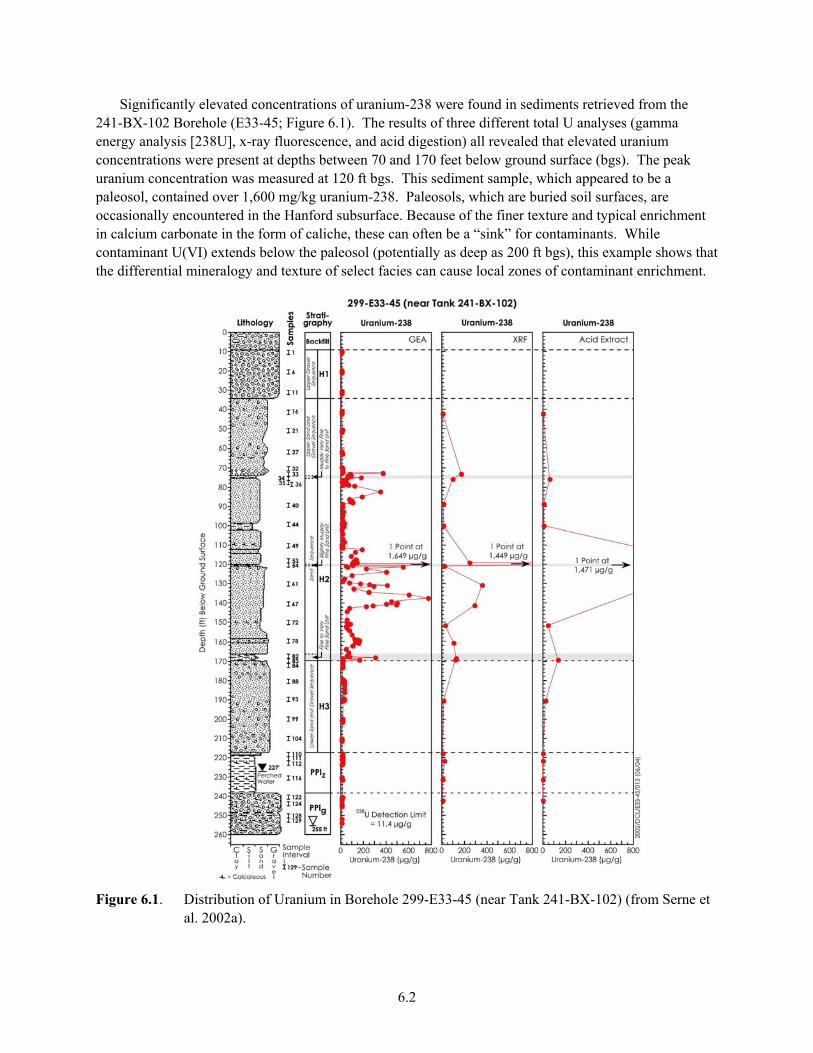
6.2
Significantly elevated concentrations of uranium-238 were found in sediments retrieved from the 241-BX-102 Borehole (E33-45; Figure 6.1). The results of three different total U analyses (gamma energy analysis [238U], x-ray fluorescence, and acid digestion) all revealed that elevated uranium concentrations were present at depths between 70 and 170 feet below ground surface (bgs). The peak uranium concentration was measured at 120 ft bgs. This sediment sample, which appeared to be a paleosol, contained over 1,600 mg/kg uranium-238. Paleosols, which are buried soil surfaces, are occasionally encountered in the Hanford subsurface. Because of the finer texture and typical enrichment in calcium carbonate in the form of caliche, these can often be a “sink” for contaminants. While contaminant U(VI) extends below the paleosol (potentially as deep as 200 ft bgs), this example shows that the differential mineralogy and texture of select facies can cause local zones of contaminant enrichment.
Figure 6.1. Distribution of Uranium in Borehole 299-E33-45 (near Tank 241-BX-102) (from Serne et
al. 2002a).

6.3
The vertical profile of contaminant U(VI) (Figure 6.1) was compared against a similar plot of technetium-99 (99Tc) contamination measured in the borehole sediments. Technetium-99 is a good reference solute because it does not adsorb to Hanford sediment, and its migration is dictated by physical factors associated with water transport and minor-anion exclusion (Kaplan and Serne 1998). Therefore, given that U(VI) and Tc-99 were co-contaminants in the 241-BX-102 waste-release event (Jones et al. 2001), a comparison of the maximum migratory distance of the two solutes will provide insight into the relative mobility of U(VI).
Quantifiable concentrations of Tc-99 were measured as deep as 231 ft bgs in sediments from Borehole E33-45 (Figure 6.2). Similar to contaminant U(VI), Tc-99 exhibited a bimodal vertical distribution. The first unequivocal indication of Tc-99 contamination occurred in the fine-grained material at 120 ft bgs. The bulk of the Tc was found in the Hanford Formation H2 middle-sand sequence, between 120 and 170 ft bgs. A second deeper and lower-concentration plume of technetium-99 was found in the Cold Creek upper subunit, between 220 and 240 ft bgs.
Figure 6.2. Distribution of Technetium-99 in Borehole 299-E33-45 (near Tank 241-BX-102) (from
Serne et al. 2002a).
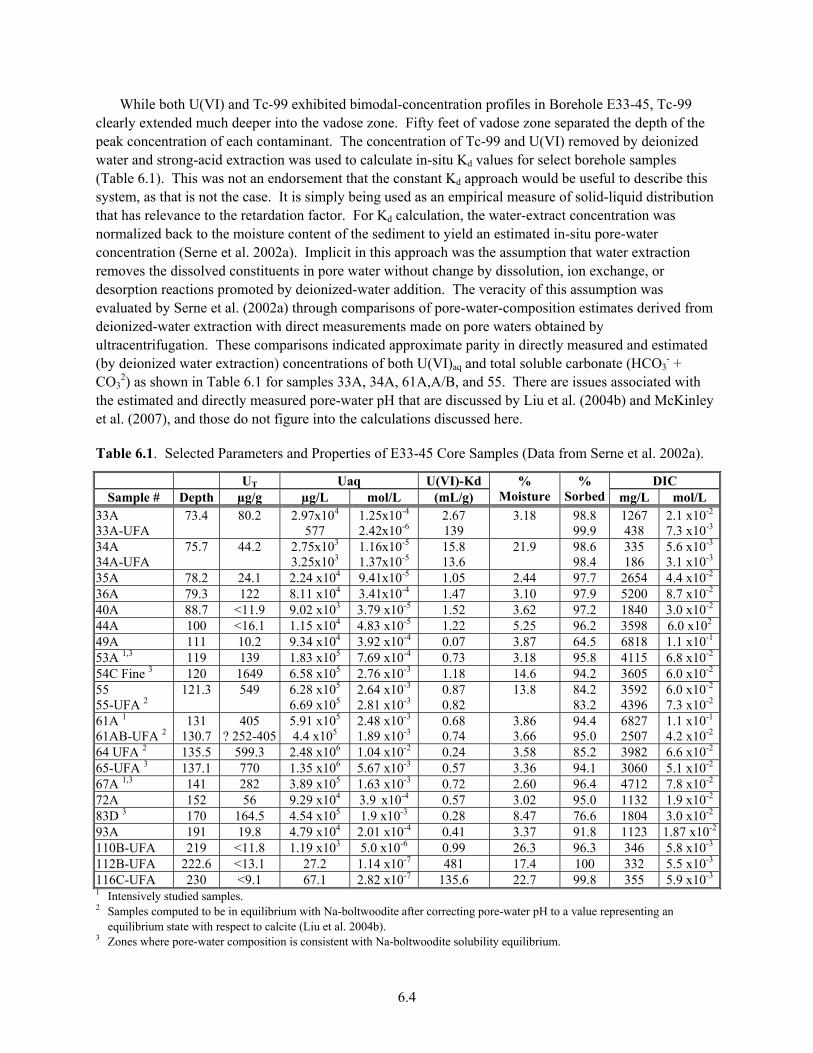
6.4
While both U(VI) and Tc-99 exhibited bimodal-concentration profiles in Borehole E33-45, Tc-99 clearly extended much deeper into the vadose zone. Fifty feet of vadose zone separated the depth of the peak concentration of each contaminant. The concentration of Tc-99 and U(VI) removed by deionized water and strong-acid extraction was used to calculate in-situ Kd values for select borehole samples (Table 6.1). This was not an endorsement that the constant Kd approach would be useful to describe this system, as that is not the case. It is simply being used as an empirical measure of solid-liquid distribution that has relevance to the retardation factor. For Kd calculation, the water-extract concentration was normalized back to the moisture content of the sediment to yield an estimated in-situ pore-water concentration (Serne et al. 2002a). Implicit in this approach was the assumption that water extraction removes the dissolved constituents in pore water without change by dissolution, ion exchange, or desorption reactions promoted by deionized-water addition. The veracity of this assumption was evaluated by Serne et al. (2002a) through comparisons of pore-water-composition estimates derived from deionized-water extraction with direct measurements made on pore waters obtained by ultracentrifugation. These comparisons indicated approximate parity in directly measured and estimated (by deionized water extraction) concentrations of both U(VI)aq and total soluble carbonate (HCO3
- + CO3
2) as shown in Table 6.1 for samples 33A, 34A, 61A,A/B, and 55. There are issues associated with the estimated and directly measured pore-water pH that are discussed by Liu et al. (2004b) and McKinley et al. (2007), and those do not figure into the calculations discussed here.
Table 6.1. Selected Parameters and Properties of E33-45 Core Samples (Data from Serne et al. 2002a).
UT Uaq U(VI)-Kd DIC Sample # Depth µg/g µg/L mol/L (mL/g)
% Moisture
% Sorbed mg/L mol/L
33A 33A-UFA
73.4 80.2 2.97x10⁴
577 1.25x10⁻⁴
2.42x10⁻⁶ 2.67 139
3.18 98.8 99.9
1267 438
2.1 x10⁻²
7.3 x10⁻³
34A 34A-UFA
75.7 44.2 2.75x10³
3.25x10³ 1.16x10⁻⁵
1.37x10⁻⁵ 15.8 13.6
21.9 98.6 98.4
335 186
5.6 x10⁻³ 3.1 x10⁻³
35A 78.2 24.1 2.24 x10⁴ 9.41x10⁻⁵ 1.05 2.44 97.7 2654 4.4 x10⁻²
36A 79.3 122 8.11 x10⁴ 3.41x10⁻⁴ 1.47 3.10 97.9 5200 8.7 x10⁻²
40A 88.7 <11.9 9.02 x10³ 3.79 x10⁻⁵ 1.52 3.62 97.2 1840 3.0 x10⁻²
44A 100 <16.1 1.15 x10⁴ 4.83 x10⁻⁵ 1.22 5.25 96.2 3598 6.0 x10² 49A 111 10.2 9.34 x10⁴ 3.92 x10⁻⁴ 0.07 3.87 64.5 6818 1.1 x10⁻¹
53A 1,3 119 139 1.83 x10⁵ 7.69 x10⁻⁴ 0.73 3.18 95.8 4115 6.8 x10⁻²
54C Fine 3 120 1649 6.58 x10⁵ 2.76 x10⁻³ 1.18 14.6 94.2 3605 6.0 x10⁻²
55 55-UFA 2
121.3 549 6.28 x10⁵
6.69 x10⁵ 2.64 x10⁻³
2.81 x10⁻³ 0.87 0.82
13.8
84.2 83.2
3592 4396
6.0 x10⁻²
7.3 x10⁻²
61A 1 61AB-UFA 2
131 130.7
405 ? 252-405
5.91 x10⁵
4.4 x10⁵ 2.48 x10⁻³
1.89 x10⁻³ 0.68 0.74
3.86 3.66
94.4 95.0
6827 2507
1.1 x10⁻¹
4.2 x10⁻²
64 UFA 2 135.5 599.3 2.48 x10⁶ 1.04 x10⁻² 0.24 3.58 85.2 3982 6.6 x10⁻²
65-UFA 3 137.1 770 1.35 x10⁶ 5.67 x10⁻³ 0.57 3.36 94.1 3060 5.1 x10⁻²
67A 1,3 141 282 3.89 x10⁵ 1.63 x10⁻³ 0.72 2.60 96.4 4712 7.8 x10⁻²
72A 152 56 9.29 x10⁴ 3.9 x10⁻⁴ 0.57 3.02 95.0 1132 1.9 x10⁻²
83D 3 170 164.5 4.54 x10⁵ 1.9 x10⁻³ 0.28 8.47 76.6 1804 3.0 x10⁻²
93A 191 19.8 4.79 x10⁴ 2.01 x10⁻⁴ 0.41 3.37 91.8 1123 1.87 x10⁻²
110B-UFA 219 <11.8 1.19 x10³ 5.0 x10⁻⁶ 0.99 26.3 96.3 346 5.8 x10⁻³
112B-UFA 222.6 <13.1 27.2 1.14 x10⁻⁷ 481 17.4 100 332 5.5 x10⁻³
116C-UFA 230 <9.1 67.1 2.82 x10⁻⁷ 135.6 22.7 99.8 355 5.9 x10⁻³
1 Intensively studied samples. 2 Samples computed to be in equilibrium with Na-boltwoodite after correcting pore-water pH to a value representing an
equilibrium state with respect to calcite (Liu et al. 2004b). 3 Zones where pore-water composition is consistent with Na-boltwoodite solubility equilibrium.
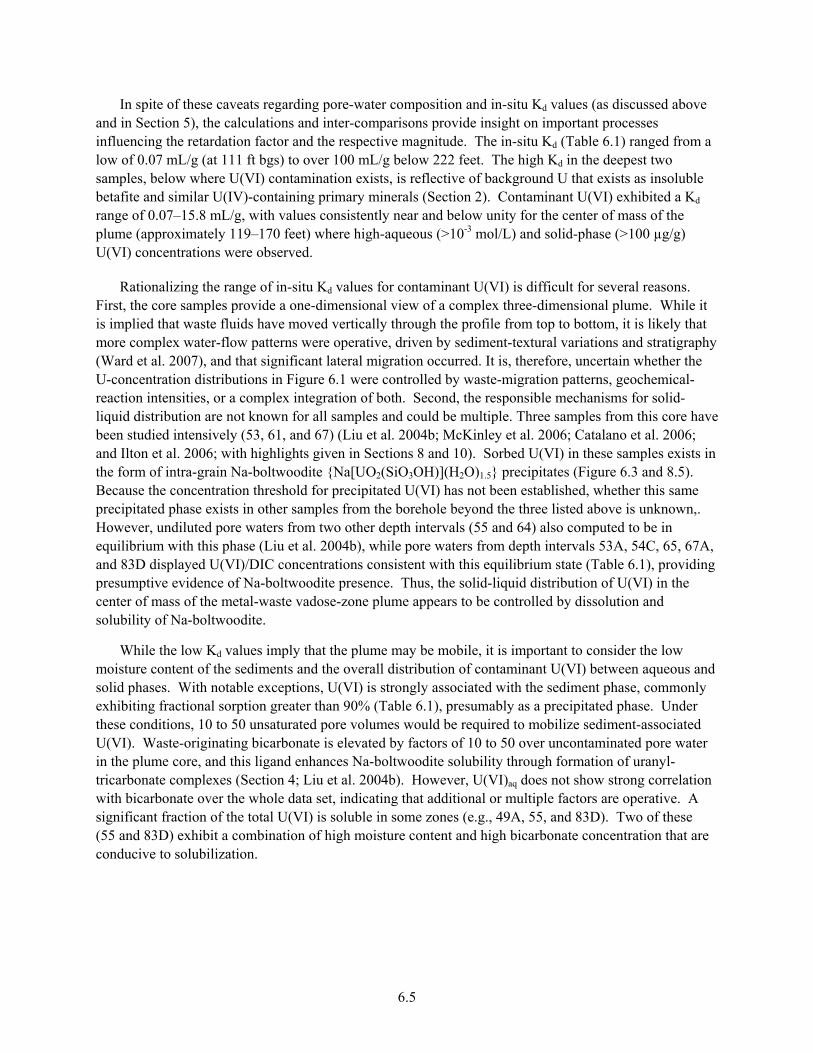
6.5
In spite of these caveats regarding pore-water composition and in-situ Kd values (as discussed above and in Section 5), the calculations and inter-comparisons provide insight on important processes influencing the retardation factor and the respective magnitude. The in-situ Kd (Table 6.1) ranged from a low of 0.07 mL/g (at 111 ft bgs) to over 100 mL/g below 222 feet. The high Kd in the deepest two samples, below where U(VI) contamination exists, is reflective of background U that exists as insoluble betafite and similar U(IV)-containing primary minerals (Section 2). Contaminant U(VI) exhibited a Kd range of 0.07–15.8 mL/g, with values consistently near and below unity for the center of mass of the plume (approximately 119–170 feet) where high-aqueous (>10-3 mol/L) and solid-phase (>100 µg/g) U(VI) concentrations were observed.
Rationalizing the range of in-situ Kd values for contaminant U(VI) is difficult for several reasons. First, the core samples provide a one-dimensional view of a complex three-dimensional plume. While it is implied that waste fluids have moved vertically through the profile from top to bottom, it is likely that more complex water-flow patterns were operative, driven by sediment-textural variations and stratigraphy (Ward et al. 2007), and that significant lateral migration occurred. It is, therefore, uncertain whether the U-concentration distributions in Figure 6.1 were controlled by waste-migration patterns, geochemical-reaction intensities, or a complex integration of both. Second, the responsible mechanisms for solid-liquid distribution are not known for all samples and could be multiple. Three samples from this core have been studied intensively (53, 61, and 67) (Liu et al. 2004b; McKinley et al. 2006; Catalano et al. 2006; and Ilton et al. 2006; with highlights given in Sections 8 and 10). Sorbed U(VI) in these samples exists in the form of intra-grain Na-boltwoodite {Na[UO2(SiO3OH)](H2O)1.5} precipitates (Figure 6.3 and 8.5). Because the concentration threshold for precipitated U(VI) has not been established, whether this same precipitated phase exists in other samples from the borehole beyond the three listed above is unknown,. However, undiluted pore waters from two other depth intervals (55 and 64) also computed to be in equilibrium with this phase (Liu et al. 2004b), while pore waters from depth intervals 53A, 54C, 65, 67A, and 83D displayed U(VI)/DIC concentrations consistent with this equilibrium state (Table 6.1), providing presumptive evidence of Na-boltwoodite presence. Thus, the solid-liquid distribution of U(VI) in the center of mass of the metal-waste vadose-zone plume appears to be controlled by dissolution and solubility of Na-boltwoodite.
While the low Kd values imply that the plume may be mobile, it is important to consider the low moisture content of the sediments and the overall distribution of contaminant U(VI) between aqueous and solid phases. With notable exceptions, U(VI) is strongly associated with the sediment phase, commonly exhibiting fractional sorption greater than 90% (Table 6.1), presumably as a precipitated phase. Under these conditions, 10 to 50 unsaturated pore volumes would be required to mobilize sediment-associated U(VI). Waste-originating bicarbonate is elevated by factors of 10 to 50 over uncontaminated pore water in the plume core, and this ligand enhances Na-boltwoodite solubility through formation of uranyl-tricarbonate complexes (Section 4; Liu et al. 2004b). However, U(VI)aq does not show strong correlation with bicarbonate over the whole data set, indicating that additional or multiple factors are operative. A significant fraction of the total U(VI) is soluble in some zones (e.g., 49A, 55, and 83D). Two of these (55 and 83D) exhibit a combination of high moisture content and high bicarbonate concentration that are conducive to solubilization.
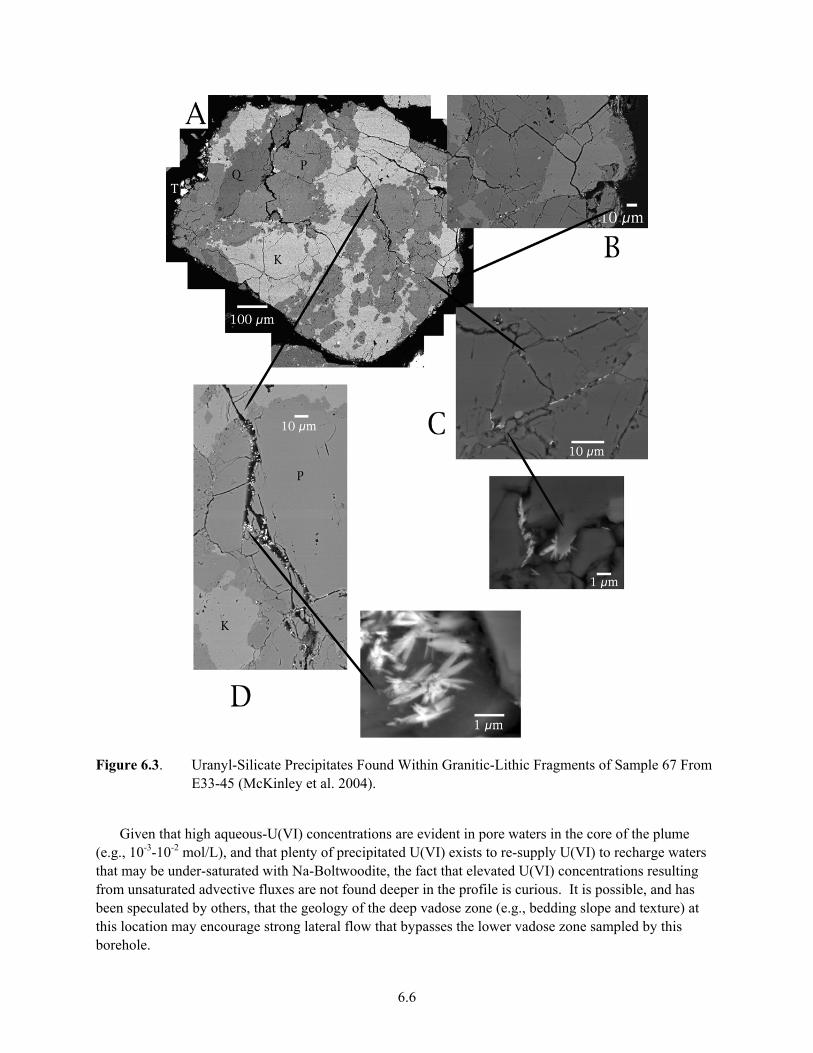
6.6
Figure 6.3. Uranyl-Silicate Precipitates Found Within Granitic-Lithic Fragments of Sample 67 From
E33-45 (McKinley et al. 2004).
Given that high aqueous-U(VI) concentrations are evident in pore waters in the core of the plume (e.g., 10-3-10-2 mol/L), and that plenty of precipitated U(VI) exists to re-supply U(VI) to recharge waters that may be under-saturated with Na-Boltwoodite, the fact that elevated U(VI) concentrations resulting from unsaturated advective fluxes are not found deeper in the profile is curious. It is possible, and has been speculated by others, that the geology of the deep vadose zone (e.g., bedding slope and texture) at this location may encourage strong lateral flow that bypasses the lower vadose zone sampled by this borehole.
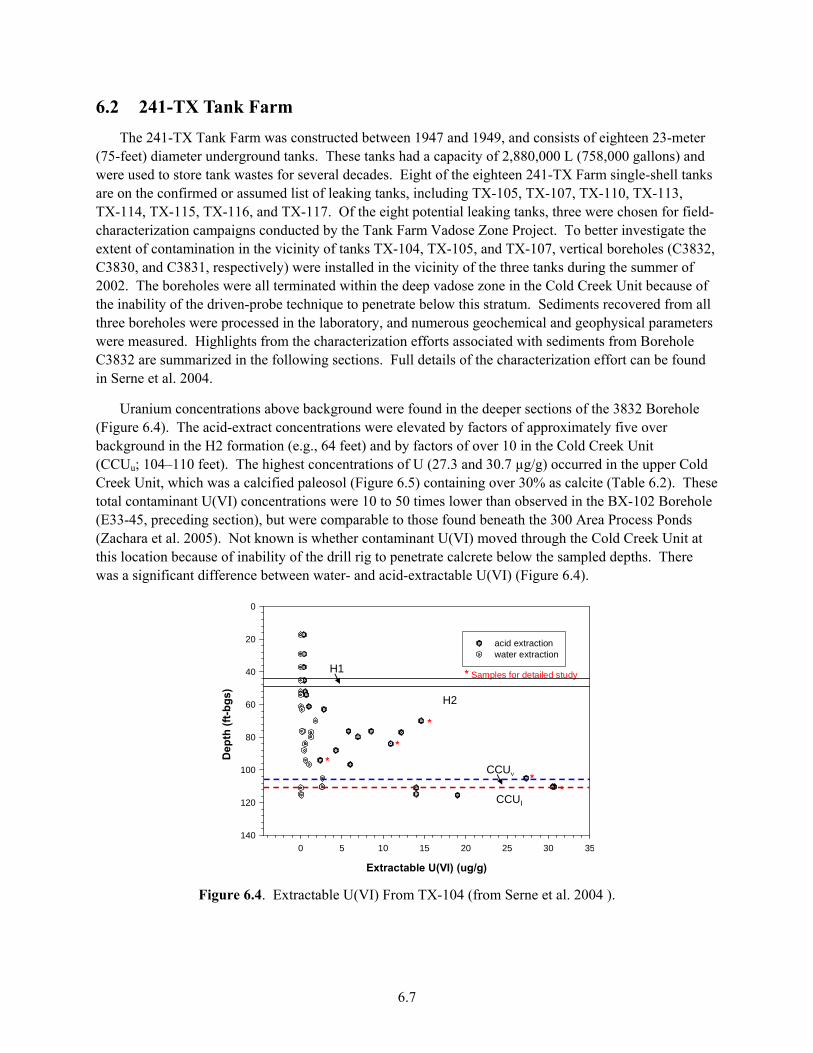
6.7
6.2 241-TX Tank Farm The 241-TX Tank Farm was constructed between 1947 and 1949, and consists of eighteen 23-meter
(75-feet) diameter underground tanks. These tanks had a capacity of 2,880,000 L (758,000 gallons) and were used to store tank wastes for several decades. Eight of the eighteen 241-TX Farm single-shell tanks are on the confirmed or assumed list of leaking tanks, including TX-105, TX-107, TX-110, TX-113, TX-114, TX-115, TX-116, and TX-117. Of the eight potential leaking tanks, three were chosen for field-characterization campaigns conducted by the Tank Farm Vadose Zone Project. To better investigate the extent of contamination in the vicinity of tanks TX-104, TX-105, and TX-107, vertical boreholes (C3832, C3830, and C3831, respectively) were installed in the vicinity of the three tanks during the summer of 2002. The boreholes were all terminated within the deep vadose zone in the Cold Creek Unit because of the inability of the driven-probe technique to penetrate below this stratum. Sediments recovered from all three boreholes were processed in the laboratory, and numerous geochemical and geophysical parameters were measured. Highlights from the characterization efforts associated with sediments from Borehole C3832 are summarized in the following sections. Full details of the characterization effort can be found in Serne et al. 2004.
Uranium concentrations above background were found in the deeper sections of the 3832 Borehole (Figure 6.4). The acid-extract concentrations were elevated by factors of approximately five over background in the H2 formation (e.g., 64 feet) and by factors of over 10 in the Cold Creek Unit (CCUu; 104–110 feet). The highest concentrations of U (27.3 and 30.7 µg/g) occurred in the upper Cold Creek Unit, which was a calcified paleosol (Figure 6.5) containing over 30% as calcite (Table 6.2). These total contaminant U(VI) concentrations were 10 to 50 times lower than observed in the BX-102 Borehole (E33-45, preceding section), but were comparable to those found beneath the 300 Area Process Ponds (Zachara et al. 2005). Not known is whether contaminant U(VI) moved through the Cold Creek Unit at this location because of inability of the drill rig to penetrate calcrete below the sampled depths. There was a significant difference between water- and acid-extractable U(VI) (Figure 6.4).
Extractable U(VI) (ug/g)
0 5 10 15 20 25 30 35
0
20
40
60
80
100
120
140
acid extractionwater extraction
* Samples for detailed study
*
*
**
*Cold Creek Formation
Dep
th (f
t-bgs
)
H2
CCUν
CCUI
H1
Figure 6.4. Extractable U(VI) From TX-104 (from Serne et al. 2004 ).
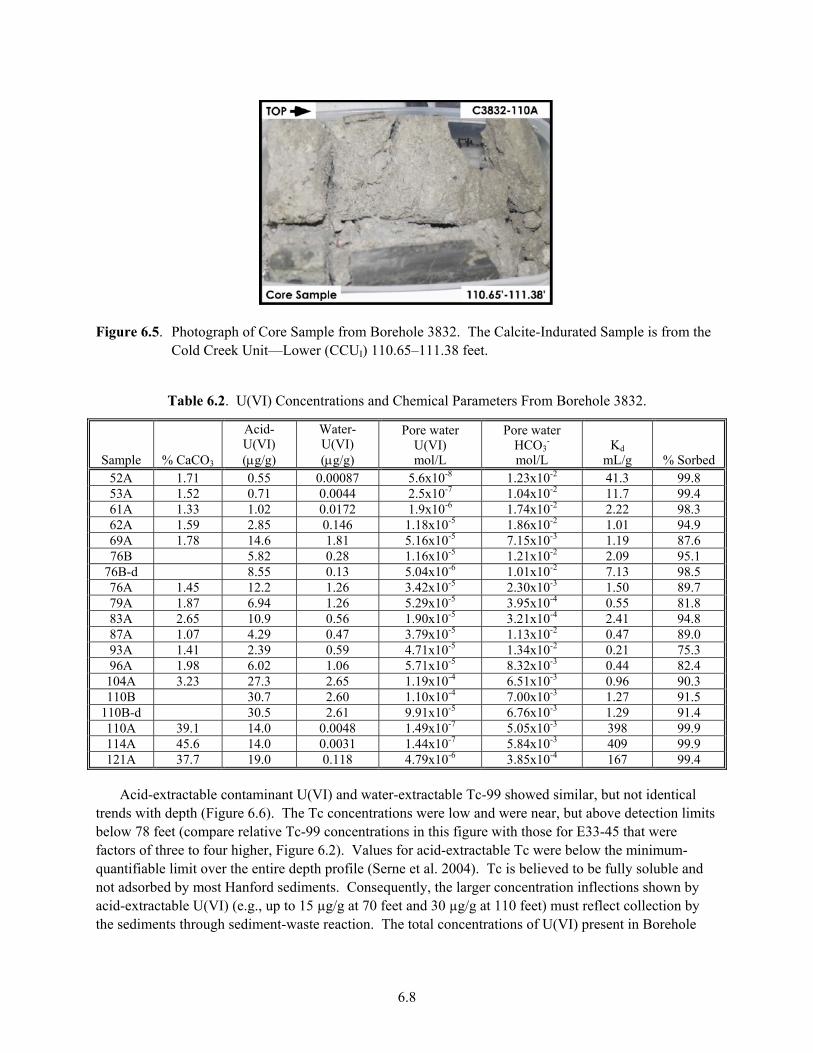
6.8
Figure 6.5. Photograph of Core Sample from Borehole 3832. The Calcite-Indurated Sample is from the
Cold Creek Unit—Lower (CCUI) 110.65–111.38 feet.
Table 6.2. U(VI) Concentrations and Chemical Parameters From Borehole 3832.
Sample % CaCO3
Acid-U(VI) (μg/g)
Water-U(VI) (μg/g)
Pore water U(VI) mol/L
Pore water HCO3
- mol/L
Kd mL/g % Sorbed
52A 1.71 0.55 0.00087 5.6x10⁻⁸ 1.23x10⁻² 41.3 99.8 53A 1.52 0.71 0.0044 2.5x10⁻⁷ 1.04x10⁻² 11.7 99.4 61A 1.33 1.02 0.0172 1.9x10⁻⁶ 1.74x10⁻² 2.22 98.3 62A 1.59 2.85 0.146 1.18x10⁻⁵ 1.86x10⁻² 1.01 94.9 69A 1.78 14.6 1.81 5.16x10⁻⁵ 7.15x10⁻³ 1.19 87.6 76B 5.82 0.28 1.16x10⁻⁵ 1.21x10⁻² 2.09 95.1
76B-d 8.55 0.13 5.04x10⁻⁶ 1.01x10⁻² 7.13 98.5 76A 1.45 12.2 1.26 3.42x10⁻⁵ 2.30x10⁻³ 1.50 89.7 79A 1.87 6.94 1.26 5.29x10⁻⁵ 3.95x10⁻⁴ 0.55 81.8 83A 2.65 10.9 0.56 1.90x10⁻⁵ 3.21x10⁻⁴ 2.41 94.8 87A 1.07 4.29 0.47 3.79x10⁻⁵ 1.13x10⁻² 0.47 89.0 93A 1.41 2.39 0.59 4.71x10⁻⁵ 1.34x10⁻² 0.21 75.3 96A 1.98 6.02 1.06 5.71x10⁻⁵ 8.32x10⁻³ 0.44 82.4 104A 3.23 27.3 2.65 1.19x10⁻⁴ 6.51x10⁻³ 0.96 90.3 110B 30.7 2.60 1.10x10⁻⁴ 7.00x10⁻³ 1.27 91.5
110B-d 30.5 2.61 9.91x10⁻⁵ 6.76x10⁻³ 1.29 91.4 110A 39.1 14.0 0.0048 1.49x10⁻⁷ 5.05x10⁻³ 398 99.9 114A 45.6 14.0 0.0031 1.44x10⁻⁷ 5.84x10⁻³ 409 99.9 121A 37.7 19.0 0.118 4.79x10⁻⁶ 3.85x10⁻⁴ 167 99.4
Acid-extractable contaminant U(VI) and water-extractable Tc-99 showed similar, but not identical trends with depth (Figure 6.6). The Tc concentrations were low and were near, but above detection limits below 78 feet (compare relative Tc-99 concentrations in this figure with those for E33-45 that were factors of three to four higher, Figure 6.2). Values for acid-extractable Tc were below the minimum-quantifiable limit over the entire depth profile (Serne et al. 2004). Tc is believed to be fully soluble and not adsorbed by most Hanford sediments. Consequently, the larger concentration inflections shown by acid-extractable U(VI) (e.g., up to 15 µg/g at 70 feet and 30 µg/g at 110 feet) must reflect collection by the sediments through sediment-waste reaction. The total concentrations of U(VI) present in Borehole
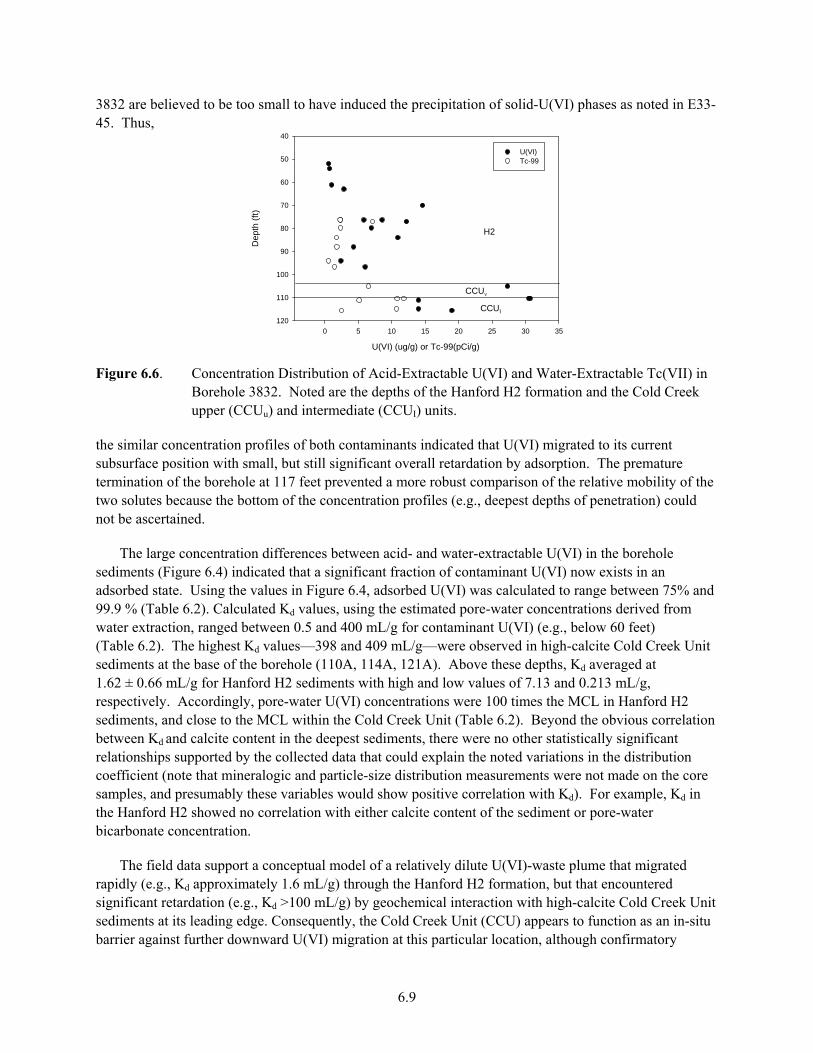
6.9
3832 are believed to be too small to have induced the precipitation of solid-U(VI) phases as noted in E33-45. Thus,
U(VI) (ug/g) or Tc-99(pCi/g)
0 5 10 15 20 25 30 35
Dep
th (f
t)
40
50
60
70
80
90
100
110
120
U(VI)Tc-99
H2
CCUν
CCUI
U(VI) (ug/g) or Tc-99(pCi/g)
0 5 10 15 20 25 30 35
Dep
th (f
t)
40
50
60
70
80
90
100
110
120
U(VI)Tc-99
H2
CCUν
CCUI
Figure 6.6. Concentration Distribution of Acid-Extractable U(VI) and Water-Extractable Tc(VII) in
Borehole 3832. Noted are the depths of the Hanford H2 formation and the Cold Creek upper (CCUu) and intermediate (CCUI) units.
the similar concentration profiles of both contaminants indicated that U(VI) migrated to its current subsurface position with small, but still significant overall retardation by adsorption. The premature termination of the borehole at 117 feet prevented a more robust comparison of the relative mobility of the two solutes because the bottom of the concentration profiles (e.g., deepest depths of penetration) could not be ascertained.
The large concentration differences between acid- and water-extractable U(VI) in the borehole sediments (Figure 6.4) indicated that a significant fraction of contaminant U(VI) now exists in an adsorbed state. Using the values in Figure 6.4, adsorbed U(VI) was calculated to range between 75% and 99.9 % (Table 6.2). Calculated Kd values, using the estimated pore-water concentrations derived from water extraction, ranged between 0.5 and 400 mL/g for contaminant U(VI) (e.g., below 60 feet) (Table 6.2). The highest Kd values—398 and 409 mL/g—were observed in high-calcite Cold Creek Unit sediments at the base of the borehole (110A, 114A, 121A). Above these depths, Kd averaged at 1.62 ± 0.66 mL/g for Hanford H2 sediments with high and low values of 7.13 and 0.213 mL/g, respectively. Accordingly, pore-water U(VI) concentrations were 100 times the MCL in Hanford H2 sediments, and close to the MCL within the Cold Creek Unit (Table 6.2). Beyond the obvious correlation between Kd and calcite content in the deepest sediments, there were no other statistically significant relationships supported by the collected data that could explain the noted variations in the distribution coefficient (note that mineralogic and particle-size distribution measurements were not made on the core samples, and presumably these variables would show positive correlation with Kd). For example, Kd in the Hanford H2 showed no correlation with either calcite content of the sediment or pore-water bicarbonate concentration.
The field data support a conceptual model of a relatively dilute U(VI)-waste plume that migrated rapidly (e.g., Kd approximately 1.6 mL/g) through the Hanford H2 formation, but that encountered significant retardation (e.g., Kd >100 mL/g) by geochemical interaction with high-calcite Cold Creek Unit sediments at its leading edge. Consequently, the Cold Creek Unit (CCU) appears to function as an in-situ barrier against further downward U(VI) migration at this particular location, although confirmatory

6.10
measurements of U(VI) concentrations at deeper depths below this zone are lacking. Electron microscopy of thin sections of <2.0-mm sediments revealed distinct differences between H2 and CCU
Red = CaGreen = KBlue = Si
) )a.) b.)
Figure 6.7. Backscattered Electron Micrograph (a) and Wavelength Dispersive Spectroscopy (WDS)
Analyses (b) of Sediment 69A Thin Section. Colors demote elemental distribution. Note 300 μm scale bar.
sediments (Figures 6.7 and 6.8), related to geochemical reactivity. The H2 sediments were unconsolidated and were dominated by approximate 0.1-mm quartz grains (blue); with lesser amounts of K-feldspar (green ellipses) and mica (green blades), calcite (red) existing as crystallite aggregates and pore fill, and phyllosilicates (small green/blue) pore fill and grain coatings (Figure 6.7). The CCU, in contrast, contains mineral grains of various types and sizes (quartz and aluminosilicates, green and blue), cohesively embedded in calcite (CaCO3) cement (Figure 6.8). High-magnification microscopy of the calcitic domains in the CCU sediments (e.g., lower left of Figure 6.8) reveal significant microporosity and the presence of fine-grained embedded-layer lattice silicates (smectite) and Fe(III) oxides between micron-sized calcite crystallites. While these characteristics apparently cause the CCU sediments to be highly reactive toward U(VI), how waste fluids penetrate this impermeable unit remains unclear. Further discussion on U(VI) adsorption and desorption from these sediments is provided in Section 8.
6.3 300 Area (316-1/2) Uranium-processing and fuel-fabrication processes were conducted from 1943 to 1988 in the
300 Area. As a result of these activities, numerous waste streams were discharged to cribs, ponds, and trenches located in the vicinity of the 300 Area (now termed Waste Management Area 300-FF-5). Typical discharged waste streams included uranyl and cuprous nitrate hexahydrate, ammonium nitrate, hexone, neutralized waste acids containing metallic and chemical components of the fuel fabrication process, and process chemicals and solutions used in the numerous fuel-reprocessing and separation techniques employed at the Hanford Site (Gerber 1992). Total uranium inventories discharged to 300-FF-5 included 100 kg to cribs, 10,000 kg to process trenches (316-5), and as much as 60,000 kg to process ponds (316-1 and 316-2 [Gerber, 1992; see also Section 3 and Table 3.1]). The waste stream to the process ponds varied markedly in pH (from 2.0 to 10.0), and contained large amounts of co-contaminant Cu (241,311 kg total) and Na-aluminate (113,398 kg as Al). As a result of these activities, U(VI)- contaminated sediments and groundwater exist near and beneath the historic 300 Area disposal facilities (cribs, trenches, and ponds [Peterson et al. 2005]). Shallow, highly contaminated sediments
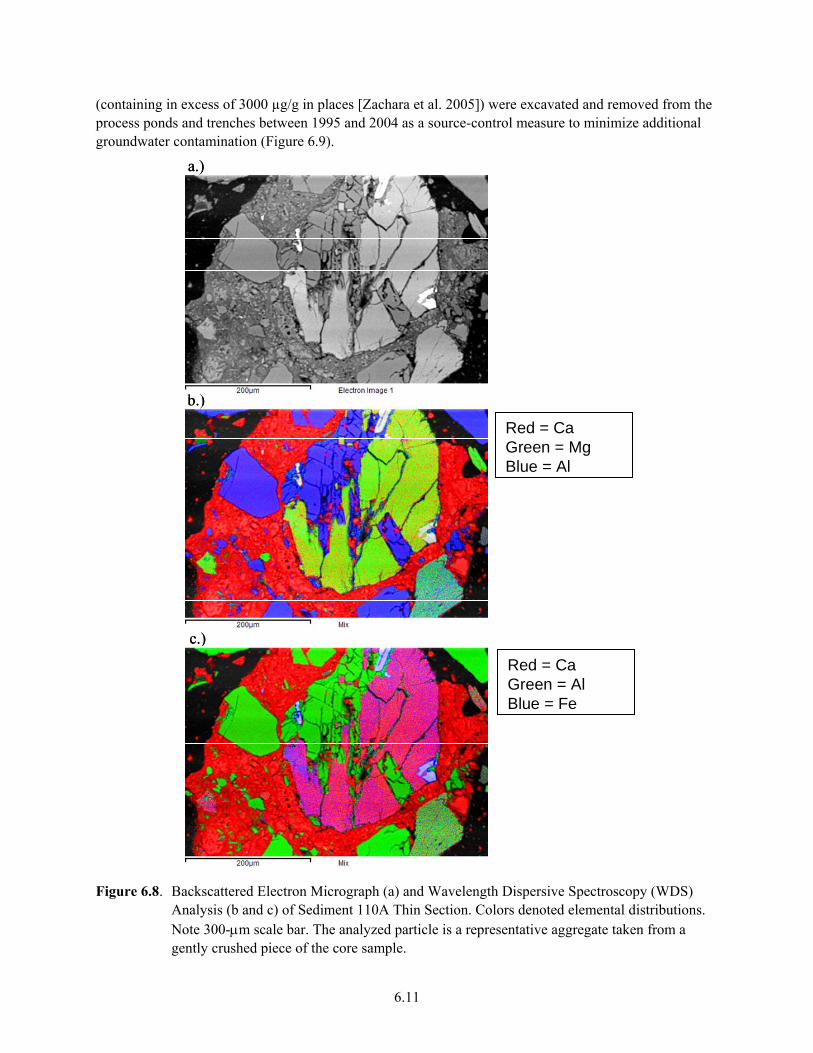
6.11
(containing in excess of 3000 µg/g in places [Zachara et al. 2005]) were excavated and removed from the process ponds and trenches between 1995 and 2004 as a source-control measure to minimize additional groundwater contamination (Figure 6.9).
a.)
c.)
Red = CaGreen = MgBlue = Al
Red = CaGreen = AlBlue = Fe
b.)
a.)
c.)
Red = CaGreen = MgBlue = Al
Red = CaGreen = AlBlue = Fe
b.)
Figure 6.8. Backscattered Electron Micrograph (a) and Wavelength Dispersive Spectroscopy (WDS)
Analysis (b and c) of Sediment 110A Thin Section. Colors denoted elemental distributions. Note 300-μm scale bar. The analyzed particle is a representative aggregate taken from a gently crushed piece of the core sample.

6.12
Figure 6.9. Arial Photograph of 300-FF-5 Looking South with the Columbia River on the Left. The
North and South Process Ponds (center-left) are partially excavated.
The 300 Area differs from the 200 Area Plateau sites discussed previously in this section because it is a River Corridor site with a relatively shallow vadose zone (approximately 5 to 6 meters). Contamination has moved from source areas (316-1, 316-2, and 316-5), through the vadose zone and groundwater to a final discharge in the Columbia River. Moreover, seasonal and more frequent changes in Columbia River stage create a complex and dynamic groundwater system with changing head gradients and velocity fields (Peterson et al. 2005). Considerable efforts have been expended to define conceptual hydrologic and geochemical models for the site that can guide an effective remediation strategy (Peterson et al. 2005; Zachara et al. 2005; Williams et al. 2007). The groundwater U(VI) plume at this location (Figure 6.10) has persisted at concentrations above the MCL for longer duration than expected, and various studies have sought explanation for this observation.
The 300 Area has been subject to several detailed field-sampling campaigns with associated laboratory analyses and studies of the retrieved materials (Serne et al. 2002b; Zachara et al. 2005; Williams et al. 2007). The study of Serne et al. (2002b) involved characterization of near-surface sediments collected from various locations within the 300 Area. Research performed by Zachara et al. (2005) focused on vadose-zone sediment and aquifer fines collected from four excavations in the footprints of the North and South Process Ponds, the major repositories of contaminant U(VI). Spectroscopy and microscopy was performed on the sediments to determine the geochemical speciation of U(VI) with depth through the vadose zone, the reactive-phase mineralogy was analyzed, and a variety of wet-chemical studies were performed to investigate the release rate and extent of contaminant U(VI) from the process-pond sediments. The 300-FF-5 limited-field investigation (LFI) (Williams et al. 2007) sought to establish an improved hydrochemical model for contaminant-U(VI) distribution at the site through characterization of the spatial distribution of contaminant U(VI) in the vadose zone, capillary
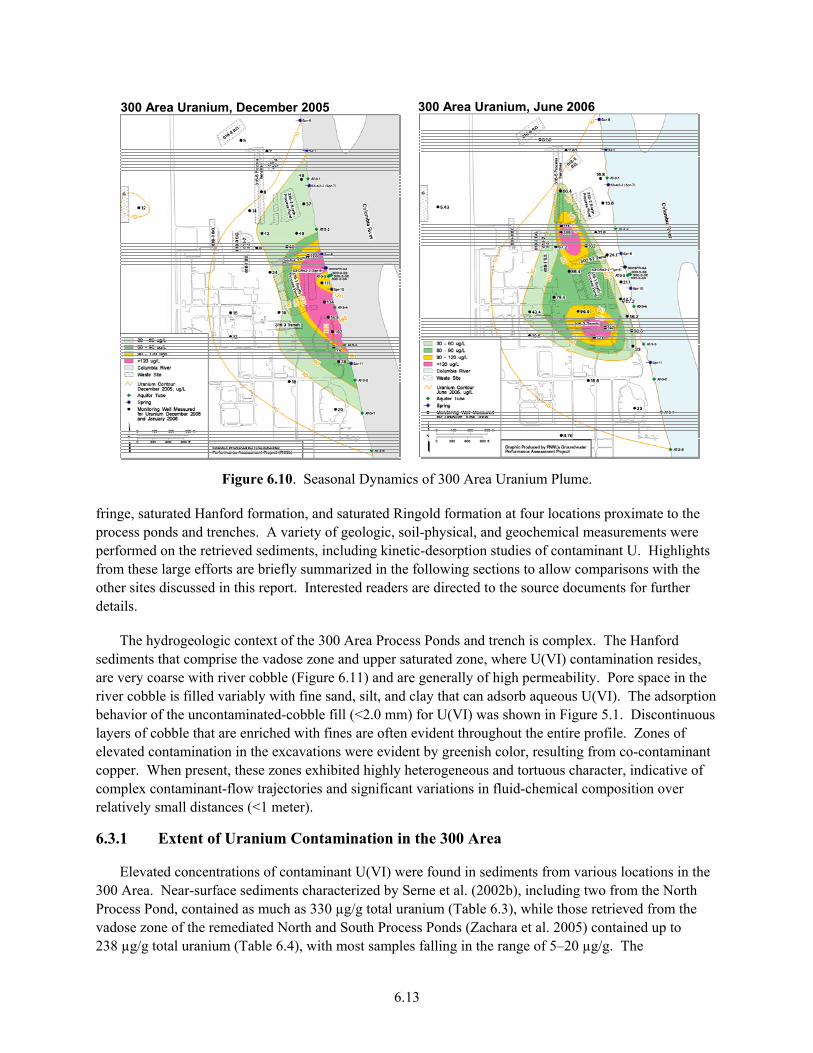
6.13
300 Area Uranium, December 2005 300 Area Uranium, June 2006
Figure 6.10. Seasonal Dynamics of 300 Area Uranium Plume.
fringe, saturated Hanford formation, and saturated Ringold formation at four locations proximate to the process ponds and trenches. A variety of geologic, soil-physical, and geochemical measurements were performed on the retrieved sediments, including kinetic-desorption studies of contaminant U. Highlights from these large efforts are briefly summarized in the following sections to allow comparisons with the other sites discussed in this report. Interested readers are directed to the source documents for further details.
The hydrogeologic context of the 300 Area Process Ponds and trench is complex. The Hanford sediments that comprise the vadose zone and upper saturated zone, where U(VI) contamination resides, are very coarse with river cobble (Figure 6.11) and are generally of high permeability. Pore space in the river cobble is filled variably with fine sand, silt, and clay that can adsorb aqueous U(VI). The adsorption behavior of the uncontaminated-cobble fill (<2.0 mm) for U(VI) was shown in Figure 5.1. Discontinuous layers of cobble that are enriched with fines are often evident throughout the entire profile. Zones of elevated contamination in the excavations were evident by greenish color, resulting from co-contaminant copper. When present, these zones exhibited highly heterogeneous and tortuous character, indicative of complex contaminant-flow trajectories and significant variations in fluid-chemical composition over relatively small distances (<1 meter).
6.3.1 Extent of Uranium Contamination in the 300 Area
Elevated concentrations of contaminant U(VI) were found in sediments from various locations in the 300 Area. Near-surface sediments characterized by Serne et al. (2002b), including two from the North Process Pond, contained as much as 330 µg/g total uranium (Table 6.3), while those retrieved from the vadose zone of the remediated North and South Process Ponds (Zachara et al. 2005) contained up to 238 µg/g total uranium (Table 6.4), with most samples falling in the range of 5–20 µg/g. The

6.14
Figure 6.11. Excavation Through South Process Pond Sediments Display Coarse Texture.
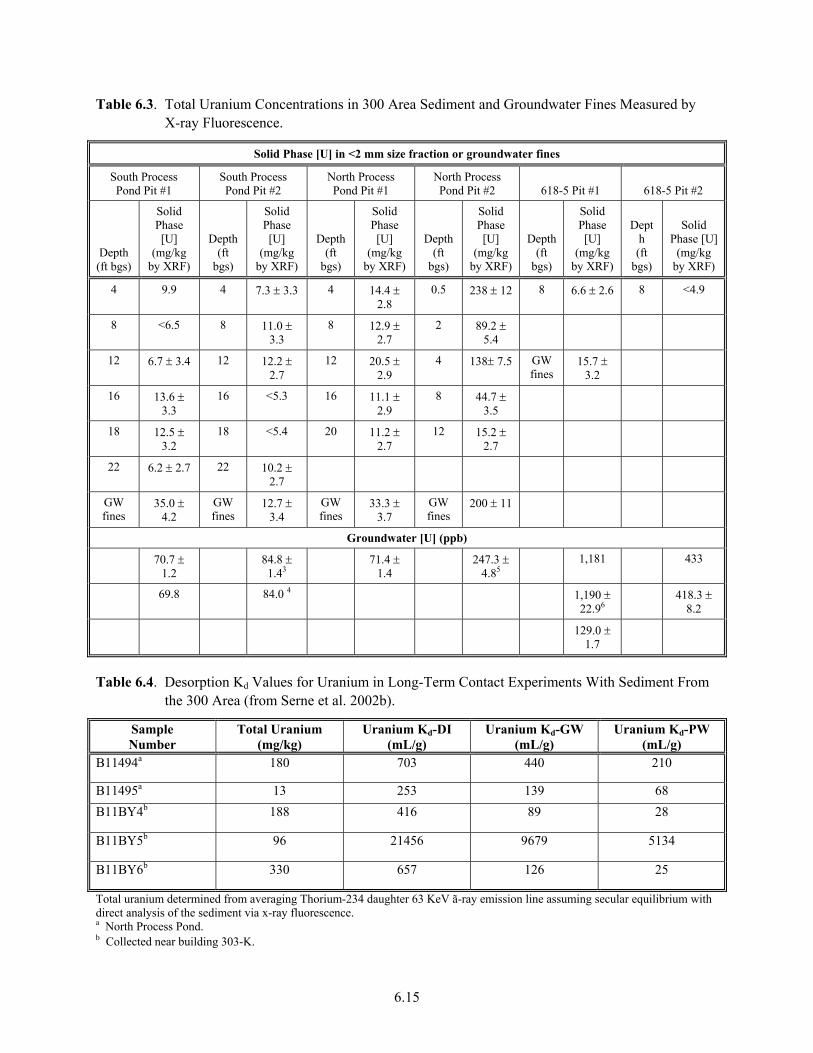
6.15
Table 6.3. Total Uranium Concentrations in 300 Area Sediment and Groundwater Fines Measured by X-ray Fluorescence.
Solid Phase [U] in <2 mm size fraction or groundwater fines
South Process Pond Pit #1
South Process Pond Pit #2
North Process Pond Pit #1
North Process Pond Pit #2 618-5 Pit #1 618-5 Pit #2
Depth (ft bgs)
Solid Phase [U]
(mg/kg by XRF)
Depth (ft
bgs)
Solid Phase [U]
(mg/kg by XRF)
Depth(ft
bgs)
Solid Phase [U]
(mg/kg by XRF)
Depth(ft
bgs)
Solid Phase [U]
(mg/kg by XRF)
Depth(ft
bgs)
Solid Phase [U]
(mg/kg by XRF)
Depth (ft
bgs)
Solid Phase [U]
(mg/kg by XRF)
4 9.9 4 7.3 ± 3.3 4 14.4 ± 2.8
0.5 238 ± 12 8 6.6 ± 2.6 8 <4.9
8 <6.5 8 11.0 ± 3.3
8 12.9 ± 2.7
2 89.2 ± 5.4
12 6.7 ± 3.4 12 12.2 ± 2.7
12 20.5 ± 2.9
4 138± 7.5 GW fines
15.7 ± 3.2
16 13.6 ± 3.3
16 <5.3 16 11.1 ± 2.9
8 44.7 ± 3.5
18 12.5 ± 3.2
18 <5.4 20 11.2 ± 2.7
12 15.2 ± 2.7
22 6.2 ± 2.7 22 10.2 ± 2.7
GW fines
35.0 ± 4.2
GW fines
12.7 ± 3.4
GW fines
33.3 ± 3.7
GW fines
200 ± 11
Groundwater [U] (ppb)
70.7 ± 1.2
84.8 ± 1.43
71.4 ± 1.4
247.3 ± 4.85
1,181 433
69.8 84.0 4 1,190 ± 22.96
418.3 ± 8.2
129.0 ± 1.7
Table 6.4. Desorption Kd Values for Uranium in Long-Term Contact Experiments With Sediment From the 300 Area (from Serne et al. 2002b).
Sample Number
Total Uranium (mg/kg)
Uranium Kd-DI (mL/g)
Uranium Kd-GW (mL/g)
Uranium Kd-PW (mL/g)
B11494a 180 703 440 210
B11495a 13 253 139 68 B11BY4b 188 416 89 28
B11BY5b 96 21456 9679 5134
B11BY6b 330 657 126 25
Total uranium determined from averaging Thorium-234 daughter 63 KeV ã-ray emission line assuming secular equilibrium with direct analysis of the sediment via x-ray fluorescence. a North Process Pond. b Collected near building 303-K.

6.16
concentrations of vadose-zone U(VI) in the process ponds strongly correlated with those of Cu, and the two metals were closely associated as precipitates at the micron scale in certain sediments (Zachara et al. 2005). A conceptual model for U(VI) geochemistry in the process-pond sediments was described by Zachara et al. (2005), and a hydrochemical model for the entire groundwater U(VI) plume by Peterson et al. (2005). The LFI sampling found significant contaminant U(VI) near the process trench (399-1-23) and on the east side of the South Process Pond (399-3-18; Figure 6.12). The highest U(VI) concentrations in LFI cores occurred in the deep vadose or “smear zone,” where total U(VI), up to 15 µg/g and soluble (pore water) U(VI), up to 3650 µg/L (1.53 x 10⁻⁵ mol/L) were observed (Figure 6.13). The LFI study found that sorbed U(VI) on aquifer sediments within the U(VI)-groundwater plume was below the minimum quantifiable limit at most locations, and could not be discriminated from background.
Locations of CF-ULocations of SZ-U
399-3-20(C5002)
399-3-18(C4999)
399-3-19(C5001)
399-1-23(C5000)
Locations of CF-ULocations of SZ-U
399-3-20(C5002)
399-3-18(C4999)
399-3-19(C5001)
399-1-23(C5000)
Figure 6.12. Documented Locations of Solid-Associated U That Represent Potential Continued
Sources of U(VI) to Groundwater. The filled orange circles are locations where sorbed U(VI) was observed in lower vadose-zone sediments (capillary fringe and “smear zone”); whole-filled blue circles identify locations were measurable sorbed U(VI) was observed in aquifer materials. LFI sampling locations are circled with blue—little contaminant U(VI), or black—significant contaminant U(VI).
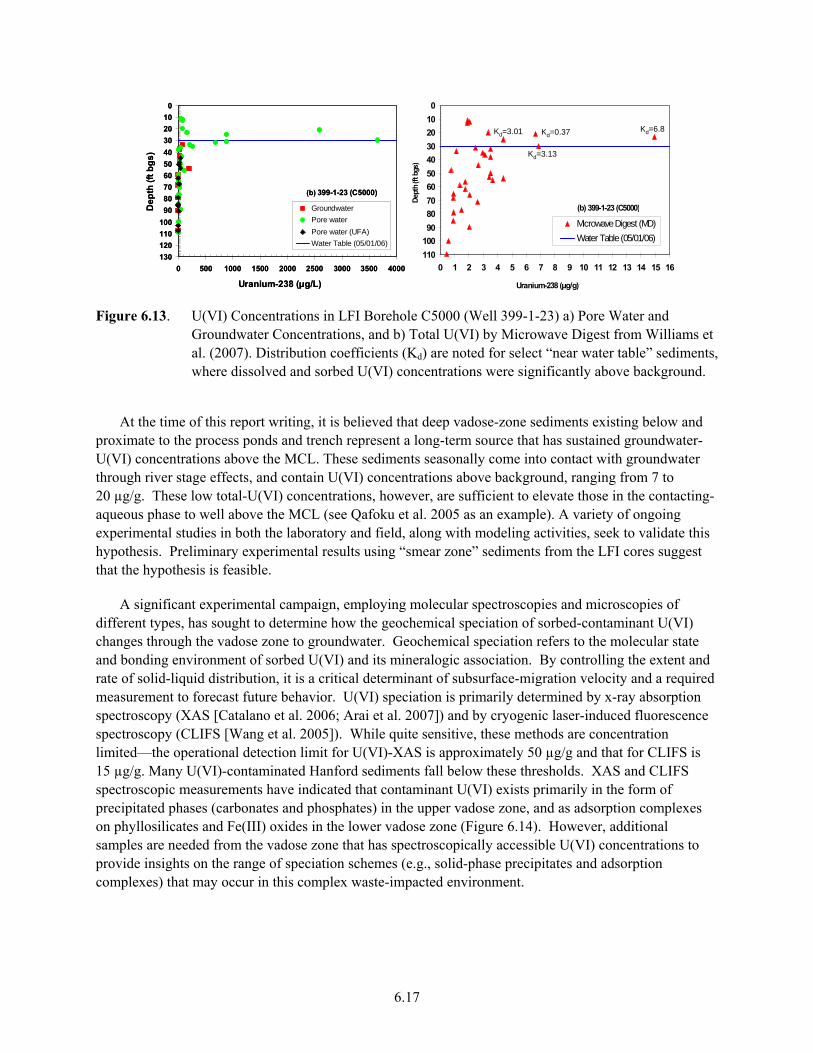
6.17
0102030405060708090
100110120130
0 500 1000 1500 2000 2500 3000 3500 4000
Uranium-238 (µg/L)
Dep
th (f
t bgs
)
GroundwaterPore waterPore water (UFA)Water Table (05/01/06)
(b)
399-1-23 (C5000)
0102030405060708090
100110
0 1 2 3 4 5 6 7 8 9 10 11 12 13 14 15 16
Uranium-238 (µg/g)
Dept
h (ft
bgs)
Microwave Digest (MD)Water Table (05/01/06)
(b) 399-1-23 (C5000)
Kd=3.01 Kd=0.37
Kd=3.13
Kd=6.8
(b)
0102030405060708090
100110120130
0 500 1000 1500 2000 2500 3000 3500 4000
Uranium-238 (µg/L)
Dep
th (f
t bgs
)
GroundwaterPore waterPore water (UFA)Water Table (05/01/06)
(b)
399-1-23 (C5000)
0102030405060708090
100110
0 1 2 3 4 5 6 7 8 9 10 11 12 13 14 15 16
Uranium-238 (µg/g)
Dept
h (ft
bgs)
Microwave Digest (MD)Water Table (05/01/06)
(b) 399-1-23 (C5000)
Kd=3.01 Kd=0.37
Kd=3.13
Kd=6.8
(b)
Figure 6.13. U(VI) Concentrations in LFI Borehole C5000 (Well 399-1-23) a) Pore Water and
Groundwater Concentrations, and b) Total U(VI) by Microwave Digest from Williams et al. (2007). Distribution coefficients (Kd) are noted for select “near water table” sediments, where dissolved and sorbed U(VI) concentrations were significantly above background.
At the time of this report writing, it is believed that deep vadose-zone sediments existing below and proximate to the process ponds and trench represent a long-term source that has sustained groundwater-U(VI) concentrations above the MCL. These sediments seasonally come into contact with groundwater through river stage effects, and contain U(VI) concentrations above background, ranging from 7 to 20 µg/g. These low total-U(VI) concentrations, however, are sufficient to elevate those in the contacting-aqueous phase to well above the MCL (see Qafoku et al. 2005 as an example). A variety of ongoing experimental studies in both the laboratory and field, along with modeling activities, seek to validate this hypothesis. Preliminary experimental results using “smear zone” sediments from the LFI cores suggest that the hypothesis is feasible.
A significant experimental campaign, employing molecular spectroscopies and microscopies of different types, has sought to determine how the geochemical speciation of sorbed-contaminant U(VI) changes through the vadose zone to groundwater. Geochemical speciation refers to the molecular state and bonding environment of sorbed U(VI) and its mineralogic association. By controlling the extent and rate of solid-liquid distribution, it is a critical determinant of subsurface-migration velocity and a required measurement to forecast future behavior. U(VI) speciation is primarily determined by x-ray absorption spectroscopy (XAS [Catalano et al. 2006; Arai et al. 2007]) and by cryogenic laser-induced fluorescence spectroscopy (CLIFS [Wang et al. 2005]). While quite sensitive, these methods are concentration limited—the operational detection limit for U(VI)-XAS is approximately 50 µg/g and that for CLIFS is 15 µg/g. Many U(VI)-contaminated Hanford sediments fall below these thresholds. XAS and CLIFS spectroscopic measurements have indicated that contaminant U(VI) exists primarily in the form of precipitated phases (carbonates and phosphates) in the upper vadose zone, and as adsorption complexes on phyllosilicates and Fe(III) oxides in the lower vadose zone (Figure 6.14). However, additional samples are needed from the vadose zone that has spectroscopically accessible U(VI) concentrations to provide insights on the range of speciation schemes (e.g., solid-phase precipitates and adsorption complexes) that may occur in this complex waste-impacted environment.
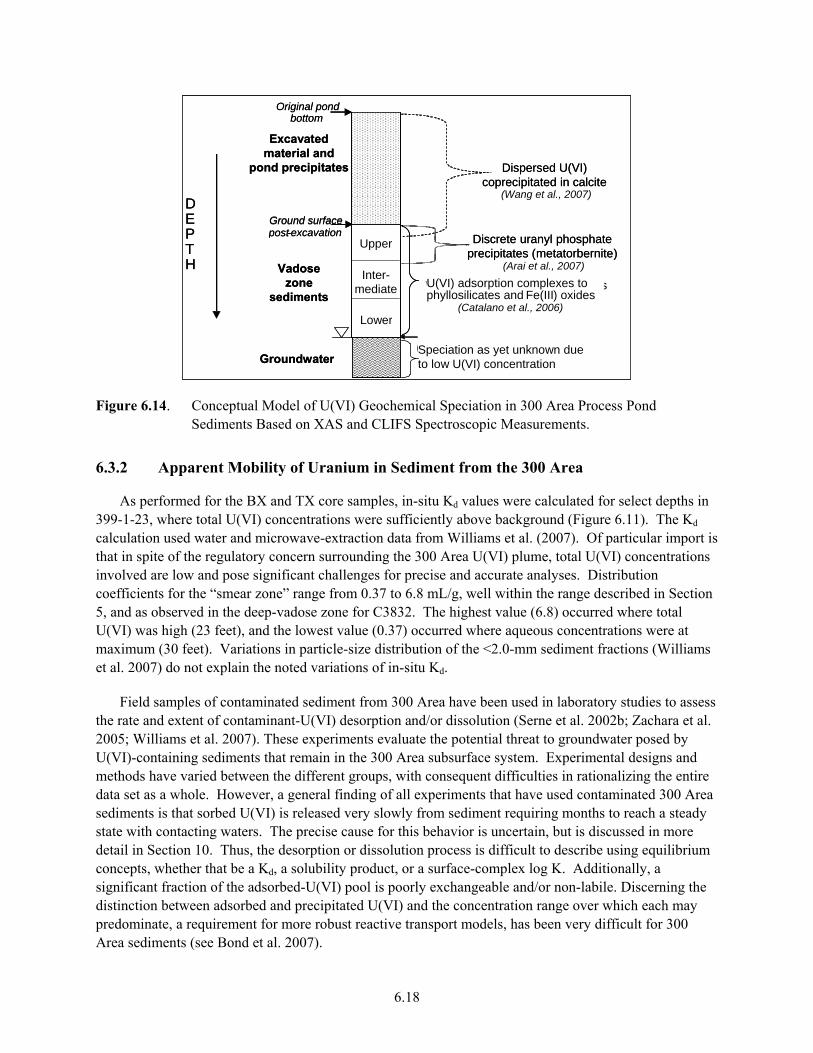
6.18
Figure 6.14. Conceptual Model of U(VI) Geochemical Speciation in 300 Area Process Pond
Sediments Based on XAS and CLIFS Spectroscopic Measurements.
6.3.2 Apparent Mobility of Uranium in Sediment from the 300 Area
As performed for the BX and TX core samples, in-situ Kd values were calculated for select depths in 399-1-23, where total U(VI) concentrations were sufficiently above background (Figure 6.11). The Kd calculation used water and microwave-extraction data from Williams et al. (2007). Of particular import is that in spite of the regulatory concern surrounding the 300 Area U(VI) plume, total U(VI) concentrations involved are low and pose significant challenges for precise and accurate analyses. Distribution coefficients for the “smear zone” range from 0.37 to 6.8 mL/g, well within the range described in Section 5, and as observed in the deep-vadose zone for C3832. The highest value (6.8) occurred where total U(VI) was high (23 feet), and the lowest value (0.37) occurred where aqueous concentrations were at maximum (30 feet). Variations in particle-size distribution of the <2.0-mm sediment fractions (Williams et al. 2007) do not explain the noted variations of in-situ Kd.
Field samples of contaminated sediment from 300 Area have been used in laboratory studies to assess the rate and extent of contaminant-U(VI) desorption and/or dissolution (Serne et al. 2002b; Zachara et al. 2005; Williams et al. 2007). These experiments evaluate the potential threat to groundwater posed by U(VI)-containing sediments that remain in the 300 Area subsurface system. Experimental designs and methods have varied between the different groups, with consequent difficulties in rationalizing the entire data set as a whole. However, a general finding of all experiments that have used contaminated 300 Area sediments is that sorbed U(VI) is released very slowly from sediment requiring months to reach a steady state with contacting waters. The precise cause for this behavior is uncertain, but is discussed in more detail in Section 10. Thus, the desorption or dissolution process is difficult to describe using equilibrium concepts, whether that be a Kd, a solubility product, or a surface-complex log K. Additionally, a significant fraction of the adsorbed-U(VI) pool is poorly exchangeable and/or non-labile. Discerning the distinction between adsorbed and precipitated U(VI) and the concentration range over which each may predominate, a requirement for more robust reactive transport models, has been very difficult for 300 Area sediments (see Bond et al. 2007).
Excavated material and
pond precipitates
Vadose zone
sediments
Groundwater
Dispersed U(VI) coprecipitated in calcite
Discrete uranyl phosphate precipitates (metatorbernite)
Weak U(VI) adsorption complexes
(colloidal particulates)
D E P T H
Upper
Inter-mediate
Lower
Original pond bottom
Ground surface post - excavation
Excavated material and
pond precipitates
Vadose zone
sediments
Groundwater
Dispersed U(VI) coprecipitated in calcite
Discrete uranyl phosphate precipitates (metatorbernite)
U(VI) adsorption complexes to phyllosilicates and Fe(III) oxides
Speciation as yet unknown due to low U(VI) concentration
D E P T H
Upper
Inter-mediate
Lower
Original pond bottom
Ground surface post - excavation
(Wang et al., 2007)
(Arai et al., 2007)
(Catalano et al., 2006)
Excavated material and
pond precipitates
Vadose zone
sediments
Groundwater
Dispersed U(VI) coprecipitated in calcite
Discrete uranyl phosphate precipitates (metatorbernite)
Weak U(VI) adsorption complexes
(colloidal particulates)
D E P T H
Upper
Inter-mediate
Lower
Original pond bottom
Ground surface post - excavation
Excavated material and
pond precipitates
Vadose zone
sediments
Groundwater
Dispersed U(VI) coprecipitated in calcite
Discrete uranyl phosphate precipitates (metatorbernite)
U(VI) adsorption complexes to phyllosilicates and Fe(III) oxides
Speciation as yet unknown due to low U(VI) concentration
D E P T H
Upper
Inter-mediate
Lower
Original pond bottom
Ground surface post - excavation
(Wang et al., 2007)
(Arai et al., 2007)
(Catalano et al., 2006)

6.19
Desorption distribution coefficients have been measured on a variety of 300 Area sediments to provide insights on in-situ U(VI) mobility. These measurements have been difficult to interpret and compare because of contact-time effects, sorbed U(VI) lability issues and how the sorbed-U(VI) concentration is defined, and uncertainty in geochemical speciation. Nonetheless, a discussion of these results provides insight on the magnitude of U(VI) solid-liquid partitioning in 300 Area sediments and factors affecting it, and the experimental complications involved in such measurements. Serne et al. (2002b) determined desorption Kd values for North Process Pond sediments and 303-K building soils in deionized water (<0.1 mmol HCO3), uncontaminated groundwater (approximately 2 mmol HCO3), and simulated pore water (10 mmol HCO3). The experiments were carried out for six months in an attempt to reach steady-state uranium-solution concentrations. Desorption Kd values ranged from 253 to 21,456 mL/g in deionized water (DI), 89 to 9679 mL/g in 300 Area groundwater (GW), and 25 to 5134 mL/g in vadose-zone pore water (PW) (Table 6.4). These Kd values were extremely high as compared to others reported in this section, decreased progressively with increasing bicarbonate (albeit with sediment-specific dependencies on HCO3 concentration), and displayed no correlation with total sorbed-U(VI) content. Given the results of Bond et al. (2007), the conclusion was made that four of the five sediments contained U(VI) in a precipitated state, while the fifth (B11495) contained adsorbed U(VI). However, there was no apparent difference in Kd for adsorbed and precipitated U(VI), and precipitated U(VI) exhibited a large range in Kd. Apparently, the nature of precipitated U(VI) varied between sediments (i.e., exhibited different solubility products) and/or that the aqueous composition of the various equilibrations evolved to different end-states—allowing more or less U(VI) dissolution to reach solubility equilibrium—as a result of sediment-water reaction. The anomalous behavior of B11BY5 remains unexplained without valence and geochemical-speciation measurements.
Table 6.5. Comparison of U(VI) Extraction Techniques.
Sample
Surface Area
(m2/g) Total U
(mg/kg)(a)
Isotopic Exchange Extracted % of
Total U(b)
Bicarbonate Extracted % of
Total U(c)
Formate Extracted % of Total U(d)
AGW 4 Extracted % of Total U(e)
U Kd (mL/g)(f)
NPP 1-8 19.9 10.5 75.7 45.0 101.5 24.3 12.2 NPP 1-12 27.2 14.0 40.6 42.7 90.3 19.5 7.1 NPP 1-16 27.2 9.6 39.6 38.3 82.5 17.1 9.5 NPP 1-20 17.5 6.3 30.2 29.7 77.5 15.7 4.2 NPP 2-2 17.8 105.9 42.3 29.8 72.5 4.6 27.7 NPP 2-8 18.5 39.9 58.0 37.6 69.3 16.8 25.0
NPP 2-12 14.7 14.2 54.3 56.1 107.1 25.6 5.8 SPP 1-16 21.2 9.1 51.3 54.7 101.9 32.3 2.4 SPP 1-18 22.0 7.4 33.7 36.0 78.6 19.7 2.6 SPP 1-22 25.8 7.9 32.1 35.4 68.9 20.4 5.3 SPP 2-8 17.7 10.8 43.9 43.8 91.6 30.7 0.5
SPP 2-12 15.9 8.0 52.5 57.6 100.1 37.6 0.7 SPP 2-16 15.5 3.9 41.3 41.0 93.2 28.5 1.2 SPP 2-18 15.3 2.9 20.7 18.9 61.0 12.2 0.8
NPP 1-fines 46.9 21.0 42.8 41.4 78.3 22.1 17.8 SPP 1-fines 53.9 31.3 24.1 58.0 78.7 31.0 5.9 SPP 2-fines 40.5 13.3 47.8 39.9 75.8 26.8 8.0
a Total uranium determined from Th234 daughter 63 KeV γ-ray emission line assuming secular equilibrium. b Isotopic exchange data from 24-hour time point. c Bicarbonate extraction data from 72-hour time point. d Formate extraction data from 72-hour time point. e AGW 4 extraction data from 72-hour time point. f U(VI) Kd calculated from isotopic exchange at 24-hour time point.
6.20
Distribution coefficients were measured on a larger set of 300 Area Process Pond sediments using the isotopic-exchange approach of Kohler et al. (2004) to estimate a labile or reactive fraction of sorbed U(VI) (Table 6.5 [Zachara et al. 2005]). The reactive fraction of sorbed U(VI) was measured with a 72-hour bicarbonate extraction and 24-hour isotopic exchange with 233U, an isotope that was not present in the 300 Area waste stream. Note that these are operationally defined end-states and that the desorption process actually continues for significantly longer periods. The two methods provided comparable estimates of the reactive fraction, with several exceptions (Table 6.5). The labile fraction in the vadose-zone sediments ranged from 20.7% to 75.7%, with an average of 38.2%. Fines obtained by filtering turbid groundwater also fell within this range. The lability of sorbed U(VI) is dependent on the mass percent of background U in the sample, the speciation of contaminant U(VI), and the distribution of sorbed U(VI) between adsorbed and precipitated phases. Mechanistic causes for the incomplete lability of adsorbed U(VI) have not been resolved and are under continued investigation, as described in Section 10. Both geochemical and mass-transfer effects appear to be at play. Desorption Kd values for labile sorbed U(VI) ranged from a low of 0.5 mL/g to a peak of 27.7 mL/g. The Kd values calculated with the labile fraction are lower than those calculated from the total-sorbed concentration. The highest Kd values in this series (NPP2-2 and NPP2-8) are for sediments that contain precipitated U(VI). Capillary-fringe and “smear-zone” sediments from the North and South Process Ponds (asterisk [*] in Table 6.5) exhibited generally comparable desorption Kd values to the in-situ Kd values computed for LFI core C5000 (Figure 6.13b), and those observed for the H2 formation in C3832.
6.4 Summary and Implications
Field sampling and characterization campaigns have provided important information and knowledge on the apparent migration velocity of contaminant U(VI) originating from different waste sources. Critical uncertainties in evaluating the three cases studied were 1) lack of definitive information on the composition of the released waste stream, 2) unambiguous chromatographic profiles upon which to base defensible conclusions of relative mobility (i.e., core samples below all mobile solutes), and 3) low concentrations of sorbed-contaminant U(VI) that precluded speciation measurements. The following are important conclusions derived from the study of three U(VI)-containing waste sites at Hanford:
• Contaminant U(VI) generally displays moderate-to-high mobility in both the vadose and saturated zone, but its migration is retarded relative to 99Tc(VII).
• Contaminant U(VI) can exist in either adsorbed or precipitated states in Hanford plumes (geochemical speciation), and knowledge regarding this distribution is important to predict future plume evolution. Precipitates are generally present when sorbed U(VI) is greater than 50 µg/g.
• Kd measurements (either in-situ or desorption) provide little insight as to whether sorbed U(VI) exists as an adsorbed or precipitated phase. In-situ Kd determinations (based on water and total contaminant extractions) are relatively similar and consistent between sites, displaying values for contaminant U(VI) that range between 0.25 and 10 mL/g (excluding the C3832 paleosol). Except for special instances, noted variations are not well explained by differences in pore water composition or sediment properties.
• Because of its low sorptivity, contaminant U(VI) can represent a threat to groundwater quality when its sorbed concentration near the water table is two to three times background (e.g., 10-12 µg/g). Two of the vadose-zone plumes (C3832 and 316-1/2) investigated displayed concentrations in this range, and contaminated sediments from these two sites behaved comparably.

6.21
• The mobility of contaminant U(VI) in the waste plume and its current geochemical speciation is strongly dependent on the composition and temperature of the original waste stream, and its total U(VI) concentration. Waste streams with pH and/or temperature that were significantly different from ambient have reacted with the sediment to form precipitated phases that contain U(VI).
• The lability of adsorbed contaminant U(VI) in some waste-plume sediments is limited for reasons that are not understood. The labile fraction is that which is exchangeable with the fluid phase and available for migration if the chemical conditions merit. The labile fraction, and not the total uranium content, should be used when calculating desorption Kd values. Differences in sorbed-U(VI) lability can cause variations of up to four-fold in Kd.
• The concentration of dissolved carbonate/bicarbonate in the fluids contacting uranium-contaminated sediments is the primary factor affecting the rate and extent of sorbed uranium release through its influence on U(VI) aqueous speciation.
• Some subsurface zones can exhibit unusually high retardation factors for contaminant U(VI), such as high-calcite paleosols from the Cold Creek Unit.
• Contaminated sediments from the field must be evaluated in the laboratory with multiple analytical techniques and modeling approaches to determine if existing solute-distribution profiles are representative of current reactive-transport processes or are relict from the original waste-migration event when water was more plentiful and chemical conditions were potentially different.
• Desorption Kd values vary in samples collected through a single vadose-zone plume, as a result of different contributing attenuation processes (e.g., precipitation versus adsorption), and variations in sediment (texture and mineralogy) and pore-water properties that are not well documented or understood. These findings suggest that more robust means are needed to calculate future plume mobility that appropriately account for the nature of the geochemical retardation process and natural variations in pore-water composition and sediment mineralogy and texture.

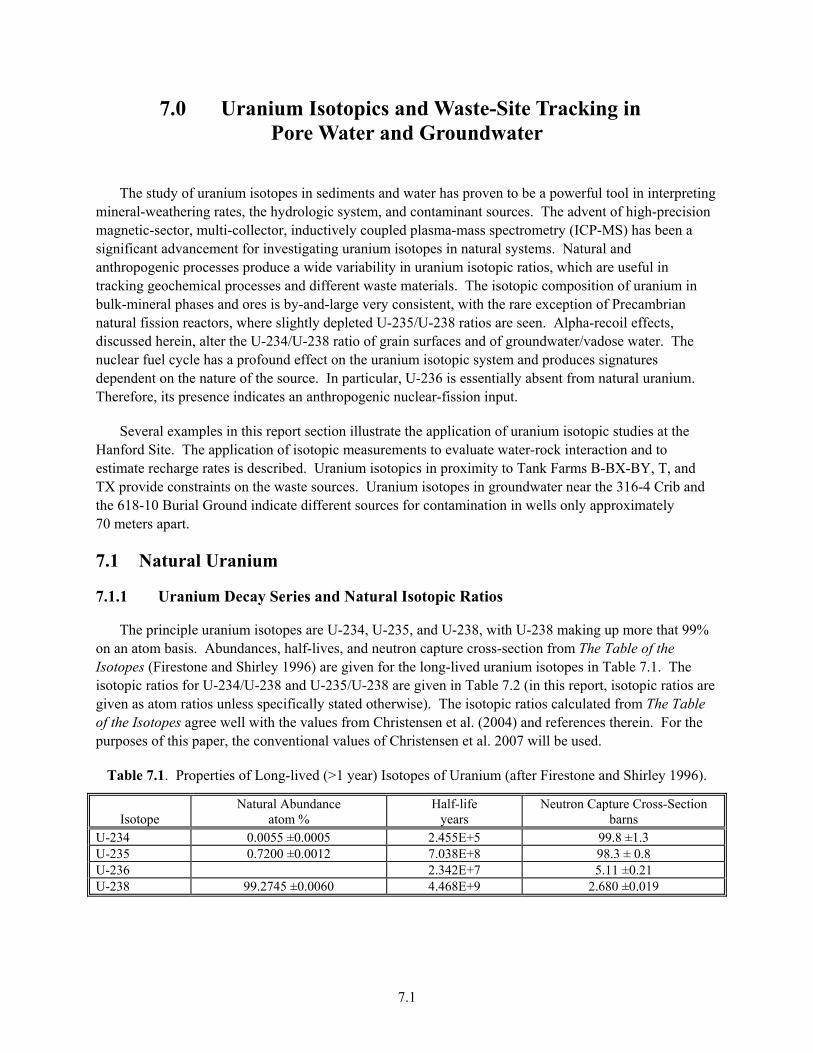
7.1
7.0 Uranium Isotopics and Waste-Site Tracking in Pore Water and Groundwater
The study of uranium isotopes in sediments and water has proven to be a powerful tool in interpreting mineral-weathering rates, the hydrologic system, and contaminant sources. The advent of high-precision magnetic-sector, multi-collector, inductively coupled plasma-mass spectrometry (ICP-MS) has been a significant advancement for investigating uranium isotopes in natural systems. Natural and anthropogenic processes produce a wide variability in uranium isotopic ratios, which are useful in tracking geochemical processes and different waste materials. The isotopic composition of uranium in bulk-mineral phases and ores is by-and-large very consistent, with the rare exception of Precambrian natural fission reactors, where slightly depleted U-235/U-238 ratios are seen. Alpha-recoil effects, discussed herein, alter the U-234/U-238 ratio of grain surfaces and of groundwater/vadose water. The nuclear fuel cycle has a profound effect on the uranium isotopic system and produces signatures dependent on the nature of the source. In particular, U-236 is essentially absent from natural uranium. Therefore, its presence indicates an anthropogenic nuclear-fission input.
Several examples in this report section illustrate the application of uranium isotopic studies at the Hanford Site. The application of isotopic measurements to evaluate water-rock interaction and to estimate recharge rates is described. Uranium isotopics in proximity to Tank Farms B-BX-BY, T, and TX provide constraints on the waste sources. Uranium isotopes in groundwater near the 316-4 Crib and the 618-10 Burial Ground indicate different sources for contamination in wells only approximately 70 meters apart.
7.1 Natural Uranium
7.1.1 Uranium Decay Series and Natural Isotopic Ratios
The principle uranium isotopes are U-234, U-235, and U-238, with U-238 making up more that 99% on an atom basis. Abundances, half-lives, and neutron capture cross-section from The Table of the Isotopes (Firestone and Shirley 1996) are given for the long-lived uranium isotopes in Table 7.1. The isotopic ratios for U-234/U-238 and U-235/U-238 are given in Table 7.2 (in this report, isotopic ratios are given as atom ratios unless specifically stated otherwise). The isotopic ratios calculated from The Table of the Isotopes agree well with the values from Christensen et al. (2004) and references therein. For the purposes of this paper, the conventional values of Christensen et al. 2007 will be used.
Table 7.1. Properties of Long-lived (>1 year) Isotopes of Uranium (after Firestone and Shirley 1996).
Isotope Natural Abundance
atom % Half-life
years Neutron Capture Cross-Section
barns U-234 0.0055 ±0.0005 2.455E+5 99.8 ±1.3 U-235 0.7200 ±0.0012 7.038E+8 98.3 ± 0.8 U-236 2.342E+7 5.11 ±0.21 U-238 99.2745 ±0.0060 4.468E+9 2.680 ±0.019
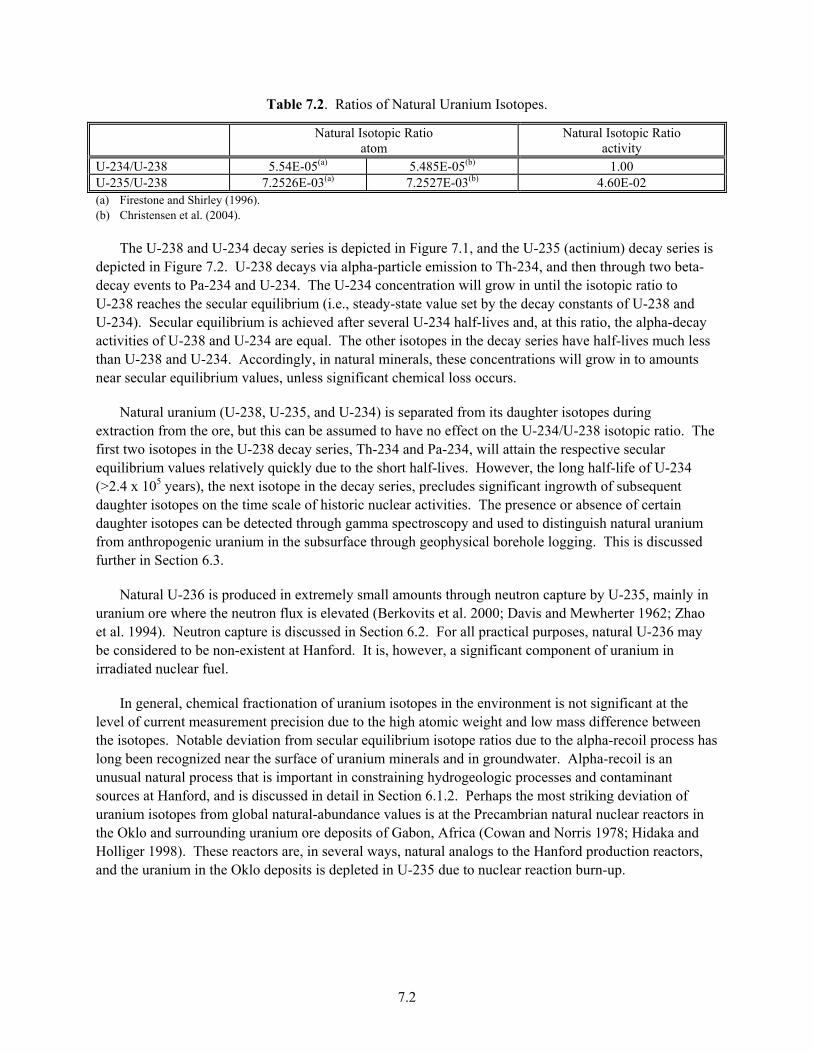
7.2
Table 7.2. Ratios of Natural Uranium Isotopes.
Natural Isotopic Ratio atom
Natural Isotopic Ratio activity
U-234/U-238 5.54E-05(a) 5.485E-05(b) 1.00 U-235/U-238 7.2526E-03(a) 7.2527E-03(b) 4.60E-02 (a) Firestone and Shirley (1996). (b) Christensen et al. (2004).
The U-238 and U-234 decay series is depicted in Figure 7.1, and the U-235 (actinium) decay series is depicted in Figure 7.2. U-238 decays via alpha-particle emission to Th-234, and then through two beta-decay events to Pa-234 and U-234. The U-234 concentration will grow in until the isotopic ratio to U-238 reaches the secular equilibrium (i.e., steady-state value set by the decay constants of U-238 and U-234). Secular equilibrium is achieved after several U-234 half-lives and, at this ratio, the alpha-decay activities of U-238 and U-234 are equal. The other isotopes in the decay series have half-lives much less than U-238 and U-234. Accordingly, in natural minerals, these concentrations will grow in to amounts near secular equilibrium values, unless significant chemical loss occurs.
Natural uranium (U-238, U-235, and U-234) is separated from its daughter isotopes during extraction from the ore, but this can be assumed to have no effect on the U-234/U-238 isotopic ratio. The first two isotopes in the U-238 decay series, Th-234 and Pa-234, will attain the respective secular equilibrium values relatively quickly due to the short half-lives. However, the long half-life of U-234 (>2.4 x 10⁵ years), the next isotope in the decay series, precludes significant ingrowth of subsequent daughter isotopes on the time scale of historic nuclear activities. The presence or absence of certain daughter isotopes can be detected through gamma spectroscopy and used to distinguish natural uranium from anthropogenic uranium in the subsurface through geophysical borehole logging. This is discussed further in Section 6.3.
Natural U-236 is produced in extremely small amounts through neutron capture by U-235, mainly in uranium ore where the neutron flux is elevated (Berkovits et al. 2000; Davis and Mewherter 1962; Zhao et al. 1994). Neutron capture is discussed in Section 6.2. For all practical purposes, natural U-236 may be considered to be non-existent at Hanford. It is, however, a significant component of uranium in irradiated nuclear fuel.
In general, chemical fractionation of uranium isotopes in the environment is not significant at the level of current measurement precision due to the high atomic weight and low mass difference between the isotopes. Notable deviation from secular equilibrium isotope ratios due to the alpha-recoil process has long been recognized near the surface of uranium minerals and in groundwater. Alpha-recoil is an unusual natural process that is important in constraining hydrogeologic processes and contaminant sources at Hanford, and is discussed in detail in Section 6.1.2. Perhaps the most striking deviation of uranium isotopes from global natural-abundance values is at the Precambrian natural nuclear reactors in the Oklo and surrounding uranium ore deposits of Gabon, Africa (Cowan and Norris 1978; Hidaka and Holliger 1998). These reactors are, in several ways, natural analogs to the Hanford production reactors, and the uranium in the Oklo deposits is depleted in U-235 due to nuclear reaction burn-up.
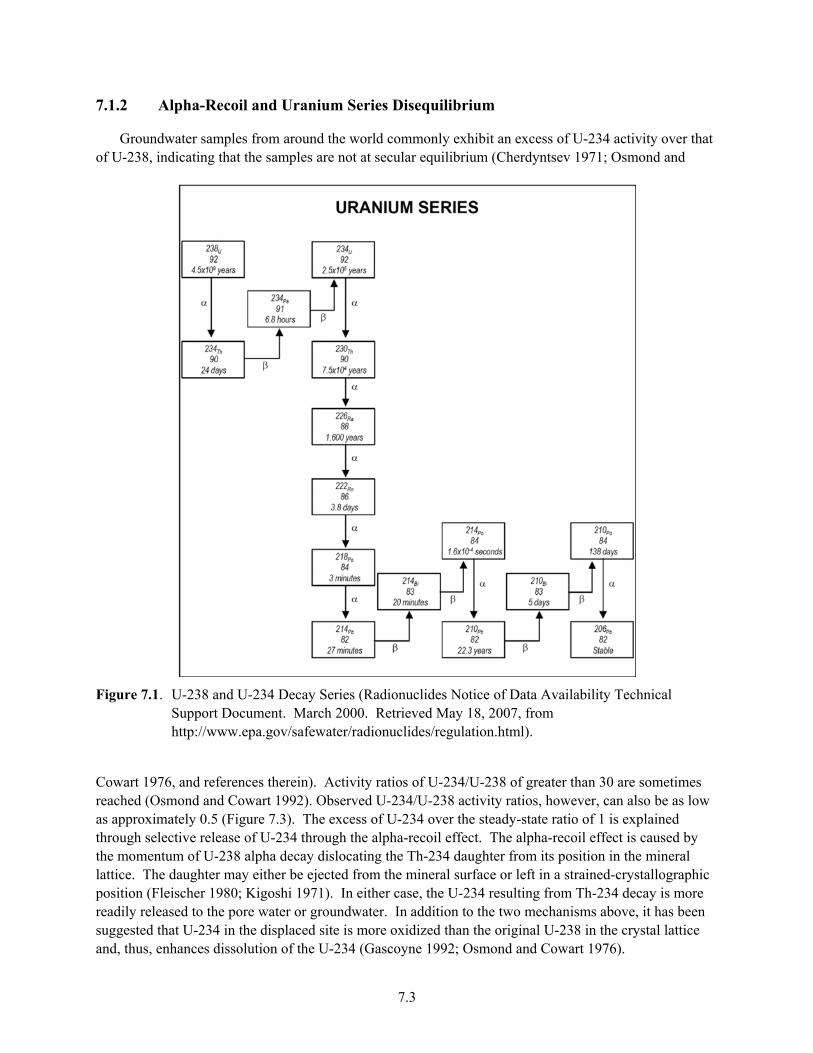
7.3
7.1.2 Alpha-Recoil and Uranium Series Disequilibrium
Groundwater samples from around the world commonly exhibit an excess of U-234 activity over that of U-238, indicating that the samples are not at secular equilibrium (Cherdyntsev 1971; Osmond and
Figure 7.1. U-238 and U-234 Decay Series (Radionuclides Notice of Data Availability Technical
Support Document. March 2000. Retrieved May 18, 2007, from http://www.epa.gov/safewater/radionuclides/regulation.html).
Cowart 1976, and references therein). Activity ratios of U-234/U-238 of greater than 30 are sometimes reached (Osmond and Cowart 1992). Observed U-234/U-238 activity ratios, however, can also be as low as approximately 0.5 (Figure 7.3). The excess of U-234 over the steady-state ratio of 1 is explained through selective release of U-234 through the alpha-recoil effect. The alpha-recoil effect is caused by the momentum of U-238 alpha decay dislocating the Th-234 daughter from its position in the mineral lattice. The daughter may either be ejected from the mineral surface or left in a strained-crystallographic position (Fleischer 1980; Kigoshi 1971). In either case, the U-234 resulting from Th-234 decay is more readily released to the pore water or groundwater. In addition to the two mechanisms above, it has been suggested that U-234 in the displaced site is more oxidized than the original U-238 in the crystal lattice and, thus, enhances dissolution of the U-234 (Gascoyne 1992; Osmond and Cowart 1976).
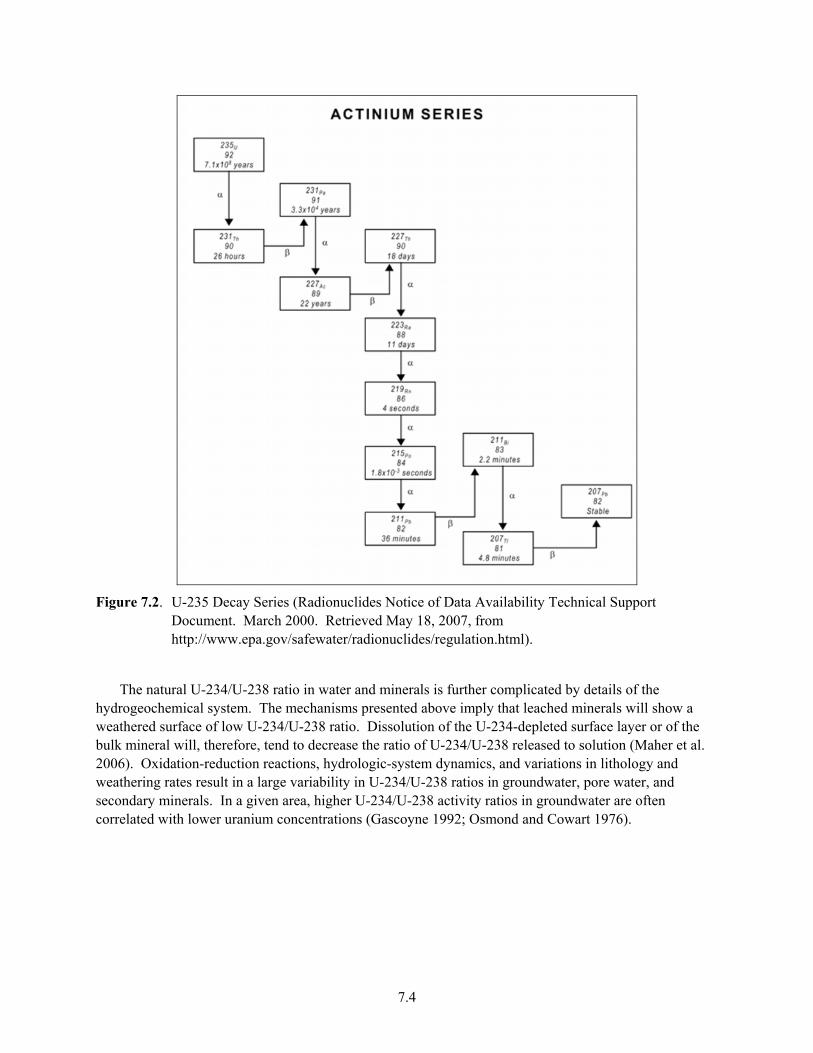
7.4
Figure 7.2. U-235 Decay Series (Radionuclides Notice of Data Availability Technical Support
Document. March 2000. Retrieved May 18, 2007, from http://www.epa.gov/safewater/radionuclides/regulation.html).
The natural U-234/U-238 ratio in water and minerals is further complicated by details of the hydrogeochemical system. The mechanisms presented above imply that leached minerals will show a weathered surface of low U-234/U-238 ratio. Dissolution of the U-234-depleted surface layer or of the bulk mineral will, therefore, tend to decrease the ratio of U-234/U-238 released to solution (Maher et al. 2006). Oxidation-reduction reactions, hydrologic-system dynamics, and variations in lithology and weathering rates result in a large variability in U-234/U-238 ratios in groundwater, pore water, and secondary minerals. In a given area, higher U-234/U-238 activity ratios in groundwater are often correlated with lower uranium concentrations (Gascoyne 1992; Osmond and Cowart 1976).
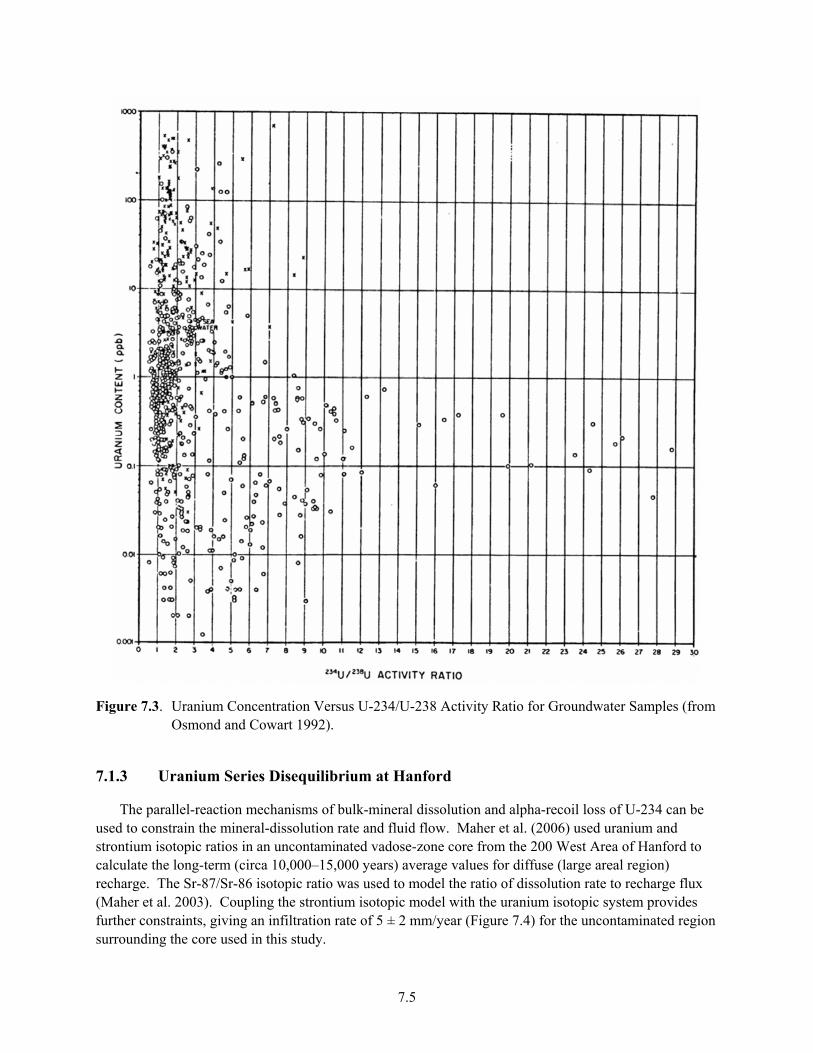
7.5
Figure 7.3. Uranium Concentration Versus U-234/U-238 Activity Ratio for Groundwater Samples (from
Osmond and Cowart 1992).
7.1.3 Uranium Series Disequilibrium at Hanford
The parallel-reaction mechanisms of bulk-mineral dissolution and alpha-recoil loss of U-234 can be used to constrain the mineral-dissolution rate and fluid flow. Maher et al. (2006) used uranium and strontium isotopic ratios in an uncontaminated vadose-zone core from the 200 West Area of Hanford to calculate the long-term (circa 10,000–15,000 years) average values for diffuse (large areal region) recharge. The Sr-87/Sr-86 isotopic ratio was used to model the ratio of dissolution rate to recharge flux (Maher et al. 2003). Coupling the strontium isotopic model with the uranium isotopic system provides further constraints, giving an infiltration rate of 5 ± 2 mm/year (Figure 7.4) for the uncontaminated region surrounding the core used in this study.

7.6
a.) b.)
Figure 7.4. (a) Model for Pore Water (U-234/U-238) (b) Model for U infiltration Flux and Bulk Mineral
Dissolution Rate, Skf, Compared to Rates from Sr Isotopes. The two models are consistent with an infiltration rate of 5 ± 2 mm/year (from Maher et al. 2006).
The U-234/U-238 activity ratio versus concentration for Hanford groundwater samples with detectable isotopic uranium extracted from the Hanford Environmental Information System (HEIS) database1 (Friday 2004), Figure 7.5, appears similar to the data presented in Figure 7.3, in spite of the presence of contaminant uranium at Hanford that likely includes irradiated fuel, enriched uranium, and depleted uranium sources. It should be noted that the groundwater samples are by-and-large analyzed for uranium isotopes using alpha spectroscopy and, in some cases, considerable variability can be seen in individual samples from a given well through time. It may be valuable to evaluate the regional uranium isotopic distribution using more precise mass-spectrometry methods.
7.2 Hanford Nuclear Reactors and Operations
The dominant use of uranium at the Hanford Site was in reactor fuel for plutonium production and, to a lesser extent, energy generation. Reactor operations began in 1944 and continued until 1987 ( DOE/RL 1996a). In addition, limited irradiation of Th-232 was performed to produce U-233. The major thorium campaigns were performed in 1966 and 1970, although thorium irradiation was also performed as early as 1946 (Gydesen 1954). Thorium was apparently used both to “flatten” the neutron flux through the reactor and for U-233 production.
1 HEIS database—retrieved May 22, 2007.

7.7
Hanford Groundwater Isotopic Uranium
0.001
0.01
0.1
1
10
100
1000
10000
0 1 2 3 4 5 6 7 8 9 10 11 12 13 14
U-234/U-238 Activity Ratio
Ura
nium
Con
cent
ratio
n (u
g/L)
Figure 7.5. Uranium Concentration Versus U-234/U-238 Activity Ratio for Hanford Groundwater
Samples (post 1990 well data with detectable activities).
Fission of U-235 is the basis for nuclear-reactor operations and the production of plutonium at Hanford. When criticality is achieved in the reactors, a sustainable flux of neutrons from U-235 fission is produced. The neutron energy is reduced to the thermal range by the graphite moderator. Neutrons in excess of those sustaining the fission reaction are captured by other nuclei, including U-238, which produces Pu-239 through the reaction:
238U + n → 239U → 239Np + β- → 239Pu + β-
The propensity of U-238, or other isotopes, to capture neutrons is given by its neutron-capture cross-section, measured in the units of barns (Table 7.1).
Pu-239 is also fissile and increasingly contributes to the nuclear reaction as it is produced. In addition, Pu-239 will capture neutrons, producing Pu-240. The amount of Pu-240 in the “weapons-grade plutonium” product needed to be controlled to less than 7% by weight (DOE/RL 1996a). The basic control was to cycle “low burn-up” fuel out of the reactors relatively quickly, compared to reactors operated to maximize power production. The earliest weapons-grade plutonium production used a very short cycle. With experience, the cycle was optimized to maximize plutonium production while maintaining product specifications. In addition, some variability in the production cycle occurred for research, special production, or when reactors were shut down prematurely due to fuel-element failures.
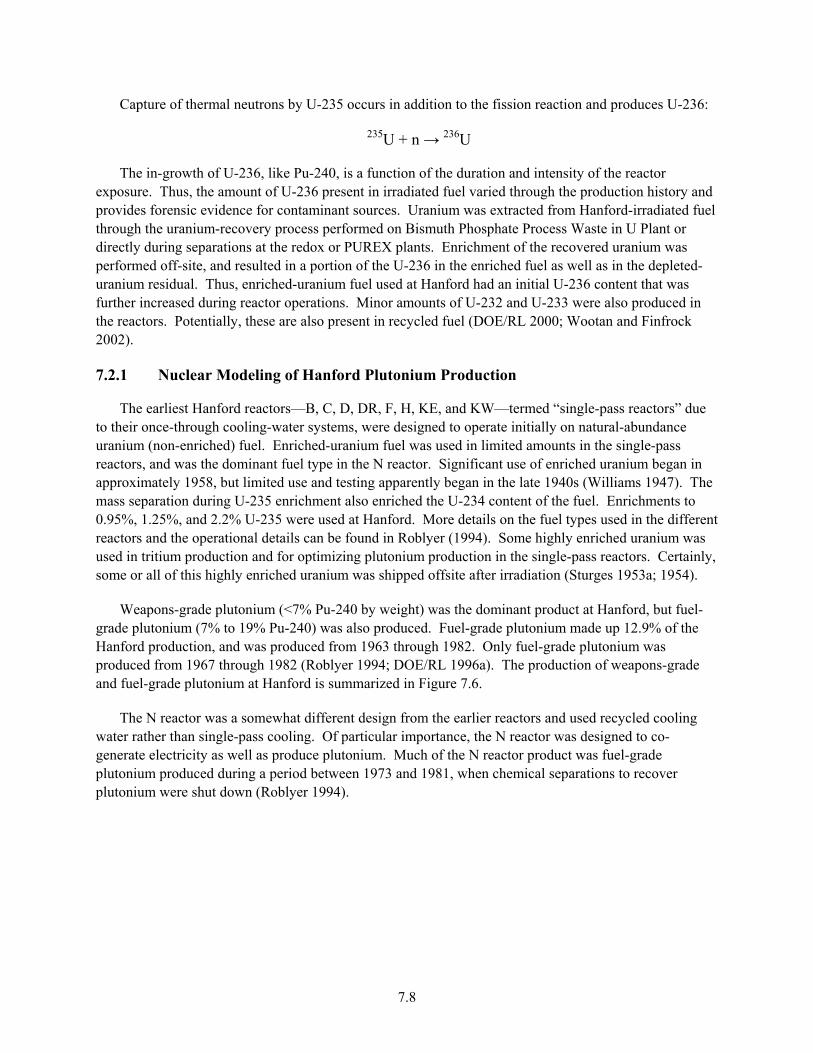
7.8
Capture of thermal neutrons by U-235 occurs in addition to the fission reaction and produces U-236:
235U + n → 236U
The in-growth of U-236, like Pu-240, is a function of the duration and intensity of the reactor exposure. Thus, the amount of U-236 present in irradiated fuel varied through the production history and provides forensic evidence for contaminant sources. Uranium was extracted from Hanford-irradiated fuel through the uranium-recovery process performed on Bismuth Phosphate Process Waste in U Plant or directly during separations at the redox or PUREX plants. Enrichment of the recovered uranium was performed off-site, and resulted in a portion of the U-236 in the enriched fuel as well as in the depleted-uranium residual. Thus, enriched-uranium fuel used at Hanford had an initial U-236 content that was further increased during reactor operations. Minor amounts of U-232 and U-233 were also produced in the reactors. Potentially, these are also present in recycled fuel (DOE/RL 2000; Wootan and Finfrock 2002).
7.2.1 Nuclear Modeling of Hanford Plutonium Production
The earliest Hanford reactors—B, C, D, DR, F, H, KE, and KW—termed “single-pass reactors” due to their once-through cooling-water systems, were designed to operate initially on natural-abundance uranium (non-enriched) fuel. Enriched-uranium fuel was used in limited amounts in the single-pass reactors, and was the dominant fuel type in the N reactor. Significant use of enriched uranium began in approximately 1958, but limited use and testing apparently began in the late 1940s (Williams 1947). The mass separation during U-235 enrichment also enriched the U-234 content of the fuel. Enrichments to 0.95%, 1.25%, and 2.2% U-235 were used at Hanford. More details on the fuel types used in the different reactors and the operational details can be found in Roblyer (1994). Some highly enriched uranium was used in tritium production and for optimizing plutonium production in the single-pass reactors. Certainly, some or all of this highly enriched uranium was shipped offsite after irradiation (Sturges 1953a; 1954).
Weapons-grade plutonium (<7% Pu-240 by weight) was the dominant product at Hanford, but fuel-grade plutonium (7% to 19% Pu-240) was also produced. Fuel-grade plutonium made up 12.9% of the Hanford production, and was produced from 1963 through 1982. Only fuel-grade plutonium was produced from 1967 through 1982 (Roblyer 1994; DOE/RL 1996a). The production of weapons-grade and fuel-grade plutonium at Hanford is summarized in Figure 7.6.
The N reactor was a somewhat different design from the earlier reactors and used recycled cooling water rather than single-pass cooling. Of particular importance, the N reactor was designed to co-generate electricity as well as produce plutonium. Much of the N reactor product was fuel-grade plutonium produced during a period between 1973 and 1981, when chemical separations to recover plutonium were shut down (Roblyer 1994).

7.9
Figure 7.6. Plutonium Production at Hanford (from DOE/RL 1996a).
The differences in fuel type, reactor type, and fuel burn-up (including the extent of fission and of neutron capture) led to highly variable uranium isotopic composition of the irradiated fuel. The isotopic composition of Hanford-irradiated fuel was modeled using the ORIGEN2 and DKPRO codes by Watrous and Wootan (1997), and subsequently updated by Wootan and Finfrock (2002). The ORIGEN2 code provided isotopic inventories for different reactor exposures and fuel types. Then, the DKPRO code interpolated compositions of fuel batches based on the ORIGEN2 results. DKPRO also performed decay corrections and, in Wootan and Finfrock (2002), split the inventories into fuel-separation waste and cladding waste. Neither the decay correction nor the chemical separations are significant when considering the ratios of uranium isotopes in Hanford waste streams—the decay correction is minor due to the long half-life of uranium and no isotope fractionation will occur in the separations process. The nuclear model results were categorized, based on separations plant, predominant fuel enrichment, and cladding type. The model output included inventories of the uranium isotopes U-232 through U-236 and U-238 (in curies), from which isotopic ratios (atom ratios) can be calculated.
The Hanford Site reactor fuels were classified into six types for the purposes of modeling the radionuclide inventories (Table 7.3). The initial uranium isotopic compositions assigned to those fuel types in Wootan and Finfrock (2002) are given in (Table 7.4). Note that the initial U-236 content of the enriched fuel is time-dependent and the values given are approximations for each period. The model input assumes that enriched uranium was processed in separate processing batches, consistent with the limited documentation reviewed. Apparently, most of the enriched uranium was recovered and transported offsite (Lehfeldt 1957). Some enriched uranium was discharged in Hanford waste streams, with a probable certain degree of mixing between fuel types. The uncertainties in the modeled inventory outputs have not been quantified, but are discussed qualitatively in Watrous and Wootan (1997) and Wootan and Finfrock (2002).
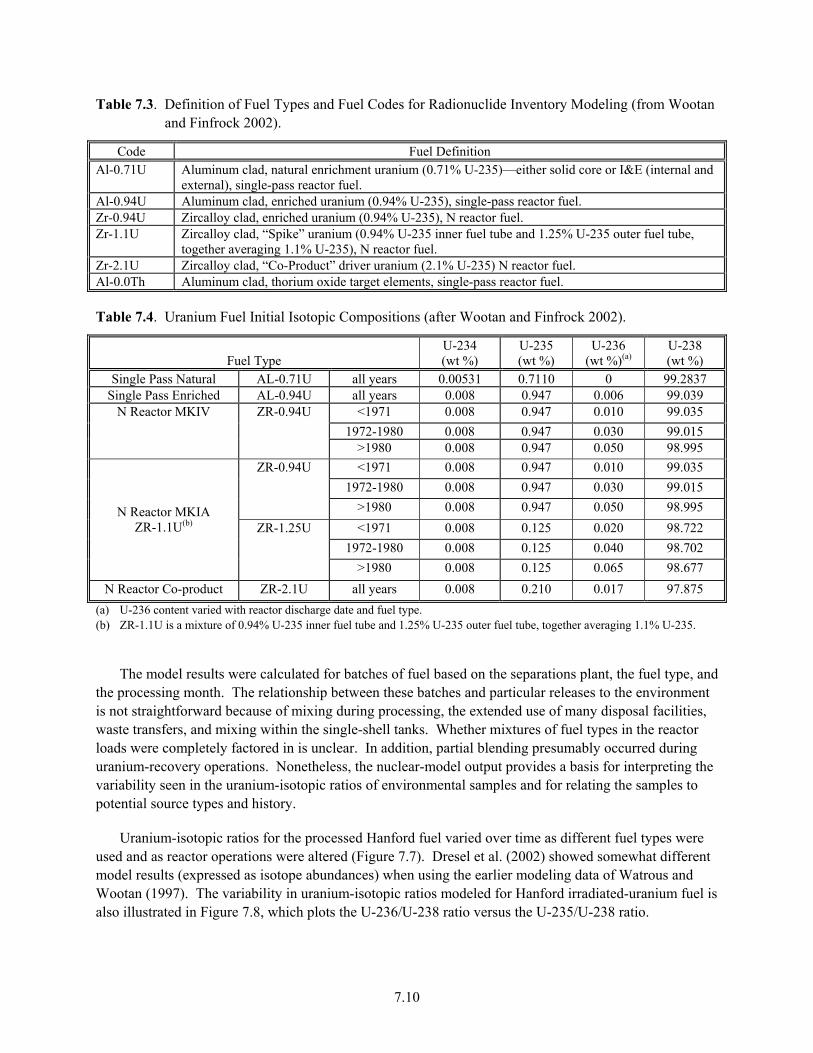
7.10
Table 7.3. Definition of Fuel Types and Fuel Codes for Radionuclide Inventory Modeling (from Wootan and Finfrock 2002).
Code Fuel Definition Al-0.71U Aluminum clad, natural enrichment uranium (0.71% U-235)—either solid core or I&E (internal and
external), single-pass reactor fuel. Al-0.94U Aluminum clad, enriched uranium (0.94% U-235), single-pass reactor fuel. Zr-0.94U Zircalloy clad, enriched uranium (0.94% U-235), N reactor fuel. Zr-1.1U Zircalloy clad, “Spike” uranium (0.94% U-235 inner fuel tube and 1.25% U-235 outer fuel tube,
together averaging 1.1% U-235), N reactor fuel. Zr-2.1U Zircalloy clad, “Co-Product” driver uranium (2.1% U-235) N reactor fuel. Al-0.0Th Aluminum clad, thorium oxide target elements, single-pass reactor fuel.
Table 7.4. Uranium Fuel Initial Isotopic Compositions (after Wootan and Finfrock 2002).
Fuel Type U-234 (wt %)
U-235 (wt %)
U-236 (wt %)(a)
U-238 (wt %)
Single Pass Natural AL-0.71U all years 0.00531 0.7110 0 99.2837 Single Pass Enriched AL-0.94U all years 0.008 0.947 0.006 99.039
<1971 0.008 0.947 0.010 99.035 1972-1980 0.008 0.947 0.030 99.015
N Reactor MKIV ZR-0.94U
>1980 0.008 0.947 0.050 98.995 <1971 0.008 0.947 0.010 99.035
1972-1980 0.008 0.947 0.030 99.015 ZR-0.94U
>1980 0.008 0.947 0.050 98.995 <1971 0.008 0.125 0.020 98.722
1972-1980 0.008 0.125 0.040 98.702
N Reactor MKIA ZR-1.1U(b) ZR-1.25U
>1980 0.008 0.125 0.065 98.677 N Reactor Co-product ZR-2.1U all years 0.008 0.210 0.017 97.875
(a) U-236 content varied with reactor discharge date and fuel type. (b) ZR-1.1U is a mixture of 0.94% U-235 inner fuel tube and 1.25% U-235 outer fuel tube, together averaging 1.1% U-235.
The model results were calculated for batches of fuel based on the separations plant, the fuel type, and the processing month. The relationship between these batches and particular releases to the environment is not straightforward because of mixing during processing, the extended use of many disposal facilities, waste transfers, and mixing within the single-shell tanks. Whether mixtures of fuel types in the reactor loads were completely factored in is unclear. In addition, partial blending presumably occurred during uranium-recovery operations. Nonetheless, the nuclear-model output provides a basis for interpreting the variability seen in the uranium-isotopic ratios of environmental samples and for relating the samples to potential source types and history.
Uranium-isotopic ratios for the processed Hanford fuel varied over time as different fuel types were used and as reactor operations were altered (Figure 7.7). Dresel et al. (2002) showed somewhat different model results (expressed as isotope abundances) when using the earlier modeling data of Watrous and Wootan (1997). The variability in uranium-isotopic ratios modeled for Hanford irradiated-uranium fuel is also illustrated in Figure 7.8, which plots the U-236/U-238 ratio versus the U-235/U-238 ratio.
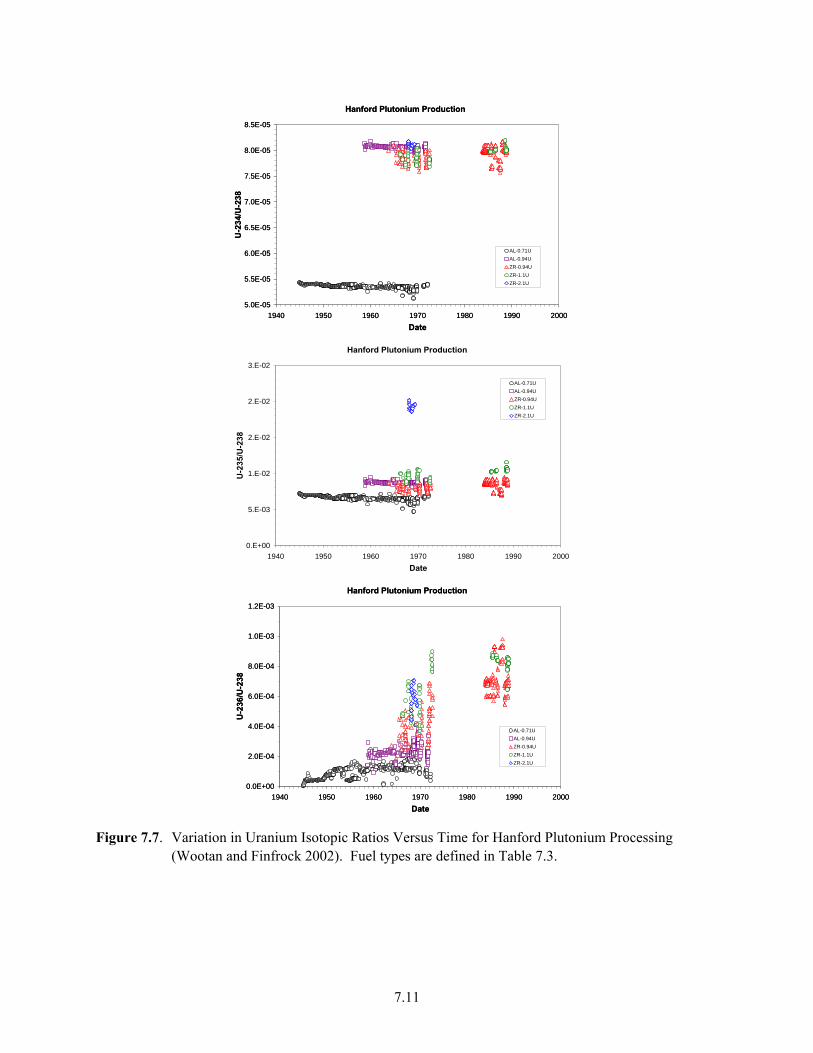
7.11
Hanford Plutonium Production
5.0E-05
5.5E-05
6.0E-05
6.5E-05
7.0E-05
7.5E-05
8.0E-05
8.5E-05
1940 1950 1960 1970 1980 1990 2000Date
U-2
34/U
-238
AL-0.71UAL-0.94UZR-0.94UZR-1.1UZR-2.1U
Hanford Plutonium Production
0.E+00
5.E-03
1.E-02
2.E-02
2.E-02
3.E-02
1940 1950 1960 1970 1980 1990 2000Date
U-2
35/U
-238
AL-0.71UAL-0.94UZR-0.94UZR-1.1UZR-2.1U
Hanford Plutonium Production
0.0E+00
2.0E-04
4.0E-04
6.0E-04
8.0E-04
1.0E-03
1.2E-03
1940 1950 1960 1970 1980 1990 2000Date
U-2
36/U
-238
AL-0.71UAL-0.94UZR-0.94UZR-1.1UZR-2.1U
Hanford Plutonium Production
5.0E-05
5.5E-05
6.0E-05
6.5E-05
7.0E-05
7.5E-05
8.0E-05
8.5E-05
1940 1950 1960 1970 1980 1990 2000Date
U-2
34/U
-238
AL-0.71UAL-0.94UZR-0.94UZR-1.1UZR-2.1U
Hanford Plutonium Production
0.E+00
5.E-03
1.E-02
2.E-02
2.E-02
3.E-02
1940 1950 1960 1970 1980 1990 2000Date
U-2
35/U
-238
AL-0.71UAL-0.94UZR-0.94UZR-1.1UZR-2.1U
Hanford Plutonium Production
0.0E+00
2.0E-04
4.0E-04
6.0E-04
8.0E-04
1.0E-03
1.2E-03
1940 1950 1960 1970 1980 1990 2000Date
U-2
36/U
-238
AL-0.71UAL-0.94UZR-0.94UZR-1.1UZR-2.1U
Figure 7.7. Variation in Uranium Isotopic Ratios Versus Time for Hanford Plutonium Processing
(Wootan and Finfrock 2002). Fuel types are defined in Table 7.3.
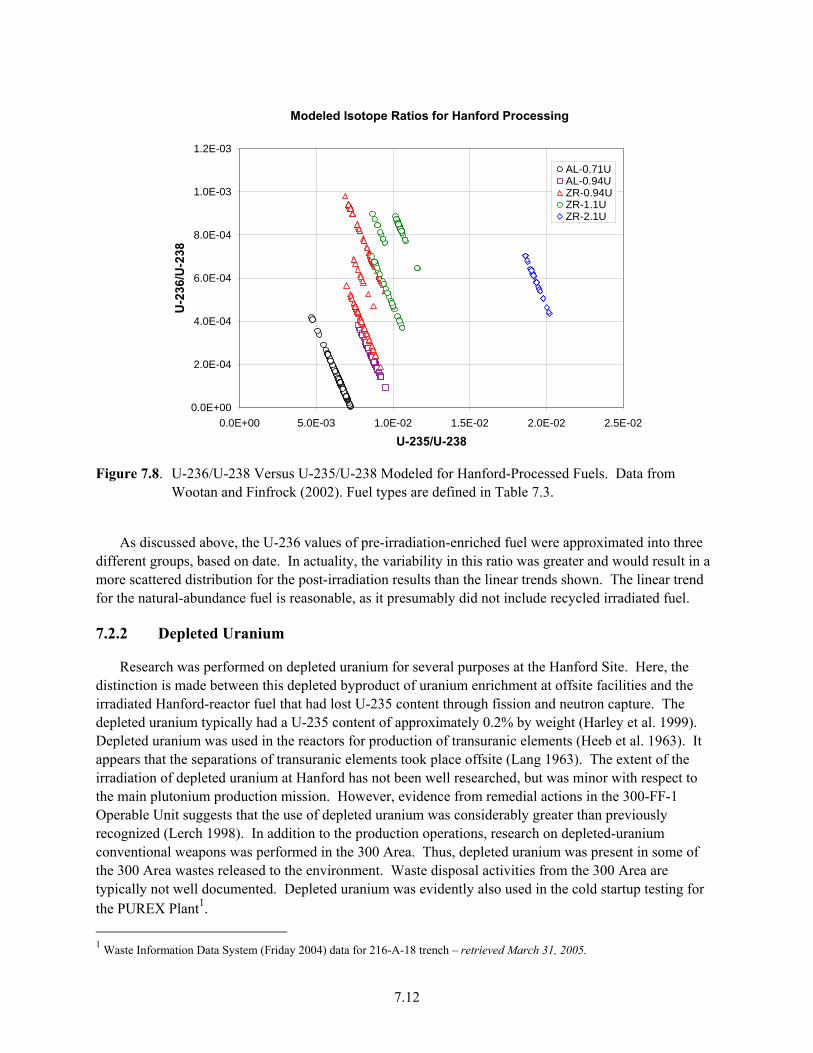
7.12
Modeled Isotope Ratios for Hanford Processing
0.0E+00
2.0E-04
4.0E-04
6.0E-04
8.0E-04
1.0E-03
1.2E-03
0.0E+00 5.0E-03 1.0E-02 1.5E-02 2.0E-02 2.5E-02
U-235/U-238
U-2
36/U
-238
AL-0.71UAL-0.94UZR-0.94UZR-1.1UZR-2.1U
Figure 7.8. U-236/U-238 Versus U-235/U-238 Modeled for Hanford-Processed Fuels. Data from
Wootan and Finfrock (2002). Fuel types are defined in Table 7.3.
As discussed above, the U-236 values of pre-irradiation-enriched fuel were approximated into three different groups, based on date. In actuality, the variability in this ratio was greater and would result in a more scattered distribution for the post-irradiation results than the linear trends shown. The linear trend for the natural-abundance fuel is reasonable, as it presumably did not include recycled irradiated fuel.
7.2.2 Depleted Uranium
Research was performed on depleted uranium for several purposes at the Hanford Site. Here, the distinction is made between this depleted byproduct of uranium enrichment at offsite facilities and the irradiated Hanford-reactor fuel that had lost U-235 content through fission and neutron capture. The depleted uranium typically had a U-235 content of approximately 0.2% by weight (Harley et al. 1999). Depleted uranium was used in the reactors for production of transuranic elements (Heeb et al. 1963). It appears that the separations of transuranic elements took place offsite (Lang 1963). The extent of the irradiation of depleted uranium at Hanford has not been well researched, but was minor with respect to the main plutonium production mission. However, evidence from remedial actions in the 300-FF-1 Operable Unit suggests that the use of depleted uranium was considerably greater than previously recognized (Lerch 1998). In addition to the production operations, research on depleted-uranium conventional weapons was performed in the 300 Area. Thus, depleted uranium was present in some of the 300 Area wastes released to the environment. Waste disposal activities from the 300 Area are typically not well documented. Depleted uranium was evidently also used in the cold startup testing for the PUREX Plant1. 1 Waste Information Data System (Friday 2004) data for 216-A-18 trench – retrieved March 31, 2005.
7.13
7.2.3 Uranium-233 and Tritium Production
U-233 was produced at Hanford through irradiation of Th-232 fuel elements. The major thorium campaigns were performed in 1966 and 1970, although thorium irradiation was also performed as early as 1946 (Gydesen 1954). The thorium for the 1966 and 1970 campaigns was processed at the PUREX Plant. The thorium fuel for the major campaigns was included in the nuclear modeling of Wootan and Finfrock (2002), but was only a minor contributor of uranium to the Hanford waste streams, and is not discussed further in this report. U-232 was a significant contaminant in the U-233 due to its higher specific activity. An important implication for the potential presence of U-233 in environmental contamination at Hanford is that care should be taken if U-233 is used as an internal standard or spike for uranium isotopic analysis (e.g., the methods of Dresel et al. 2002).
Uranium, with a relatively high enrichment, was used in some of the early thorium irradiation as well as in manufacture of “co-product,” such as tritium (Callen 1955; Sturges 1953a). Much, if not all, of that irradiated, highly enriched uranium was shipped offsite and, thus, is not likely to be significant in evaluating Hanford subsurface contamination (Sturges 1953b).
7.3 Analytical Methods
The majority of historical soil and groundwater-monitoring data for uranium isotopes at Hanford has been performed using alpha spectroscopy. This radiochemical method has several shortcomings for environmental studies. First, the method uncertainties are excessively large for some applications. This is particularly true for U-235, which is commonly present at levels near the detection limit in groundwater samples. Secondly, U-236 is not reported in the analysis due to peak overlap with U-235. Measuring the U-236 concentration is valuable because it is not naturally occurring and, thus, provides a signature for anthropogenic uranium sources. In addition, the alpha-peak overlap means that U-235 will be over-reported for samples containing U-236. As the U-234 and U-238 activity levels are comparable, with the exception of the alpha-recoil effects, the U-234/U-238 isotopic ratio from alpha spectroscopy analysis is likely reasonably accurate, provided there is sufficient uranium present in the sample.
Uranium-isotopic measurements on soils at Hanford have also been reported using low-energy photon analysis (Poston 1990). In that case, only U-235 and U-238 were reported.
Limited results for uranium isotopic analysis by thermal ionization mass spectrometry (TIMS) have been reported for Hanford environmental samples (Jaquish 1989; Poston 1990). TIMS has long been considered to provide the most precise uranium-isotopic determinations, but is now being largely supplanted by multi-collector (ICP-MS) (Christensen et al. 2004).
Uranium-isotopic analysis of Hanford groundwater samples by quadrupole ICP-MS were reported by Dresel et al. (2002). The uranium was loaded onto a 20–50 micron-sized Eichrome® TRU resin FPS. The uranium was then stripped from the column using 10 mL of 0.05-M oxalic acid and injected into the ICP-MS. Sample measurements were corrected for background counts, a blank subtraction applied, and a correction based on the mass response of a known standard was calculated. Concentrations of individual isotopes were calculated by comparison of the isotope response in the sample to a uranium-233 internal standard. Analytical uncertainties were approximately 1% (±1σ).

7.14
Multi-collector ICP-MS measurements of uranium-isotopic ratios offer higher precision than quadrupole ICP-MS measurements. Christensen et al. (2004) reported multi-collector ICP-MS analyses of vadose–zone-sediment water extracts and groundwater samples from the 200 East Area of the Hanford Site. The uranium was separated using Eichrome® TRU-SPEC resin, and then introduced to the ICP-MS with a desolvation system equipped with a low-uptake micro-concentric nebulizer. Measurements of U-235 and U-238 were performed on separate Faraday cups, and U-234 and U-236 were measured on a Daly ion-counting system. Two separate measurement routines were used, one for U-235/U-238 and U-234/U-238 ratios, and a second for U-236/U238 ratios. Ratios were corrected for mass fractionation, peak tailing under mass 236, and normalized to the natural U-235/U-238 ratio of an external standard using an exponential mass fractionation law (Hart and Zindler 1989). Typical precision for U-235/U-238 is ≤ ±0.05% 2σ, while for U-234/U-238, it is ±0.15% 2σ. The U-236/U-238 can be measured with ±0.15% 2s precision down to the 10-7 range, where precision degrades by an approximate factor of 10 with a minimum measurable ratio of approximately 2x10⁻⁸.
Spectral gamma logging of uranium in boreholes at Hanford is performed on an ongoing basis (Hartman et al. 2007). Gamma emissions from the decay of uranium isotopes are generally of too-low energy and activity to detect in borehole geophysical logging, so logging of uranium is based on gamma emissions from daughter isotopes. Conventional spectral gamma logs use Bi-214 to quantify uranium. Anthropogenic uranium (e.g., reactor fuel) is separated from the gamma-emitting daughter products. The daughters past U-234 in the U-238 decay series, including Bi-214, are slow to grow back in and, thus, will not be detected where anthropogenic uranium is present (see Figure 7.1). The metastable energy state of the second decay product of U-238, Pa-234m, reaches secular equilibrium with U-238 in less than a year, and can be detected through cased boreholes using gamma spectroscopy. Using a high-resolution, high-purity germanium detector, U-238 can be quantified through Pa-234m, albeit at detection limits elevated above background uranium values (typical detection limits for anthropogenic uranium of 15-20 pCi/g). Accordingly, detection of Pa-234m indicates the presence of anthropogenic uranium and, conversely, detection of slowly equilibrating isotopes, including Bi-214, indicates natural uranium that has not been separated from its gamma-emitting daughters. At sufficiently high levels, U-235 can also be detected with the high-resolution logging system directly through one of its gamma emissions. Therefore, U-235/U-238 activity ratios can be estimated (Hartman et al. 2007; McCain et al. 2006).
The application of spectral gamma logging for uranium isotopic measurements in vadose-zone boreholes is controversial. The uncertainties in the counting statistics lead to large error bars and considerable scatter in the data. It is possible that systematic errors are introduced by corrections applied for casing thickness and differences in borehole-completion methods (i.e., placement of bentonite and/or cement between the casing and the formation). To some degree, the random errors are counteracted by the ease of collecting large numbers of data points.
7.4 WMA-B-BX-BY
The underground single-shell radioactive waste tanks and ancillary equipment (e.g., pipelines and diversion boxes) in the B, BX, and BY Tank Farms comprise the Resource Conservation and Recovery Act (RCRA) Waste Management Area (WMA) B-BX-BY. WMA-B-BX-BY is located in the northwestern part of the 200 East Area, and the groundwater in that region makes up the 200-BP-5 Comprehensive Environmental Response, Compensation, and Liability Act (CERCLA) Operable Unit. As shown in Figure 7.9, a groundwater-uranium plume is located in this vicinity with the highest concentrations found near the tank farms and surrounding liquid-waste disposal facilities (Hartman et al. 2007).
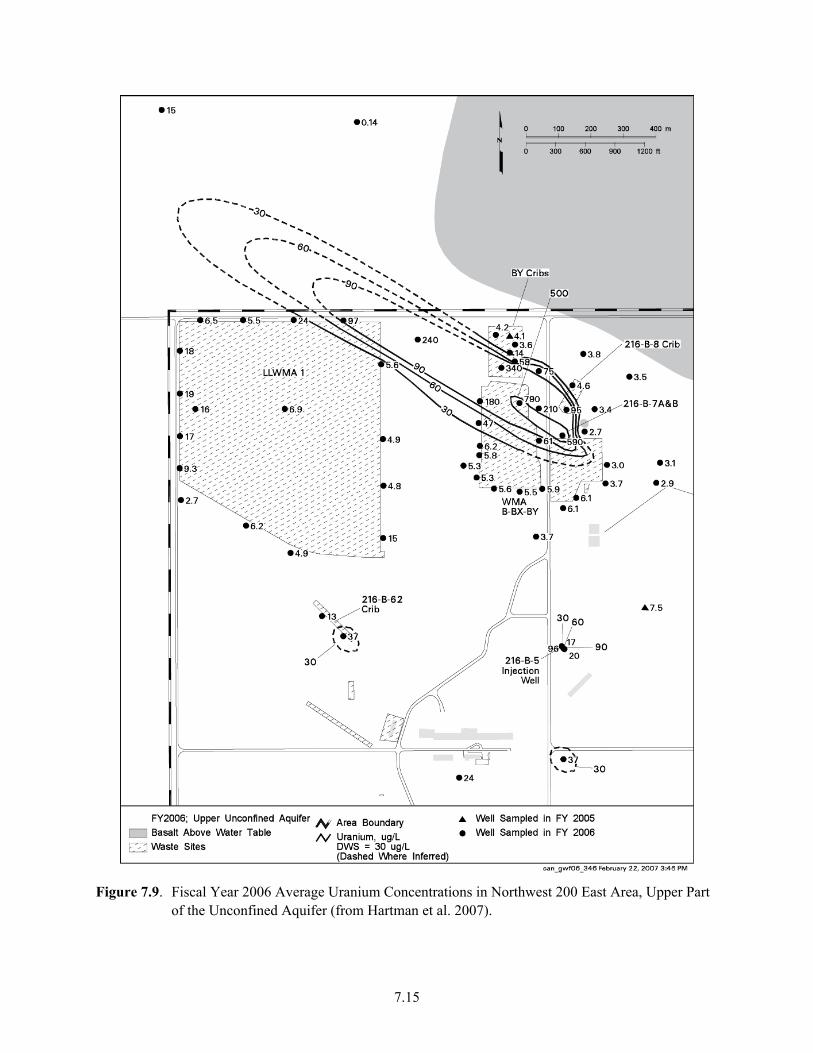
7.15
Figure 7.9. Fiscal Year 2006 Average Uranium Concentrations in Northwest 200 East Area, Upper Part
of the Unconfined Aquifer (from Hartman et al. 2007).
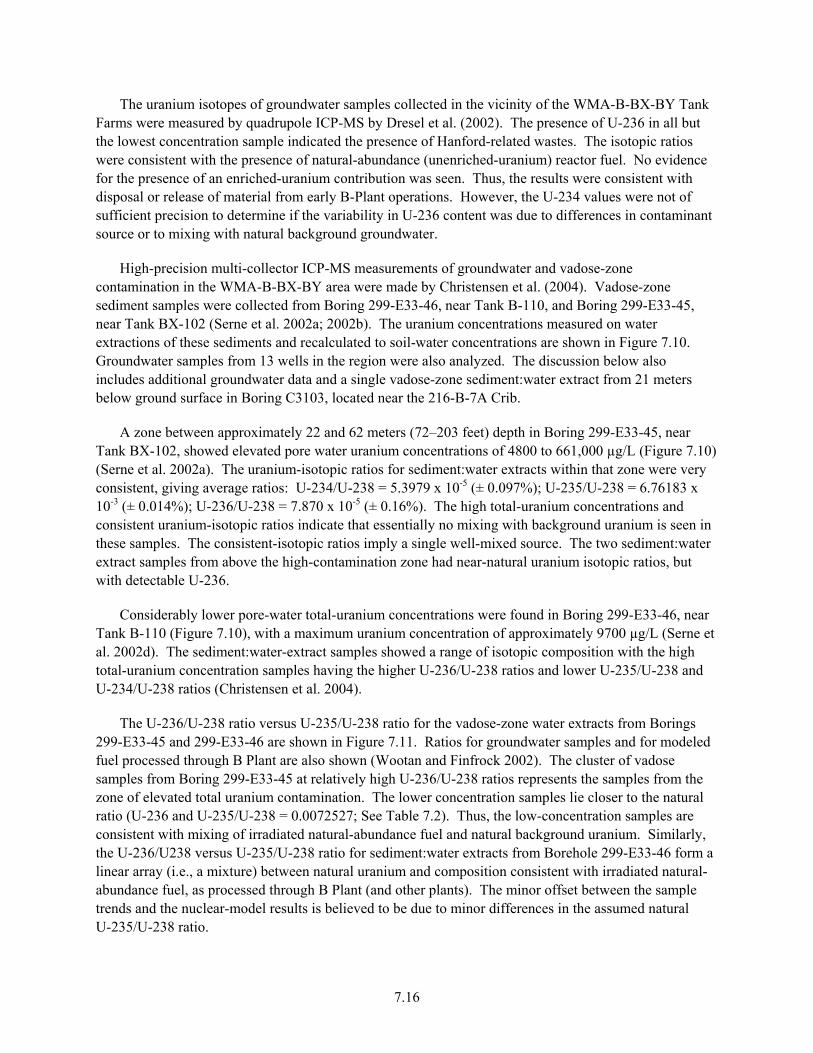
7.16
The uranium isotopes of groundwater samples collected in the vicinity of the WMA-B-BX-BY Tank Farms were measured by quadrupole ICP-MS by Dresel et al. (2002). The presence of U-236 in all but the lowest concentration sample indicated the presence of Hanford-related wastes. The isotopic ratios were consistent with the presence of natural-abundance (unenriched-uranium) reactor fuel. No evidence for the presence of an enriched-uranium contribution was seen. Thus, the results were consistent with disposal or release of material from early B-Plant operations. However, the U-234 values were not of sufficient precision to determine if the variability in U-236 content was due to differences in contaminant source or to mixing with natural background groundwater.
High-precision multi-collector ICP-MS measurements of groundwater and vadose-zone contamination in the WMA-B-BX-BY area were made by Christensen et al. (2004). Vadose-zone sediment samples were collected from Boring 299-E33-46, near Tank B-110, and Boring 299-E33-45, near Tank BX-102 (Serne et al. 2002a; 2002b). The uranium concentrations measured on water extractions of these sediments and recalculated to soil-water concentrations are shown in Figure 7.10. Groundwater samples from 13 wells in the region were also analyzed. The discussion below also includes additional groundwater data and a single vadose-zone sediment:water extract from 21 meters below ground surface in Boring C3103, located near the 216-B-7A Crib.
A zone between approximately 22 and 62 meters (72–203 feet) depth in Boring 299-E33-45, near Tank BX-102, showed elevated pore water uranium concentrations of 4800 to 661,000 µg/L (Figure 7.10) (Serne et al. 2002a). The uranium-isotopic ratios for sediment:water extracts within that zone were very consistent, giving average ratios: U-234/U-238 = 5.3979 x 10⁻⁵ (± 0.097%); U-235/U-238 = 6.76183 x 10⁻³ (± 0.014%); U-236/U-238 = 7.870 x 10⁻⁵ (± 0.16%). The high total-uranium concentrations and consistent uranium-isotopic ratios indicate that essentially no mixing with background uranium is seen in these samples. The consistent-isotopic ratios imply a single well-mixed source. The two sediment:water extract samples from above the high-contamination zone had near-natural uranium isotopic ratios, but with detectable U-236.
Considerably lower pore-water total-uranium concentrations were found in Boring 299-E33-46, near Tank B-110 (Figure 7.10), with a maximum uranium concentration of approximately 9700 µg/L (Serne et al. 2002d). The sediment:water-extract samples showed a range of isotopic composition with the high total-uranium concentration samples having the higher U-236/U-238 ratios and lower U-235/U-238 and U-234/U-238 ratios (Christensen et al. 2004).
The U-236/U-238 ratio versus U-235/U-238 ratio for the vadose-zone water extracts from Borings 299-E33-45 and 299-E33-46 are shown in Figure 7.11. Ratios for groundwater samples and for modeled fuel processed through B Plant are also shown (Wootan and Finfrock 2002). The cluster of vadose samples from Boring 299-E33-45 at relatively high U-236/U-238 ratios represents the samples from the zone of elevated total uranium contamination. The lower concentration samples lie closer to the natural ratio (U-236 and U-235/U-238 = 0.0072527; See Table 7.2). Thus, the low-concentration samples are consistent with mixing of irradiated natural-abundance fuel and natural background uranium. Similarly, the U-236/U238 versus U-235/U-238 ratio for sediment:water extracts from Borehole 299-E33-46 form a linear array (i.e., a mixture) between natural uranium and composition consistent with irradiated natural-abundance fuel, as processed through B Plant (and other plants). The minor offset between the sample trends and the nuclear-model results is believed to be due to minor differences in the assumed natural U-235/U-238 ratio.

7.17
Figure 7.10. Uranium Concentration in Pore Water and Stratigraphy of Borings 299-E33-45 and
299-E33-46. Samples analyzed for uranium isotopic ratios are shown in filled symbols (from Christensen et al. 2004).
0.00000
0.00002
0.00004
0.00006
0.00008
0.00010
0.00012
0.0065 0.0066 0.0067 0.0068 0.0069 0.0070 0.0071 0.0072 0.0073
U-235/U-238 (atom ratio)
U-2
36/U
-238
(ato
m ra
tio)
B Plant Fuel
299-E33-45 VZ
299-E33-46 VZ
C3103 VZ
2001 Groundwater
2003 Groundwater411 ug/L
123 ug/L
119 ug/L
93 ug/L
60 ug/L22 ug/L
14 ug/L
4 ug/L
3 ug/L
C3103
Figure 7.11. U-236/U-238 Versus U-235/U-238 for Vadose Zone and Groundwater Samples in the
Vicinity of WMA-B-BX-BY Compared to Modeled Composition of Fuel Processed Through B Plant. The sample data are from Christensen et al. (2004) and the modeled B Plant Fuel from Wootan and Finfrock (2002). Total uranium concentrations for 2001 groundwater samples are shown.
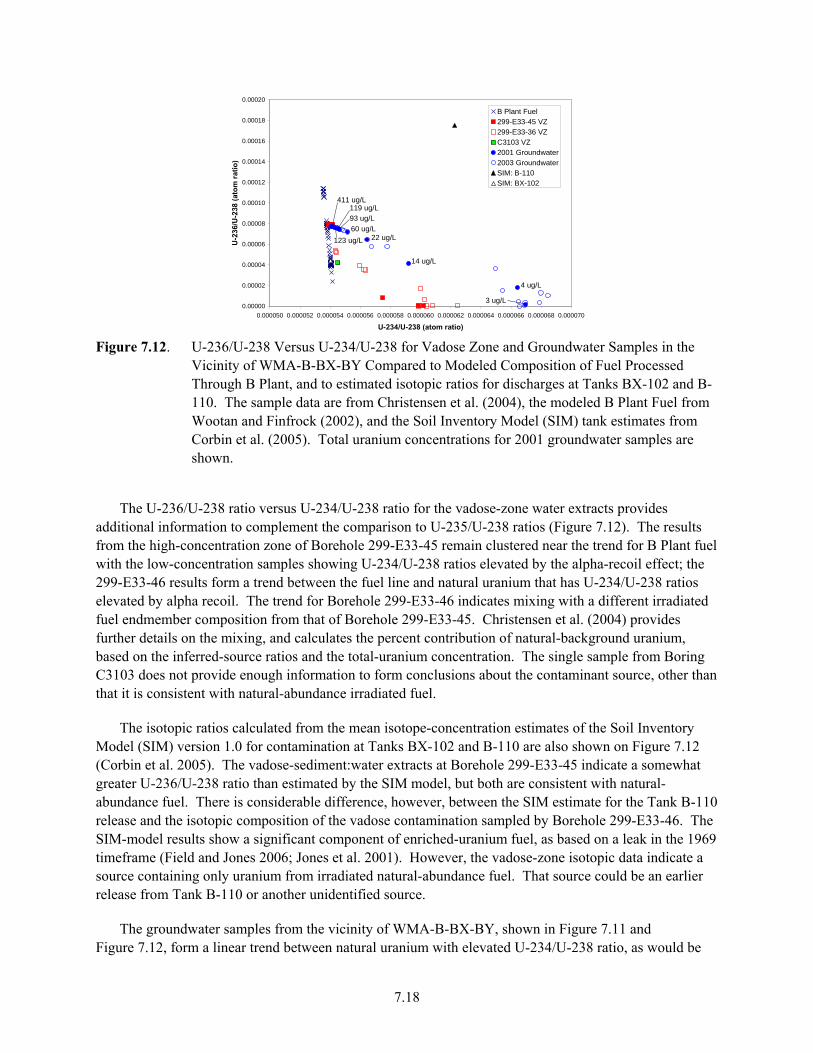
7.18
0.00000
0.00002
0.00004
0.00006
0.00008
0.00010
0.00012
0.00014
0.00016
0.00018
0.00020
0.000050 0.000052 0.000054 0.000056 0.000058 0.000060 0.000062 0.000064 0.000066 0.000068 0.000070
U-234/U-238 (atom ratio)
U-2
36/U
-238
(ato
m ra
tio)
B Plant Fuel299-E33-45 VZ299-E33-36 VZC3103 VZ2001 Groundwater2003 GroundwaterSIM: B-110SIM: BX-102
123 ug/L
411 ug/L119 ug/L93 ug/L60 ug/L
22 ug/L
14 ug/L
4 ug/L
3 ug/L
Figure 7.12. U-236/U-238 Versus U-234/U-238 for Vadose Zone and Groundwater Samples in the
Vicinity of WMA-B-BX-BY Compared to Modeled Composition of Fuel Processed Through B Plant, and to estimated isotopic ratios for discharges at Tanks BX-102 and B-110. The sample data are from Christensen et al. (2004), the modeled B Plant Fuel from Wootan and Finfrock (2002), and the Soil Inventory Model (SIM) tank estimates from Corbin et al. (2005). Total uranium concentrations for 2001 groundwater samples are shown.
The U-236/U-238 ratio versus U-234/U-238 ratio for the vadose-zone water extracts provides additional information to complement the comparison to U-235/U-238 ratios (Figure 7.12). The results from the high-concentration zone of Borehole 299-E33-45 remain clustered near the trend for B Plant fuel with the low-concentration samples showing U-234/U-238 ratios elevated by the alpha-recoil effect; the 299-E33-46 results form a trend between the fuel line and natural uranium that has U-234/U-238 ratios elevated by alpha recoil. The trend for Borehole 299-E33-46 indicates mixing with a different irradiated fuel endmember composition from that of Borehole 299-E33-45. Christensen et al. (2004) provides further details on the mixing, and calculates the percent contribution of natural-background uranium, based on the inferred-source ratios and the total-uranium concentration. The single sample from Boring C3103 does not provide enough information to form conclusions about the contaminant source, other than that it is consistent with natural-abundance irradiated fuel.
The isotopic ratios calculated from the mean isotope-concentration estimates of the Soil Inventory Model (SIM) version 1.0 for contamination at Tanks BX-102 and B-110 are also shown on Figure 7.12 (Corbin et al. 2005). The vadose-sediment:water extracts at Borehole 299-E33-45 indicate a somewhat greater U-236/U-238 ratio than estimated by the SIM model, but both are consistent with natural-abundance fuel. There is considerable difference, however, between the SIM estimate for the Tank B-110 release and the isotopic composition of the vadose contamination sampled by Borehole 299-E33-46. The SIM-model results show a significant component of enriched-uranium fuel, as based on a leak in the 1969 timeframe (Field and Jones 2006; Jones et al. 2001). However, the vadose-zone isotopic data indicate a source containing only uranium from irradiated natural-abundance fuel. That source could be an earlier release from Tank B-110 or another unidentified source.
The groundwater samples from the vicinity of WMA-B-BX-BY, shown in Figure 7.11 and Figure 7.12, form a linear trend between natural uranium with elevated U-234/U-238 ratio, as would be
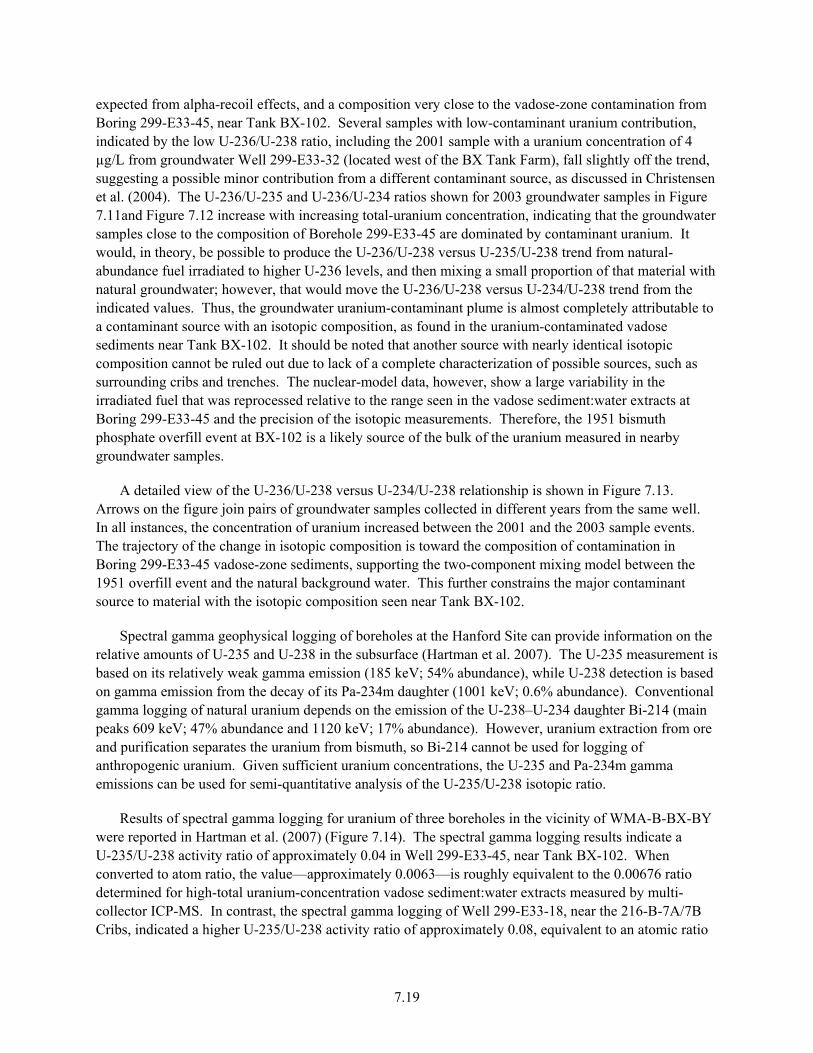
7.19
expected from alpha-recoil effects, and a composition very close to the vadose-zone contamination from Boring 299-E33-45, near Tank BX-102. Several samples with low-contaminant uranium contribution, indicated by the low U-236/U-238 ratio, including the 2001 sample with a uranium concentration of 4 µg/L from groundwater Well 299-E33-32 (located west of the BX Tank Farm), fall slightly off the trend, suggesting a possible minor contribution from a different contaminant source, as discussed in Christensen et al. (2004). The U-236/U-235 and U-236/U-234 ratios shown for 2003 groundwater samples in Figure 7.11and Figure 7.12 increase with increasing total-uranium concentration, indicating that the groundwater samples close to the composition of Borehole 299-E33-45 are dominated by contaminant uranium. It would, in theory, be possible to produce the U-236/U-238 versus U-235/U-238 trend from natural-abundance fuel irradiated to higher U-236 levels, and then mixing a small proportion of that material with natural groundwater; however, that would move the U-236/U-238 versus U-234/U-238 trend from the indicated values. Thus, the groundwater uranium-contaminant plume is almost completely attributable to a contaminant source with an isotopic composition, as found in the uranium-contaminated vadose sediments near Tank BX-102. It should be noted that another source with nearly identical isotopic composition cannot be ruled out due to lack of a complete characterization of possible sources, such as surrounding cribs and trenches. The nuclear-model data, however, show a large variability in the irradiated fuel that was reprocessed relative to the range seen in the vadose sediment:water extracts at Boring 299-E33-45 and the precision of the isotopic measurements. Therefore, the 1951 bismuth phosphate overfill event at BX-102 is a likely source of the bulk of the uranium measured in nearby groundwater samples.
A detailed view of the U-236/U-238 versus U-234/U-238 relationship is shown in Figure 7.13. Arrows on the figure join pairs of groundwater samples collected in different years from the same well. In all instances, the concentration of uranium increased between the 2001 and the 2003 sample events. The trajectory of the change in isotopic composition is toward the composition of contamination in Boring 299-E33-45 vadose-zone sediments, supporting the two-component mixing model between the 1951 overfill event and the natural background water. This further constrains the major contaminant source to material with the isotopic composition seen near Tank BX-102.
Spectral gamma geophysical logging of boreholes at the Hanford Site can provide information on the relative amounts of U-235 and U-238 in the subsurface (Hartman et al. 2007). The U-235 measurement is based on its relatively weak gamma emission (185 keV; 54% abundance), while U-238 detection is based on gamma emission from the decay of its Pa-234m daughter (1001 keV; 0.6% abundance). Conventional gamma logging of natural uranium depends on the emission of the U-238–U-234 daughter Bi-214 (main peaks 609 keV; 47% abundance and 1120 keV; 17% abundance). However, uranium extraction from ore and purification separates the uranium from bismuth, so Bi-214 cannot be used for logging of anthropogenic uranium. Given sufficient uranium concentrations, the U-235 and Pa-234m gamma emissions can be used for semi-quantitative analysis of the U-235/U-238 isotopic ratio.
Results of spectral gamma logging for uranium of three boreholes in the vicinity of WMA-B-BX-BY were reported in Hartman et al. (2007) (Figure 7.14). The spectral gamma logging results indicate a U-235/U-238 activity ratio of approximately 0.04 in Well 299-E33-45, near Tank BX-102. When converted to atom ratio, the value—approximately 0.0063—is roughly equivalent to the 0.00676 ratio determined for high-total uranium-concentration vadose sediment:water extracts measured by multi-collector ICP-MS. In contrast, the spectral gamma logging of Well 299-E33-18, near the 216-B-7A/7B Cribs, indicated a higher U-235/U-238 activity ratio of approximately 0.08, equivalent to an atomic ratio
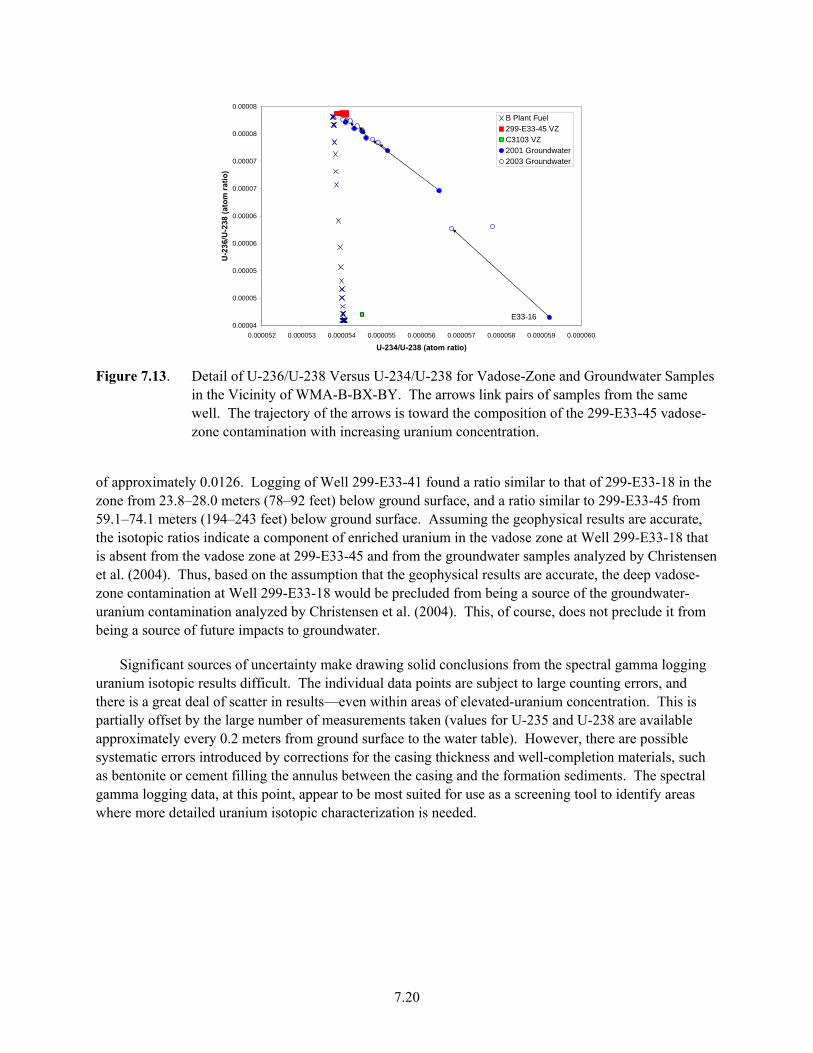
7.20
0.00004
0.00005
0.00005
0.00006
0.00006
0.00007
0.00007
0.00008
0.00008
0.000052 0.000053 0.000054 0.000055 0.000056 0.000057 0.000058 0.000059 0.000060
U-234/U-238 (atom ratio)
U-2
36/U
-238
(ato
m ra
tio)
B Plant Fuel299-E33-45 VZC3103 VZ2001 Groundwater2003 Groundwater
E33-16
Figure 7.13. Detail of U-236/U-238 Versus U-234/U-238 for Vadose-Zone and Groundwater Samples
in the Vicinity of WMA-B-BX-BY. The arrows link pairs of samples from the same well. The trajectory of the arrows is toward the composition of the 299-E33-45 vadose-zone contamination with increasing uranium concentration.
of approximately 0.0126. Logging of Well 299-E33-41 found a ratio similar to that of 299-E33-18 in the zone from 23.8–28.0 meters (78–92 feet) below ground surface, and a ratio similar to 299-E33-45 from 59.1–74.1 meters (194–243 feet) below ground surface. Assuming the geophysical results are accurate, the isotopic ratios indicate a component of enriched uranium in the vadose zone at Well 299-E33-18 that is absent from the vadose zone at 299-E33-45 and from the groundwater samples analyzed by Christensen et al. (2004). Thus, based on the assumption that the geophysical results are accurate, the deep vadose-zone contamination at Well 299-E33-18 would be precluded from being a source of the groundwater-uranium contamination analyzed by Christensen et al. (2004). This, of course, does not preclude it from being a source of future impacts to groundwater.
Significant sources of uncertainty make drawing solid conclusions from the spectral gamma logging uranium isotopic results difficult. The individual data points are subject to large counting errors, and there is a great deal of scatter in results—even within areas of elevated-uranium concentration. This is partially offset by the large number of measurements taken (values for U-235 and U-238 are available approximately every 0.2 meters from ground surface to the water table). However, there are possible systematic errors introduced by corrections for the casing thickness and well-completion materials, such as bentonite or cement filling the annulus between the casing and the formation sediments. The spectral gamma logging data, at this point, appear to be most suited for use as a screening tool to identify areas where more detailed uranium isotopic characterization is needed.

7.21
Figure 7.14. Cross Plots of Uranium Isotopes from Spectral Gamma Log Data (from Hartman et
al. 2007).

7.22
7.5 WMA-T and WMA-TX-TY
Christensen et al. 2007 (in press) analyzed the uranium-isotopic composition of groundwater samples from the vicinity of the WMA-T Tank Farm and vadose-zone sediment:water extracts from Borehole C3832 (see also Sections 6 and 10) near Tank TX-104 (WMA-TX-TY) and Borehole C4104 near Tank T-106 (WMA-T). Both boreholes showed significant uranium contamination to depths of 30–35 meters below ground surface. The uranium concentrations in Boring C3832 pore water, derived from water extracts (1:1 by mass) peaked at 2850 µg/L within the Upper Cold Creek Unit (Serne et al. 2004a). The uranium concentrations in Boring C4104 derived from sediment:water extracts reached 17,800 µg/L and peaked just above the Upper Cold Creek Unit (Serne et al. 2004b). Only low levels (less than 2 µg/L) of uranium were detected in the groundwater samples from wells near these two borings, and low U-236/U-238 ratios (<5.1x10⁻⁷) indicated less than 1% contaminant contribution to the groundwater uranium. The uranium concentrations and isotopic ratios for the sediment:water extracts are shown in Table 7.5.
The U-236/U-238 ratio of vadose-zone sediment:water extracts from C3832 near Tank TX-104 and C4104 near Tank T-106 are shown in Figure 7.15 (from Christensen et al. 2007 in press). The samples from C3832 with elevated uranium concentration show extremely consistent U-236/U-238 ratios of 90.12±0.07 (x10-6) to 91.37±0.16 (x10-6). The near-constant uranium isotopic composition indicates that these uranium samples represent essentially the uranium-isotopic composition of the pure contaminant, showing little effect due to mixing with background (natural) uranium. The uniformity of the isotopic ratios also suggests a single, relatively well-mixed contamination source, such as one leak event.
The proportion of natural-background uranium in each sample from Boring C3832 can be estimated from the U-235/U-238 ratios of the samples and a two-component mixing model, using the natural-abundance ratio for U-235/U-238 (0.007253) as one endmember, and the analytical result for the sample with maximum U-236/U-238 ratio, sample104b (depth: 31.92 m bgs; total U in soil water: 22.53 mg/L; U-235/U-238: 0.0066701±0.0000027) as the contaminant endmember. Two-component mixing is calculated by:
100% x
UU
UU
UU
UU
Ul %
tcontaminan238
235
natural238
235
tcontaminan238
235
sample238
235
⎥⎥⎥⎥⎥⎥
⎦
⎤
⎢⎢⎢⎢⎢⎢
⎣
⎡
⎟⎟⎠
⎞⎜⎜⎝
⎛−⎟
⎟⎠
⎞⎜⎜⎝
⎛
⎟⎟⎠
⎞⎜⎜⎝
⎛−⎟
⎟⎠
⎞⎜⎜⎝
⎛
natura
The calculated contribution from natural uranium is <7% for all but the shallowest and two deepest samples, as shown in Table 7.5. The maximum calculated contribution from natural uranium to the pore-water concentration was 270 µg/L. This is a somewhat higher concentration than that seen in the pore-water samples dominated by natural uranium, which contain 30–70 µg/L uranium. Performing the mixing calculations using the U-236/U-238 ratio provides calculated contributions from natural uranium that agree to within less than 1%.
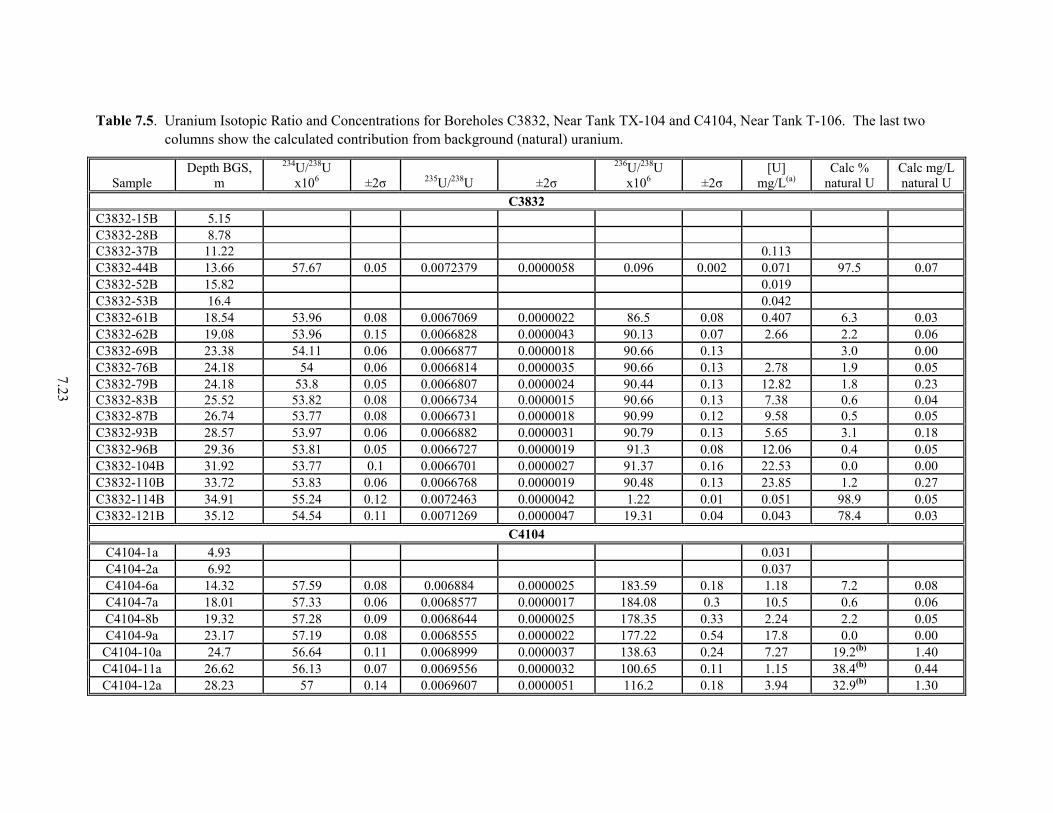
7.23
Table 7.5. Uranium Isotopic Ratio and Concentrations for Boreholes C3832, Near Tank TX-104 and C4104, Near Tank T-106. The last two columns show the calculated contribution from background (natural) uranium.
Sample Depth BGS,
m 234U/238U
x106 ±2σ 235U/238U ±2σ 236U/238U
x106 ±2σ [U]
mg/L(a) Calc %
natural U Calc mg/L natural U
C3832 C3832-15B 5.15 C3832-28B 8.78 C3832-37B 11.22 0.113 C3832-44B 13.66 57.67 0.05 0.0072379 0.0000058 0.096 0.002 0.071 97.5 0.07 C3832-52B 15.82 0.019 C3832-53B 16.4 0.042 C3832-61B 18.54 53.96 0.08 0.0067069 0.0000022 86.5 0.08 0.407 6.3 0.03 C3832-62B 19.08 53.96 0.15 0.0066828 0.0000043 90.13 0.07 2.66 2.2 0.06 C3832-69B 23.38 54.11 0.06 0.0066877 0.0000018 90.66 0.13 3.0 0.00 C3832-76B 24.18 54 0.06 0.0066814 0.0000035 90.66 0.13 2.78 1.9 0.05 C3832-79B 24.18 53.8 0.05 0.0066807 0.0000024 90.44 0.13 12.82 1.8 0.23 C3832-83B 25.52 53.82 0.08 0.0066734 0.0000015 90.66 0.13 7.38 0.6 0.04 C3832-87B 26.74 53.77 0.08 0.0066731 0.0000018 90.99 0.12 9.58 0.5 0.05 C3832-93B 28.57 53.97 0.06 0.0066882 0.0000031 90.79 0.13 5.65 3.1 0.18 C3832-96B 29.36 53.81 0.05 0.0066727 0.0000019 91.3 0.08 12.06 0.4 0.05 C3832-104B 31.92 53.77 0.1 0.0066701 0.0000027 91.37 0.16 22.53 0.0 0.00 C3832-110B 33.72 53.83 0.06 0.0066768 0.0000019 90.48 0.13 23.85 1.2 0.27 C3832-114B 34.91 55.24 0.12 0.0072463 0.0000042 1.22 0.01 0.051 98.9 0.05 C3832-121B 35.12 54.54 0.11 0.0071269 0.0000047 19.31 0.04 0.043 78.4 0.03
C4104 C4104-1a 4.93 0.031 C4104-2a 6.92 0.037 C4104-6a 14.32 57.59 0.08 0.006884 0.0000025 183.59 0.18 1.18 7.2 0.08 C4104-7a 18.01 57.33 0.06 0.0068577 0.0000017 184.08 0.3 10.5 0.6 0.06 C4104-8b 19.32 57.28 0.09 0.0068644 0.0000025 178.35 0.33 2.24 2.2 0.05 C4104-9a 23.17 57.19 0.08 0.0068555 0.0000022 177.22 0.54 17.8 0.0 0.00
C4104-10a 24.7 56.64 0.11 0.0068999 0.0000037 138.63 0.24 7.27 19.2(b) 1.40 C4104-11a 26.62 56.13 0.07 0.0069556 0.0000032 100.65 0.11 1.15 38.4(b) 0.44 C4104-12a 28.23 57 0.14 0.0069607 0.0000051 116.2 0.18 3.94 32.9(b) 1.30
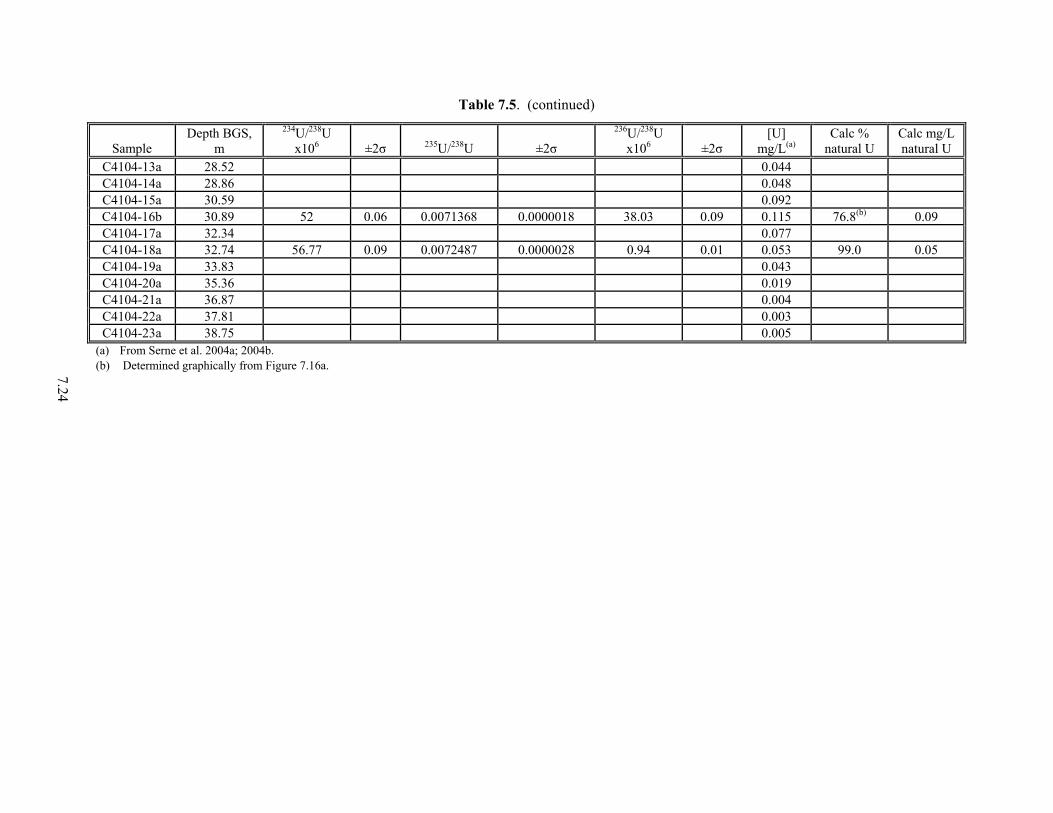
7.24
Table 7.5. (continued)
Sample Depth BGS,
m 234U/238U
x106 ±2σ 235U/238U ±2σ 236U/238U
x106 ±2σ [U]
mg/L(a) Calc %
natural U Calc mg/L natural U
C4104-13a 28.52 0.044 C4104-14a 28.86 0.048 C4104-15a 30.59 0.092 C4104-16b 30.89 52 0.06 0.0071368 0.0000018 38.03 0.09 0.115 76.8(b) 0.09 C4104-17a 32.34 0.077 C4104-18a 32.74 56.77 0.09 0.0072487 0.0000028 0.94 0.01 0.053 99.0 0.05 C4104-19a 33.83 0.043 C4104-20a 35.36 0.019 C4104-21a 36.87 0.004 C4104-22a 37.81 0.003 C4104-23a 38.75 0.005
(a) From Serne et al. 2004a; 2004b. (b) Determined graphically from Figure 7.16a.

7.25
Figure 7.15. Profiles for the C3832 (panel A) and C4104 (panel B) cores of Uranium concentration
and 236U/238U from Christensen et al. 2007 (in press). Uranium concentrations are from Serne et al. (2004a; 2004b).
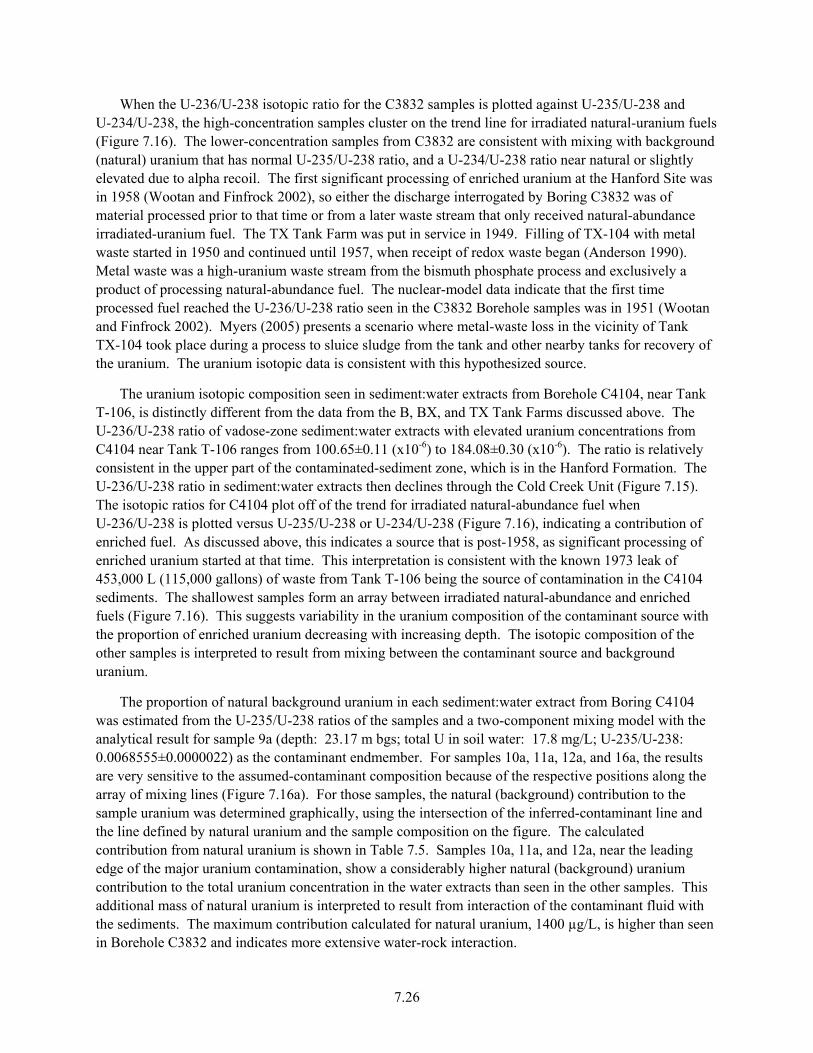
7.26
When the U-236/U-238 isotopic ratio for the C3832 samples is plotted against U-235/U-238 and U-234/U-238, the high-concentration samples cluster on the trend line for irradiated natural-uranium fuels (Figure 7.16). The lower-concentration samples from C3832 are consistent with mixing with background (natural) uranium that has normal U-235/U-238 ratio, and a U-234/U-238 ratio near natural or slightly elevated due to alpha recoil. The first significant processing of enriched uranium at the Hanford Site was in 1958 (Wootan and Finfrock 2002), so either the discharge interrogated by Boring C3832 was of material processed prior to that time or from a later waste stream that only received natural-abundance irradiated-uranium fuel. The TX Tank Farm was put in service in 1949. Filling of TX-104 with metal waste started in 1950 and continued until 1957, when receipt of redox waste began (Anderson 1990). Metal waste was a high-uranium waste stream from the bismuth phosphate process and exclusively a product of processing natural-abundance fuel. The nuclear-model data indicate that the first time processed fuel reached the U-236/U-238 ratio seen in the C3832 Borehole samples was in 1951 (Wootan and Finfrock 2002). Myers (2005) presents a scenario where metal-waste loss in the vicinity of Tank TX-104 took place during a process to sluice sludge from the tank and other nearby tanks for recovery of the uranium. The uranium isotopic data is consistent with this hypothesized source.
The uranium isotopic composition seen in sediment:water extracts from Borehole C4104, near Tank T-106, is distinctly different from the data from the B, BX, and TX Tank Farms discussed above. The U-236/U-238 ratio of vadose-zone sediment:water extracts with elevated uranium concentrations from C4104 near Tank T-106 ranges from 100.65±0.11 (x10-6) to 184.08±0.30 (x10-6). The ratio is relatively consistent in the upper part of the contaminated-sediment zone, which is in the Hanford Formation. The U-236/U-238 ratio in sediment:water extracts then declines through the Cold Creek Unit (Figure 7.15). The isotopic ratios for C4104 plot off of the trend for irradiated natural-abundance fuel when U-236/U-238 is plotted versus U-235/U-238 or U-234/U-238 (Figure 7.16), indicating a contribution of enriched fuel. As discussed above, this indicates a source that is post-1958, as significant processing of enriched uranium started at that time. This interpretation is consistent with the known 1973 leak of 453,000 L (115,000 gallons) of waste from Tank T-106 being the source of contamination in the C4104 sediments. The shallowest samples form an array between irradiated natural-abundance and enriched fuels (Figure 7.16). This suggests variability in the uranium composition of the contaminant source with the proportion of enriched uranium decreasing with increasing depth. The isotopic composition of the other samples is interpreted to result from mixing between the contaminant source and background uranium.
The proportion of natural background uranium in each sediment:water extract from Boring C4104 was estimated from the U-235/U-238 ratios of the samples and a two-component mixing model with the analytical result for sample 9a (depth: 23.17 m bgs; total U in soil water: 17.8 mg/L; U-235/U-238: 0.0068555±0.0000022) as the contaminant endmember. For samples 10a, 11a, 12a, and 16a, the results are very sensitive to the assumed-contaminant composition because of the respective positions along the array of mixing lines (Figure 7.16a). For those samples, the natural (background) contribution to the sample uranium was determined graphically, using the intersection of the inferred-contaminant line and the line defined by natural uranium and the sample composition on the figure. The calculated contribution from natural uranium is shown in Table 7.5. Samples 10a, 11a, and 12a, near the leading edge of the major uranium contamination, show a considerably higher natural (background) uranium contribution to the total uranium concentration in the water extracts than seen in the other samples. This additional mass of natural uranium is interpreted to result from interaction of the contaminant fluid with the sediments. The maximum contribution calculated for natural uranium, 1400 µg/L, is higher than seen in Borehole C3832 and indicates more extensive water-rock interaction.
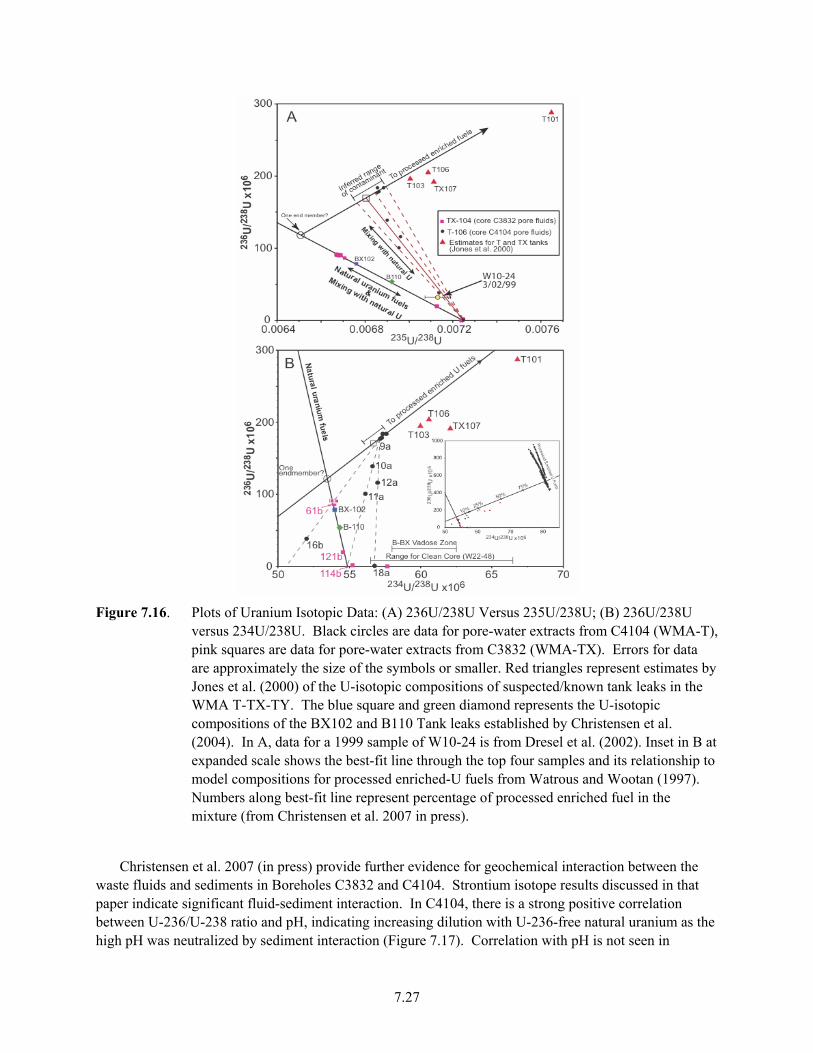
7.27
Figure 7.16. Plots of Uranium Isotopic Data: (A) 236U/238U Versus 235U/238U; (B) 236U/238U
versus 234U/238U. Black circles are data for pore-water extracts from C4104 (WMA-T), pink squares are data for pore-water extracts from C3832 (WMA-TX). Errors for data are approximately the size of the symbols or smaller. Red triangles represent estimates by Jones et al. (2000) of the U-isotopic compositions of suspected/known tank leaks in the WMA T-TX-TY. The blue square and green diamond represents the U-isotopic compositions of the BX102 and B110 Tank leaks established by Christensen et al. (2004). In A, data for a 1999 sample of W10-24 is from Dresel et al. (2002). Inset in B at expanded scale shows the best-fit line through the top four samples and its relationship to model compositions for processed enriched-U fuels from Watrous and Wootan (1997). Numbers along best-fit line represent percentage of processed enriched fuel in the mixture (from Christensen et al. 2007 in press).
Christensen et al. 2007 (in press) provide further evidence for geochemical interaction between the waste fluids and sediments in Boreholes C3832 and C4104. Strontium isotope results discussed in that paper indicate significant fluid-sediment interaction. In C4104, there is a strong positive correlation between U-236/U-238 ratio and pH, indicating increasing dilution with U-236-free natural uranium as the high pH was neutralized by sediment interaction (Figure 7.17). Correlation with pH is not seen in

7.28
Figure 7.17. Plot of 236U/238U Versus pH for Core C4104 in the WMA-T (Christensen et al. 2007 in
press). Data for pH from Serne et al. (2004b).
Borehole C3832, but the other indications of reaction with the sediment show that the evidence for interaction persists after the pH has been neutralized.
The U-234/U-238 ratios provide further evidence for interaction between the waste and sediments (Christensen et al. 2007 in press). As shown in Figure 7.16b, the U-234/U-238 ratios for low-uranium concentration samples from Borehole C3832 fall close to a mixing line between the high-contamination samples (e.g., 16b) and the natural-abundance composition or near the low end of the range seen in uncontaminated sediment (Maher et al. 2006). A greater degree of interaction with bulk natural-abundance sediments is indicated for Borehole C4104 samples 10a and 11a, which fall on a mixing line between the high-concentration samples (e.g., 9a) and the natural-bulk U-234/U-238 ratio. Samples 12a and 18a exhibit a contribution from uranium with an enhanced U-234/U-238 ratio due to alpha recoil. However, as noted above, sample 12a also shows a significant contribution from bulk natural-abundance uranium. A three-component mixing model cannot be applied because alpha recoil produces a range of U-234/U-238 values in the pore water. Sample 16b is from a fine-grained sediment, and exhibits a U-234/U-238 ratio lower than the natural bulk-uranium ratio. This is attributed to dissolution of low U-234/U-238 mineral surfaces remaining after alpha-recoil ejection of U-234.
The results of uranium-isotope studies in sediments from WMA-TX-TY and WMA-T illustrate that considerable information can be obtained to constrain contaminant sources and to evaluate geochemical interaction between sediments and contaminant fluids, even in areas of relatively low total uranium contamination. The results also provide a basis for assessing possible future impacts to groundwater, if seen.
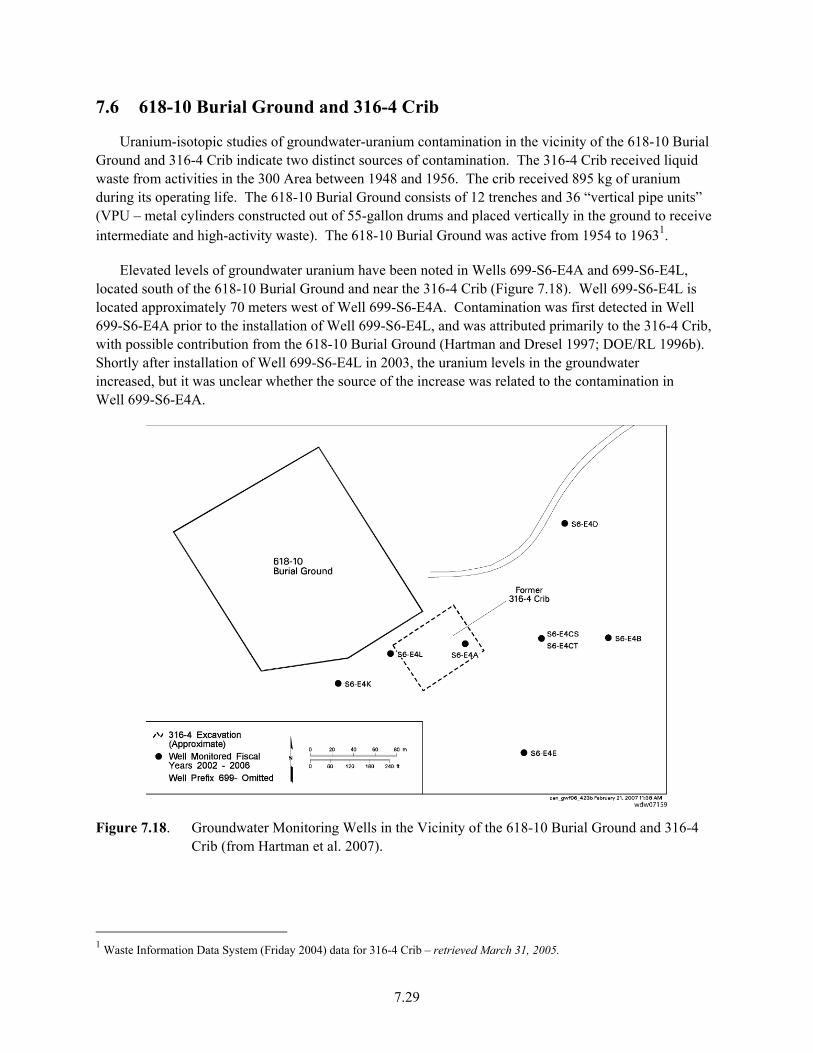
7.29
7.6 618-10 Burial Ground and 316-4 Crib
Uranium-isotopic studies of groundwater-uranium contamination in the vicinity of the 618-10 Burial Ground and 316-4 Crib indicate two distinct sources of contamination. The 316-4 Crib received liquid waste from activities in the 300 Area between 1948 and 1956. The crib received 895 kg of uranium during its operating life. The 618-10 Burial Ground consists of 12 trenches and 36 “vertical pipe units” (VPU – metal cylinders constructed out of 55-gallon drums and placed vertically in the ground to receive intermediate and high-activity waste). The 618-10 Burial Ground was active from 1954 to 19631.
Elevated levels of groundwater uranium have been noted in Wells 699-S6-E4A and 699-S6-E4L, located south of the 618-10 Burial Ground and near the 316-4 Crib (Figure 7.18). Well 699-S6-E4L is located approximately 70 meters west of Well 699-S6-E4A. Contamination was first detected in Well 699-S6-E4A prior to the installation of Well 699-S6-E4L, and was attributed primarily to the 316-4 Crib, with possible contribution from the 618-10 Burial Ground (Hartman and Dresel 1997; DOE/RL 1996b). Shortly after installation of Well 699-S6-E4L in 2003, the uranium levels in the groundwater increased, but it was unclear whether the source of the increase was related to the contamination in Well 699-S6-E4A.
Figure 7.18. Groundwater Monitoring Wells in the Vicinity of the 618-10 Burial Ground and 316-4
Crib (from Hartman et al. 2007).
1 Waste Information Data System (Friday 2004) data for 316-4 Crib – retrieved March 31, 2005.

7.30
Uranium-isotopic measurements by quadrupole ICP-MS demonstrated that the contamination in Well 299-S6-E4A was attributable to depleted uranium (Dresel et al. 2002). Subsequent sampling of groundwater from Wells 699-S6-E4A and 699-S6-E4L, and analysis by multi-collector ICP-MS demonstrated that the two wells had distinctly different isotopic signatures with the contamination in Well 699-S6-E4L exhibiting near natural U-235/U-238 ratio and slightly elevated U-234/U-238 and U-236/U-238 ratios. Water-extract samples of sediments collected beneath the 316-4 Crib, after excavation and removal of the crib, confirmed the presence of depleted uranium at that source. The sediment samples had U-235/U-238 ratios of 0.00213 to 0.00228, within the range expected for depleted uranium. The results of the uranium-isotopic measurements in the groundwater and sediment:water extracts are summarized in Table 7.6.
Table 7.6. Uranium-Isotopic Composition for Groundwater and Soil Samples Near the 316-4 Crib and 618-10 Burial Ground.
Well/Sample U
(µg/L) U-234/U-238
* 106
Error (2 σ) * 106 U-235/U-238
Error (2 σ)
U-236/U-238 * 106
Error (2 σ) * 106
699-S6-E4A(a) 19.2 43.56 0.1 0.0055919 0.0000047 8.54 0.03 699-S6-E4A(b) 98.85 33.87 0.677 0.0053166 0.0001064 26.56 0.06 699-S6-E4L(a) 29.9 56.74 0.12 0.0072680 0.0000069 13.77 0.275 316-4-395-1WE* 9.776 0.057 0.0021312 0.0000016 27.066 0.037 316-4-395-2WE* 10.003 0.059 0.0021754 0.0000015 26.435 0.033 316-4-395-3WE* 11.030 0.061 0.0022824 0.0000016 27.642 0.029 (a) Multi-collector ICP-MS. (b) Quadrupole ICP-MS.
Figure 7.19 shows that the groundwater-sample isotopic ratios for Well 699-S6-E4A can be attributed to mixing between the contamination in the vadose zone at the 316-4 Crib and background (natural) uranium. The least-squares fit to the vadose zone and Well 699-S6-E4A samples intersects the X axis at a U-234/U-238 ratio of 0.0000588, greater than secular equilibrium, presumably due to the alpha-recoil effect. This ratio is lower than seen for the WMA-B-BX-BY groundwater, but still higher than natural secular-equilibrium abundance. Uncontaminated or low-contamination vadose-zone sediment pore-water samples measured in the 200 East and 200 West Areas have lower U-234/U-238 ratios than groundwater, due to a greater contribution from bulk mineral dissolution versus the alpha-recoil contribution (Christensen et al. 2004; Maher et al. 2006). Groundwater uranium-isotopic composition in background groundwater near the 618-10 Burial Ground has not been measured. The chemical nature of waste received by the 316-4 Crib is not well documented; however, a spill in 1953 was washed down with nitric acid2. It is possible that the acid or reaction between the waste and the sediments released bulk uranium, affecting isotopic abundances in the groundwater. It is also possible that a component of natural-abundance uranium was present in the waste stream, but was not found in the particular vadose-zone sediment:water extracts that were analyzed.
2 Waste Inventory Data System (Friday 2004) – retrieved March 31, 2005.
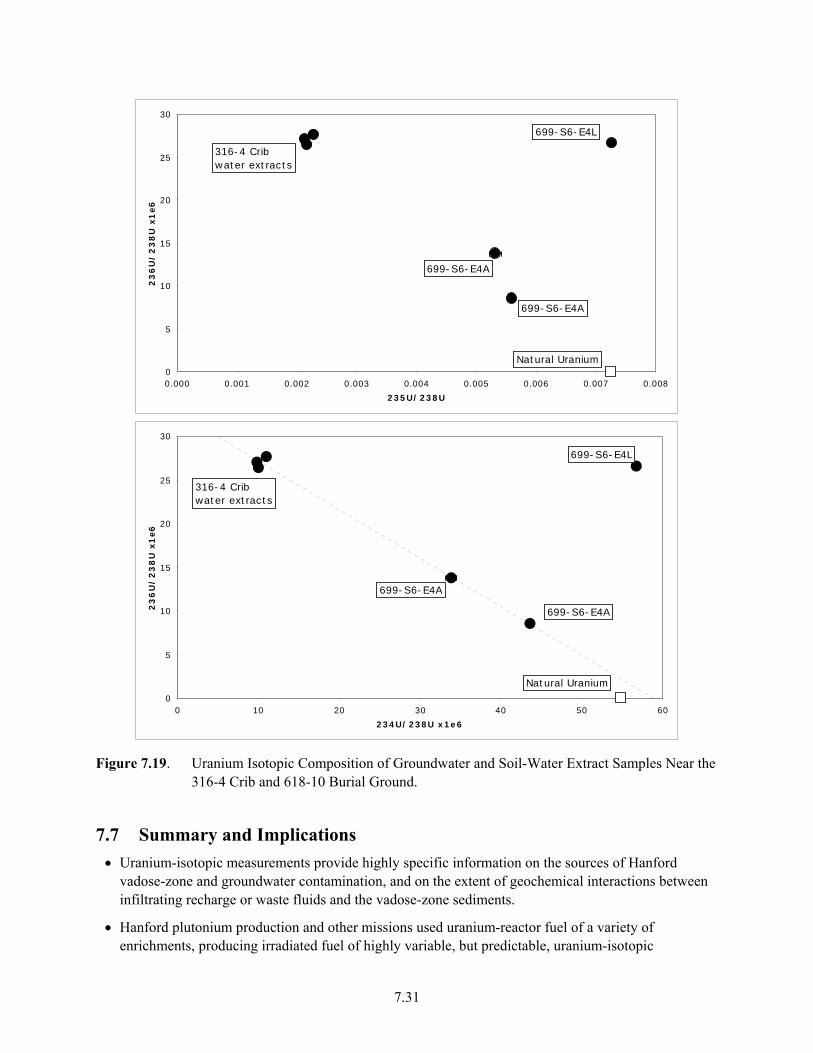
7.31
0
5
10
15
20
25
30
0 10 20 30 40 50 60
234U/238U x1e6
23
6U
/2
38
U x
1e6
699-S6-E4A
699-S6-E4A
699-S6-E4L
316-4 Cribwater extracts
Natural Uranium
0
5
10
15
20
25
30
0.000 0.001 0.002 0.003 0.004 0.005 0.006 0.007 0.008
235U/238U
23
6U
/2
38
U x
1e6
699-S6-E4A
699-S6-E4A
316-4 Cribwater extracts
699-S6-E4L
Natural Uranium
Figure 7.19. Uranium Isotopic Composition of Groundwater and Soil-Water Extract Samples Near the
316-4 Crib and 618-10 Burial Ground.
7.7 Summary and Implications • Uranium-isotopic measurements provide highly specific information on the sources of Hanford
vadose-zone and groundwater contamination, and on the extent of geochemical interactions between infiltrating recharge or waste fluids and the vadose-zone sediments.
• Hanford plutonium production and other missions used uranium-reactor fuel of a variety of enrichments, producing irradiated fuel of highly variable, but predictable, uranium-isotopic
7.32
composition, depending on the starting material and the extent of irradiation. The variation in uranium-fuel composition, reactor-power levels, and extent of fuel exposure led to considerable variability in the uranium-isotopic composition of the irradiated fuel and, thus, provided a means of constraining possible waste sources.
• Geophysical logging of borings in the WMA-B-BX-BY area suggest that a highly contaminated zone near the 216-B-7A and 216-B-7B Cribs contains significant mobile uranium contamination that has a different composition from that seen near Tank BX-102 and from the high-uranium groundwater plume observed in the WMA-B-BX-BY region. The data are controversial because of low count rates (and concomitant large uncertainties) and casing and borehole completion corrections (See also Section 8).
• Uranium-isotopic data from groundwater in the vicinity of WMA-B-BX-BY indicate that the BX-102 overfill event is the likely source for U(VI) in the nearby groundwater plume. Similarly, the groundwater-isotopic data near the 618-10 Burial Ground indicate that there are two sources of groundwater contamination. One source matches vadose-zone sediment contamination at the 316-4 Crib, leaving the burial ground as a likely second source.
8.1
8.0 Uranium Precipitation from Waste Streams
The precipitation of uranyl-bearing secondary phases at Hanford was controlled by waste components other than uranium, through the effects of waste-sediment interaction to drive solubility-limiting conditions. Major radioactive waste spills had widely variable compositions and components. Sodium, for example, was a major reactive component of these wastes. A compilation of major uranium discharges (see Section 3), indicated that within the 100 most significant contributors of uranium to the vadose zone, the concentration of sodium varied from approximately 2 mg L-1 to 310,000 mg L-1. The nature of precipitation-forming events was also variable. Within the high-inventory contributors, tank leaks accounted for two of the top 10 in uranium inventory, and eight resulted from purposeful discharges. The results presented here were from investigations of uranium precipitated from 1) an historic, episodic tank leak of alkaline-uranium wastes to the thick and deep 200 East Area vadose zone, and 2) the long-term seepage of acidic or neutral-uranium wastes to the thin and shallow 300 Area vadose zone from purposeful discharge into a waste-process pond. Both released uranium into the same superficial sedimentary deposit, but formed distinct solid phases of uranium due to the differences in the matrix composition of the uranium waste.
The post-precipitation behavior of the uranyl-bearing wastes appeared to be controlled by the composition and morphologic character of the secondary solid phases, inherited from the composition and reactivity of the original aqueous waste migrating through the vadose environment. These results suggested that consideration of the natural behavior of the predominant U(VI) ion in solution (uranyl, UO2
2+) (see Section 4) and the formation of uranyl-bearing solid phases could aid in predicting the expected solid phases of uranium at disparate contaminated sites. In this section, the uranyl precipitates that formed within the deep and shallow vadose zones at the 200 East and 300 Areas, respectively, and the geochemical factors influencing formation and subsequent potential for remobilization are discussed.
8.1 Waste-Site Materials and Experimental and Analytical Methods
The physical setting of the described contaminated sites is a setting in which geology controlled the flow of groundwater and the thickness of the vadose zone. The Hanford Site is underlain by three lithological units that are distinct in age and depositional environment. The broadest and stratigraphically lowest units are the regional, folded Miocene Columbia River Flood Basalts (Hooper 1982), defining the anticlinal topographic high to the west of the site (Rattlesnake Mountain) and the structural basin (the Pasco Basin), within which the site is located (Reidel et al. 1994). These are overlain by the Miocene-Piocene fluvio-lacustrine sediments of the Ringold Formation (Bjornstad 1990; McKinley et al. 1997), lying without deformation and incised by erosion. The uppermost formation is the Quaternary Hanford Formation (Bjornstad et al. 1987). The described contaminant-uranium occurrence within the Hanford Formation, which was deposited by periodic catastrophic ice-age floods, consists of unconsolidated sediment ranging from gravelly to sandy-silty lithologies. The water table slopes from Rattlesnake Mountain, where springs are present, eastward toward the Columbia River, where it is coincident with the river shore. The vadose zone at the central plateau (200 Area), between the regional uplands and the river, is as much as 100 meters thick. Chemical-processing facilities were constructed on the plateau. At the fuels-fabrication site (300 Area at the site’s southern extreme), the shallow water table is beneath a vadose zone that is, at most, less than 10 meters thick (Bjornstad 1990; Zachara et al. 2005).

8.2
8.1.1 241-BX-102 Overfill Event
The BX Tank Farm, in the central plateau’s 200 East Area (Figure 8.1), was constructed from 1946 to 1947, and was used to store and separate solid-waste sludges and liquids (Williams 1999) (see Section 3). During the movement of sludge by gravity flow from one tank to another in 1951, an inter-tank pipeline ruptured, and approximately 350,000 L of waste were released to the ground, including more than 7000 kg of uranium in an alkaline matrix of sodium carbonate, nitrate, phosphate, and sulfate (Jones et al. 2001). The nature of the vadose-zone contaminant plume was investigated by core drilling (Serne et al. 2002b). Cores were collected using driven split-spoons, avoiding drilling-related contamination, and a steel casing was driven concurrently as the drilling progressed. Gamma and neutron spectra were collected through the casing, and the in-situ radionuclide activity and relative moisture content were calculated from well logs (McCain 2006). Sediments removed from split-spoon liners were characterized according to the associated lithologic properties, and were processed to determine selected compositional qualities, as described in Section 6.
Figure 8.1. Layout of the Completed B-BX-BY Tank Farm. The 1951 spill occurred at Tank BX-102. Locations of Boreholes 299-E33-45, 299-E33-41, and 299-E33-18 are indicated.
Experimental evaluations of waste-sediment interaction were made using uncontaminated Hanford Formation sediment packed into experimental columns (Wan et al. 2007b). The metal-waste solution for these tests was synthesized based on the historical recipe (Jones et al. 2001). The metal-waste solution contained 0.11 M U(VI), 3.6 M Na+, 0.8 M CO3
2-, 0.34 M PO43-, 0.24 M SO4
2-, and had a pH of 10.4. The waste solution was injected into columns at 70˚C at varied flow rates. In each column, flow was stopped just before the plume front was calculated to reach the opposite end of the column. Then, the column was sectioned and the pore liquid was extracted from each segment of the column.
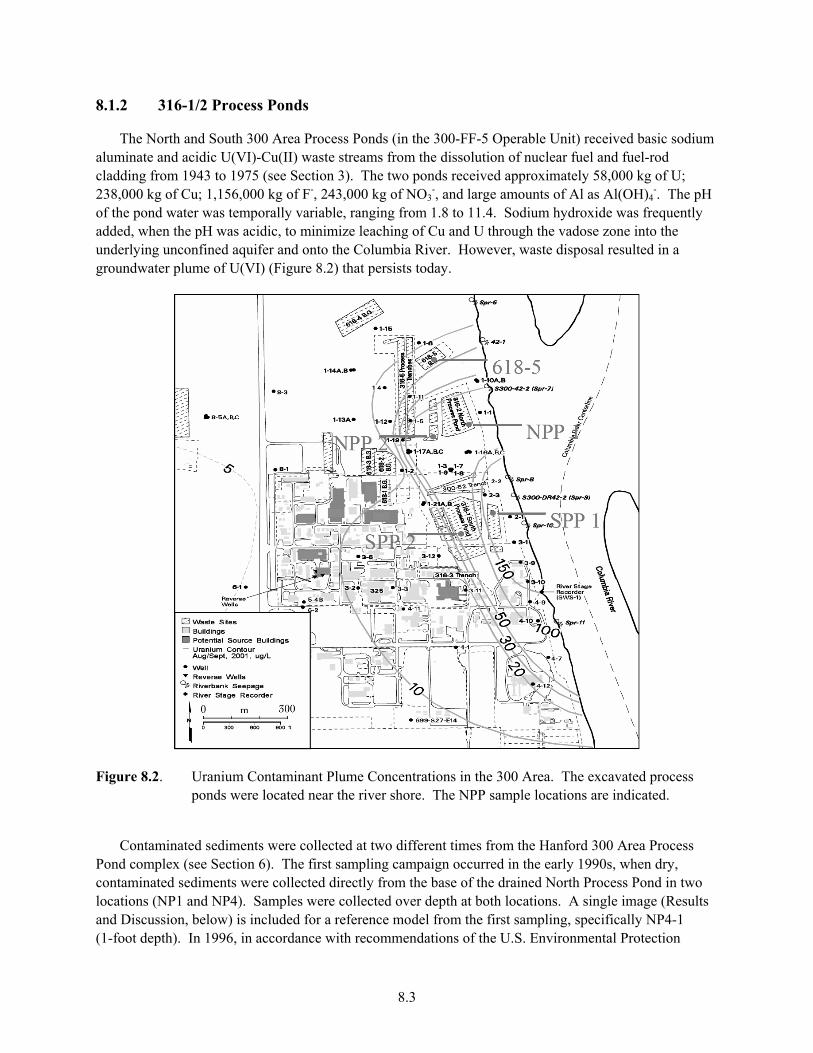
8.3
8.1.2 316-1/2 Process Ponds
The North and South 300 Area Process Ponds (in the 300-FF-5 Operable Unit) received basic sodium aluminate and acidic U(VI)-Cu(II) waste streams from the dissolution of nuclear fuel and fuel-rod cladding from 1943 to 1975 (see Section 3). The two ponds received approximately 58,000 kg of U; 238,000 kg of Cu; 1,156,000 kg of F-, 243,000 kg of NO3
-, and large amounts of Al as Al(OH)4-. The pH
of the pond water was temporally variable, ranging from 1.8 to 11.4. Sodium hydroxide was frequently added, when the pH was acidic, to minimize leaching of Cu and U through the vadose zone into the underlying unconfined aquifer and onto the Columbia River. However, waste disposal resulted in a groundwater plume of U(VI) (Figure 8.2) that persists today.
Figure 8.2. Uranium Contaminant Plume Concentrations in the 300 Area. The excavated process ponds were located near the river shore. The NPP sample locations are indicated.
Contaminated sediments were collected at two different times from the Hanford 300 Area Process Pond complex (see Section 6). The first sampling campaign occurred in the early 1990s, when dry, contaminated sediments were collected directly from the base of the drained North Process Pond in two locations (NP1 and NP4). Samples were collected over depth at both locations. A single image (Results and Discussion, below) is included for a reference model from the first sampling, specifically NP4-1 (1-foot depth). In 1996, in accordance with recommendations of the U.S. Environmental Protection

8.4
Agency (E.P.A., 1996), 640,000 tons of contaminated sediment were removed from the pond floors. Several additional meters of contaminated sediment were removed in 2001–2002 to reduce U(VI)-contaminant levels further—to concentrations considered protective of groundwater. In 2003, additional samples were collected at and below the secondary surface of the 2001–2002 remediation effort. A large excavator was used to expose a pit in the current land surface (NPP 2 in Figure 8.2), through the vadose zone to groundwater at the west side of the North Process Pond. Sediment samples were collected over depth within this pit. Two sediments from this sampling were selected for this study: NPP 2-0.5 (0.5-foot depth), NPP 2-4 (4-foot depth). An additional, similar collection produced an analogous ”deep” sample, NPP1-16 (16-foot depth). All listed depth values are with respect to the ground surface at the time of sampling. As the thickness of sediment removed during remediation was not accurately known, a precise depth relationship could not be established between the NP and NPP samples, although all NPP samples were from several meters below the NP samples. The sediments were dry-sieved to yield a <2.0-mm size fraction for more detailed chemical and mineralogical study of the reactive components.
8.1.3 Instrumental Analysis
Analysis methods for bulk measurements on core samples are presented above (see Section 6). For solid-phase measurements by electron-beam and x-ray-beam methods, the sediment subsamples were imbedded in epoxy, wafered using a diamond saw, and prepared as 100-µm-thin sections on fused-quartz slides. Measurements were made at the Argonne National Laboratory Advanced Photon Source on the Pacific Northwest Consortium Collaborative Access Team (PNC-CAT) beamline (Heald et al. 1999). The primary x-ray beam was focused using Kirkpatrick-Baez mirrors to a 6–7 µm diameter on the sample surface. The sample was oriented in a precision-translation stage at 45 degrees to the x-ray beam, and the detectors were oriented normal to the beam. Uranium maps were obtained by monitoring the U Mα fluorescence line using energy-dispersive and wavelength-dispersive spectrometers. Other elements were monitored and used to aid registration with scanning electron microscope (SEM) images. The detection limit was approximately 1µg g-1 for all elements, equivalent to approximately 109 element-of-interest atoms within the beam "spot." Fluorescence x-ray intensities were normalized to the ion-chamber current generated by the primary x-ray beam at a flux of approximately 5 x 10¹¹ ph sec-1. For EXAFS, the fluorescence spectrum near the uranium LIII absorption edge was monitored during changes in the excitation energy of the primary beam (Arai et al. 2007). SEM and XMP images were superimposed using Adobe PhotoShop. Thin sections were carbon coated and examined using a JEOL model 6340f scanning electron microscope and model 8200 electron microprobe (EMP). For EMP elemental-abundance maps, wavelength spectrometers were calibrated against commercial standards. Fracture areas, including uranyl silicates, were prepared for transmission electron microscopy (TEM) using an FEI 200TEM-focused ion-beam system. The fracture surface, exposed on a polished, thin section, was stabilized through the FIB deposition of a Pt layer. An approximately 2 x 20 µm pillar of material was milled free from the bulk using the focused Ga-ion beam. The pillar was lifted and Pt-welded onto a Cu-ring TEM half grid. Once secured to the TEM grid, the Pt-supported fracture face and fracture fill were milled to a slab of uniform approximate 200-nm thickness for subsequent TEM analysis. To perform imaging for energy-dispersive x-ray spectroscopy (EDS) and selected-area electron-diffraction (SAED) analysis, the researchers used a FEI Tecnai F30 TEM, operating at 300 KeV, and equipped with a Gatan Imaging Filter (GIF). This methodology has been described in more detail elsewhere (Heaney et al. 2001; Lomness et al. 2001; Prenitzer et al. 1998).
8.5
8.2 Precipitation Processes and Products Controlling Subsurface U Migration
Uranium is an ubiquitous component of contaminants on Department of Energy lands (Riley and Zachara 1992) and in similar sites worldwide (NEA 1999). Most natural-uranium deposits consist of solid phases of U(IV), which are insoluble under most environmental conditions (Grenthe et al. 1992). The oxidized form of uranium, U(VI), in the form of the uranyl ion, UO2
2+, is relatively soluble, and is of concern as a mobile contaminant in saturated and unsaturated natural systems. In solution above pH 5.0, the uranyl ion hydrolyzes, forming aqueous-hydroxide complexes and polymers of uranyl hydroxide (Baes and Mesmer 1976; Finch and Murakami 1999; Grenthe et al.1992). The hydroxy complexes are relatively weak. In most groundwaters, uranyl occurs as a stronger complex with dissolved carbonate (Langmuir 1978; Section 4), but may also form complexes with sulfate. The effect of aqueous complexation is to increase the solubility of uranyl minerals (see Section 4). The uranium in all of the Hanford vadose samples was hexavalent, coordinated as the uranyl ion (UO2
2+), confirmed by x-ray-absorption spectroscopic measurements described in detail elsewhere (Catalano et al. 2004b; Catalano et al. 2006; Wang et al. 2004).
When the concentration of un-complexed uranyl and other mineral components (such as silica) combined exceed the solubility constant for a specific mineral, that mineral will precipitate. In nature, uranyl minerals precipitate near the source of uranyl ion, which is usually the oxidation of a U(IV) mineral, such as uraninite (UO2). The dissolved uranyl may react immediately with components of the dissolving groundwater, but down-gradient mixing with groundwater of a different composition or reaction of the groundwater with aquifer minerals may contribute precipitation, driving components to solution (Finch and Murakami1999). Therefore, uranyl mineral deposits are commonly ”zoned,” forming a less soluble mineral along the groundwater flow path until the non-uranyl component is exhausted. This will then form other minerals until the concentration of uranyl is below solubility limits within the aquifer environment. The precipitation of uranyl phases is also influenced by the effect on solubility of pH, mediated by water-rock interaction to impose an alkalinity gradient on migrating groundwater. As discussed in Section 4, the aqueous speciation of uranyl ion over varying pH, and with potential complexing ions, is important in determining the solubility-limiting mineral phase. The overall paragenesis of important uranyl-mineral groups in the presence of potential reactive-groundwater components is presented in Figure 8.3 (Finch and Murakami 1999). Uranyl hydroxides precipitate where the more soluble complexes are absent. Otherwise, uranyl carbonates (or sulfates) precipitate from the uranyl-complexant solution, or, where dissolved silica or phosphate is available, the relatively insoluble silicate or phosphate minerals precipitate. Evolving-groundwater composition controls the saturation conditions and precipitation of uranyl minerals. Because the geochemical controls on precipitation are the same, the precipitation of uranyl minerals in nature is analogous to the migration and precipitation of uranyl in vadose Hanford sediments. The sudden release of uranyl into the vadose zone is analogous to the introduction of uranyl into an aquifer through uraninite oxidation. The flush of uranyl-bearing waste solutions through the vadose zone caused mixing with disparate (if sparse) pore solutions, and the migrating fluid pH could be moderated by reaction with mineral surfaces. The fluid could partially dissolve the enclosing silicates or exchange its predominant cation (usually Na+) with exchangeable cations on solid surfaces (see Section 9). Thus, the dissolved uranyl ion could experience a rapidly varying aqueous environment and reach saturation with respect to one or more solid phases during migration.

8.6
Figure 8.3. Schematic Representation of the Paragenesis of Important Uranyl Mineral Groups (Finch and Murakami 1999).
8.2.1 241-BX-102 Overfill Event
Investigations of contaminated sediments removed from the vadose-zone plume, careful analysis of groundwater isotopic variations, spectral gamma logging of the vadose zone within and adjacent to the B-BX-BY Tank Farm, and experimentation with simulated-waste solutions and Hanford Formation sediments were used to examine the emplacement and mobility of uranium released by the 1951 spill, and the origin of nearby uranium within the vadose zone. As discussed below, the interpretation of the data raised questions requiring further sampling and research to fully and unambiguously describe the uranium contamination near the B-BX-BY Tank Farm. The results illustrate the difficulty of investigating contaminants within the deep-vadose environment and the tenuous nature of interpretations made from disparate and incomplete data.
The results of core sampling and analysis are summarized in Section 6, and additional experimentation described in Section 10. More detailed results were presented elsewhere (Serne et al. 2002b). The Hanford Formation at the 299-E33-45 location consisted of gravelly and sandy intervals, broken infrequently by finer-grained, less-conductive sediments. The fine-grained sediments retained moisture at levels greater than 10 Wt.%, but the vadose sediments generally included moisture at less than 10 Wt.%, consistent with uncontaminated, arid Hanford Site environments (Serne et al. 2002a). Just above the water table, the borehole encountered a fine-grained interval, designated the Hanford Plio-Pleistocene unit, which included silty sediments containing elevated moisture contents and a thin-perched water zone. Uranium concentrations defined a lobe of contaminated sediment at depths between 110 and

8.7
145 feet below ground surface (33–44 meter; depths henceforth are presented in ft bgs [feet below ground surface] for consistency with drillers logs), and total gamma logs were consistent with measurements on core samples, except within the Plio-Pleistocene interval, where an unexplained small increase in gamma activity was observed. Within this interval, however, direct measurements of core samples found no detectible uranium.
Electron-microscopy analysis of the contaminated sediment showed that the contaminant uranium occurred within microfractures in a subset of the overall clastic-subsurface sediment, specifically within granitic-lithic fragments, rich in plagioclase and potassium feldspar (Figure 8.4). Spectroscopic and x-ray diffraction studies of the bulk sediments showed that the uranium was hexavalent, and that the uranyl-bearing mineral was a silicate, likely sodium boltwoodite (Catalano et al. 2004a). In fractures, SEM imaging revealed that the uranyl mineralization defined separated uranyl-silicate florettes, associated primarily with plagioclase feldspar (Figure 8.4a and 8.4b). Excavation and preparation of an electron-transparent slab of fracture fill for imaging in TEM (Figure 8.4c) showed the spatial relationship across the fractures of individual florettes to the plagioclase substrate and the in-situ development of minor aluminosilicate secondary mineralization. The florettes were composed of uranyl silicate, in nanocrystalline form with single-crystal domains of approximately 5 nm across (Figure 8.4d). Electron-diffraction analysis was consistent with the identification of the secondary mineral as sodium boltwoodite (not shown).
Figure 8.3. Uranium Silicate Mineralization in Core Samples Was Confined to Intra-Grain Microfractures in Granitic Lithic Clasts. A and b: backscattered electron images of nanometer-scale uranyl-silicate florettes in fractures; K: potassium feldspar, P: plagioclase feldspar, S: smectite secondary mineralization. C: cross section in transmission electron microscope image of florettes on the fracture face; Pt: platinum coating applied by focused ion-beam tool. D: transmission electron image of microcrystalline uranyl silicate domains within a uranyl silicate.
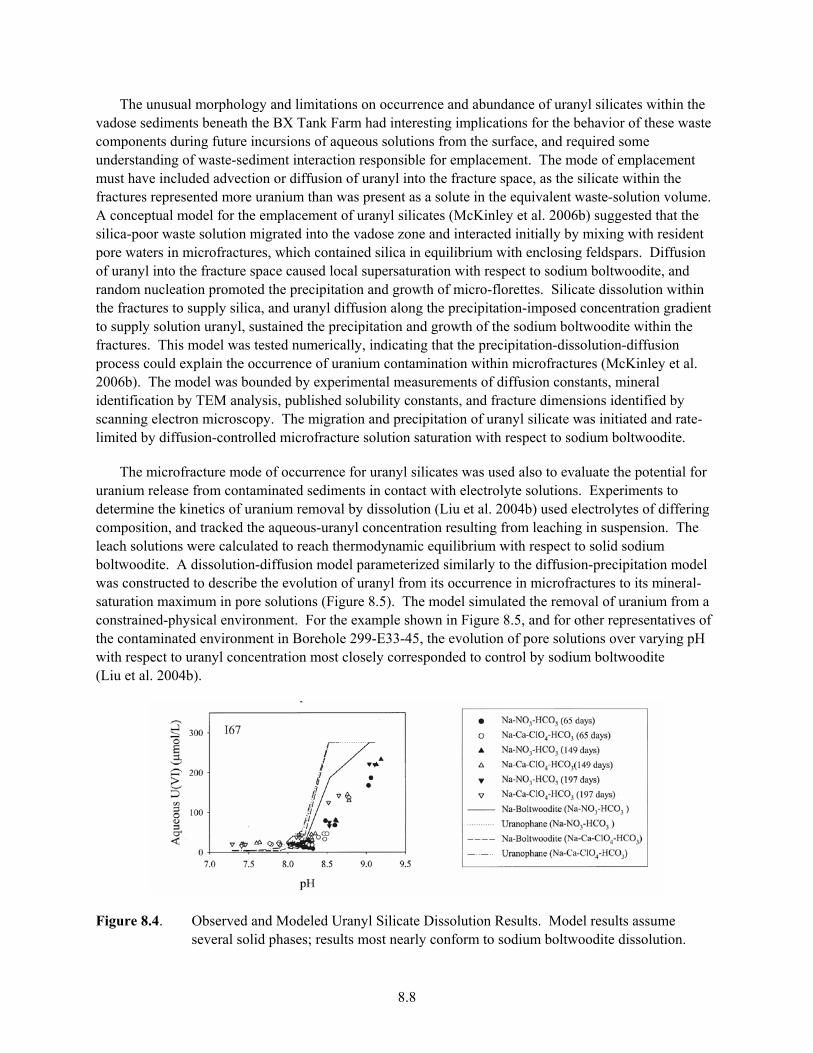
8.8
The unusual morphology and limitations on occurrence and abundance of uranyl silicates within the vadose sediments beneath the BX Tank Farm had interesting implications for the behavior of these waste components during future incursions of aqueous solutions from the surface, and required some understanding of waste-sediment interaction responsible for emplacement. The mode of emplacement must have included advection or diffusion of uranyl into the fracture space, as the silicate within the fractures represented more uranium than was present as a solute in the equivalent waste-solution volume. A conceptual model for the emplacement of uranyl silicates (McKinley et al. 2006b) suggested that the silica-poor waste solution migrated into the vadose zone and interacted initially by mixing with resident pore waters in microfractures, which contained silica in equilibrium with enclosing feldspars. Diffusion of uranyl into the fracture space caused local supersaturation with respect to sodium boltwoodite, and random nucleation promoted the precipitation and growth of micro-florettes. Silicate dissolution within the fractures to supply silica, and uranyl diffusion along the precipitation-imposed concentration gradient to supply solution uranyl, sustained the precipitation and growth of the sodium boltwoodite within the fractures. This model was tested numerically, indicating that the precipitation-dissolution-diffusion process could explain the occurrence of uranium contamination within microfractures (McKinley et al. 2006b). The model was bounded by experimental measurements of diffusion constants, mineral identification by TEM analysis, published solubility constants, and fracture dimensions identified by scanning electron microscopy. The migration and precipitation of uranyl silicate was initiated and rate-limited by diffusion-controlled microfracture solution saturation with respect to sodium boltwoodite.
The microfracture mode of occurrence for uranyl silicates was used also to evaluate the potential for uranium release from contaminated sediments in contact with electrolyte solutions. Experiments to determine the kinetics of uranium removal by dissolution (Liu et al. 2004b) used electrolytes of differing composition, and tracked the aqueous-uranyl concentration resulting from leaching in suspension. The leach solutions were calculated to reach thermodynamic equilibrium with respect to solid sodium boltwoodite. A dissolution-diffusion model parameterized similarly to the diffusion-precipitation model was constructed to describe the evolution of uranyl from its occurrence in microfractures to its mineral-saturation maximum in pore solutions (Figure 8.5). The model simulated the removal of uranium from a constrained-physical environment. For the example shown in Figure 8.5, and for other representatives of the contaminated environment in Borehole 299-E33-45, the evolution of pore solutions over varying pH with respect to uranyl concentration most closely corresponded to control by sodium boltwoodite (Liu et al. 2004b).
Figure 8.4. Observed and Modeled Uranyl Silicate Dissolution Results. Model results assume several solid phases; results most nearly conform to sodium boltwoodite dissolution.

8.9
Within the limitations imposed by core sampling, the uranium lost during the 1951 spill was apparently confined to a relatively narrow band of sediment in the vadose zone at approximately 140 ft bgs, in a chemical and physical form that was resistant to remobilization. This conclusion was supported by gamma logging results obtained from Well 299-E33-18 (Figure 8.1) in 1992 (not shown), in which uranium was not observed. The cored borehole, 299-E33-45, was within a few meters of Tank BX-102. Its placement was intended to intercept the subsurface plume of uranium left by downward-migrating tank waste, and was influenced by tank-farm infrastructure. Drilling within the lithologically heterogeneous gravelly sediments of the Hanford Formation often results in vertical deviations as the hole progresses, and any borehole represents an essentially one-dimensional transect of a three-dimensional subsurface environment. Thus, the interpretation of the borehole measurements and of the analysis of samples removed by coring was limited by the obscurity of the associated relationship to three-dimensional contaminant distributions. Other data indicated that contaminants from the 1951 leak at BX-102 were not confined to the restricted zone at approximately 140 ft bgs, but migrated to the aquifer, and are still moving through the deep-vadose zone. Groundwater monitoring of a family of wells in the 200 East Area in the 1990s detected a groundwater-contaminant plume, 250 meters wide and 900 meters long, in an area beneath and adjacent to the B-BX-BY Tank farm (Dresel et al. 2002). The origin of the contaminant plume was not evident from routine analyses of groundwater. To investigate plume origin, multiple-collector high-precision uranium isotopic analyses were conducted of samples of vadose-zone contamination and of groundwater (Christensen et al. 2004). The isotope ratios 236U/238U, 234U/238U, and 238U/235U were used to distinguish contaminant sources (Section 7). This investigation indicated that the source of the groundwater contamination was the 1951 overflow event at Tank BX-102. The uranium-isotopic variation of the groundwater plume was deduced to result from mixing between contaminant uranium from this leak and natural background uranium in the vadose zone. Comparison of the locus of groundwater contamination with the position of BX-102 indicated that lateral migration in the vadose zone was at least eight times greater than vertical migration. The time evolution of the groundwater plume suggested an average U migration rate of 0.7–0.8 meters per day, showing slight retardation relative to a groundwater flow of 1 meter per day (Christensen et al. 2004).
Data collected from 1992 to 2006 suggested that waste migration in the vadose zone continued. Gamma spectral logging of monitoring of Well 299-E33-18 (Figure 8.1 and Figure 8.6) showed a temporal increase of uranium and cobalt within the lower vadose zone (McCain 2006). As noted above, uranium was not detected during logging in 1992. The maximum activity of 238U for the logging results shown in Figure 8.6 (at 236 ft bgs) was 1237 pCi g-1, and neutron-density logging results (not shown) indicated a moisture content for this interval of approximately 34 volume percent. Therefore, the equivalent uranium concentration in the pore water was approximately 6600 mg L-1 (27.7 mmol L-1). The stratigraphic horizon, where vadose uranium was observed to increase, was coincident with a moisture anomaly, and with a zone of perched water, perhaps equivalent to the perched-water zone noted in 299-E33-45 (see Section 6). The migration of contaminant uranium along a confining layer just above the groundwater level would be consistent with the observation of lateral migration in large excess of the vertical migration noted within isotopic studies of contaminant origin (Christensen et al. 2004). This could explain the occurrence of an expanding groundwater plume adjacent to the B-BX-BY Tank Farm.
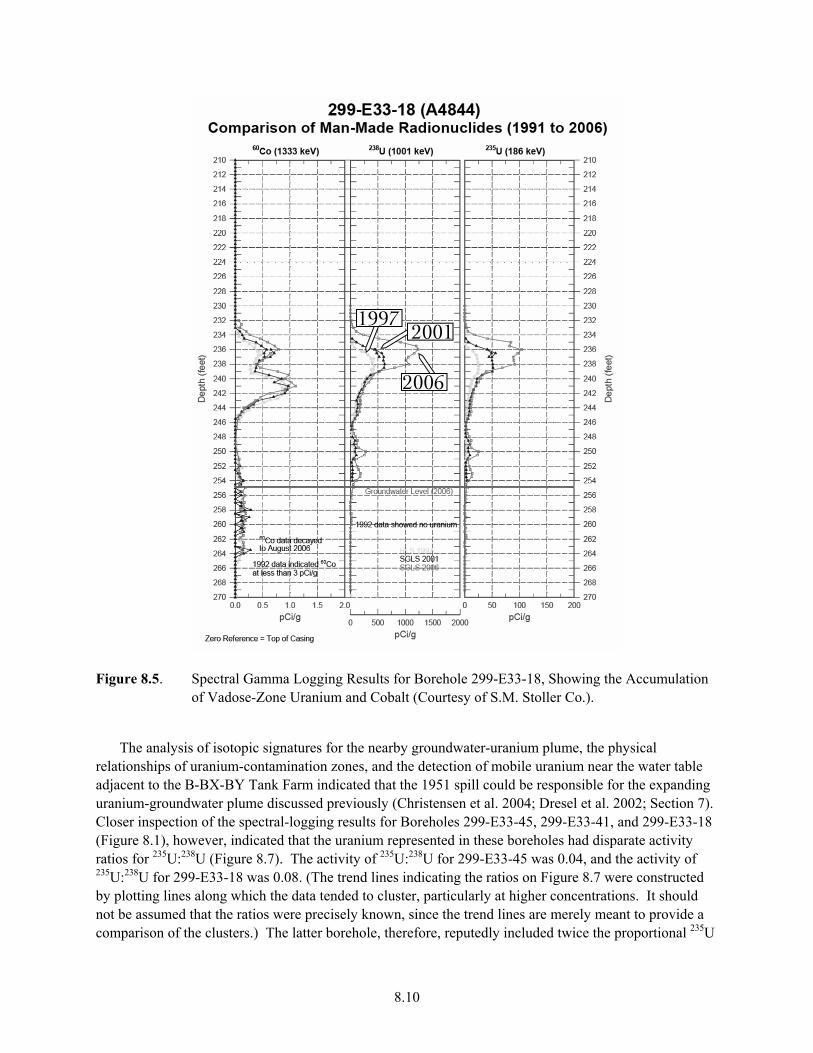
8.10
Figure 8.5. Spectral Gamma Logging Results for Borehole 299-E33-18, Showing the Accumulation of Vadose-Zone Uranium and Cobalt (Courtesy of S.M. Stoller Co.).
The analysis of isotopic signatures for the nearby groundwater-uranium plume, the physical relationships of uranium-contamination zones, and the detection of mobile uranium near the water table adjacent to the B-BX-BY Tank Farm indicated that the 1951 spill could be responsible for the expanding uranium-groundwater plume discussed previously (Christensen et al. 2004; Dresel et al. 2002; Section 7). Closer inspection of the spectral-logging results for Boreholes 299-E33-45, 299-E33-41, and 299-E33-18 (Figure 8.1), however, indicated that the uranium represented in these boreholes had disparate activity ratios for 235U:238U (Figure 8.7). The activity of 235U:238U for 299-E33-45 was 0.04, and the activity of 235U:238U for 299-E33-18 was 0.08. (The trend lines indicating the ratios on Figure 8.7 were constructed by plotting lines along which the data tended to cluster, particularly at higher concentrations. It should not be assumed that the ratios were precisely known, since the trend lines are merely meant to provide a comparison of the clusters.) The latter borehole, therefore, reputedly included twice the proportional 235U
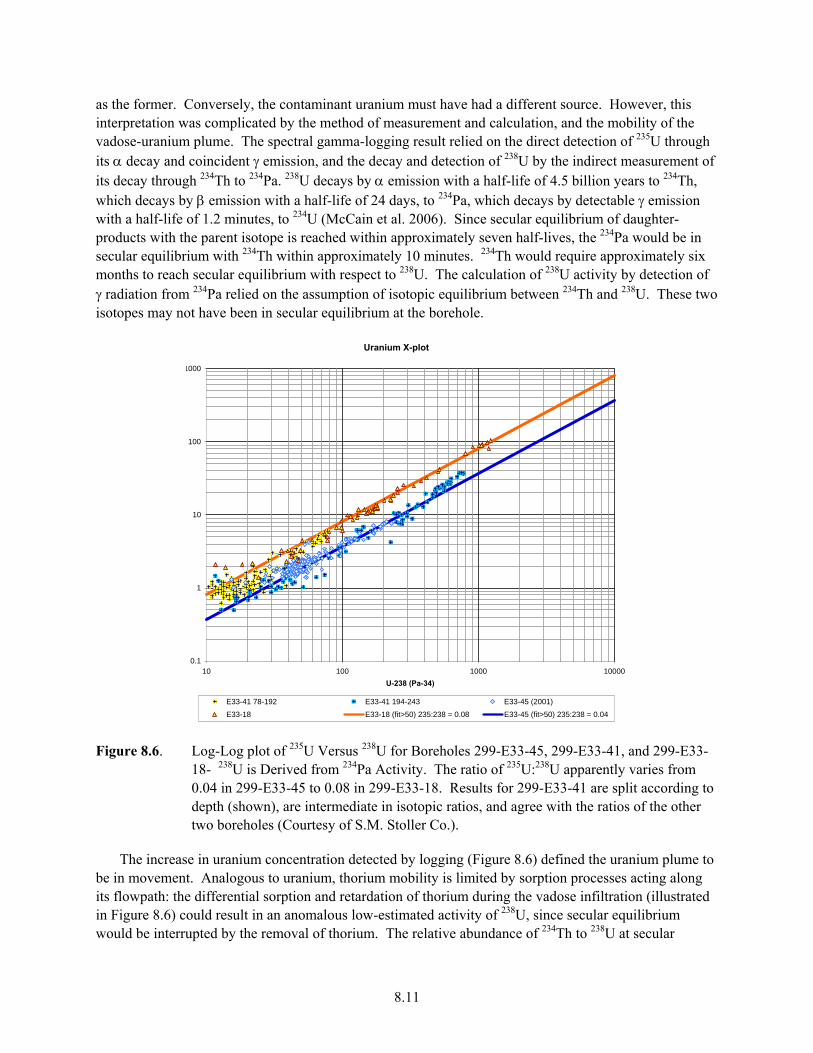
8.11
as the former. Conversely, the contaminant uranium must have had a different source. However, this interpretation was complicated by the method of measurement and calculation, and the mobility of the vadose-uranium plume. The spectral gamma-logging result relied on the direct detection of 235U through its α decay and coincident γ emission, and the decay and detection of 238U by the indirect measurement of its decay through 234Th to 234Pa. 238U decays by α emission with a half-life of 4.5 billion years to 234Th, which decays by β emission with a half-life of 24 days, to 234Pa, which decays by detectable γ emission with a half-life of 1.2 minutes, to 234U (McCain et al. 2006). Since secular equilibrium of daughter-products with the parent isotope is reached within approximately seven half-lives, the 234Pa would be in secular equilibrium with 234Th within approximately 10 minutes. 234Th would require approximately six months to reach secular equilibrium with respect to 238U. The calculation of 238U activity by detection of γ radiation from 234Pa relied on the assumption of isotopic equilibrium between 234Th and 238U. These two isotopes may not have been in secular equilibrium at the borehole.
Uranium X-plot
0.1
1
10
100
1000
10 100 1000 10000U-238 (Pa-34)
E33-41 78-192 E33-41 194-243 E33-45 (2001)
E33-18 E33-18 (fit>50) 235:238 = 0.08 E33-45 (fit>50) 235:238 = 0.04
Figure 8.6. Log-Log plot of 235U Versus 238U for Boreholes 299-E33-45, 299-E33-41, and 299-E33-18- 238U is Derived from 234Pa Activity. The ratio of 235U:238U apparently varies from 0.04 in 299-E33-45 to 0.08 in 299-E33-18. Results for 299-E33-41 are split according to depth (shown), are intermediate in isotopic ratios, and agree with the ratios of the other two boreholes (Courtesy of S.M. Stoller Co.).
The increase in uranium concentration detected by logging (Figure 8.6) defined the uranium plume to be in movement. Analogous to uranium, thorium mobility is limited by sorption processes acting along its flowpath: the differential sorption and retardation of thorium during the vadose infiltration (illustrated in Figure 8.6) could result in an anomalous low-estimated activity of 238U, since secular equilibrium would be interrupted by the removal of thorium. The relative abundance of 234Th to 238U at secular
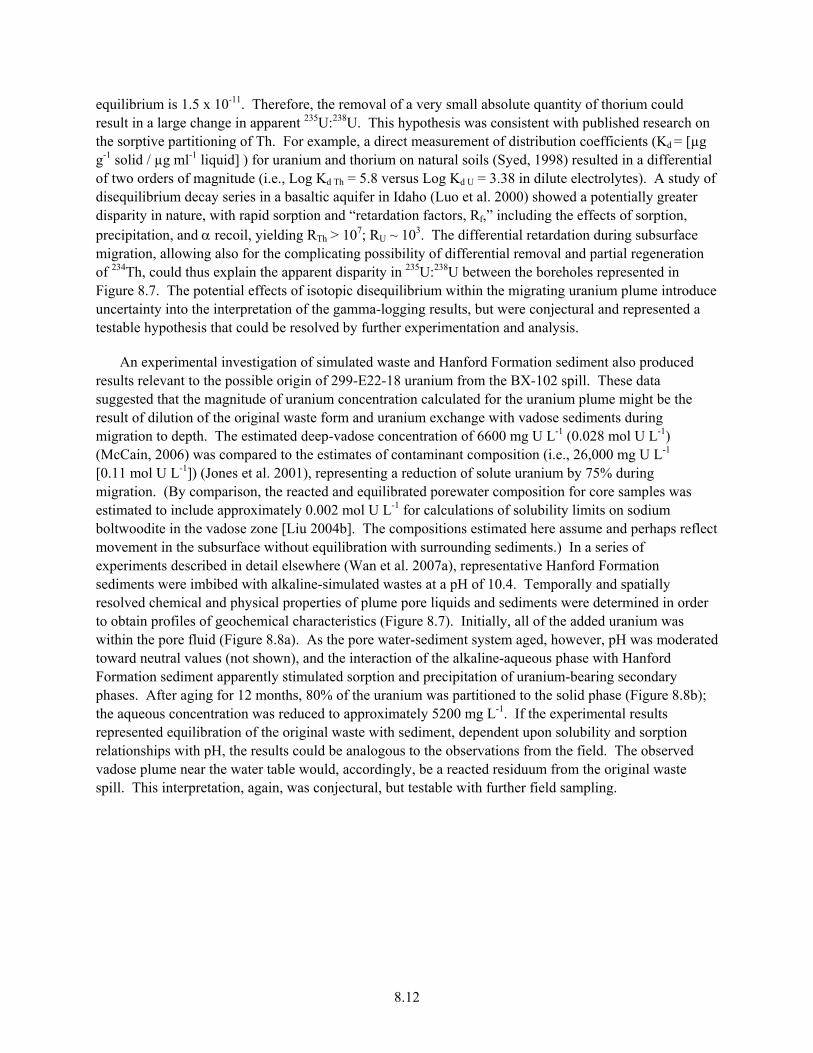
8.12
equilibrium is 1.5 x 10⁻¹¹. Therefore, the removal of a very small absolute quantity of thorium could result in a large change in apparent 235U:238U. This hypothesis was consistent with published research on the sorptive partitioning of Th. For example, a direct measurement of distribution coefficients (Kd
= [µg g-1 solid / µg ml-1 liquid] ) for uranium and thorium on natural soils (Syed, 1998) resulted in a differential of two orders of magnitude (i.e., Log Kd Th = 5.8 versus Log Kd U = 3.38 in dilute electrolytes). A study of disequilibrium decay series in a basaltic aquifer in Idaho (Luo et al. 2000) showed a potentially greater disparity in nature, with rapid sorption and “retardation factors, Rf,” including the effects of sorption, precipitation, and α recoil, yielding RTh > 107; RU ~ 103. The differential retardation during subsurface migration, allowing also for the complicating possibility of differential removal and partial regeneration of 234Th, could thus explain the apparent disparity in 235U:238U between the boreholes represented in Figure 8.7. The potential effects of isotopic disequilibrium within the migrating uranium plume introduce uncertainty into the interpretation of the gamma-logging results, but were conjectural and represented a testable hypothesis that could be resolved by further experimentation and analysis.
An experimental investigation of simulated waste and Hanford Formation sediment also produced results relevant to the possible origin of 299-E22-18 uranium from the BX-102 spill. These data suggested that the magnitude of uranium concentration calculated for the uranium plume might be the result of dilution of the original waste form and uranium exchange with vadose sediments during migration to depth. The estimated deep-vadose concentration of 6600 mg U L-1 (0.028 mol U L-1) (McCain, 2006) was compared to the estimates of contaminant composition (i.e., 26,000 mg U L-1 [0.11 mol U L-1]) (Jones et al. 2001), representing a reduction of solute uranium by 75% during migration. (By comparison, the reacted and equilibrated porewater composition for core samples was estimated to include approximately 0.002 mol U L-1 for calculations of solubility limits on sodium boltwoodite in the vadose zone [Liu 2004b]. The compositions estimated here assume and perhaps reflect movement in the subsurface without equilibration with surrounding sediments.) In a series of experiments described in detail elsewhere (Wan et al. 2007a), representative Hanford Formation sediments were imbibed with alkaline-simulated wastes at a pH of 10.4. Temporally and spatially resolved chemical and physical properties of plume pore liquids and sediments were determined in order to obtain profiles of geochemical characteristics (Figure 8.7). Initially, all of the added uranium was within the pore fluid (Figure 8.8a). As the pore water-sediment system aged, however, pH was moderated toward neutral values (not shown), and the interaction of the alkaline-aqueous phase with Hanford Formation sediment apparently stimulated sorption and precipitation of uranium-bearing secondary phases. After aging for 12 months, 80% of the uranium was partitioned to the solid phase (Figure 8.8b); the aqueous concentration was reduced to approximately 5200 mg L-1. If the experimental results represented equilibration of the original waste with sediment, dependent upon solubility and sorption relationships with pH, the results could be analogous to the observations from the field. The observed vadose plume near the water table would, accordingly, be a reacted residuum from the original waste spill. This interpretation, again, was conjectural, but testable with further field sampling.
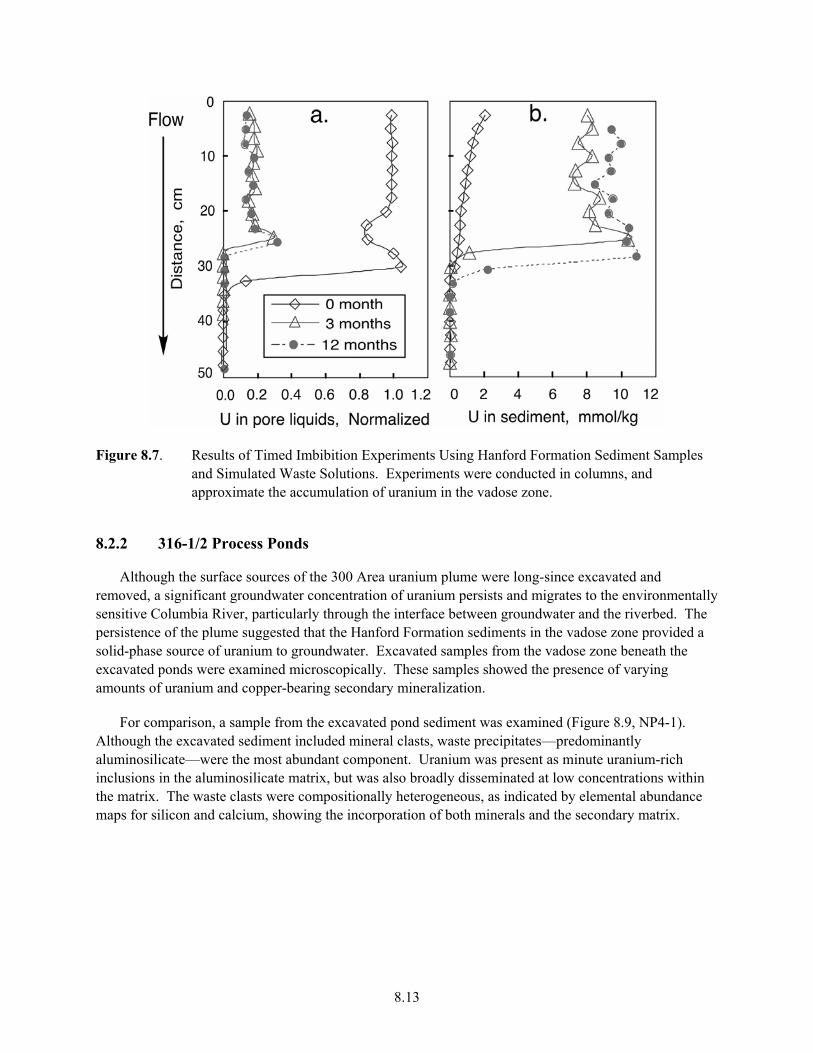
8.13
Figure 8.7. Results of Timed Imbibition Experiments Using Hanford Formation Sediment Samples and Simulated Waste Solutions. Experiments were conducted in columns, and approximate the accumulation of uranium in the vadose zone.
8.2.2 316-1/2 Process Ponds
Although the surface sources of the 300 Area uranium plume were long-since excavated and removed, a significant groundwater concentration of uranium persists and migrates to the environmentally sensitive Columbia River, particularly through the interface between groundwater and the riverbed. The persistence of the plume suggested that the Hanford Formation sediments in the vadose zone provided a solid-phase source of uranium to groundwater. Excavated samples from the vadose zone beneath the excavated ponds were examined microscopically. These samples showed the presence of varying amounts of uranium and copper-bearing secondary mineralization.
For comparison, a sample from the excavated pond sediment was examined (Figure 8.9, NP4-1). Although the excavated sediment included mineral clasts, waste precipitates—predominantly aluminosilicate—were the most abundant component. Uranium was present as minute uranium-rich inclusions in the aluminosilicate matrix, but was also broadly disseminated at low concentrations within the matrix. The waste clasts were compositionally heterogeneous, as indicated by elemental abundance maps for silicon and calcium, showing the incorporation of both minerals and the secondary matrix.
8.14
Figure 8.8. Electron Microprobe Comparisons of Uranium, Calcium, and Silicon Concentrations in Process Pond Materials (NP4-1) and in Sediments Excavated From Beneath the Process Ponds. Uranium-rich solids are less abundant at depth. False-color scales are in x-ray intensity (counts per second per nA).
The vadose sediments (Figure 8.9, NPP2-0.5 and NPP2-4), were predominantly mineral and lithic clasts, but were coated with aluminosilicate mineralization. In the EMP images shown in Figure 8.9, this coating was apparent, but the incorporation of uranium was apparently different from that in primary process-pond wastes. The figure includes backscattered electron images of samples NP4-1 and NPP2-4 (the image of sample NPP2-05 was similar to NPP2-4 and was omitted for brevity). The morphology of the NPP aluminosilicate coating was similar to the NP Process Pond precipitates, and the compositional heterogeneity of the coating in the NP and NPP samples was similar (calcium and silicon-abundance maps showed a similar compositional texture), except with respect to uranium. Disseminated uranium in the NPP samples was absent or below the detection limit for EMP analysis. In addition, the abundance of uranium-rich inclusions in the NPP samples decreased with depth, and was observed as sparsely distributed minute blebs in the NPP2-4 samples (Figure 8.9). There was also a significant calcium carbonate component, and this could contribute to the low-abundance uranium component through substitution of uranyl for calcium (Kelly et al. 2003).
8.15
To investigate whether uranium persisted with depth into the vadose NPP environment, a more sensitive methodology than EMP analysis was required. The x-ray microprobe (XMP) and x-ray absorption spectroscopy methodology has been used in combination with SEM images to provide sensitive compositional information, along with detailed morphology (Fredrickson et al. 2004; McKinley et al. 2004; McKinley et al. 2005). Samples NPP4-2 and NPP1-16 (Figure 8.10) were examined to determine whether uranium was detectible at depth. The backscattered electron image for sample NPP2-4 showed that the mineral clasts were coated with aluminosilicate mineralization. The false-color EMP abundance maps were adjusted to reveal the presence of copper and uranium at the lowest detectible levels (the solid-phase concentrations were not determined). The presence of copper in clast coatings was apparent, but obscured by the similarity in intensity to background (coatings were apparent in the EMP copper-elemental abundance map of Figure 8.9, but background signals within some silicate portions of the clasts were displayed as copper as well). Uranium was only observed in uranium-rich inclusions in the EMP portions of the images (red arrows). An overlay of XMP results on EMP maps, however, showed copper within the aluminosilicate clast coatings, and confirmed the presence of compositionally mottled aluminosilicate clasts (Figure 8.10, green arrow) containing copper and uranium, similar to the major component of NP samples (Figure 8.9). The uranium-abundance map was consistent with the Figure 8.9 results for uranium-rich inclusions (Figure 8.10, red arrows), and for the presence of much lower concentrations of uranium in low-abundance aluminosilicate coatings. Results for sample NPP1-16 (Figure 8.10) were more difficult to interpret. The uranium x-ray abundance was monitored with two detectors—an energy-dispersive detector and a wavelength dispersive detector—in the XMP. The sample was subsequently imaged using the EMP. The energy-dispersive detector appeared to detect uranium. The areas of high abundance, however, were coincident with iron-rich phases visible in backscattered electron imaging (confirmed by Fe-abundance maps, not shown; Figure 8.10, blue arrows). The more sensitive wavelength-dispersive detector showed very noisy, but very low abundances for uranium at these locations. Apparently, the energy-dispersive detector was interpreting Fe Kα coincidence x-rays as U Lα x-rays. The “noisy” wavelength-dispersive image corresponds to no detectible uranium in the sample.
The inclusion of uranium-rich minerals and of disseminated copper and uranium in aluminosilicate coatings on sediment clasts suggested that this was the result of aluminate-rich wastes migrating into the vadose zone and precipitating after reaction with sediment components. Samples of the coatings were removed for x-ray-diffraction analysis by direct manipulation and scraping under a binocular microscope. The procedure yielded samples that were minute and not uniform in mass, but which provided major-phase mineral identification of the coatings (Figure 8.11). Two mineral components were identified—clinochlore and muscovite, labeled “C” and “M,” respectively—in the 5-degree to 15-degree two-theta scan in Figure 8.11. These minerals were not likely precipitated from process-pond wastes, given the associated well-developed crystal structure. These two minerals are common and ubiquitous components of the Hanford Formation, and so represent pre-existing detrital minerals in the fine-fraction of the vadose sediments. A continuous leakage of process-pond wastes or the periodic leakage of low-pH wastes into the vadose zone causing reaction with the detrital aluminosilicate minerals and pore-fluid phosphate is a reasonable interpretation of the microscale distributions of copper and uranium that was presented here. The uranium and copper associated with the aluminosilicates may represent sorbed cations or may represent secondary mineralization under alkaline or acidic regimes.

8.16
Figure 8.9. Electron Microprobe and X-Ray Microprobe Analyses of Copper and Uranium in Deeper NPP Sediments. Disseminated copper and uranium, along with uranium-rich solids are present at a depth of four feet, but neither is detectible at a depth of 16 feet, even using the x-ray microprobe. Sample NPP-2 includes a backscattered electron image and electron microprobe elemental abundance maps, overlain by x-ray microprobe abundance maps. The red arrows indicate occurrence of uranium-rich mineralization; the green arrow indicates an area of disseminated copper and uranium.
Figure 8.10. X-ray Diffraction Analysis Over the Two-Theta Range of 5–10 Degrees; C: Chlinochlore; M: Muscovite.

8.17
Spectroscopic and µX-ray diffraction investigations of NPP sediments suggested that the uranium-rich mineral was metatorbernite [Cu(UO2PO).8H2O] (Arai et al. 2007; Catalano et al. 2006), but microscale x-ray spectroscopy and µX-ray diffraction of these sediments also identified the presence of uranophane (Ca[UO2]2[SiO3(OH)]2·5H2O) and uranium-associated muscovite, along with metatorbernite. The NPP sediments contain significant calcium carbonate (Zachara et al. 2005), apparently again at a scale that was smaller than could be readily observed using SEM methods. The µEXAFS results for the uranium-rich phase (Figure 8.12) were well, but not definitively, fit by model spectra for metatorbernite, allowing for the presence of other phases, including uranophane and rutherfordine (UO2CO3) (Arai et al. 2007). A focused-ion-beam excavation and TEM analysis of the uranium-rich phase in NPP2-4 (Figure 8.13) showed a heterogeneous structure within the metatorbernite inclusions, in which areas of high-uranium concentration were imbedded in the metatorbernite lamella. In addition, the metatorbernite lamella consisted of phosphate domains that were nanocrystalline (lattice fringe images in Figure 8.13 indicate short-range crystalline domains within the lamella). The results were consistent with the non-ideal and heterogeneous interpretation of µXAS spectra (Arai et al. 2007). The overall evidence suggested that solid-phase uranyl, in uranium-rich solid phases and broadly disseminated at low-concentrations associated with detrital aluminosilicates, represented a pool of solid-phase reactant that supplied the groundwater-uranium plume through dissolution and diffusion through the chlorite-muscovite coatings on mineral surfaces.
Figure 8.11. Fourier Transformed EXAFS Spectra for 300 Area Uranium Contaminated Sediments (Arai et al. 2007).

8.18
Figure 8.12. Slab of Metatorbernite From NPP2-4, Thinned by Focused-Ion-Beam Milling and Examined by TEM. Inset: lattice fringe image of nanocrystalline metatorbernite.
8.3 Conceptual Models of U Precipitation Processes Contaminant uranium at the 200 Area BX Tank Farm and at the 300 Area Process Pond sites resided
in secondary uranyl mineralization that differed at the two sites according to the original waste composition. At the 200 Area, the silica-poor waste of large volume and alkaline pH reacted with Hanford Formation sediments to invade interior domains of clasts of particular lithology, and to form relatively isolated solid-uranyl silicate phases. At the 300 Area, the continuous leakage to the subsurface, whether of alkaline or acidic wastes laden with abundant copper, uranium, and aluminate, allowed the formation of high-surface-area secondary-aluminosilicate grain coatings containing isolated uranyl-bearing solid phases. The formation of low-solubility uranyl-copper-phosphate (metatorbernite) at the 300 Area may have been facilitated by the large fluctuations in pH—and thus the local solubility of uranyl as secondary hydroxides, carbonates, or sorbed species—combined with aquifer supplies of dissolved phosphate. Local, random nucleation of uranyl phosphate, comparable to localized nucleation of uranyl silicate in the 200 Area sediments, may have provided control on the distribution of metatorbernite by inhibiting nucleation within a very local diffusion gradient. Other distinct uranyl phases exist in these sediments that have yet to be identified. The combination of solid phases of variable reactivity and solubility warrants investigation as a compound source of uranyl to groundwater through iterative and incremental reaction and equilibration with migrating pore waters.
The demonstrated results represent intensive efforts to understand the behavior of contaminant uranium at the sites studied, but also represent limitations on the researchers’ knowledge of these spills and the threat posed to the environment. For the 200 Area study, the construction of Borehole 299-E33-45 was intended to sample and characterize the vadose-zone uranium spill. The logging data and isotopic studies suggest, however, that the borehole transected the contamination lobe, but did not completely capture its spatial and compositional range. For the 300 Area study, samples showed that uranyl contamination was entrained in a number of solid phases that together represented a persistent source of uranium to the groundwater entering the Columbia River. The distribution of uranium was not determined by the limited sub-aerial extent of the sampling, and detailed information concerning the migration of dissolved uranium into the groundwater environment is not available.

8.19
With respect to widespread uranium contamination at the Hanford site, the results suggested that the mobility of uranium in a relatively uniform lithologic environment was dependent on the composition, and possibly the thermal characteristics, of the waste as it entered the vadose zone. The chemical form of secondary mineralization that subsequently controlled uranium mobility was determined by the composition of the migrating waste and its evolution during continued interaction with the pre-existing Hanford sediment and vadose-zone pore water. Knowledge of particular waste compositions may be used in combination with geochemical-modeling codes to make a prediction of possible solid phases precipitated during waste migration. Such modeling was used during the construction of the diffusion-precipitation model described in Section 8.2.1. The original waste composition was estimated from tank waste inventories (Jones et al. 2001), and the waste’s initial behavior in the presence of pore fluids was modeled to determine the likely composition at depth (phosphate was modeled to be quantitatively removed by apatite precipitation)(McKinley et al. 2006a). Then, the microscale contributors of silica were used to further model the mode of precipitation for sodium boltwoodite. However, the potentially important role of temperature in enhancing aluminosilicate dissolution and sustaining elevated dissolved-silica concentrations was not addressed.
The evolution of uranyl-bearing wastes may potentially follow one of the paths described for natural solutions in Figure 8.3. Prediction of specific solids within a group (silicate, phosphate, etc.) would likely be difficult due to the uncertainty regarding the thermodynamic constants for the uranyl minerals (Finch and Murakami 1999), along with the imprecision with which such changing parameters as pH can be estimated during waste interaction with the subsurface. However, the composition of the aquifer solids and pore water can be measured or estimated fairly well, and the compositions of the waste streams are grouped into relatively few compositional ranges. The major U(VI)-contaminated sites, other than the two described here, for example, may contain significant concentrations of carbonate and phosphate-complexing agents, but the variations in uranium/carbonate, uranium/phosphate, uranium/sulfate, and calcium/phosphate have been estimated (Section 3). For a specific waste stream, with the aquifer supplying calcium and silicon, and pH evolving by waste-sediment reactions toward a predictable natural value, the natural system presented in Figure 8.3 represents a sound conceptual model for the evolution and precipitation of uranyl wastes.
8.4 Summary and Implications • U(VI)-containing waste solutions with significant concentrations of either acid or base can lead to the
precipitation of U(VI)-mineral forms when disposed to the Hanford vadose zone. Such precipitation is encouraged by sediment-waste reactions that neutralize pH, and that yield mineral-dissolution products that are reactive with U(VI). Such precipitates can persist long after other waste-stream constituents have dissipated.
• Uranyl associated with the 1951 overfill event of bismuth-phosphate metal wastes at Tank BX-102 precipitated at depth within the vadose zone within microfractures of granitic-lithic fragments rich in plagioclase and potassium feldspar (E33-45). Various analytical methods indicated that the precipitates are uranyl silicates, and probably sodium boltwoodite. The center of mass of the metal-waste plume is captured by sediment in the form of these precipitates, although associated porewaters contain high U(VI) concentrations.
• Laboratory-dissolution experiments with E33-45 core materials and interaction experiments with metal-waste simulants suggest that the solubility of Na-boltwoodite is sufficiently high to yield pore-water U(VI) concentrations that are above 20 mmol/L. These concentrations are similar to 2006

8.20
observations made by spectral-gamma monitoring of vadose-zone perched water (236 bgs) in Well 299-E33-18. The controversy surrounding the source of U(VI) in the B-BX-BY groundwater plume underscores the difficulty of investigating contaminants within the deep-vadose zone and the tenuous interpretations made from disparate and incomplete data.
• Uranyl discharged in poorly defined acidic and basic-waste streams to the 300 Area Process Ponds precipitated in diverse forms, including carbonates, phosphates, and others that have only been partially characterized. The nature of these precipitates changed with depth through the vadose zone as pH moderated and solution composition changed through waste-sediment reaction.
• U(VI)-containing precipitates in 300 Area Process Pond sediments exist in complex physicochemical associations that are relict from the period of waste disposal and management. These associations include U(VI) co-precipitates in calcite/aragonite, discrete metatorbernite precipitates in secondary aluminosilicate grain coatings, and other undefined and possible amorphous-U(VI) phases associated with copper oxide and copper carbonate grain coatings.
• Precipitated U(VI) phases have important implications to future behavior and remediation because they 1) take more time than do adsorption complexes to react to steady state with contacting fluids, 2) often exist in microscopic environments in contaminated sediments that are partially isolated from advective fluid flow, and 3) require specific modeling approaches to describe the respective interactions with fluids and impact on contaminant transport.
9.1
9.0 Adsorption and Surface Complexation
The severity of environmental issues associated with uranium depends on migration velocity away from the contaminant source into the surrounding environment. Because radionuclides with high-adsorption affinity to minerals present in vadose-zone or aquifer sediments tend to be retarded compared to vadose-zone pore water and groundwater flow, adsorption of uranium at mineral-water interfaces is one of the most important processes controlling the mobility of uranium in the subsurface environment (Stumm 1992; Stumm and Morgan 1996; Drever 1997; Jenne 1998). The adsorption process of uranium in soil or sediment is complex due to the presence of multiple-interactive adsorbents and potentially variable pore-water compositions containing solutes that modify uranium-aqueous speciation (Section 4) or that compete for surface sites.
Historically, uranium adsorption on Hanford sediments has been described using the constant-Kd model (Section 5) because of its simplicity and ease in incorporation into hydrologic-transport models. Often, little attention has been given to the nature of the retardation or attenuation process (e.g., adsorption-desorption or precipitation-dissolution), which defines whether the concept is even valid. Moreover, and as discussed in Sections 5 and 6, U(VI) Kd values on Hanford sediment exhibit significant variability in ways that have proven difficult to generalize. In this section, a surface-complexation modeling (SCM) approach is discussed that can describe the changes in uranium adsorption as aqueous and solid-phase geochemical conditions vary (Dzombak and Morel 1990; Davis et al. 1998). This approach may be a more scientifically sound method to describe uranium adsorption on Hanford vadose-zone and aquifer sediments over the range in properties and conditions observed.
9.1 Uranium (VI) Adsorption on Various Adsorbents
A large number of uranium-adsorption studies on different adsorbents, including minerals and complex-natural sediments, have been completed during the past 20 years in support of issues pertaining to the disposal of spent-nuclear fuel and nuclear wastes in subsurface geological repositories, and to the remediation of U-contaminated wastes, soils, and groundwater (Hsi and Langmuir 1985; Waite et al. 1994; Kohler et al. 1996; Wazne et al. 2003; Davis et al. 2004a; Zachara et al. 2005). Because U(VI) is the most stable valence state under oxidizing conditions (Lenhart et al. 2000; Davis et al. 2004a), most uranium-adsorption experiments have been conducted using U(VI). The adsorption of U(VI) onto minerals, including quartz, clinoptilolite, montmorillonite, kaolinite, smectite, phyllite, alumina, ferrihydrite, goethite, hematite, and hydrous titanium oxide has been studied (Waite et al. 1994; Mckinley et al. 1995; Turner et al. 1996; Pabalan et al. 1998; Payne et al. 1998; Bargar et al. 2000; Arnold et al. 2001; Villalobos et al. 2001; Kohler et al. 1996; Payne et al. 2004). The similarity in the pH dependence of U(VI) adsorption (see Section 5) on many different mineral forms suggests that U(VI) adsorption is sensitive to site concentration, but not surface change (Pabalan et al. 1998). In addition to pH dependence, U(VI) adsorption is affected by carbon dioxide partial pressure (Pco2), total-U(VI) concentration, ionic strength, and adsorbent concentration. The general trend for U(VI) adsorption to mineral sorbents shows similar trends (e.g., decreasing U(VI) adsorption with increasing Pco2, total U(VI) concentration and ionic strength, and increasing adsorption with an increase in adsorbent concentration), regardless of sorbent type. U(VI) adsorption on kaolinite is weaker than ferrihydrite under similar experimental conditions (Payne et al. 1998). Various Fe oxides (hydrous ferric oxide, hematite, and goethite) show different amounts of U(VI) adsorption per mass of adsorbent with varying ionic strengths
9.2
and pH (Hsi and Langmuir 1985). Higher U(VI) adsorption is also reported onto hydrous ferric oxide (HFO) and goethite compared to hematite with the same solution conditions (Hsi and Langmuir 1985; Jang et al. 2007). U(VI) adsorption has been shown to be dominated by reaction with minor impurity adsorbents, ferrihydrite and with Ti-oxide, in phyllite and kaolinite (Waite et al. 2000; Arnold et al. 2001; Barnett et al. 2002; Payne et al. 2004). Because of high surface area and adsorption-site concentration, more U(VI) adsorption is found on montmorillonite as compared to other adsorbents (montmorillonite > clinoptilolite > α-alumina > quartz) (Pabalan et al. 1998). Kd values to different mineral adsorbents vary over 5 orders of magnitude, even with similar background geochemical conditions (Section 5). This variation can be minimized if the adsorption data are normalized to the specific surface area of the mineral adsorbent where Ka = Kd/SEA and SEA is the effective surface area. Quartz, clinoptilolite, α-alumina, and montmorillonite display identical surface-area normalized Kd values (Pabalan et al. 1998).
Even though surface-area normalized U(VI)-adsorption values, Ka, show reasonable predictive capabilities for U(VI) adsorption to single-mineral adsorbents, application of Ka to sediments is still questionable because of difficulties in accurately identifying the single minerals present and their adsorption parameters. However, U(VI) adsorption on natural sediments displays the same dependence on pH, Pco2, total-U(VI) concentration, and adsorbent concentration as does U(VI) adsorption by single minerals (Barnett et al. 2002; Davis et al. 2004a; Dong et al. 2005; Um et al. 2007b). Difficulty remains in reconciling the adsorption behavior of whole sediment with that of its component mineral phases.
U(VI) adsorption to Hanford sediment a range in Kd values as described in Section 5. The recommended U(VI)-Kd range suggested in the Immobilized Low-Activity Waste Performance Assessment for far-field conditions at the Hanford Site is 0.1 to 80 (Kaplan 2000; Krupka et al. 2004). However, the U(VI)-adsorption Kd on Hanford sediment under natural Hanford groundwater conditions is moderate, with Kd values ranging from approximately 0.2 to 4 mL/g (Cantrell et al. 2002), even though a slightly higher U(VI)-Kd value (5.0 ±1.3 mL/g) is recommended for ferric-oxide-rich coated Hanford aquifer sediments (Um et al. 2005; Um et al. 2007a).
9.2 The Surface-Complexation Model (SCM)
Although quantification of adsorption is essential to predict uranium transport in subsurface environments, there is disagreement concerning which modeling approach (e.g., the constant Kd, empirical isotherm, or surface-complexation model [SCM]) provide the most acceptable or defensible predictive capabilities (Langmuir 1997; Krupka et al. 2004). Because Kd values for uranium adsorption vary according to temporal or spatial variation in geochemical conditions (Section 5), increased uncertainty in the estimation of uranium retardation can be introduced to a transport model when a constant-Kd approach is used for scenarios with varying geochemical conditions (Bethke and Brady 2000). However, because the SCM describes surface-complex formation of U(VI) at mineral-water interfaces through mass-action equations (Waite et al. 1994; Kohler et al. 1996), and treats surface-functional groups in the solid phase as analogues to complexing ligands in aqueous solution, the SCM can accommodate changes in adsorbate speciation and surface charges of the adsorbent (Langmuir 1997). Surface-complexation models take into account the coordination chemistry of oxide and hydroxide surfaces (or the edges of clay minerals), but also incorporate coulombic interactions between solvated ions and charged surfaces based on electrical double layer (EDL) theory.
The surface charge (positive or negative) of an adsorbent in contact with solution generates an electrostatic potential that declines rapidly away from the adsorbent surface. Dissolved counter ions with
9.3
opposite charge are accumulated near the surface (Diffuse layer) and co-ions, which have the same charge as the surface charge, are present at a greater distance from the surface. The activity change of an ion moved from the surface to the bulk solution is described by the EDL, with an exponential Boltzmann expression (Dzombak and Morel 1990; Langmuir 1997). The activity of an ion near a solid surface is not the same as that of the same ion in the bulk solution. The activity of an ion, for example H+, at a certain distance from the surface is expressed as a Boltzmann distribution:
[H+]surface location x = [H+] bulk solution exp)( )(
RTzF Xψ−
(9.1)
where z = charge of the ion F = Faraday’s constant (96,485 Coulombs/mol of electrons) ψ(x) = electrical potential in volts at location x R = gas constant (8.314 J/mol K) T = temperature in Kelvin.
Surface-complexation reactions are described by mass-action equations with correction for electrostatic effects using EDL theory. The apparent binding constants are empirical parameters related to thermodynamic constants (intrinsic constants) via activity coefficients of the surface-complexing species (Langmuir 1997). Thermodynamic constants for the U(VI)-aqueous species are usually obtained from the literature, with the Nuclear Energy Agency (NEA) database for uranium being preferred (Grenthe et al. 1992; Silva et al. 1995; Guillaumont and Mompean 2003). Based on the difference in the structure of the double layer, changes in surface potential and surface charge, and the positions of the adsorbed species, the SCM conceptualization can be subdivided into at least three mathematical formulations, categorized as constant capacitance model (CCM), diffuse layer model (DLM), and triple layer model (TLM) (Sposito 1984).
Surface-complexation models accurately describe experimental adsorption results for U(VI) onto single-mineral phases (Waite et al. 1994; Pabalan et al. 1998; Arnold et al. 2001; Chisholm-Brause et al. 2001; Villalobos et al. 2001; Hsi and Langmuir 1985; Dzombak and Morel 1990; Wazne et al. 2003). In contrast, the application of SCM to soils and sediments has been challenging because of the poor understanding of the thermodynamics of surface-complex formation in natural systems (Barnett et al. 2002; Davis et al. 2004a; Kohler et al. 1996). Heterogeneous adsorbents pose difficulty for minerologic and surface chemical characterization. The surface charge and electrical potential of soil or sediment surfaces are much more complicated than for a single-mineral phase (Davis et al. 1998) because of heterogeneous particle distribution, presence of surface coatings, or competitive adsorption of different ions. These factors make it difficult to quantify Coulombic-correction factors for the EDL.
There are two major approaches for applying U(VI) SCM to mineralogically complex natural materials: 1) the component additivity (CA), and 2) the general composite (GC) approaches (Davis et al. 1998; Davis et al. 2004a). In the CA approach, U(VI) adsorption on a soil or sediment is predicted from surface and mineralogic characterization of the assemblage and independently characterized surface-chemical reactions on each single-mineral phase (Turner et al. 1996; Waite et al. 2000; Arnold et al. 2001; Barnett et al. 2002; Logue et al. 2004). The CA approach is based on the assumption that single or several binary and perhaps ternary or larger combinations of individual mineral phases, such as ferrihydrite, goethite, quartz, feldspar, hematite, and/or clay minerals dominate U(VI) adsorption onto the natural material. The CA approach relies on SCM parameters for the individual sorbents generally taken
9.4
from the following sources: quartz TLM (Davis et al. 2004a; Kohler et al. 1996), ferrihydrite DLM (Waite et al. 1994), goethite TLM (Villalobos et al. 2001), and montmorillonite DLM for clay (Pabalan et al. 1998). An independently developed U(VI) DLM for ferrihydrite (Waite et al. 1994) was used to reasonably predict pH-dependent U(VI) adsorption on three heterogeneous subsurface sediments collected from the Oak Ridge Reservation, the Savannah River Site, and the Hanford Site (upper Ringold formation), respectively, by assuming that the dominant-reactive adsorbent was Fe oxide (Barnett et al. 2002). Davis et al. (2004a) also used the CA approach based on the quartz TLM (Kohler et al. 1996), the montmorillonite DLM (Pabalan et al. 1998), and the ferrihydrite DLM (Waite et al. 1994) to describe U(VI) adsorption on aquifer sediments collected from the Naturita Uranium Mill Tailings Remedial Action (UMTRA) site, Colorado, USA. The model results were highly variable and unsatisfying. Even though the CA approach has an advantage of transferability of model parameters from one field site to another (Arnold et al. 2001; Barnett et al. 2002), the CA-model predictions show significant deviations from experiments resulting from: 1) insufficient estimation of surface-site type and concentration, and 2) lack of fundamental data on effects of background electrolytes on competitive adsorption, surface charge, and electrical potentials (Davis et al. 2004a).
In the GC approach, ion adsorption to natural materials is described by mass-action laws for generalized surface-functional group(s). The stoichiometry and formation constants for U(VI) complexation to the surface group(s) are determined by fitting experimental adsorption data onto the whole mineral assemblage (Davis et al. 1998; Wen et al. 1998; Waite et al. 2000; Davis et al. 2004a. Surface charge and electrical-potential information might also be determined by potentiometric titration (Wen et al. 1998). The interpretation of soil/sediment titration data is made by assuming that all protons consumed or released by the natural material results from acid-base reactions of surface functional groups. However, the analysis and interpretation of soil/sediment-titration data is challenging because of the dissolution of solid phases and desorption of adsorbates over certain pH ranges. Therefore, a non-electrostatic SCM is generally used in the GC approach (Davis et al. 1998). Because of the exclusion of the EDL terms, the mass-action equations alone are not expected to provide accurate representations of the stoichiometry of the reactions at the microscopic scale. However, the nonelectrostatic surface reactions can still be coupled with aqueous-complexation reactions to provide semi-empirical simulations of macroscopic adsorption as a function of aqueous-chemical conditions (Waite et al. 2000; Davis et al. 2004a; Logue et al. 2004).
9.3 Identification of U(VI) Surface Complexing Species
Even though the SCM is widely used for predicting U(VI) adsorption with varying geochemical conditions, identifying the specific nature of surface complexes that are the reaction products of the mass-action laws remains a challenge. Dominant U(VI) surface-complexes for different adsorbent surfaces have been identified empirically by SCM fit, or directly measured using surface-sensitive spectroscopies (Jenne 1998). The SCM can provide an estimate of the predominant U(VI) surface-complexing species based on a best-fit of experimental adsorption data. Hsi and Langmuir (1985) described U(VI) adsorption onto ferrihydrite and goethite as a consequence of both monodentate SOUO2OH and bidentate (SO)2(UO2)3(OH)5
- surface complex formation in carbonate-free solutions. Four different monodentate U(VI) surface complexes [SOUO2OH, SO(UO2)3(OH)5, SOUO2(CO3)2
3-, and SOUO2(CO3)35-] were
needed to fit adsorption data on goethite when dissolved carbonate was present. However, Waite et al. (1994) successfully modeled U(VI)-adsorption on ferrihydrite using just two bidentate surface-complexes, (SO)2UO2 and (SO)2UO2CO3
2-, at strong and weak sites. The two surface complexes,
9.5
(SO)2UO2 and SOUO2CO32-, dominate the total U(VI) adsorption at low and high-pH range, respectively
(Waite et al. 1994; Barnett et al. 2002). This relatively simple, two-site, two-species model has been used to successfully model complex and wide-ranging solution conditions, where U(VI)-aqueous species vary significantly with pH (Waite et al. 1994). One-monodentate, SOHUO2OH+, and two-bidentate U(VI)-surface complexes of (SO)2(UO2)3(OH)5
- and (SO)2UO2CO32- were used to model U(VI) adsorption on
hydrous ferric oxide (HFO) and hematite (Jang et al. 2007). The SCM fit for U(VI) adsorption onto quartz and montmorillonite under carbonate-free conditions was also good when two-monodentate U(VI) surface-complexing species, SOUO2
+ and SO(UO2)3(OH)5, were used (McKinley et al. 1995; Pabalan and Turner 1997; Pabalan et al. 1998; Prikryl et al. 2001). Payne et al. (2004) used three different monodentate U(VI)-surface complexes (SOUO2
+, SOUO2OH, and SOUO2CO3-) to model U(VI)
adsorption on kaolinite in carbonate-containing solutions.
Surface-complexation model fits to U(VI) adsorption on soil or sediment can be more complicated (Table 9.1). Dominant, fitted surface complexes vary between natural materials of different properties: bidentate (SO)2UO2 and (SO)2UO2CO3
2- were observed on both strong and weak sites for a weathered schist (Waite et al. 2000); bidentate (SO)2UO2
+ and (SO)2UO2OH- for very strong, strong, and weak sites on Naturita sediment (Davis et al. 2004a; Kohler et al. 2004); bidentate (SO)2UO2 and (SO)2UO2CO3
2- on natural iron-coated sand (Barnett et al. 2002); monodentate SOUO2
+ and bidentate (SO)2UO2CO32- on
Hanford Integrated Disposal Facility (IDF) (200 East Area) sediment (Um et al. 2007b); monodentate SOUO2OH and SOUO2HCO3 on Hanford 300 Area (North and South Process Ponds) sediments (Bond et al. 2007). Although model results can identify the best suite of surface complexes that describe the experimental data, there are differences between investigators in the surface complexes identified for the same adsorbent. These differences may result from the thermodynamic data used for U(VI)-aqueous species, SCM-fitting approaches, and variations in geochemical conditions. Most SCM-fit results are based on the goodness-of-fit parameter, which is the weighted sum of squares of the difference in value between model predictions and experimental data points divided by the degree of freedom (WSOS/DF) (Herberlin and Westall 1999). However, similar model fits can be obtained when different combinations of U(VI)-surface complexes are used, and the value of WSOS/DF parameter is sometimes not sufficient, alone, to identify the best possible model (e.g. combination of surface complexes) that describes the data.
A much more conclusive approach to identifying U(VI) surface species is direct measurement by spectroscopy. Molecular spectroscopy that provides insight on the stoichiometry, denticity, and chemical composition of adsorbate surface species is complementary information that can constrain the empirical result from SCM fit. Synchrotron-based EXAFS measurements have been the method of choice for such determinations, and the structures of U(VI) surface complexes on many mineral adsorbents include Fe(III) oxides of different types, phyllosilicates, calcite, quartz, and others (Table 9.1) have been established. These surface complexes include mononuclear bidentate U(VI) hydroxyl complexes on hydrous ferric oxide (Manceau et al., 1992); inner-sphere edge complexes and outer-sphere basal plane complexes on smectite

9.6
Table 9.1. Dominant U(VI) surface-complexing species on varying adsorbents.
Surface species Dentate Adsorbents Pco2(atm) Methods Source SOUO2OH mono model fit (SO)2(UO2)3(OH)5 - bi
ferrihydrite/goethite/hematite
0 crystallography
1
SOUO2OH mono SO(UO2)3(OH)5 mono SOUO2(CO3)2
3- mono SOUO2(CO3)3
5- mono
goethite 10-3.5 model fit 1
(SO)2UO2 bi (SO)2UO2CO3
2- bi ferrihydrite 10-3.5 model fit / EXAFS 2
SOUO2+ mono
SO(UO2)3(OH)5 mono montmorillonite 0 model fit 3
SOUO2+ mono
SO(UO2)3(OH)5 mono montmorillonite 10-3.5 model fit 4
SOUO2+ mono
SOUO2OH mono SO(UO2)3(OH)5 mono
quartz / montmorillonite
10-3.5 model fit 5
SOUO2+ mono
SOUO2(OH)3 2- mono quartz / clinoptilolite
10-3.5 model fit 6
(SO)2UO2 bi (SO)2UO2CO3
2- bi goethite 10-3.5 model fit 7
SOUO2+ mono chlorite 10-3.5 model fit 8
(SO)2UO2 bi quartz 10-3.5 model fit 8 SOUO2
+ mono (SO)2UO2 bi
muscovite 10-3.5 model fit 8
SOUO2+ mono albite 10-3.5 model fit 8
(SO)2UO2 bi (SO)2UO2CO3
2- bi ferrihydrite 10-3.5 model fit 8
SOUO2+ mono
SOUO2OH mono goethite 0 model fit 9
(SO)2UO2 bi (SO)2UO2CO3
2- bi natural mineral assemblage
10-3.5 model fit 10
SOUO2+ mono
SOUO2OH mono SOUO2CO3
- mono
kaolinite / Ti oxide
10-3.5 model fit 11
(SO)2UO2 bi (SO)2UO2OH- bi
Naturita sediment
10-3.5 model fit 12,13
(SO)2UO2 bi (SO)2UO2CO3
2- bi natural iron- coated sand
10-3.5 model fit 14
SOUO2+ mono
(SO)2UO2CO3 2- bi
Hanford IDF sediment 10-3.5 model fit 15
SOHUO2OH+ mono (SO)2UO2CO3
2- bi (SO)2(UO2)3(OH)5 - bi
hydrous ferric oxide (HFO) / hematite
10-3.5 model fit 16
SOUO2OH mono SOUO2HCO3 mono
Hanford 300 Area (NPP/SPP)
10-3.5 model fit 17
(SO)2UO2(OH)n n bi HFO 0 EXAFS 18
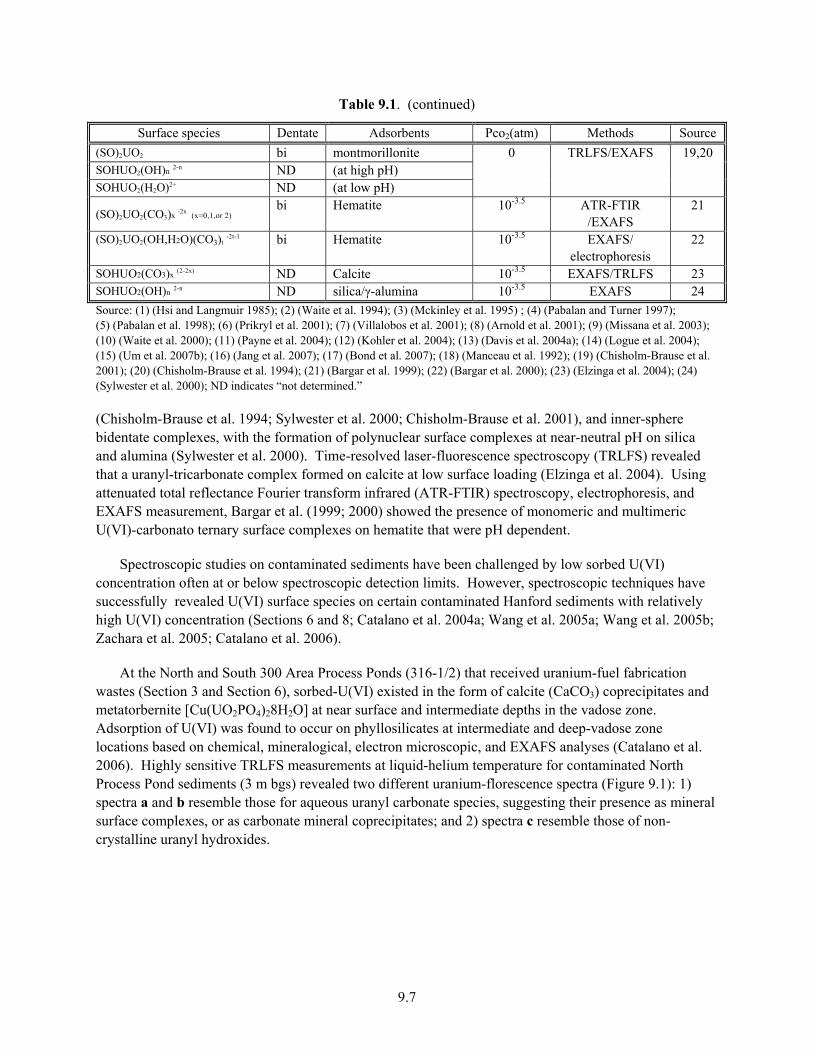
9.7
Table 9.1. (continued)
Surface species Dentate Adsorbents Pco2(atm) Methods Source (SO)2UO2 bi montmorillonite SOHUO2(OH)n 2-n ND (at high pH) SOHUO2(H2O)2+ ND (at low pH)
0 TRLFS/EXAFS 19,20
(SO)2UO2(CO3)x -2x (x=0,1,or 2) bi Hematite 10-3.5 ATR-FTIR /EXAFS
21
(SO)2UO2(OH,H2O)(CO3)t -2t-1
bi Hematite 10-3.5 EXAFS/
electrophoresis 22
SOHUO2(CO3)x (2-2x) ND Calcite 10-3.5 EXAFS/TRLFS 23 SOHUO2(OH)n 2-n ND silica/γ-alumina 10-3.5 EXAFS 24 Source: (1) (Hsi and Langmuir 1985); (2) (Waite et al. 1994); (3) (Mckinley et al. 1995) ; (4) (Pabalan and Turner 1997); (5) (Pabalan et al. 1998); (6) (Prikryl et al. 2001); (7) (Villalobos et al. 2001); (8) (Arnold et al. 2001); (9) (Missana et al. 2003); (10) (Waite et al. 2000); (11) (Payne et al. 2004); (12) (Kohler et al. 2004); (13) (Davis et al. 2004a); (14) (Logue et al. 2004); (15) (Um et al. 2007b); (16) (Jang et al. 2007); (17) (Bond et al. 2007); (18) (Manceau et al. 1992); (19) (Chisholm-Brause et al. 2001); (20) (Chisholm-Brause et al. 1994); (21) (Bargar et al. 1999); (22) (Bargar et al. 2000); (23) (Elzinga et al. 2004); (24) (Sylwester et al. 2000); ND indicates “not determined.”
(Chisholm-Brause et al. 1994; Sylwester et al. 2000; Chisholm-Brause et al. 2001), and inner-sphere bidentate complexes, with the formation of polynuclear surface complexes at near-neutral pH on silica and alumina (Sylwester et al. 2000). Time-resolved laser-fluorescence spectroscopy (TRLFS) revealed that a uranyl-tricarbonate complex formed on calcite at low surface loading (Elzinga et al. 2004). Using attenuated total reflectance Fourier transform infrared (ATR-FTIR) spectroscopy, electrophoresis, and EXAFS measurement, Bargar et al. (1999; 2000) showed the presence of monomeric and multimeric U(VI)-carbonato ternary surface complexes on hematite that were pH dependent.
Spectroscopic studies on contaminated sediments have been challenged by low sorbed U(VI) concentration often at or below spectroscopic detection limits. However, spectroscopic techniques have successfully revealed U(VI) surface species on certain contaminated Hanford sediments with relatively high U(VI) concentration (Sections 6 and 8; Catalano et al. 2004a; Wang et al. 2005a; Wang et al. 2005b; Zachara et al. 2005; Catalano et al. 2006).
At the North and South 300 Area Process Ponds (316-1/2) that received uranium-fuel fabrication wastes (Section 3 and Section 6), sorbed-U(VI) existed in the form of calcite (CaCO3) coprecipitates and metatorbernite [Cu(UO2PO4)28H2O] at near surface and intermediate depths in the vadose zone. Adsorption of U(VI) was found to occur on phyllosilicates at intermediate and deep-vadose zone locations based on chemical, mineralogical, electron microscopic, and EXAFS analyses (Catalano et al. 2006). Highly sensitive TRLFS measurements at liquid-helium temperature for contaminated North Process Pond sediments (3 m bgs) revealed two different uranium-florescence spectra (Figure 9.1): 1) spectra a and b resemble those for aqueous uranyl carbonate species, suggesting their presence as mineral surface complexes, or as carbonate mineral coprecipitates; and 2) spectra c resemble those of non-crystalline uranyl hydroxides.

9.8
Figure 9.1. Laser-Induced Florescence Spectroscopic Analyses of the Fine-Grained Samples from NPP 300 Area Sediment, Showing Two Distinct U(VI) Spectra Resembling Uranyl Carbonate Species (spectra a and b) and Uranyl Hydroxide (spectra c).
Sediments from the 200 Area that contained low levels of U(VI) contamination (<20 µg/g; TX-104-69A and TX-104-110A; Section 6 and 10) were analyzed by TRLFS to provide insights on adsorbed U(VI) speciation in the deep-vadose zone. The steady-state fluorescence spectra of the sediments (Figure 9.2) consisted of a set of four broad bands in the range of 492 nm to 560 nm. The spectral maxima for sediment 110A were slightly blue-shifted as compared to those of sediment 69A, indicating that uranyl-coordination environments in these two sediments were different. The spectra of sediment 69A were similar to that of uranyl incorporated in synthetic calcite (Reeder et al. 2000; Reeder et al. 2001), while the spectra of sediment 110A resembled that of uranyl adsorbed on calcite (Elzinga et al. 2004). However, the spectra of both TX-104 sediments were significantly different from those of uranyl silicates (e.g., boltwoodite), schoepite, and uranyl phosphate used as mineral standards in the TRLIF characterization, and as seen elsewhere in Hanford sediments (Section 8) (Figure 9.2, top). A small shoulder band was noticeable at 480 nm in both sediments. Time-resolved fluorescence spectra of sediment 110A (Figure 9.2, bottom) showed changes associated with delay time that indicated the presence of multiple uranyl species. Subtraction of the spectra at shorter delay times from those at longer delay times indicated the presence of a distinct spectral species with sharp spectral bands located at 481 nm, 503 nm, 526 nm and 551 nm, along with a broad, featureless spectral envelope in the region from 520 nm to 620 nm. These spectral characteristics were consistent with uranyl adsorbed to, or coprecipitated within calcite (Reeder et al. 2001; Elzinga et al. 2004; Wang et al. 2005a), despite a small calcite content (1.0% to 3.2%) in these sediments. Other uranyl phases that might be present based on the fluorescence spectra at 580 nm and 600 nm are uranyl-oxyhydroxide, but a precise identification cannot be made with the available data.
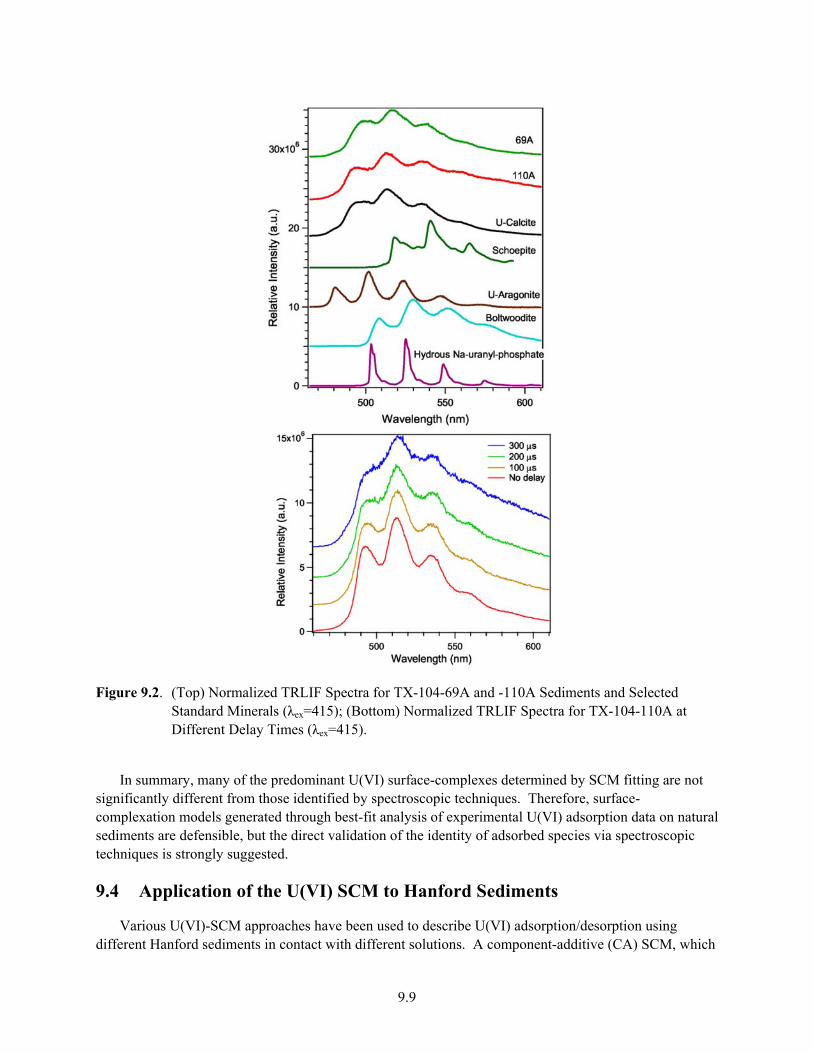
9.9
Figure 9.2. (Top) Normalized TRLIF Spectra for TX-104-69A and -110A Sediments and Selected
Standard Minerals (λex=415); (Bottom) Normalized TRLIF Spectra for TX-104-110A at Different Delay Times (λex=415).
In summary, many of the predominant U(VI) surface-complexes determined by SCM fitting are not significantly different from those identified by spectroscopic techniques. Therefore, surface-complexation models generated through best-fit analysis of experimental U(VI) adsorption data on natural sediments are defensible, but the direct validation of the identity of adsorbed species via spectroscopic techniques is strongly suggested.
9.4 Application of the U(VI) SCM to Hanford Sediments
Various U(VI)-SCM approaches have been used to describe U(VI) adsorption/desorption using different Hanford sediments in contact with different solutions. A component-additive (CA) SCM, which
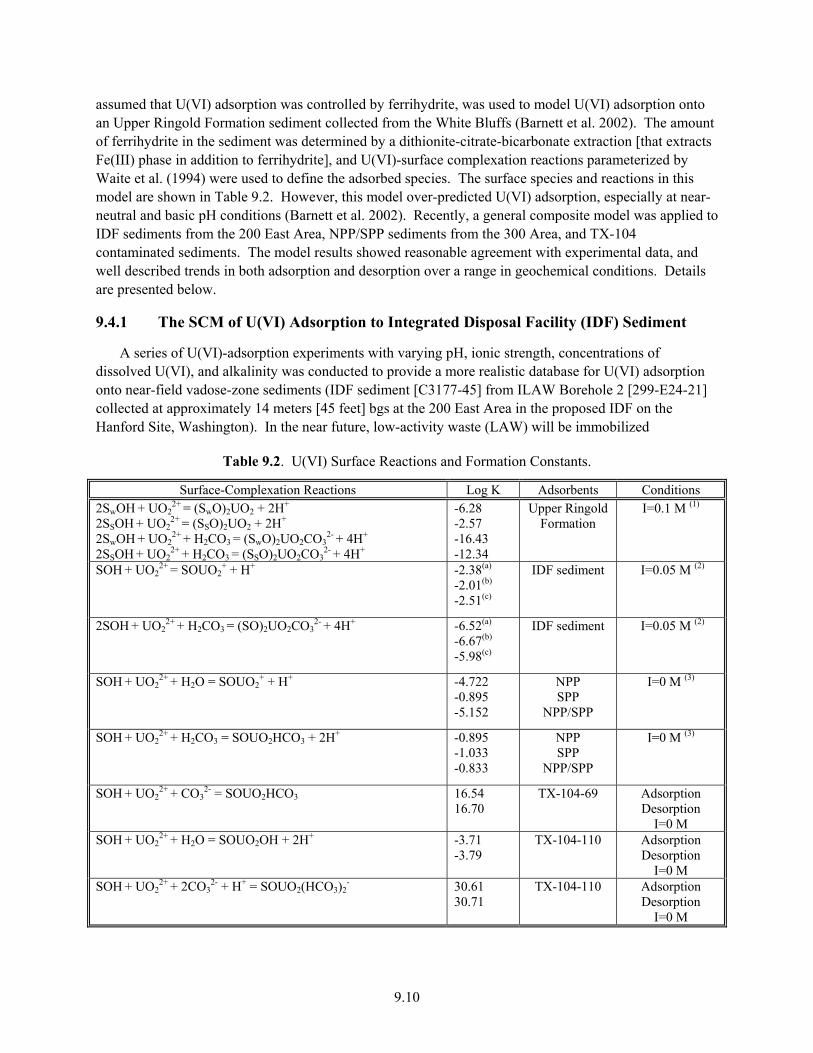
9.10
assumed that U(VI) adsorption was controlled by ferrihydrite, was used to model U(VI) adsorption onto an Upper Ringold Formation sediment collected from the White Bluffs (Barnett et al. 2002). The amount of ferrihydrite in the sediment was determined by a dithionite-citrate-bicarbonate extraction [that extracts Fe(III) phase in addition to ferrihydrite], and U(VI)-surface complexation reactions parameterized by Waite et al. (1994) were used to define the adsorbed species. The surface species and reactions in this model are shown in Table 9.2. However, this model over-predicted U(VI) adsorption, especially at near-neutral and basic pH conditions (Barnett et al. 2002). Recently, a general composite model was applied to IDF sediments from the 200 East Area, NPP/SPP sediments from the 300 Area, and TX-104 contaminated sediments. The model results showed reasonable agreement with experimental data, and well described trends in both adsorption and desorption over a range in geochemical conditions. Details are presented below.
9.4.1 The SCM of U(VI) Adsorption to Integrated Disposal Facility (IDF) Sediment
A series of U(VI)-adsorption experiments with varying pH, ionic strength, concentrations of dissolved U(VI), and alkalinity was conducted to provide a more realistic database for U(VI) adsorption onto near-field vadose-zone sediments (IDF sediment [C3177-45] from ILAW Borehole 2 [299-E24-21] collected at approximately 14 meters [45 feet] bgs at the 200 East Area in the proposed IDF on the Hanford Site, Washington). In the near future, low-activity waste (LAW) will be immobilized
Table 9.2. U(VI) Surface Reactions and Formation Constants.
Surface-Complexation Reactions Log K Adsorbents Conditions 2SwOH + UO2
2+ = (SwO)2UO2 + 2H+ 2SSOH + UO2
2+ = (SSO)2UO2 + 2H+ 2SwOH + UO2
2+ + H2CO3 = (SwO)2UO2CO32- + 4H+
2SSOH + UO22+ + H2CO3 = (SSO)2UO2CO3
2- + 4H+
-6.28 -2.57 -16.43 -12.34
Upper Ringold Formation
I=0.1 M (1)
SOH + UO22+ = SOUO2
+ + H+ -2.38(a) -2.01(b) -2.51(c)
IDF sediment I=0.05 M (2)
2SOH + UO22+ + H2CO3 = (SO)2UO2CO3
2- + 4H+ -6.52(a) -6.67(b) -5.98(c)
IDF sediment I=0.05 M (2)
SOH + UO22+ + H2O = SOUO2
+ + H+ -4.722 -0.895 -5.152
NPP SPP
NPP/SPP
I=0 M (3)
SOH + UO22+ + H2CO3 = SOUO2HCO3 + 2H+ -0.895
-1.033 -0.833
NPP SPP
NPP/SPP
I=0 M (3)
SOH + UO22+ + CO3
2- = SOUO2HCO3 16.54 16.70
TX-104-69 Adsorption Desorption
I=0 M SOH + UO2
2+ + H2O = SOUO2OH + 2H+ -3.71 -3.79
TX-104-110 Adsorption Desorption
I=0 M SOH + UO2
2+ + 2CO32- + H+ = SOUO2(HCO3)2
- 30.61 30.71
TX-104-110 Adsorption Desorption
I=0 M

9.11
(1)(Barnett et al. 2002); (2) (Um et al. 2007b); (3) (Bond et al. 2007); Sw and SS represent weak and strong surface sites, respectively; (a) is the SCM fit with varying U(VI) concentrations; (b) is the SCM fit with varying alkalinities; (c) is the SCM fit with both varying U(VI) and alkalinity conditions.
in vitrified-waste forms and disposed in the IDF. The composition of the pore fluid in the IDF sediments is expected to vary widely as the vitrified waste weathers and leachate solution mixes with pore waters and percolates to groundwater (Um et al. 2007b). The significant changes in pore-fluid chemistry below the IDF, as the glass leachate mixes with pore waters, will modify the extent of U(VI) adsorption as a function of distance and time.
A nonelectrostatic, general composite SCM was used to quantify U(VI) adsorption onto the IDF sediment to account for expected variable pore-fluid conditions. Thermodynamic constants for the U(VI)-aqueous species were obtained from the literature (Guillaumont and Mompean 2003, Grenthe et al. 1992, Silva et al. 1995). The synthetic-IDF pore water and simulated glass-leachate compositions are given in Table 9.3. The CaUO2(CO3)3
2- and Ca2UO2(CO3)30 aqueous complexes (Kalmykov and Choppin
2000; Bernhard et al. 2001) were included in the SCM database. The stoichiometry of surface complexation mass-action laws and SCM constants were obtained from the best fit to the experimental U(VI)-sorption data with the FITEQL 4.0
Table 9.3. Composition of Synthetic-IDF Pore Water and Glass Leachates.
IDF Pore Water Glass Leachate * Constituents Concentration (M) Constituents Concentration (M)
CaSO4 NaNO3 NaHCO3 NaCl MgSO4 MgCl2 KCl
1.2 x 10⁻² 3.4 x 10⁻³ 3.0 x 10⁻⁴ 2.1 x 10⁻³ 2.6 x 10⁻³ 2.4 x 10⁻³ 7.0 x 10⁻⁴
NaHCO3 Na2CO3 H3BO3 Na2SiO3•9H2O NaOH KOH
2.3 x 10⁻¹ 4.6 x 10⁻¹ 1.3 x 10⁻² 1.9 x 10⁻² 2.5 x 10⁻³ 5.2 x 10⁻⁴
pH : 7.2 (measured); 7.7 (calculated by MINEQL+); Alkalinity (mg/L as CaCO3) : 29 (measured); Ionic Strength : 0.05 M (calculated by MINEQL+)
pH : 9.7 (measured at 25oC); Alkalinity (mg/L as CaCO3) : 67000 (measured); Ionic Strength : 1.67 M (calculated without considering precipitates)
* Based on the STORM calculations of glass (LAW44) dissolution.
(Herberlin and Westall 1999). Two adsorption-site types, monodentate SOH and bidentate SOH2, were used in the mass-action laws because U(VI) can form edge-sharing bidentate complexes on Fe oxide surfaces (Waite et al. 1994; Bargar et al. 2000) and U(VI)-monodentate complexes on quartz and aluminosilicate minerals. As IDF sediment is a mixture of quartz sand and clays containing Fe-oxide coatings (Horton et al. 2003), both monodentate and bidentate U(VI)-binding sites were included in the GC SCM. The total site concentration of the IDF sediment was assumed to be 3.84 µmol/m2. The bidentate-site concentration for the Fe oxides and the monodentate site concentration for quartz and clays were estimated to be 3.6x10⁻⁹ mol/g and 8.67x10⁻⁶ mol/g, respectively, surface area measurements and wet-chemical extraction of Fe (III) oxides (Um et al. 2007b). The SCM-GC approach was initiated by fitting the experimental U(VI)-adsorption data with a single-complexation surface reaction for U(VI) (either monodentate or bidentate) with FITEQL. All reasonable surface-complexation reactives were considered based on the literature and combinations of each single reaction from monodentate or bidentate surface species were evaluated to determine the best-fit reaction set based on the goodness-of-fit parameter, WSOS/DF in FITEQL 4.0.
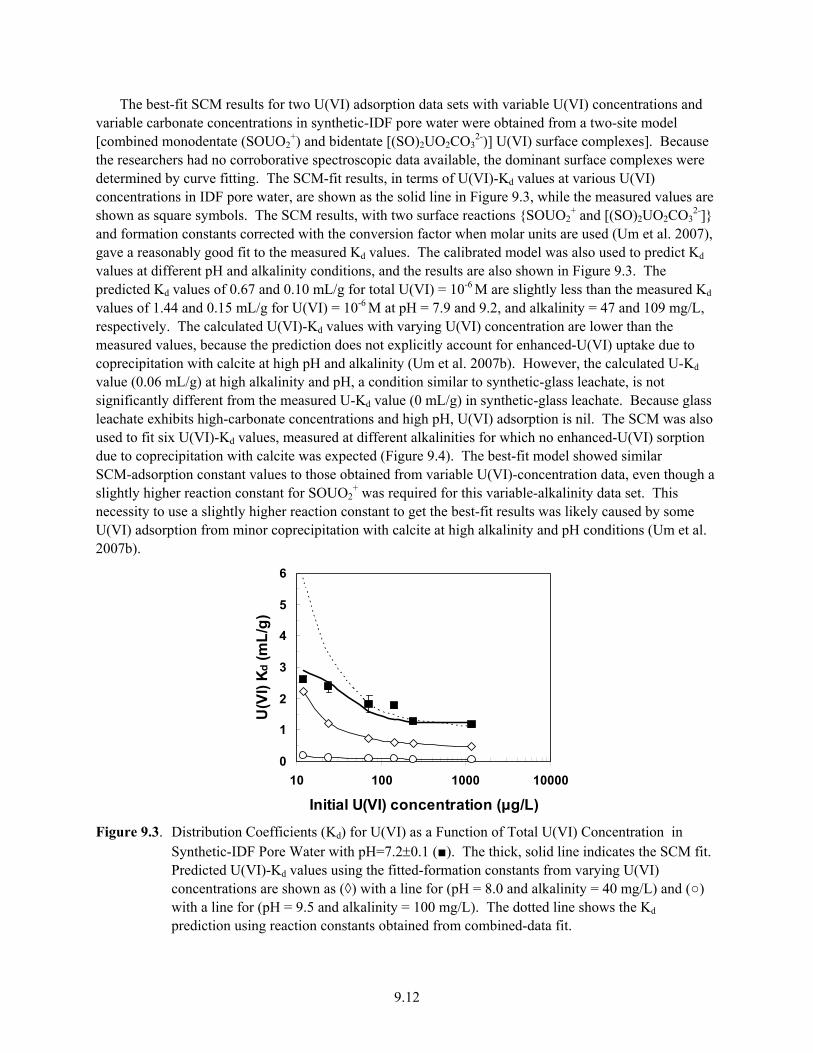
9.12
The best-fit SCM results for two U(VI) adsorption data sets with variable U(VI) concentrations and variable carbonate concentrations in synthetic-IDF pore water were obtained from a two-site model [combined monodentate (SOUO2
+) and bidentate [(SO)2UO2CO32-)] U(VI) surface complexes]. Because
the researchers had no corroborative spectroscopic data available, the dominant surface complexes were determined by curve fitting. The SCM-fit results, in terms of U(VI)-Kd values at various U(VI) concentrations in IDF pore water, are shown as the solid line in Figure 9.3, while the measured values are shown as square symbols. The SCM results, with two surface reactions {SOUO2
+ and [(SO)2UO2CO32-]}
and formation constants corrected with the conversion factor when molar units are used (Um et al. 2007), gave a reasonably good fit to the measured Kd values. The calibrated model was also used to predict Kd values at different pH and alkalinity conditions, and the results are also shown in Figure 9.3. The predicted Kd values of 0.67 and 0.10 mL/g for total U(VI) = 10-6 M are slightly less than the measured Kd values of 1.44 and 0.15 mL/g for U(VI) = 10-6 M at pH = 7.9 and 9.2, and alkalinity = 47 and 109 mg/L, respectively. The calculated U(VI)-Kd values with varying U(VI) concentration are lower than the measured values, because the prediction does not explicitly account for enhanced-U(VI) uptake due to coprecipitation with calcite at high pH and alkalinity (Um et al. 2007b). However, the calculated U-Kd value (0.06 mL/g) at high alkalinity and pH, a condition similar to synthetic-glass leachate, is not significantly different from the measured U-Kd value (0 mL/g) in synthetic-glass leachate. Because glass leachate exhibits high-carbonate concentrations and high pH, U(VI) adsorption is nil. The SCM was also used to fit six U(VI)-Kd values, measured at different alkalinities for which no enhanced-U(VI) sorption due to coprecipitation with calcite was expected (Figure 9.4). The best-fit model showed similar SCM-adsorption constant values to those obtained from variable U(VI)-concentration data, even though a slightly higher reaction constant for SOUO2
+ was required for this variable-alkalinity data set. This necessity to use a slightly higher reaction constant to get the best-fit results was likely caused by some U(VI) adsorption from minor coprecipitation with calcite at high alkalinity and pH conditions (Um et al. 2007b).
0
1
2
3
4
5
6
10 100 1000 10000
Initial U(VI) concentration (μg/L)
U(V
I) K d
(mL/
g)
Figure 9.3. Distribution Coefficients (Kd) for U(VI) as a Function of Total U(VI) Concentration in
Synthetic-IDF Pore Water with pH=7.2±0.1 (■). The thick, solid line indicates the SCM fit. Predicted U(VI)-Kd values using the fitted-formation constants from varying U(VI) concentrations are shown as (◊) with a line for (pH = 8.0 and alkalinity = 40 mg/L) and (○) with a line for (pH = 9.5 and alkalinity = 100 mg/L). The dotted line shows the Kd prediction using reaction constants obtained from combined-data fit.
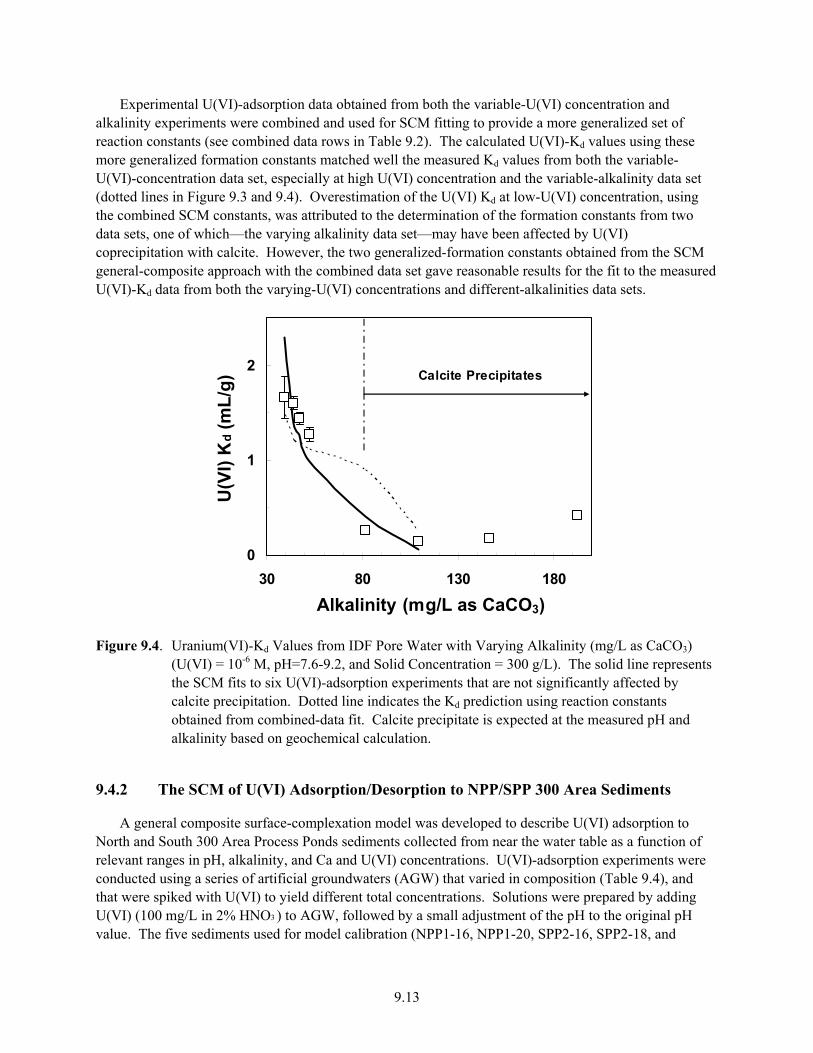
9.13
Experimental U(VI)-adsorption data obtained from both the variable-U(VI) concentration and alkalinity experiments were combined and used for SCM fitting to provide a more generalized set of reaction constants (see combined data rows in Table 9.2). The calculated U(VI)-Kd values using these more generalized formation constants matched well the measured Kd values from both the variable-U(VI)-concentration data set, especially at high U(VI) concentration and the variable-alkalinity data set (dotted lines in Figure 9.3 and 9.4). Overestimation of the U(VI) Kd at low-U(VI) concentration, using the combined SCM constants, was attributed to the determination of the formation constants from two data sets, one of which—the varying alkalinity data set—may have been affected by U(VI) coprecipitation with calcite. However, the two generalized-formation constants obtained from the SCM general-composite approach with the combined data set gave reasonable results for the fit to the measured U(VI)-Kd data from both the varying-U(VI) concentrations and different-alkalinities data sets.
0
1
2
30 80 130 180
Alkalinity (mg/L as CaCO3)
U(V
I) K
d (m
L/g) Calcite Precipitates
Figure 9.4. Uranium(VI)-Kd Values from IDF Pore Water with Varying Alkalinity (mg/L as CaCO3)
(U(VI) = 10-6 M, pH=7.6-9.2, and Solid Concentration = 300 g/L). The solid line represents the SCM fits to six U(VI)-adsorption experiments that are not significantly affected by calcite precipitation. Dotted line indicates the Kd prediction using reaction constants obtained from combined-data fit. Calcite precipitate is expected at the measured pH and alkalinity based on geochemical calculation.
9.4.2 The SCM of U(VI) Adsorption/Desorption to NPP/SPP 300 Area Sediments
A general composite surface-complexation model was developed to describe U(VI) adsorption to North and South 300 Area Process Ponds sediments collected from near the water table as a function of relevant ranges in pH, alkalinity, and Ca and U(VI) concentrations. U(VI)-adsorption experiments were conducted using a series of artificial groundwaters (AGW) that varied in composition (Table 9.4), and that were spiked with U(VI) to yield different total concentrations. Solutions were prepared by adding U(VI) (100 mg/L in 2% HNO3 ) to AGW, followed by a small adjustment of the pH to the original pH value. The five sediments used for model calibration (NPP1-16, NPP1-20, SPP2-16, SPP2-18, and
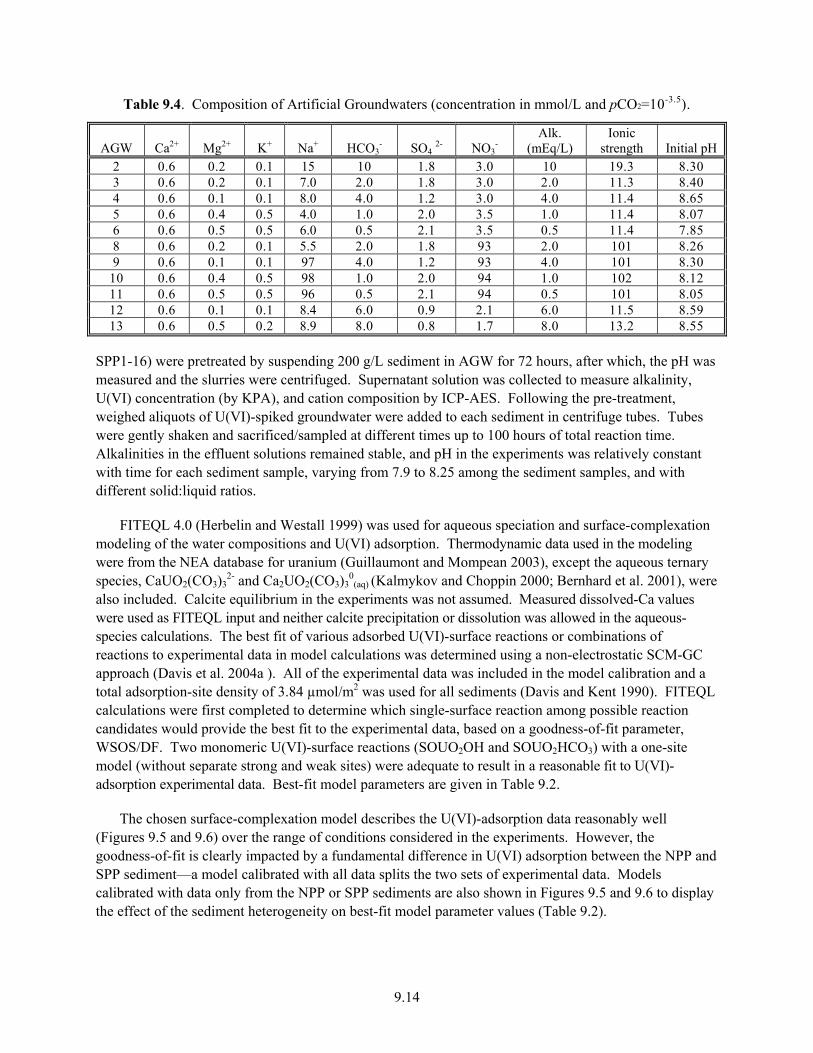
9.14
Table 9.4. Composition of Artificial Groundwaters (concentration in mmol/L and pCO2=10-3.5).
AGW Ca2+ Mg2+ K+ Na+ HCO3- SO4 2- NO3
- Alk.
(mEq/L) Ionic
strength Initial pH 2 0.6 0.2 0.1 15 10 1.8 3.0 10 19.3 8.30 3 0.6 0.2 0.1 7.0 2.0 1.8 3.0 2.0 11.3 8.40 4 0.6 0.1 0.1 8.0 4.0 1.2 3.0 4.0 11.4 8.65 5 0.6 0.4 0.5 4.0 1.0 2.0 3.5 1.0 11.4 8.07 6 0.6 0.5 0.5 6.0 0.5 2.1 3.5 0.5 11.4 7.85 8 0.6 0.2 0.1 5.5 2.0 1.8 93 2.0 101 8.26 9 0.6 0.1 0.1 97 4.0 1.2 93 4.0 101 8.30
10 0.6 0.4 0.5 98 1.0 2.0 94 1.0 102 8.12 11 0.6 0.5 0.5 96 0.5 2.1 94 0.5 101 8.05 12 0.6 0.1 0.1 8.4 6.0 0.9 2.1 6.0 11.5 8.59 13 0.6 0.5 0.2 8.9 8.0 0.8 1.7 8.0 13.2 8.55
SPP1-16) were pretreated by suspending 200 g/L sediment in AGW for 72 hours, after which, the pH was measured and the slurries were centrifuged. Supernatant solution was collected to measure alkalinity, U(VI) concentration (by KPA), and cation composition by ICP-AES. Following the pre-treatment, weighed aliquots of U(VI)-spiked groundwater were added to each sediment in centrifuge tubes. Tubes were gently shaken and sacrificed/sampled at different times up to 100 hours of total reaction time. Alkalinities in the effluent solutions remained stable, and pH in the experiments was relatively constant with time for each sediment sample, varying from 7.9 to 8.25 among the sediment samples, and with different solid:liquid ratios.
FITEQL 4.0 (Herbelin and Westall 1999) was used for aqueous speciation and surface-complexation modeling of the water compositions and U(VI) adsorption. Thermodynamic data used in the modeling were from the NEA database for uranium (Guillaumont and Mompean 2003), except the aqueous ternary species, CaUO2(CO3)3
2- and Ca2UO2(CO3)30
(aq) (Kalmykov and Choppin 2000; Bernhard et al. 2001), were also included. Calcite equilibrium in the experiments was not assumed. Measured dissolved-Ca values were used as FITEQL input and neither calcite precipitation or dissolution was allowed in the aqueous-species calculations. The best fit of various adsorbed U(VI)-surface reactions or combinations of reactions to experimental data in model calculations was determined using a non-electrostatic SCM-GC approach (Davis et al. 2004a ). All of the experimental data was included in the model calibration and a total adsorption-site density of 3.84 µmol/m2 was used for all sediments (Davis and Kent 1990). FITEQL calculations were first completed to determine which single-surface reaction among possible reaction candidates would provide the best fit to the experimental data, based on a goodness-of-fit parameter, WSOS/DF. Two monomeric U(VI)-surface reactions (SOUO2OH and SOUO2HCO3) with a one-site model (without separate strong and weak sites) were adequate to result in a reasonable fit to U(VI)-adsorption experimental data. Best-fit model parameters are given in Table 9.2.
The chosen surface-complexation model describes the U(VI)-adsorption data reasonably well (Figures 9.5 and 9.6) over the range of conditions considered in the experiments. However, the goodness-of-fit is clearly impacted by a fundamental difference in U(VI) adsorption between the NPP and SPP sediment—a model calibrated with all data splits the two sets of experimental data. Models calibrated with data only from the NPP or SPP sediments are also shown in Figures 9.5 and 9.6 to display the effect of the sediment heterogeneity on best-fit model parameter values (Table 9.2).
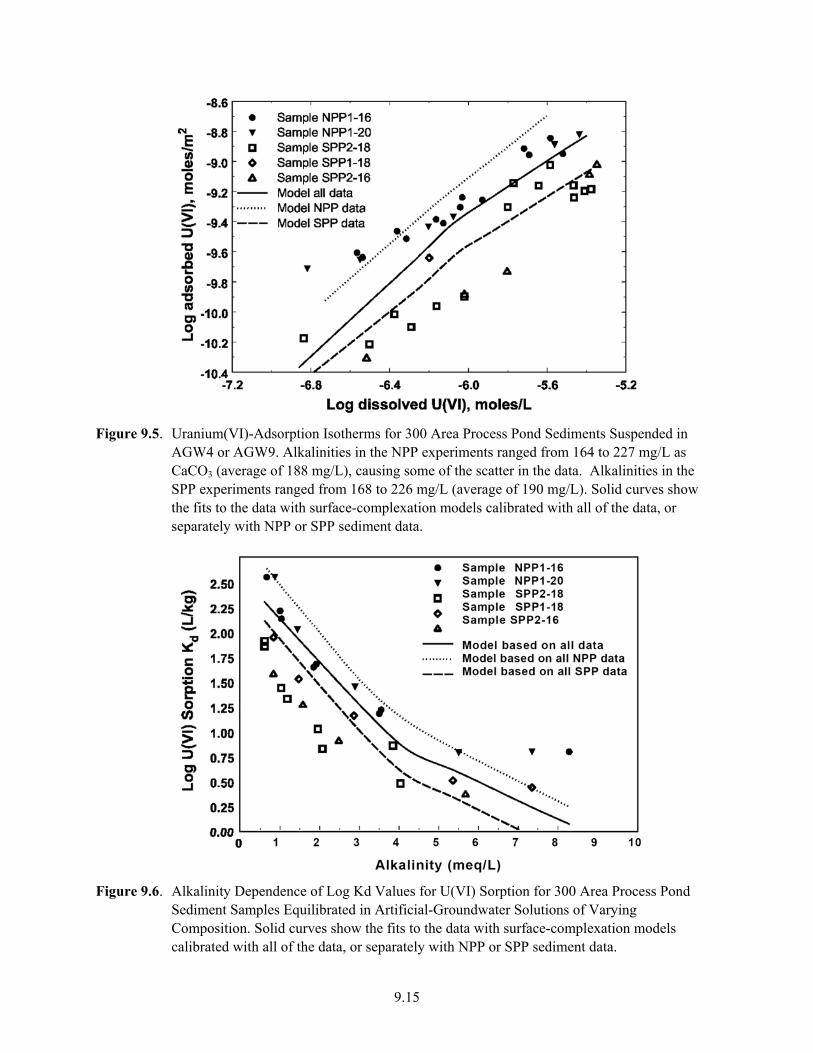
9.15
Figure 9.5. Uranium(VI)-Adsorption Isotherms for 300 Area Process Pond Sediments Suspended in
AGW4 or AGW9. Alkalinities in the NPP experiments ranged from 164 to 227 mg/L as CaCO3 (average of 188 mg/L), causing some of the scatter in the data. Alkalinities in the SPP experiments ranged from 168 to 226 mg/L (average of 190 mg/L). Solid curves show the fits to the data with surface-complexation models calibrated with all of the data, or separately with NPP or SPP sediment data.
Figure 9.6. Alkalinity Dependence of Log Kd Values for U(VI) Sorption for 300 Area Process Pond
Sediment Samples Equilibrated in Artificial-Groundwater Solutions of Varying Composition. Solid curves show the fits to the data with surface-complexation models calibrated with all of the data, or separately with NPP or SPP sediment data.
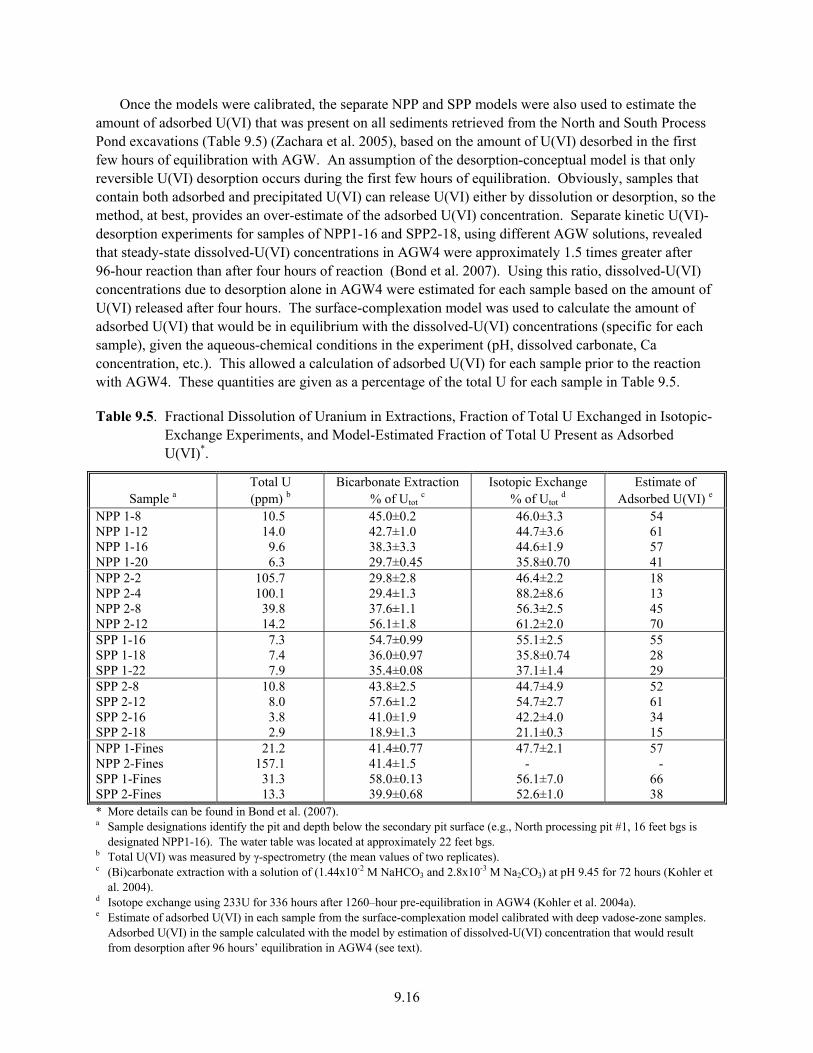
9.16
Once the models were calibrated, the separate NPP and SPP models were also used to estimate the amount of adsorbed U(VI) that was present on all sediments retrieved from the North and South Process Pond excavations (Table 9.5) (Zachara et al. 2005), based on the amount of U(VI) desorbed in the first few hours of equilibration with AGW. An assumption of the desorption-conceptual model is that only reversible U(VI) desorption occurs during the first few hours of equilibration. Obviously, samples that contain both adsorbed and precipitated U(VI) can release U(VI) either by dissolution or desorption, so the method, at best, provides an over-estimate of the adsorbed U(VI) concentration. Separate kinetic U(VI)-desorption experiments for samples of NPP1-16 and SPP2-18, using different AGW solutions, revealed that steady-state dissolved-U(VI) concentrations in AGW4 were approximately 1.5 times greater after 96-hour reaction than after four hours of reaction (Bond et al. 2007). Using this ratio, dissolved-U(VI) concentrations due to desorption alone in AGW4 were estimated for each sample based on the amount of U(VI) released after four hours. The surface-complexation model was used to calculate the amount of adsorbed U(VI) that would be in equilibrium with the dissolved-U(VI) concentrations (specific for each sample), given the aqueous-chemical conditions in the experiment (pH, dissolved carbonate, Ca concentration, etc.). This allowed a calculation of adsorbed U(VI) for each sample prior to the reaction with AGW4. These quantities are given as a percentage of the total U for each sample in Table 9.5.
Table 9.5. Fractional Dissolution of Uranium in Extractions, Fraction of Total U Exchanged in Isotopic-Exchange Experiments, and Model-Estimated Fraction of Total U Present as Adsorbed U(VI)*.
Sample a Total U (ppm) b
Bicarbonate Extraction % of Utot c
Isotopic Exchange % of Utot d
Estimate of Adsorbed U(VI) e
NPP 1-8 NPP 1-12 NPP 1-16 NPP 1-20
10.5 14.0 9.6 6.3
45.0±0.2 42.7±1.0 38.3±3.3 29.7±0.45
46.0±3.3 44.7±3.6 44.6±1.9 35.8±0.70
54 61 57 41
NPP 2-2 NPP 2-4 NPP 2-8 NPP 2-12
105.7 100.1
39.8 14.2
29.8±2.8 29.4±1.3 37.6±1.1 56.1±1.8
46.4±2.2 88.2±8.6 56.3±2.5 61.2±2.0
18 13 45 70
SPP 1-16 SPP 1-18 SPP 1-22
7.3 7.4 7.9
54.7±0.99 36.0±0.97 35.4±0.08
55.1±2.5 35.8±0.74 37.1±1.4
55 28 29
SPP 2-8 SPP 2-12 SPP 2-16 SPP 2-18
10.8 8.0 3.8 2.9
43.8±2.5 57.6±1.2 41.0±1.9 18.9±1.3
44.7±4.9 54.7±2.7 42.2±4.0 21.1±0.3
52 61 34 15
NPP 1-Fines NPP 2-Fines SPP 1-Fines SPP 2-Fines
21.2 157.1
31.3 13.3
41.4±0.77 41.4±1.5 58.0±0.13 39.9±0.68
47.7±2.1 -
56.1±7.0 52.6±1.0
57 -
66 38
* More details can be found in Bond et al. (2007). a Sample designations identify the pit and depth below the secondary pit surface (e.g., North processing pit #1, 16 feet bgs is
designated NPP1-16). The water table was located at approximately 22 feet bgs. b Total U(VI) was measured by γ-spectrometry (the mean values of two replicates). c (Bi)carbonate extraction with a solution of (1.44x10⁻² M NaHCO3 and 2.8x10⁻³ M Na2CO3) at pH 9.45 for 72 hours (Kohler et
al. 2004). d Isotope exchange using 233U for 336 hours after 1260–hour pre-equilibration in AGW4 (Kohler et al. 2004a). e Estimate of adsorbed U(VI) in each sample from the surface-complexation model calibrated with deep vadose-zone samples.
Adsorbed U(VI) in the sample calculated with the model by estimation of dissolved-U(VI) concentration that would result from desorption after 96 hours’ equilibration in AGW4 (see text).

9.17
The estimates of adsorbed U(VI) from the surface-complexation model are in qualitative agreement with the extraction and spectroscopic results (Bond et al. 2007). For those sediments where good agreement was observed between the fraction of total U extracted by (bi)carbonate solution and isotopic exchange, the estimates of adsorbed U(VI) by the surface-complexation model were close to the values determined by (bi)carbonate extraction or isotopic exchange (Table 9.5). Those samples that contain metatorbernite [Cu(UO2PO4)28H2O] and other U(VI) precipitates (i.e., NPP2-2 and NPP2-4) yielded estimates of adsorbed U(VI) from the surface-complexation model that were much lower than that measured in (bi)carbonate extractions and isotopic-exchange measurements. The surface-complexation model also makes estimating separate contributions to U(VI) release from dissolution and desorption from the more highly-contaminated sediments in the upper vadose zone of these 300 Area Process Pond sediments possible.
9.4.3 The U(VI) SCM Coupled with U(VI) Kinetic and Transport on TX-104 Sediments
Two deep-vadose-zone contaminated sediments (TX-104-69A and TX-104-110A) from Borehole C3832 (Section 6) were used for a series of batch-and-column experiments to develop a kinetic surface-complexation model that can be coupled with a transport. The sediments differed markedly in terms of lithology and depth of collection: 69A (Hanford Formation H2 subunit, 2.4% of calcite content, sand-textured, 0.063 μmol/g of total U(VI) content, and 48% of U(VI) labile fraction) and 110A (Cold Creek lower subunit, 32.8% of calcite content, silt-textured, 0.032 μmol g-1 of total U(VI), and 99% of U(VI) labile fraction).
Various leaching electrolytes with different carbonate concentrations were used for batch U(VI)-desorption experiments. These experiments revealed different U(VI)-desorption behavior in the two sediments (Figure 9.7 and 9.8). More detailed information for these electrolytes, and this comprehensive study generally, is given in Section 10 and in an upcoming publication. U(VI) release from sediment 69A
Time (hours)0 50 100 150 200 250 300
Dis
solv
ed U
(VI)
(um
ol/L
)
0
1
2
3
4
5
6 Data-SGW2Model-SGW2Data-electrolyte 5Model-electrolyte 5Data-electrolyte 4Model-electrolyte 4Data-electrolyte 3Model-electrolyte 3Data-electrolyte 2Model-electrolyte 2
Figure 9.7. U(VI) Desorption from Sediment TX104-69 in Five Electrolytes in Batch System. The
break at 55 hours was due to the replacement of fresh batch solutions. Solid/Solution ratio was 200 g/L.
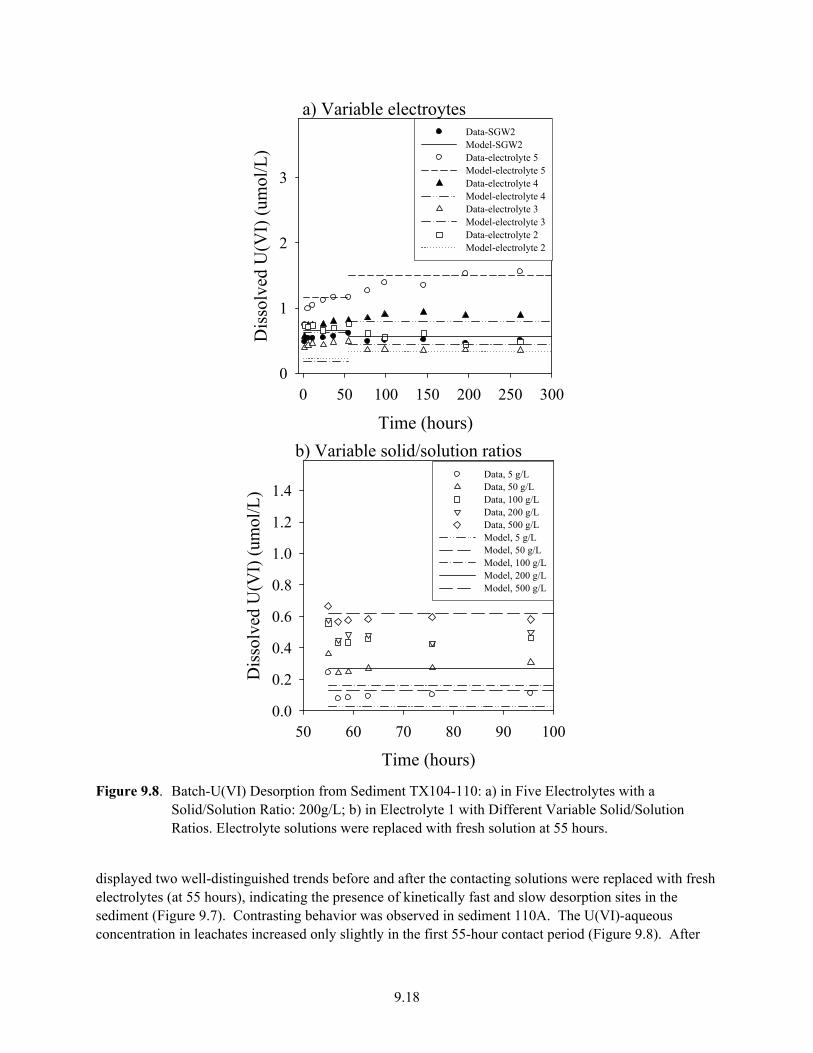
9.18
a) Variable electroytes
Time (hours)0 50 100 150 200 250 300
Dis
solv
ed U
(VI)
(um
ol/L
)
0
1
2
3
Data-SGW2Model-SGW2Data-electrolyte 5Model-electrolyte 5Data-electrolyte 4Model-electrolyte 4Data-electrolyte 3Model-electrolyte 3Data-electrolyte 2Model-electrolyte 2
b) Variable solid/solution ratios
Time (hours)50 60 70 80 90 100
Dis
solv
ed U
(VI)
(um
ol/L
)
0.0
0.2
0.4
0.6
0.8
1.0
1.2
1.4Data, 5 g/LData, 50 g/LData, 100 g/LData, 200 g/LData, 500 g/LModel, 5 g/LModel, 50 g/LModel, 100 g/LModel, 200 g/LModel, 500 g/L
Figure 9.8. Batch-U(VI) Desorption from Sediment TX104-110: a) in Five Electrolytes with a
Solid/Solution Ratio: 200g/L; b) in Electrolyte 1 with Different Variable Solid/Solution Ratios. Electrolyte solutions were replaced with fresh solution at 55 hours.
displayed two well-distinguished trends before and after the contacting solutions were replaced with fresh electrolytes (at 55 hours), indicating the presence of kinetically fast and slow desorption sites in the sediment (Figure 9.7). Contrasting behavior was observed in sediment 110A. The U(VI)-aqueous concentration in leachates increased only slightly in the first 55-hour contact period (Figure 9.8). After
9.19
the addition of the fresh electrolytes (at 55 hours), U(VI)-aqueous concentration exhibited a steady and slow increase, even in the high-carbonate concentration treatment, and remained virtually unchanged in the treatment after an initial small decrease (Figure 9.8). In addition, U(VI) desorption by batch extraction with the U(VI)-free electrolyte, after initially reacting the sediment with a sodium carbonate/bicarbonate-extracting solution (pH = 9.37, intended to extract labile, sorbed U(VI)) for 360 hours, showed low aqueous-U(VI) concentrations (0.021 and 0.020 µmol/L in sediment 69A and 110A, respectively) at the end of the 24-hour extraction period in the U(VI)-free electrolyte (data not shown). This result confirmed that almost all labile, sorbed U(VI) was removed from the sediments by sodium carbonate/bicarbonate extraction. Data from these experiments showed that U(VI) desorption was kinetically controlled in sediment 69A. In sediment 110A, however, U(VI) desorption was almost immediate, and the U(VI)-aqueous concentration reached a steady-state value within 24 hours of contact with synthetic porewater.
Different surface-complexation reactions were used to describe U(VI) adsorption to and desorption from the equilibrium and surface sites in these two sediments. Because the same surface-complexation reaction was assumed to describe U(VI)-adsorption/desorption reactions at both equilibrium and kinetic sites, three parameters, including the fraction (f) of equilibrium sites (and 1-f for kinetic sites) surface complexation reaction constants (log K), and kinetic site rate constant (α) were simultaneously fit to the batch-desorption data. The total adsorption-site concentration was calculated from an assumed site density of 3.84 µmol/m2, the measured sediment surface area, and solid/solution ratios. Eight chemical components were considered in the SCM, including UO2
2+, CO32-, Na+, Ca2+, Mg2+, NO3
-, H+, and SOH, yielding 43 related aqueous species whose complexation constants were taken from thermodynamic databases described in Section 4. Nitrate (NO3
-) was included for charge balance because it has little effect on U(VI) speciation and transport. Measured total aqueous concentrations of other cations, alkalinity, pH, and labile-U(VI) concentration in the sediment were also used to constrain the mass balance of these chemical components. Equilibrium and kinetic-adsorption sites were assumed to be at equilibrium at the start of the experiment.
Only one U(VI) surface-complexation reaction (SOUO2HCO3, Table 9.2) was needed for the SCM fit to the batch-desorption data from sediment 69. This finding was consistent with TRLFS analysis (Figure 9.2). The best-fit model parameters were: adsorption reaction constant (log K) of 16.70, equilibrium site fraction (f) of 0.6, and kinetic-rate constant (α) of 0.007 h-1. The model with these parameters described the batch-desorption data for sediment 69A in different electrolyte solutions (Figure 9.7) reasonably well. The mismatches between the calculated and measured aqueous U(VI) concentrations were caused by aqueous chemical composition changes as a function of time, which were not considered in the model, except for the chemical-composition changes resulting from the electrolyte replacement at 55 hours. After many trials of all potential surface-complex species and combinations as described in Bond et al. (2007), two surface complexation species [SOUO2OH and SOUO2(HCO3)2
-] were found to describe the batch-U(VI) desorption data for sediment 110A as a function of electrolyte and solid/solution ratio (Figure 9.8, Table 9.2). The model simulation for sediment 110 was an equilibrium one, and did not require inclusion of a kinetic site.
The surface-complexation model provided reasonable descriptions of the batch U(VI)-desorption results from TX-104-69A and -110A sediments under variable chemical and solid/water ratios with a minimal parameter set. This surface-complexation model, calibrated using batch results, was coupled with an advection/dispersion model that provided good predictions of U(VI) reactive transport in column experiments (Section 10).
9.20
9.5 Summary and Implications • Because U(VI) adsorption and desorption Kd are strongly influenced by solution composition (pH,
bicarbonate/carbonate, and Ca2+), a constant Kd model is not adequate to predict U(VI) mobility through Hanford subsurface zones where and when geochemical conditions vary. For these cases, surface-complexation models that account for Kd changes caused by pore-water composition and lithologic variations should be used to describe the effects of adsorption on U(VI)-reactive transport.
• A non-electrostatic SCM can successfully describe U(VI) adsorption and desorption on Hanford uncontaminated and contaminated sediments exposed to varying geochemical conditions. Model robustness is greatly enhanced when laboratory-adsorption measurements are combined with appropriate sediment characterizations, bulk-solution analyses to allow computation of aqueous speciation, and microscopic/spectroscopic studies of U(VI) mineral residence, solid-phase speciation, and surface complex speciation.
• An appropriately calibrated U(VI) SCM can be readily coupled with advection/dispersion-transport models to describe and predict U(VI) transport through Hanford sediments under varying, multi-component geochemical conditions (see Section 10). Quantitative models based on batch experiments with contaminated Hanford sediment should be validated with column experiments to ascertain whether mass transfer (Section 10) or other kinetic effects are important.
• Even though the non-electrostatic-SCM approach is simple and well describes U(VI) adsorption on mineralogically complex Hanford sediments, the development of a standard site-wide database to drive such modeling poses challenge, and requires a well-conceived approach to be successful. The difficulties in the SCM approach are associated with the estimation/measurement of 1) adsorption-site concentrations in the sediment, and 2) the magnitude of the associated surface-complexation constants with U(VI). Moreover, a consistent, statistically robust, and defensible parameter-estimation procedure needs to be applied to the entire data set. Experiments with integrated SCM modeling are needed on Hanford sediments of different lithologies that span the primary-controlling factors, such as texture/surface area and mineralogy/sorbent type to develop robust correlations between sediment properties and SCM parameters.
10.1
10.0 Kinetic and Mass Transfer Processes
Preceding report sections have discussed important reaction types that influence the solid-liquid distribution and migration velocity of U(VI) through Hanford sediments. These reaction types include aqueous complexation (Section 4), precipitation/dissolution (Section 8), and adsorption/desorption (Section 9). An important consideration regarding these reactions is the degree to which equilibrium states are or are not reached given advective flow rates. While equilibrium is most often reached for aqueous-complexation reactions, disequilibrium may occur for both precipitation/dissolution, and adsorption/desorption. Commonly applied reactive-transport models often assume local equilibrium (e.g., that solutes and solids reach the equilibrium state within some control volume) to simplify the reaction model and reduce the number of needed descriptive parameters (Steefel and Macquarrie 1996; Steefel and Van Cappellen 1998). Slow reactions may not achieve equilibrium during the timeframe of transport, and result in enhanced, but poorly predictable, U(VI) retardation and systems that are difficult to remediate (Haggerty and Gorelick 1995). Reactive-transport events involving slow reactions require more complex kinetic models (e.g., Salvage and Yeh 1998; Yeh et al. 2001; Steefel et al. 2005) to adequately describe the respective impacts on U(VI) migration.
Reaction slowness may be caused by the fundamental chemical kinetics of the involved molecular processes or by microscopic-transport processes that regulate the rate of material exchange between the mobile fluid and immobile solid phase (often termed mass transfer). A mass-transfer limited system is one in which the rates of contaminant exchange between the fluid and solid are sufficiently slow to prevent the attainment of local-chemical equilibrium (Haggerty et al. 2004). The Hanford subsurface system and the historical aspects of waste disposal have created physicochemical situations where mass-transfer limitations are important (see for example, Liu et al. 2004b; Qafoku et al. 2005). Long, in-ground residence times of contaminant U(VI) have allowed the progress of slow geochemical reactions, and the deep penetration of soluble U(VI) into relatively inaccessible grain and lithic-fragment pores and fractures by diffusion (McKinley et al. 2006). Waste-sediment reactions driven by waste solutions in marked disequilibrium with in-situ conditions (both on the acidic and basic side of ambient pH) have promoted a variety of dissolution/precipitation events that have changed the pore structure and reactivity of the subsurface sediments and partially sequestered soluble U(VI) into secondary mineral phases of poorly defined composition and structure (Wang et al. 2005; Arai et al. 2007). Both intra-grain penetration and secondary mineral sequestration may greatly slow the rates of contaminant U(VI) exchange with and release to the aqueous phase, creating a state of disequilibrium with controlling precipitation/dissolution or adsorption/desorption
A number of laboratory studies have been performed with U(VI)-contaminated Hanford sediments from the 200 Area Plateau and the Columbia River Corridor to ascertain whether current and future vadose-zone and aquifer-plume migration is likely to be equilibrium- or mass-transfer controlled. These studies have sought to 1) evaluate the relative rates of U(VI) adsorption-desorption and precipitation-dissolution reactions as influenced by contact or residence time and pore fluid composition, 2) identify the physicochemical causes of mass-transfer limitations, if observed, and 3) establish a generalized modeling strategy that integrates microscopic mass transfer and reaction-chemistry effects to describe U(VI) reactive-transport behavior in various Hanford-relevant subsurface scenarios. An important objective of these studies as a whole has been to determine if U(VI)-contaminated sediments of different lithologies and impacted by waste fluids of different sources exhibit common or dissimilar mass-transfer behavior
10.2
(e.g., U(VI) release kinetics), and whether a common model can be used to describe them. These investigations inform as to the type of geochemical modeling approach (e.g., Haggerty and Gorelick 1995; 1998) that may be required for accurate field-scale predictions of future U(VI)-plume migration.
Three case studies are described in the following subsections as examples of the approaches taken, the nature of the data collected, and the interpretational models applied. Two of the sites studied were high-inventory sites (241-BX-102; 316-1/2, Table 3.1), while the third (TX-104) was a smaller-inventory U(VI) vadose-zone plume in the TX Tank Farm. The compositions of wastes released to the two high-inventory sites were markedly different from one another. The rates and characteristics of U(VI) release from the sediments were distinctive in sediments from these three areas, and reflected the specific features of the original waste composition, and the current U(VI)-chemical speciation, physical location, and mineral association within the sediments. Different mathematical models were required to describe U(VI) release and uptake behavior by the contaminated sediments.
10.1 Influence of Diffusion and Dissolution Kinetics on U(VI) Release from 241-BX-102 Sediments
A previous batch study (Liu et al. 2004b) found that U release from E33-45 sediments (described in Sections 6 and 8) was kinetically controlled, and that time periods in excess of 225 days were required for vadose-zone pore-water simulants to reach a steady-state condition with sorbed U(VI). A coupled model of kinetic dissolution of Na-boltwoodite and uranyl diffusion within microfractures of the lithic fragments was required to describe the observed release of U to the aqueous phase. Column experiments were subsequently performed, and described here, to investigate the source-term behavior of these sediments if recharge waters were to migrate through the retarded, deep vadose-zone plume. The experiments were specifically designed to understand the coupling of diffusion and dissolution in controlling the mass transfer and kinetics of U(VI) release from the sediments under conditions of water advection.
Two sediments with different U(VI) concentrations were used in this study, which were collected at depths of approximately 36 and 40 meters below ground surface in Borehole E33-45 (53AB and 61AB). The sediments were leached with three different influent solutions in six column experiments. The influent solutions (Table 10.1) were prepared in equilibrium with calcite and atmospheric CO2 partial pressure. The first solution was made from DI-water (Ca-DI), the second was a Na-rich synthetic groundwater (SGW-Na), and the third was a Na+Si-rich SGW (SGW-Na+Si). The latter two solutions were targeted to suppress uranyl solubility, and thus, dissolution kinetics in the sediments. Solutions were injected from the column bottom in a dynamic mode of flow and stop-flow (SF). Effluent samples were collected frequently for U(VI) and pH analyses. Individual effluent samples were composited for the analyses of major solutes. Aqueous U(VI) was determined by a kinetic-phosphorescence analyzer (model KPA-11, Chemchek Instruments, Richland, WA). In composited samples, major solutes—Ca, K, Mg, Na and Si—were measured with an inductively coupled plasma optical emission spectrometer. Total dissolved inorganic carbon (DIC) was measured with a carbon analyzer. Anion fluoride, chloride, nitrite, nitrate, and phosphate were determined with ion chromatography (IC).
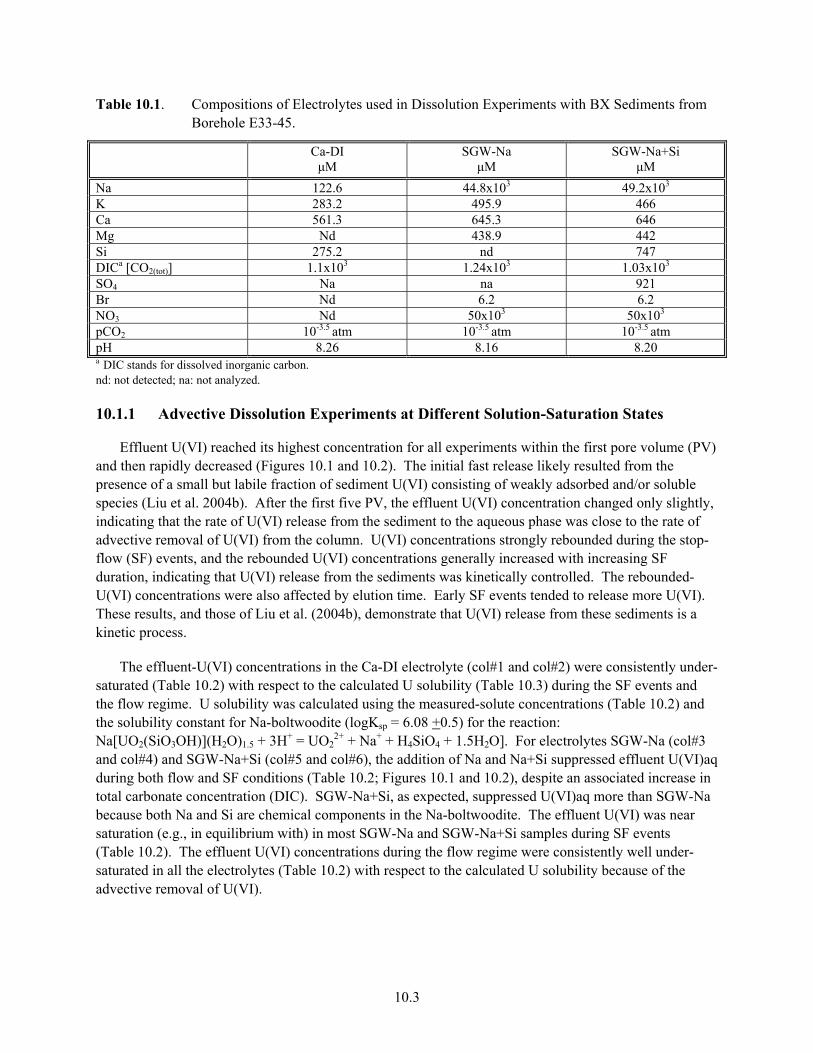
10.3
Table 10.1. Compositions of Electrolytes used in Dissolution Experiments with BX Sediments from Borehole E33-45.
Ca-DI μM
SGW-Na μM
SGW-Na+Si μM
Na 122.6 44.8x10³ 49.2x10³ K 283.2 495.9 466 Ca 561.3 645.3 646 Mg Nd 438.9 442 Si 275.2 nd 747 DICa [CO2(tot)] 1.1x10³ 1.24x10³ 1.03x10³ SO4 Na na 921 Br Nd 6.2 6.2 NO3 Nd 50x103 50x103 pCO2 10-3.5 atm 10-3.5 atm 10-3.5 atm pH 8.26 8.16 8.20 a DIC stands for dissolved inorganic carbon. nd: not detected; na: not analyzed.
10.1.1 Advective Dissolution Experiments at Different Solution-Saturation States
Effluent U(VI) reached its highest concentration for all experiments within the first pore volume (PV) and then rapidly decreased (Figures 10.1 and 10.2). The initial fast release likely resulted from the presence of a small but labile fraction of sediment U(VI) consisting of weakly adsorbed and/or soluble species (Liu et al. 2004b). After the first five PV, the effluent U(VI) concentration changed only slightly, indicating that the rate of U(VI) release from the sediment to the aqueous phase was close to the rate of advective removal of U(VI) from the column. U(VI) concentrations strongly rebounded during the stop-flow (SF) events, and the rebounded U(VI) concentrations generally increased with increasing SF duration, indicating that U(VI) release from the sediments was kinetically controlled. The rebounded-U(VI) concentrations were also affected by elution time. Early SF events tended to release more U(VI). These results, and those of Liu et al. (2004b), demonstrate that U(VI) release from these sediments is a kinetic process.
The effluent-U(VI) concentrations in the Ca-DI electrolyte (col#1 and col#2) were consistently under-saturated (Table 10.2) with respect to the calculated U solubility (Table 10.3) during the SF events and the flow regime. U solubility was calculated using the measured-solute concentrations (Table 10.2) and the solubility constant for Na-boltwoodite (logKsp = 6.08 +0.5) for the reaction: Na[UO2(SiO3OH)](H2O)1.5 + 3H+ = UO2
2+ + Na+ + H4SiO4 + 1.5H2O]. For electrolytes SGW-Na (col#3 and col#4) and SGW-Na+Si (col#5 and col#6), the addition of Na and Na+Si suppressed effluent U(VI)aq during both flow and SF conditions (Table 10.2; Figures 10.1 and 10.2), despite an associated increase in total carbonate concentration (DIC). SGW-Na+Si, as expected, suppressed U(VI)aq more than SGW-Na because both Na and Si are chemical components in the Na-boltwoodite. The effluent U(VI) was near saturation (e.g., in equilibrium with) in most SGW-Na and SGW-Na+Si samples during SF events (Table 10.2). The effluent U(VI) concentrations during the flow regime were consistently well under-saturated in all the electrolytes (Table 10.2) with respect to the calculated U solubility because of the advective removal of U(VI).
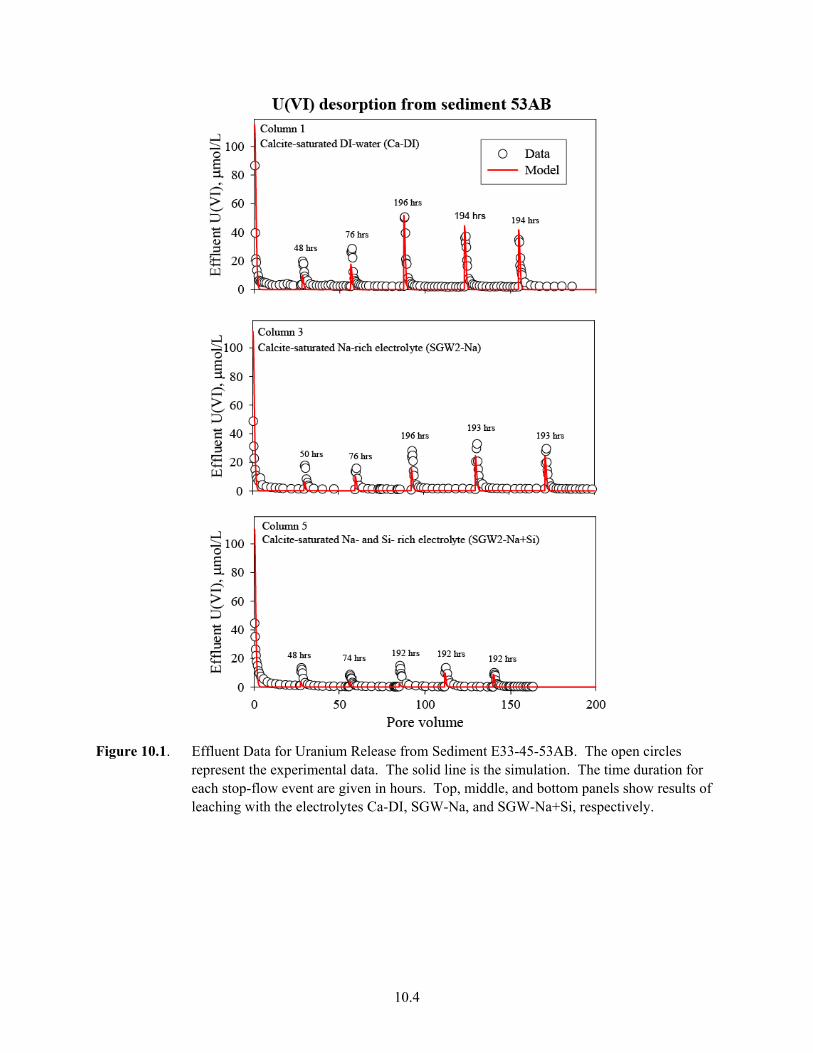
10.4
Figure 10.1. Effluent Data for Uranium Release from Sediment E33-45-53AB. The open circles
represent the experimental data. The solid line is the simulation. The time duration for each stop-flow event are given in hours. Top, middle, and bottom panels show results of leaching with the electrolytes Ca-DI, SGW-Na, and SGW-Na+Si, respectively.

10.5
Figure 10.2. Effluent Data for Uranium Release from Sediment E33-45-61AB. The open circles
represent the experimental data. The solid red line is the simulation. The time duration for each stop-flow event are given in hours. Top, middle, and bottom panels show results of leaching with the electrolytes Ca-DI, SGW-Na, and SGW-Na+Si, respectively.
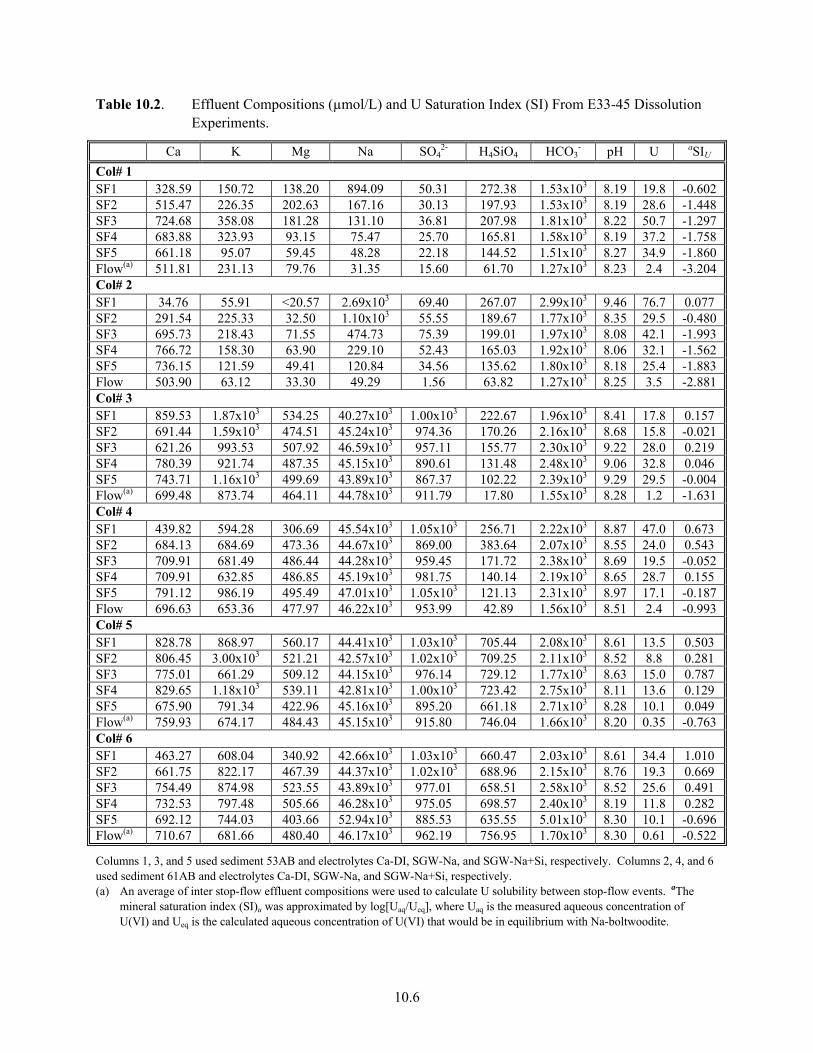
10.6
Table 10.2. Effluent Compositions (µmol/L) and U Saturation Index (SI) From E33-45 Dissolution Experiments.
Ca K Mg Na SO42- H4SiO4 HCO3
- pH U aSIU Col# 1 SF1 328.59 150.72 138.20 894.09 50.31 272.38 1.53x10³ 8.19 19.8 -0.602 SF2 515.47 226.35 202.63 167.16 30.13 197.93 1.53x10³ 8.19 28.6 -1.448 SF3 724.68 358.08 181.28 131.10 36.81 207.98 1.81x10³ 8.22 50.7 -1.297 SF4 683.88 323.93 93.15 75.47 25.70 165.81 1.58x10³ 8.19 37.2 -1.758 SF5 661.18 95.07 59.45 48.28 22.18 144.52 1.51x10³ 8.27 34.9 -1.860 Flow(a) 511.81 231.13 79.76 31.35 15.60 61.70 1.27x10³ 8.23 2.4 -3.204 Col# 2 SF1 34.76 55.91 <20.57 2.69x10³ 69.40 267.07 2.99x10³ 9.46 76.7 0.077 SF2 291.54 225.33 32.50 1.10x10³ 55.55 189.67 1.77x10³ 8.35 29.5 -0.480 SF3 695.73 218.43 71.55 474.73 75.39 199.01 1.97x10³ 8.08 42.1 -1.993 SF4 766.72 158.30 63.90 229.10 52.43 165.03 1.92x10³ 8.06 32.1 -1.562 SF5 736.15 121.59 49.41 120.84 34.56 135.62 1.80x10³ 8.18 25.4 -1.883 Flow 503.90 63.12 33.30 49.29 1.56 63.82 1.27x10³ 8.25 3.5 -2.881 Col# 3 SF1 859.53 1.87x10³ 534.25 40.27x10³ 1.00x10³ 222.67 1.96x10³ 8.41 17.8 0.157 SF2 691.44 1.59x10³ 474.51 45.24x10³ 974.36 170.26 2.16x10³ 8.68 15.8 -0.021 SF3 621.26 993.53 507.92 46.59x10³ 957.11 155.77 2.30x10³ 9.22 28.0 0.219 SF4 780.39 921.74 487.35 45.15x10³ 890.61 131.48 2.48x10³ 9.06 32.8 0.046 SF5 743.71 1.16x10³ 499.69 43.89x10³ 867.37 102.22 2.39x10³ 9.29 29.5 -0.004 Flow(a) 699.48 873.74 464.11 44.78x10³ 911.79 17.80 1.55x10³ 8.28 1.2 -1.631 Col# 4 SF1 439.82 594.28 306.69 45.54x10³ 1.05x10³ 256.71 2.22x10³ 8.87 47.0 0.673 SF2 684.13 684.69 473.36 44.67x10³ 869.00 383.64 2.07x10³ 8.55 24.0 0.543 SF3 709.91 681.49 486.44 44.28x10³ 959.45 171.72 2.38x10³ 8.69 19.5 -0.052 SF4 709.91 632.85 486.85 45.19x10³ 981.75 140.14 2.19x10³ 8.65 28.7 0.155 SF5 791.12 986.19 495.49 47.01x10³ 1.05x10³ 121.13 2.31x10³ 8.97 17.1 -0.187 Flow 696.63 653.36 477.97 46.22x10³ 953.99 42.89 1.56x10³ 8.51 2.4 -0.993 Col# 5 SF1 828.78 868.97 560.17 44.41x10³ 1.03x10³ 705.44 2.08x10³ 8.61 13.5 0.503 SF2 806.45 3.00x10³ 521.21 42.57x10³ 1.02x10³ 709.25 2.11x10³ 8.52 8.8 0.281 SF3 775.01 661.29 509.12 44.15x10³ 976.14 729.12 1.77x10³ 8.63 15.0 0.787 SF4 829.65 1.18x10³ 539.11 42.81x10³ 1.00x10³ 723.42 2.75x10³ 8.11 13.6 0.129 SF5 675.90 791.34 422.96 45.16x10³ 895.20 661.18 2.71x10³ 8.28 10.1 0.049 Flow(a) 759.93 674.17 484.43 45.15x10³ 915.80 746.04 1.66x10³ 8.20 0.35 -0.763 Col# 6 SF1 463.27 608.04 340.92 42.66x10³ 1.03x10³ 660.47 2.03x10³ 8.61 34.4 1.010 SF2 661.75 822.17 467.39 44.37x10³ 1.02x10³ 688.96 2.15x10³ 8.76 19.3 0.669 SF3 754.49 874.98 523.55 43.89x10³ 977.01 658.51 2.58x10³ 8.52 25.6 0.491 SF4 732.53 797.48 505.66 46.28x10³ 975.05 698.57 2.40x10³ 8.19 11.8 0.282 SF5 692.12 744.03 403.66 52.94x10³ 885.53 635.55 5.01x10³ 8.30 10.1 -0.696 Flow(a) 710.67 681.66 480.40 46.17x10³ 962.19 756.95 1.70x10³ 8.30 0.61 -0.522
Columns 1, 3, and 5 used sediment 53AB and electrolytes Ca-DI, SGW-Na, and SGW-Na+Si, respectively. Columns 2, 4, and 6 used sediment 61AB and electrolytes Ca-DI, SGW-Na, and SGW-Na+Si, respectively. (a) An average of inter stop-flow effluent compositions were used to calculate U solubility between stop-flow events. aThe
mineral saturation index (SI)u was approximated by log[Uaq/Ueq], where Uaq is the measured aqueous concentration of U(VI) and Ueq is the calculated aqueous concentration of U(VI) that would be in equilibrium with Na-boltwoodite.
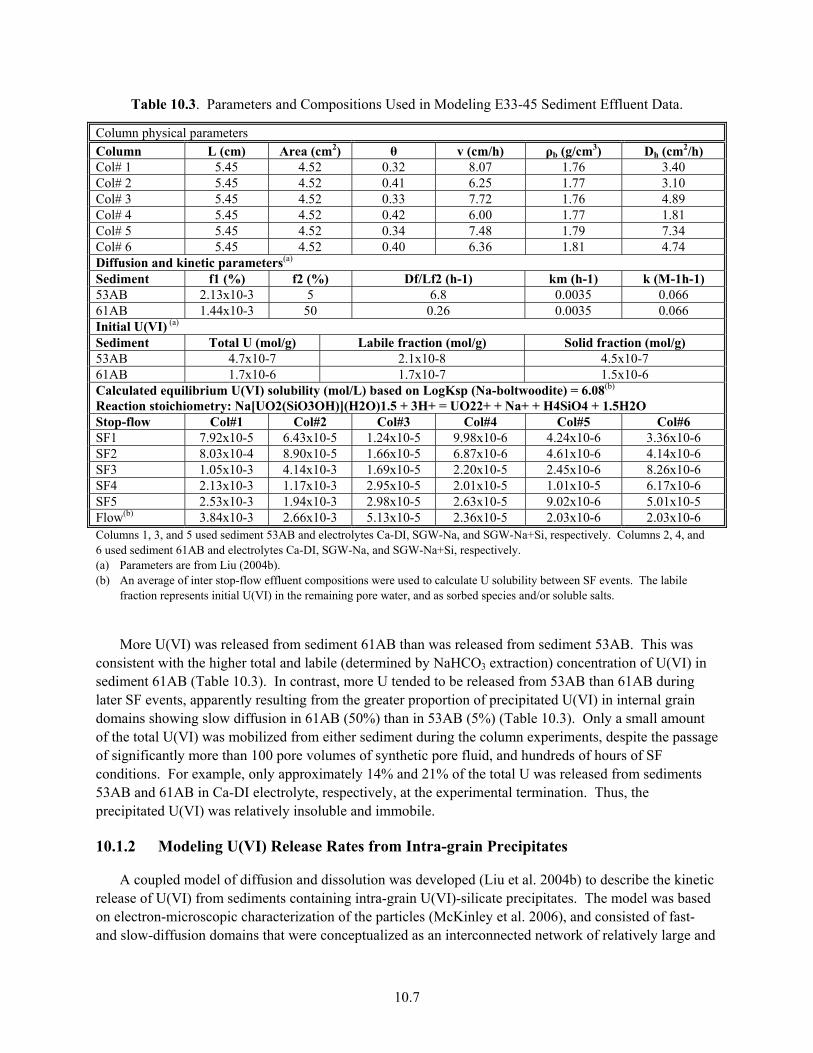
10.7
Table 10.3. Parameters and Compositions Used in Modeling E33-45 Sediment Effluent Data.
Column physical parameters Column L (cm) Area (cm2) θ v (cm/h) ρb (g/cm3) Dh (cm2/h) Col# 1 5.45 4.52 0.32 8.07 1.76 3.40 Col# 2 5.45 4.52 0.41 6.25 1.77 3.10 Col# 3 5.45 4.52 0.33 7.72 1.76 4.89 Col# 4 5.45 4.52 0.42 6.00 1.77 1.81 Col# 5 5.45 4.52 0.34 7.48 1.79 7.34 Col# 6 5.45 4.52 0.40 6.36 1.81 4.74 Diffusion and kinetic parameters(a) Sediment f1 (%) f2 (%) Df/Lf2 (h-1) km (h-1) k (M-1h-1) 53AB 2.13x10⁻³ 5 6.8 0.0035 0.066 61AB 1.44x10⁻³ 50 0.26 0.0035 0.066 Initial U(VI) (a) Sediment Total U (mol/g) Labile fraction (mol/g) Solid fraction (mol/g) 53AB 4.7x10⁻⁷ 2.1x10⁻⁸ 4.5x10⁻⁷ 61AB 1.7x10⁻⁶ 1.7x10⁻⁷ 1.5x10⁻⁶ Calculated equilibrium U(VI) solubility (mol/L) based on LogKsp (Na-boltwoodite) = 6.08(b) Reaction stoichiometry: Na[UO2(SiO3OH)](H2O)1.5 + 3H+ = UO22+ + Na+ + H4SiO4 + 1.5H2O Stop-flow Col#1 Col#2 Col#3 Col#4 Col#5 Col#6 SF1 7.92x10⁻⁵ 6.43x10⁻⁵ 1.24x10⁻⁵ 9.98x10⁻⁶ 4.24x10⁻⁶ 3.36x10⁻⁶ SF2 8.03x10⁻⁴ 8.90x10⁻⁵ 1.66x10⁻⁵ 6.87x10⁻⁶ 4.61x10⁻⁶ 4.14x10⁻⁶ SF3 1.05x10⁻³ 4.14x10⁻³ 1.69x10⁻⁵ 2.20x10⁻⁵ 2.45x10⁻⁶ 8.26x10⁻⁶ SF4 2.13x10⁻³ 1.17x10⁻³ 2.95x10⁻⁵ 2.01x10⁻⁵ 1.01x10⁻⁵ 6.17x10⁻⁶ SF5 2.53x10⁻³ 1.94x10⁻³ 2.98x10⁻⁵ 2.63x10⁻⁵ 9.02x10⁻⁶ 5.01x10⁻⁵ Flow(b) 3.84x10⁻³ 2.66x10⁻³ 5.13x10⁻⁵ 2.36x10⁻⁵ 2.03x10⁻⁶ 2.03x10⁻⁶ Columns 1, 3, and 5 used sediment 53AB and electrolytes Ca-DI, SGW-Na, and SGW-Na+Si, respectively. Columns 2, 4, and 6 used sediment 61AB and electrolytes Ca-DI, SGW-Na, and SGW-Na+Si, respectively. (a) Parameters are from Liu (2004b). (b) An average of inter stop-flow effluent compositions were used to calculate U solubility between SF events. The labile
fraction represents initial U(VI) in the remaining pore water, and as sorbed species and/or soluble salts.
More U(VI) was released from sediment 61AB than was released from sediment 53AB. This was consistent with the higher total and labile (determined by NaHCO3 extraction) concentration of U(VI) in sediment 61AB (Table 10.3). In contrast, more U tended to be released from 53AB than 61AB during later SF events, apparently resulting from the greater proportion of precipitated U(VI) in internal grain domains showing slow diffusion in 61AB (50%) than in 53AB (5%) (Table 10.3). Only a small amount of the total U(VI) was mobilized from either sediment during the column experiments, despite the passage of significantly more than 100 pore volumes of synthetic pore fluid, and hundreds of hours of SF conditions. For example, only approximately 14% and 21% of the total U was released from sediments 53AB and 61AB in Ca-DI electrolyte, respectively, at the experimental termination. Thus, the precipitated U(VI) was relatively insoluble and immobile.
10.1.2 Modeling U(VI) Release Rates from Intra-grain Precipitates
A coupled model of diffusion and dissolution was developed (Liu et al. 2004b) to describe the kinetic release of U(VI) from sediments containing intra-grain U(VI)-silicate precipitates. The model was based on electron-microscopic characterization of the particles (McKinley et al. 2006), and consisted of fast- and slow-diffusion domains that were conceptualized as an interconnected network of relatively large and
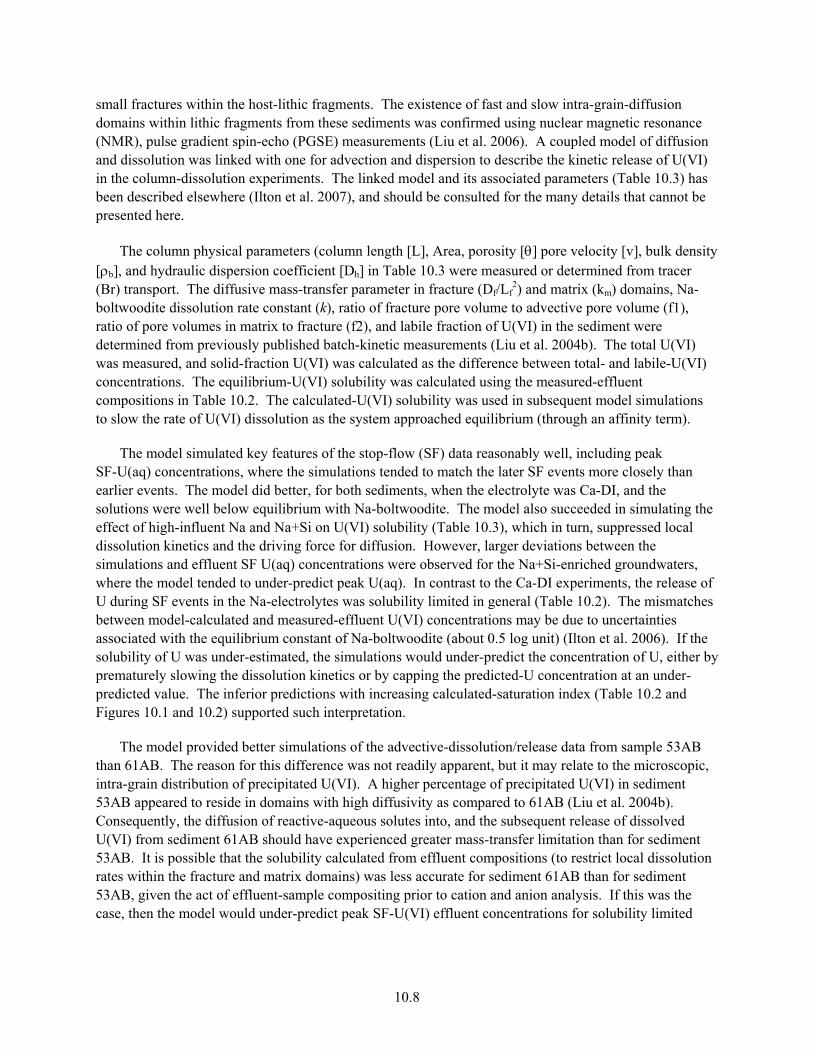
10.8
small fractures within the host-lithic fragments. The existence of fast and slow intra-grain-diffusion domains within lithic fragments from these sediments was confirmed using nuclear magnetic resonance (NMR), pulse gradient spin-echo (PGSE) measurements (Liu et al. 2006). A coupled model of diffusion and dissolution was linked with one for advection and dispersion to describe the kinetic release of U(VI) in the column-dissolution experiments. The linked model and its associated parameters (Table 10.3) has been described elsewhere (Ilton et al. 2007), and should be consulted for the many details that cannot be presented here.
The column physical parameters (column length [L], Area, porosity [θ] pore velocity [v], bulk density [ρb], and hydraulic dispersion coefficient [Dh] in Table 10.3 were measured or determined from tracer (Br) transport. The diffusive mass-transfer parameter in fracture (Df/Lf
2) and matrix (km) domains, Na-boltwoodite dissolution rate constant (k), ratio of fracture pore volume to advective pore volume (f1), ratio of pore volumes in matrix to fracture (f2), and labile fraction of U(VI) in the sediment were determined from previously published batch-kinetic measurements (Liu et al. 2004b). The total U(VI) was measured, and solid-fraction U(VI) was calculated as the difference between total- and labile-U(VI) concentrations. The equilibrium-U(VI) solubility was calculated using the measured-effluent compositions in Table 10.2. The calculated-U(VI) solubility was used in subsequent model simulations to slow the rate of U(VI) dissolution as the system approached equilibrium (through an affinity term).
The model simulated key features of the stop-flow (SF) data reasonably well, including peak SF-U(aq) concentrations, where the simulations tended to match the later SF events more closely than earlier events. The model did better, for both sediments, when the electrolyte was Ca-DI, and the solutions were well below equilibrium with Na-boltwoodite. The model also succeeded in simulating the effect of high-influent Na and Na+Si on U(VI) solubility (Table 10.3), which in turn, suppressed local dissolution kinetics and the driving force for diffusion. However, larger deviations between the simulations and effluent SF U(aq) concentrations were observed for the Na+Si-enriched groundwaters, where the model tended to under-predict peak U(aq). In contrast to the Ca-DI experiments, the release of U during SF events in the Na-electrolytes was solubility limited in general (Table 10.2). The mismatches between model-calculated and measured-effluent U(VI) concentrations may be due to uncertainties associated with the equilibrium constant of Na-boltwoodite (about 0.5 log unit) (Ilton et al. 2006). If the solubility of U was under-estimated, the simulations would under-predict the concentration of U, either by prematurely slowing the dissolution kinetics or by capping the predicted-U concentration at an under-predicted value. The inferior predictions with increasing calculated-saturation index (Table 10.2 and Figures 10.1 and 10.2) supported such interpretation.
The model provided better simulations of the advective-dissolution/release data from sample 53AB than 61AB. The reason for this difference was not readily apparent, but it may relate to the microscopic, intra-grain distribution of precipitated U(VI). A higher percentage of precipitated U(VI) in sediment 53AB appeared to reside in domains with high diffusivity as compared to 61AB (Liu et al. 2004b). Consequently, the diffusion of reactive-aqueous solutes into, and the subsequent release of dissolved U(VI) from sediment 61AB should have experienced greater mass-transfer limitation than for sediment 53AB. It is possible that the solubility calculated from effluent compositions (to restrict local dissolution rates within the fracture and matrix domains) was less accurate for sediment 61AB than for sediment 53AB, given the act of effluent-sample compositing prior to cation and anion analysis. If this was the case, then the model would under-predict peak SF-U(VI) effluent concentrations for solubility limited

10.9
conditions, and over-predict U(VI) concentrations for under-saturated conditions. This trend was observed for the last three, and longest duration SF events, for sediment 61AB.
The simulations also consistently under-predicted U(VI) concentrations between the SF events, regardless of the sediment and electrolyte, suggesting that either the diffusivities or the dissolution-rate constants, or both, were under-estimated in the model. A recent independent study of Na-boltwoodite dissolution derived a slightly different dissolution model and higher rate constant (Liu et al. 2006). The incorporation of this new information into the coupled diffusion-dissolution-advection model is currently underway to yield improved descriptions of the advective removal of U(VI) from 241-BX-102 sediments.
10.1.3 Findings Regarding Intra-grain, Metal-Waste Precipitates • Metal wastes from the BX-102 overfill event have moved deeply into vadose-zone sediments beneath
the site. Over the 50+ years of contact time, U(VI) has migrated within relatively inaccessible fractures and interconnected pores of 1-mm-sized, granitic-lithic fragments in the sediments and precipitated as sodium boltwoodite.
• The presence of contaminant U(VI) as an intra-grain precipitate causes its release to recharge waters to be kinetically controlled, and to be significantly delayed and slowed by diffusion processes (mass transfer).
• The rates of U(VI) release from the contaminated sediments were slow, and 100 pore volumes of leaching only removed a small percentage (<20%) of U(VI) from the sediments. Such large leaching volumes are not expected for the 200 Area vadose zone. Precipitated U(VI) in the sediments will remain as a long-term source to the groundwater at the site unless recharge is eliminated.
• The rate of U(VI) release from the sediment was dependent on the simulated pore-water compositions. Faster release rates were observed in solutions with low Na and Si concentrations. These had a lower saturation index with respect to the uranyl precipitates that enhanced the overall dissolution rate.
• The kinetics of uranyl release and the resulting evolved-U(VI) concentration in column effluents could only be described by a relatively complex model that coupled diffusion and mineral dissolution with advection. A Kd-based model could not describe the temporal character of effluent-U(VI) concentration. The reasonable success of the model in describing the experimental results with a minimum of parameter fitting indicated that it captured key aspects of the physics and geochemistry controlling the dissolution rate of the intra-grain precipitate, and U(VI) release rate from the host-lithic fragments.
• Divergences between the simulations and column experiments indicate the need for further model parameterization using independent measurements of dissolution and diffusion of key system components.
10.2 U(VI) Desorption and Adsorption in a Deep Vadose-Zone Plume Displaying Marked Lithologic Variations.
The preceding section demonstrated that the release rates of contaminant U(VI) from sediments containing relatively large concentrations (e.g., >500 µg/g) of precipitated U(VI) (as uranyl-silicate) were kinetically controlled by mass transfer from intra-grain fractures. Here, the researchers move to another,
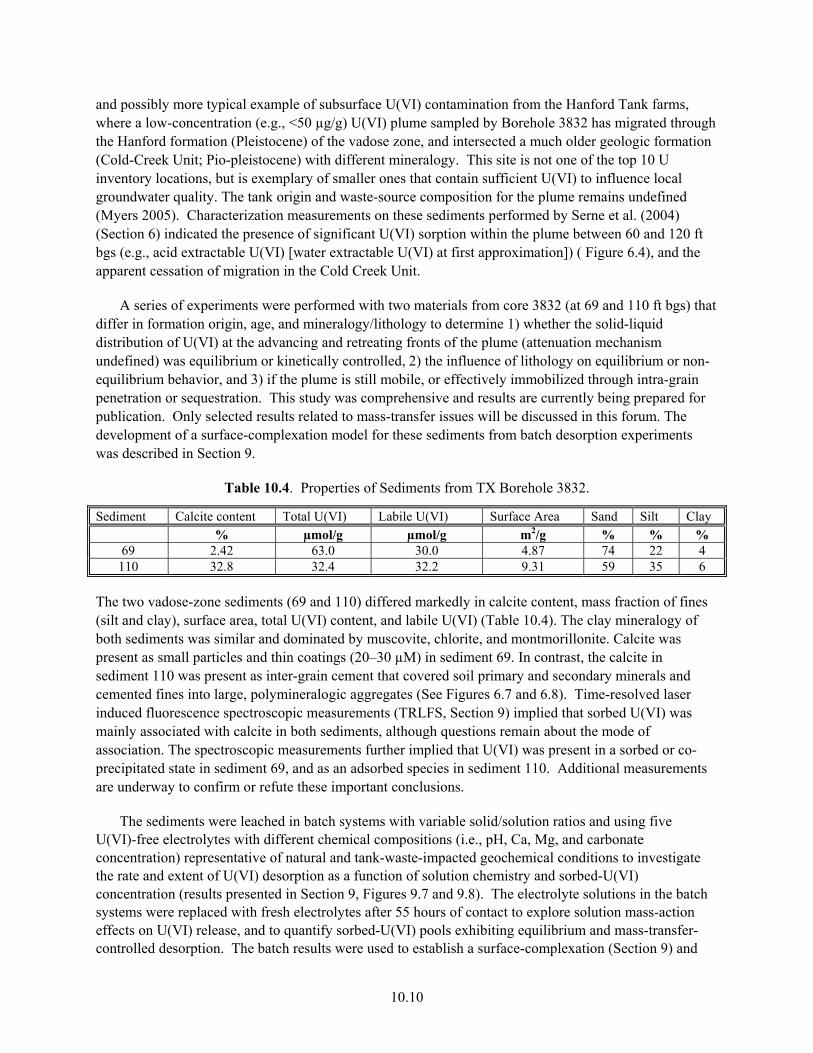
10.10
and possibly more typical example of subsurface U(VI) contamination from the Hanford Tank farms, where a low-concentration (e.g., <50 µg/g) U(VI) plume sampled by Borehole 3832 has migrated through the Hanford formation (Pleistocene) of the vadose zone, and intersected a much older geologic formation (Cold-Creek Unit; Pio-pleistocene) with different mineralogy. This site is not one of the top 10 U inventory locations, but is exemplary of smaller ones that contain sufficient U(VI) to influence local groundwater quality. The tank origin and waste-source composition for the plume remains undefined (Myers 2005). Characterization measurements on these sediments performed by Serne et al. (2004) (Section 6) indicated the presence of significant U(VI) sorption within the plume between 60 and 120 ft bgs (e.g., acid extractable U(VI) [water extractable U(VI) at first approximation]) ( Figure 6.4), and the apparent cessation of migration in the Cold Creek Unit.
A series of experiments were performed with two materials from core 3832 (at 69 and 110 ft bgs) that differ in formation origin, age, and mineralogy/lithology to determine 1) whether the solid-liquid distribution of U(VI) at the advancing and retreating fronts of the plume (attenuation mechanism undefined) was equilibrium or kinetically controlled, 2) the influence of lithology on equilibrium or non-equilibrium behavior, and 3) if the plume is still mobile, or effectively immobilized through intra-grain penetration or sequestration. This study was comprehensive and results are currently being prepared for publication. Only selected results related to mass-transfer issues will be discussed in this forum. The development of a surface-complexation model for these sediments from batch desorption experiments was described in Section 9.
Table 10.4. Properties of Sediments from TX Borehole 3832.
Sediment Calcite content Total U(VI) Labile U(VI) Surface Area Sand Silt Clay % µmol/g µmol/g m2/g % % %
69 2.42 63.0 30.0 4.87 74 22 4 110 32.8 32.4 32.2 9.31 59 35 6
The two vadose-zone sediments (69 and 110) differed markedly in calcite content, mass fraction of fines (silt and clay), surface area, total U(VI) content, and labile U(VI) (Table 10.4). The clay mineralogy of both sediments was similar and dominated by muscovite, chlorite, and montmorillonite. Calcite was present as small particles and thin coatings (20–30 µM) in sediment 69. In contrast, the calcite in sediment 110 was present as inter-grain cement that covered soil primary and secondary minerals and cemented fines into large, polymineralogic aggregates (See Figures 6.7 and 6.8). Time-resolved laser induced fluorescence spectroscopic measurements (TRLFS, Section 9) implied that sorbed U(VI) was mainly associated with calcite in both sediments, although questions remain about the mode of association. The spectroscopic measurements further implied that U(VI) was present in a sorbed or co-precipitated state in sediment 69, and as an adsorbed species in sediment 110. Additional measurements are underway to confirm or refute these important conclusions.
The sediments were leached in batch systems with variable solid/solution ratios and using five U(VI)-free electrolytes with different chemical compositions (i.e., pH, Ca, Mg, and carbonate concentration) representative of natural and tank-waste-impacted geochemical conditions to investigate the rate and extent of U(VI) desorption as a function of solution chemistry and sorbed-U(VI) concentration (results presented in Section 9, Figures 9.7 and 9.8). The electrolyte solutions in the batch systems were replaced with fresh electrolytes after 55 hours of contact to explore solution mass-action effects on U(VI) release, and to quantify sorbed-U(VI) pools exhibiting equilibrium and mass-transfer-controlled desorption. The batch results were used to establish a surface-complexation (Section 9) and
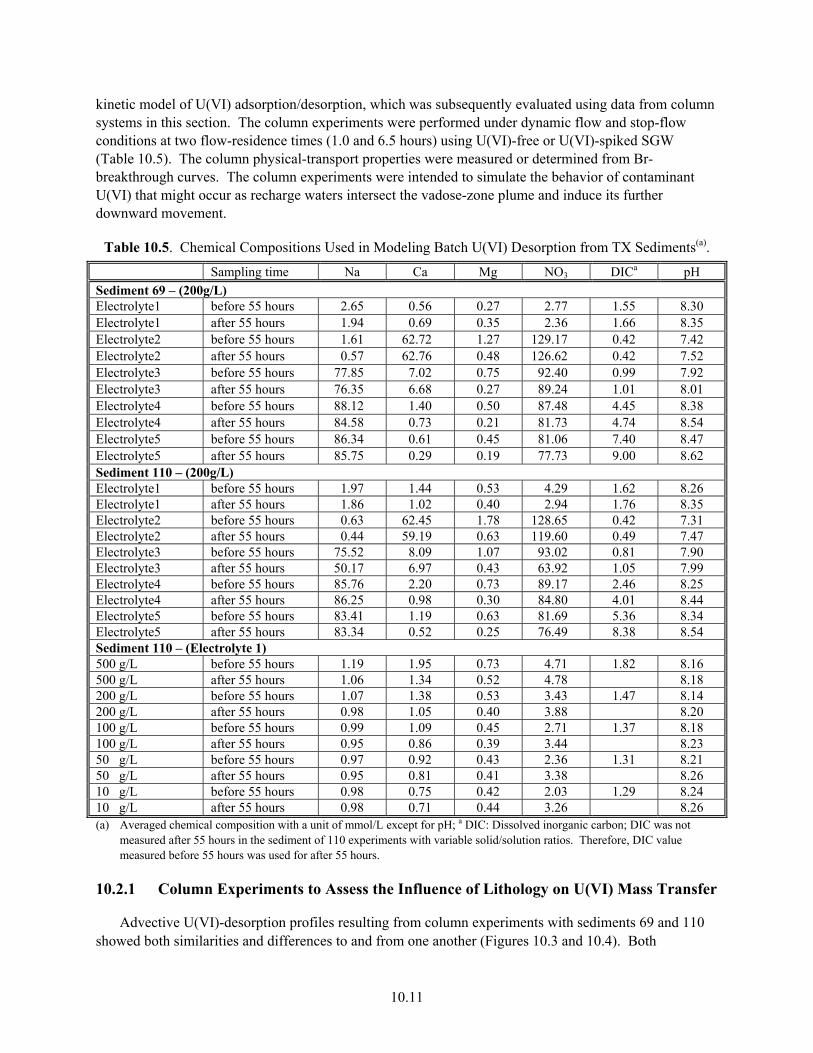
10.11
kinetic model of U(VI) adsorption/desorption, which was subsequently evaluated using data from column systems in this section. The column experiments were performed under dynamic flow and stop-flow conditions at two flow-residence times (1.0 and 6.5 hours) using U(VI)-free or U(VI)-spiked SGW (Table 10.5). The column physical-transport properties were measured or determined from Br-breakthrough curves. The column experiments were intended to simulate the behavior of contaminant U(VI) that might occur as recharge waters intersect the vadose-zone plume and induce its further downward movement.
Table 10.5. Chemical Compositions Used in Modeling Batch U(VI) Desorption from TX Sediments(a).
Sampling time Na Ca Mg NO3 DICa pH Sediment 69 – (200g/L) Electrolyte1 before 55 hours 2.65 0.56 0.27 2.77 1.55 8.30 Electrolyte1 after 55 hours 1.94 0.69 0.35 2.36 1.66 8.35 Electrolyte2 before 55 hours 1.61 62.72 1.27 129.17 0.42 7.42 Electrolyte2 after 55 hours 0.57 62.76 0.48 126.62 0.42 7.52 Electrolyte3 before 55 hours 77.85 7.02 0.75 92.40 0.99 7.92 Electrolyte3 after 55 hours 76.35 6.68 0.27 89.24 1.01 8.01 Electrolyte4 before 55 hours 88.12 1.40 0.50 87.48 4.45 8.38 Electrolyte4 after 55 hours 84.58 0.73 0.21 81.73 4.74 8.54 Electrolyte5 before 55 hours 86.34 0.61 0.45 81.06 7.40 8.47 Electrolyte5 after 55 hours 85.75 0.29 0.19 77.73 9.00 8.62 Sediment 110 – (200g/L) Electrolyte1 before 55 hours 1.97 1.44 0.53 4.29 1.62 8.26 Electrolyte1 after 55 hours 1.86 1.02 0.40 2.94 1.76 8.35 Electrolyte2 before 55 hours 0.63 62.45 1.78 128.65 0.42 7.31 Electrolyte2 after 55 hours 0.44 59.19 0.63 119.60 0.49 7.47 Electrolyte3 before 55 hours 75.52 8.09 1.07 93.02 0.81 7.90 Electrolyte3 after 55 hours 50.17 6.97 0.43 63.92 1.05 7.99 Electrolyte4 before 55 hours 85.76 2.20 0.73 89.17 2.46 8.25 Electrolyte4 after 55 hours 86.25 0.98 0.30 84.80 4.01 8.44 Electrolyte5 before 55 hours 83.41 1.19 0.63 81.69 5.36 8.34 Electrolyte5 after 55 hours 83.34 0.52 0.25 76.49 8.38 8.54 Sediment 110 – (Electrolyte 1) 500 g/L before 55 hours 1.19 1.95 0.73 4.71 1.82 8.16 500 g/L after 55 hours 1.06 1.34 0.52 4.78 8.18 200 g/L before 55 hours 1.07 1.38 0.53 3.43 1.47 8.14 200 g/L after 55 hours 0.98 1.05 0.40 3.88 8.20 100 g/L before 55 hours 0.99 1.09 0.45 2.71 1.37 8.18 100 g/L after 55 hours 0.95 0.86 0.39 3.44 8.23 50 g/L before 55 hours 0.97 0.92 0.43 2.36 1.31 8.21 50 g/L after 55 hours 0.95 0.81 0.41 3.38 8.26 10 g/L before 55 hours 0.98 0.75 0.42 2.03 1.29 8.24 10 g/L after 55 hours 0.98 0.71 0.44 3.26 8.26 (a) Averaged chemical composition with a unit of mmol/L except for pH; a DIC: Dissolved inorganic carbon; DIC was not
measured after 55 hours in the sediment of 110 experiments with variable solid/solution ratios. Therefore, DIC value measured before 55 hours was used for after 55 hours.
10.2.1 Column Experiments to Assess the Influence of Lithology on U(VI) Mass Transfer
Advective U(VI)-desorption profiles resulting from column experiments with sediments 69 and 110 showed both similarities and differences to and from one another (Figures 10.3 and 10.4). Both
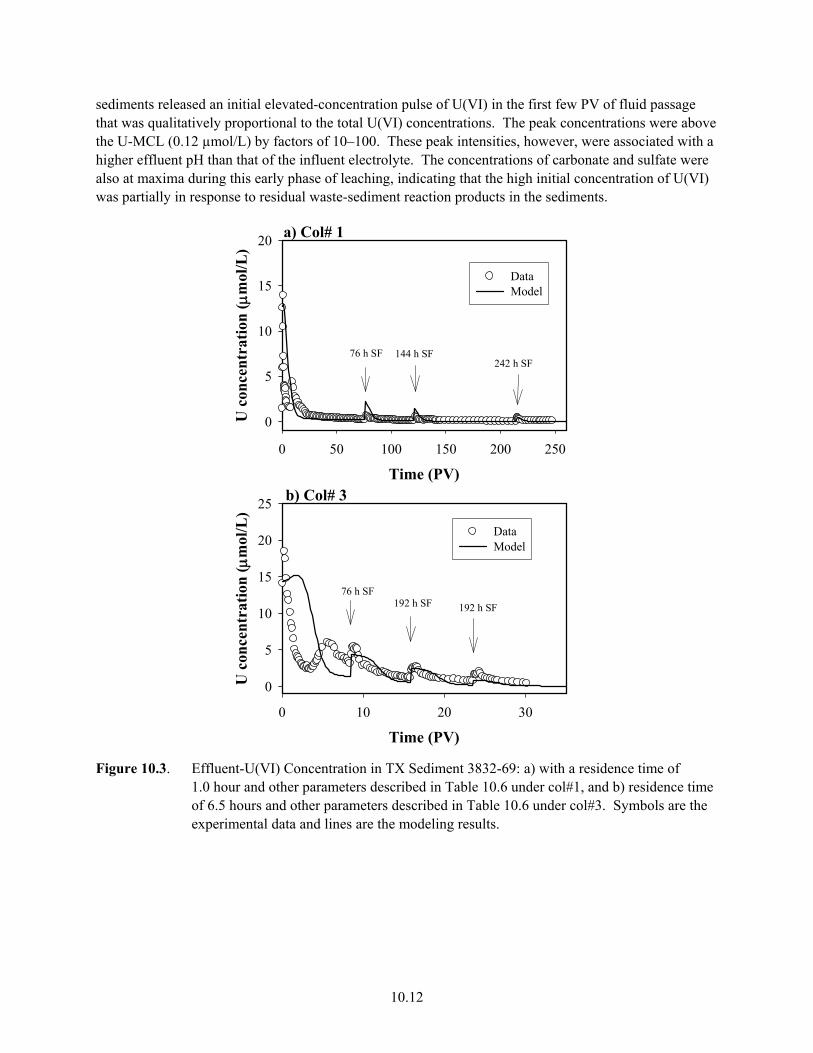
10.12
sediments released an initial elevated-concentration pulse of U(VI) in the first few PV of fluid passage that was qualitatively proportional to the total U(VI) concentrations. The peak concentrations were above the U-MCL (0.12 µmol/L) by factors of 10–100. These peak intensities, however, were associated with a higher effluent pH than that of the influent electrolyte. The concentrations of carbonate and sulfate were also at maxima during this early phase of leaching, indicating that the high initial concentration of U(VI) was partially in response to residual waste-sediment reaction products in the sediments.
a) Col# 1
Time (PV)0 50 100 150 200 250
U c
once
ntra
tion
( μm
ol/L
)
0
5
10
15
20
DataModel
76 h SF 144 h SF242 h SF
b) Col# 3
Time (PV)0 10 20 30
U c
once
ntra
tion
( μm
ol/L
)
0
5
10
15
20
25
DataModel
76 h SF192 h SF 192 h SF
a) Col# 1
Time (PV)0 50 100 150 200 250
U c
once
ntra
tion
( μm
ol/L
)
0
5
10
15
20
DataModel
76 h SF 144 h SF242 h SF
b) Col# 3
Time (PV)0 10 20 30
U c
once
ntra
tion
( μm
ol/L
)
0
5
10
15
20
25
DataModel
76 h SF192 h SF 192 h SF
Figure 10.3. Effluent-U(VI) Concentration in TX Sediment 3832-69: a) with a residence time of
1.0 hour and other parameters described in Table 10.6 under col#1, and b) residence time of 6.5 hours and other parameters described in Table 10.6 under col#3. Symbols are the experimental data and lines are the modeling results.

10.13
a) Col# 2
Time (PV)0 50 100 150 200 250
U c
once
ntra
tion
μm
ol/L
0.0
0.5
1.0
1.5
2.0
2.5
3.0DataModel
174 h SF 142 h SF 675 h SF
b) Col# 4
Pore volume0 5 10 15 20 25
U c
once
ntra
tion
μm
ol/L
0.0
0.5
1.0
1.5
2.0
2.5
3.0DataModel
72 h SF 168 h SF
a) Col# 2
Time (PV)0 50 100 150 200 250
U c
once
ntra
tion
μm
ol/L
0.0
0.5
1.0
1.5
2.0
2.5
3.0DataModel
174 h SF 142 h SF 675 h SF
b) Col# 4
Pore volume0 5 10 15 20 25
U c
once
ntra
tion
μm
ol/L
0.0
0.5
1.0
1.5
2.0
2.5
3.0DataModel
72 h SF 168 h SF
Figure 10.4. Effluent U(VI) Concentration in TX Sediment 3832-110 Column: a) with a residence
time of 1.0 hour and other parameters described in Table 10.6 under col#2, and b) residence time of 6.4 hours and other parameters described in Table 10.6 under col#4. Symbols are the experimental data and lines are the modeling results.
The initial U(VI)-concentration peak in sediment 69 was followed by an exponentially decreasing trend of concentrations with leaching time. There was a second pulse of U(VI) release at approximately 10 PV in sediment 69 that was unaffected by residence time (Figure10.3). It was unclear whether the second pulse originated from bimodal-kinetic behavior of U(VI) desorption, from the effects of temporal calcium carbonate dissolution that influenced the state of aqueous complexation. This second pulse was not observed in the batch systems because the physical system was not sensitive to changes of that magnitude. The extended-release behavior of U(VI) after 10 PV showed long tailing with observable increases during the SF events, indicating kinetic or mass-transfer influences on desorption. In contrast to 69, sediment 110 maintained a remarkably constant concentration of 0.5 µmol/L for approximately 180 PV after the initial peak in U(VI) concentration (1–5 PV) (Figure 10.4). The sustained release of U(VI) in sediment 110 was virtually unaffected by stop-flow events, consistent with the minor temporal changes of U(VI) concentrations in the batch systems.
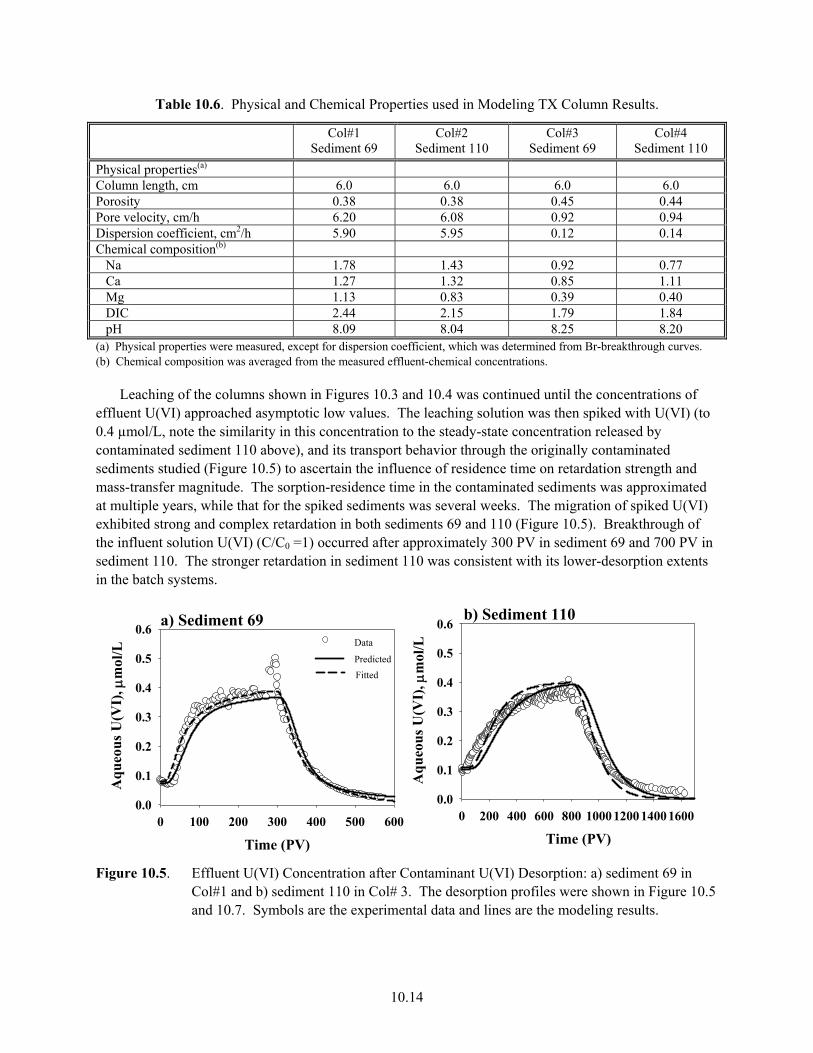
10.14
Table 10.6. Physical and Chemical Properties used in Modeling TX Column Results.
Col#1 Sediment 69
Col#2 Sediment 110
Col#3 Sediment 69
Col#4 Sediment 110
Physical properties(a) Column length, cm 6.0 6.0 6.0 6.0 Porosity 0.38 0.38 0.45 0.44 Pore velocity, cm/h 6.20 6.08 0.92 0.94 Dispersion coefficient, cm2/h 5.90 5.95 0.12 0.14 Chemical composition(b) Na 1.78 1.43 0.92 0.77 Ca 1.27 1.32 0.85 1.11 Mg 1.13 0.83 0.39 0.40 DIC 2.44 2.15 1.79 1.84 pH 8.09 8.04 8.25 8.20 (a) Physical properties were measured, except for dispersion coefficient, which was determined from Br-breakthrough curves. (b) Chemical composition was averaged from the measured effluent-chemical concentrations.
Leaching of the columns shown in Figures 10.3 and 10.4 was continued until the concentrations of effluent U(VI) approached asymptotic low values. The leaching solution was then spiked with U(VI) (to 0.4 µmol/L, note the similarity in this concentration to the steady-state concentration released by contaminated sediment 110 above), and its transport behavior through the originally contaminated sediments studied (Figure 10.5) to ascertain the influence of residence time on retardation strength and mass-transfer magnitude. The sorption-residence time in the contaminated sediments was approximated at multiple years, while that for the spiked sediments was several weeks. The migration of spiked U(VI) exhibited strong and complex retardation in both sediments 69 and 110 (Figure 10.5). Breakthrough of the influent solution U(VI) (C/C0 =1) occurred after approximately 300 PV in sediment 69 and 700 PV in sediment 110. The stronger retardation in sediment 110 was consistent with its lower-desorption extents in the batch systems.
a) Sediment 69
Time (PV)0 100 200 300 400 500 600
Aqu
eous
U(V
I), μ
mol
/L
0.0
0.1
0.2
0.3
0.4
0.5
0.6
PredictedFitted
Data
b) Sediment 110
Time (PV)0 200 400 600 800 1000120014001600
Aqu
eous
U(V
I), μ
mol
/L
0.0
0.1
0.2
0.3
0.4
0.5
0.6
Figure 10.5. Effluent U(VI) Concentration after Contaminant U(VI) Desorption: a) sediment 69 in
Col#1 and b) sediment 110 in Col# 3. The desorption profiles were shown in Figure 10.5 and 10.7. Symbols are the experimental data and lines are the modeling results.

10.15
10.2.2 Modeling to Reconcile Batch and Column Desorption Behavior of Sediment 69
The fast initial release followed by the relatively slow kinetic desorption of U(VI) from sediment 69 in batch systems (Figure 9.7) was described with a two-site model, consisting of equilibrium and kinetic pools of U(VI)-sorption sites. The sorption process was represented with surface-complexation reactions (Section 9) to account for the dependence of desorption extent on electrolyte composition (e.g., pH, bicarbonate, calcium). Mathematically, the model was described with the following multi-component equations:
)( i
kii
eqii CL
tm
tm
tC
=∂
∂+
∂∂
+∂
∂, i =1, 2, …, N (10.2.1)
)( ki
ikii
kii mQt
m−=
∂∂
α (10.2.2)
where Ci = total aqueous concentration of chemical component i eq
im = total sorbed concentration of chemical component i in equilibrium with the aqueous phase
kiim = total sorbed concentration of chemical component i controlled by kinetic sorption processes
kiiQ = thermodynamic extent of sorbed chemical component i on the kinetic site
α = rate constant for the kinetic site N = total number of chemical components in the system.
Note that variables eqim , ki
im , kiiQ were normalized to aqueous volume. Operator L(Ci) in Equation
10.2.1 was zero for batch systems and had the following expression for column systems:
x
Cv
xC
DCL iii ∂
∂−
∂∂
= 2
2
)( (10.2.3)
where D = dispersion coefficient
v = pore velocity.
This kinetic-release model was functionally different from that applied in Section 10.1 because the geochemical speciation (Section 9) and physical location of sorbed U(VI) was different from the BX sediments, and was less precisely known because of its low concentration.
A suite of different surface-complexation reactions, as described in Section 9 and by Bond et al. (2007), for 300 Area vadose-zone sediments were evaluated for the respective ability to describe U(VI) sorption to and desorption from sediment 69. In each trial, only one surface-complexation reaction was included to minimize adjustable parameters. A uranyl-carbonate surface species was eventually selected based on the minimal errors between the calculated and measured U(VI) desorption in the batch system (Figure 9.7):
SOH + UO22+ + CO3
2- = SOUO2HCO3 log K = 16.70 (10.2.4)
where SOH = surface site and SOUO2HCO3 = sorbed U(VI) species.
The equilibrium constant (log K) was determined simultaneously with the other two parameters—a rate constant (α) in Equation 10.2.2 and a site fraction (f), which was the ratio of equilibrium sorption-site concentration to total sorption-site concentration in the sediment. The total sorption-site concentration
10.16
was calculated from an assumed site density of 3.84 μmol/m2 of sediment surface area (Bond et al. 2007), and the solid/solution ratios used in the batch systems. The same surface-complexation reaction was used to describe U(VI) sorption/desorption on both the equilibrium and kinetic sites. This treatment effectively assumed that the kinetic behavior of U(VI) release resulted from mass transfer from intra-grain sorption sites (that exhibited equal adsorption strength to surface sites) to bulk solution.
Eight chemical components were considered in modeling the batch data, including UO22+, CO3
2-, Na+, Ca2+, Mg2+, NO3
-, H+, and SOH, and 43 derived-aqueous species (e.g., Section 4 and Table 4.1). Nitrate (NO3
-) was included for aqueous-charge balance. Measured concentrations of other chemical components and pH (Table 10.5), and labile U(VI) (Table 10.4) were used to constrain the model. The initial distribution of U(VI) between the equilibrium and kinetic sites was determined by assuming that U(VI) was at equilibrium on all sorption sites.
The best-fit numerical simulations of the sediment 69 batch data yielded a surface-complexation constant (log K) of 16.70, an equilibrium site fraction (f) of 0.6 (or 0.4 for the kinetic site), and a kinetic-rate constant (α) of 0.007 h-1. This model reasonably described the batch-desorption data for different electrolyte solutions (Figure 9.7). The mismatches between the calculated and measured values resulted mainly from chemical-composition changes as a function of time within each period of electrolyte contact. These were not explicitly considered in the model, except those resulting from the electrolyte replacement at 55 hours.
The model also provided qualitative prediction of U(VI) desorption in the column systems after coupling with the advective/dispersion processes (Figure10.3), although there were problems. The pore velocity (v) was measured, and the dispersion coefficient (D) directly determined from Br-breakthrough curves in the column systems (Table 10.6). The chemical compositions of both influent and effluent solutions were fixed at average measured values (Table 10.6) in the model, recognizing that uncharacterized sediment-water reaction mechanisms caused small, but potentially significant, changes to the effluent solutions. The model had difficulty in describing the short-term desorption data (e.g., 0-10 PV; Figure 10.3), particularly the second U(VI) pulse at 6 PV in Figure 10.3b that was not observed in the batch systems. The calculated-U(VI) profile for this pore-volume region fell between the initial and second U(VI) peaks, suggesting that the aqueous U(VI) solubilized in the batch systems originated from both pools of sediment U(VI).
The predicted adsorption/desorption-breakthrough curve of spiked U(VI) also matched well with the experimental results for sediment 69 (Figure 10.5a), indicating that the parameterized model was robust for both contaminant and spiked U(VI) that exhibited different sorbed-residence times. A second peak was not observed in the desorption profile for spiked U(VI) in sediment 69 (Figure10.5), indicating that the observed peak in Figure 10.3 may have resulted from transient chemical conditions caused by waste residuals. An improved match between model and experimental results for short-term adsorption and desorption was achieved by decreasing the surface-complexation reaction constant (0.16 log unit) and increasing the rate constant to 0.015 h-1. The adjustment of the surface-complexation reaction constant shifted the sorption edge of the breakthrough curve to the left. About 20 PV shift was realized by approximately 1% change in the surface-complexation constant, indicating that the model was extremely sensitive to its value.
Sediment 110. Unlike sediment 69, the desorption of U(VI) from sediment 110 (Figure 9.8) was more consistent with an equilibrium adsorption-desorption process. Mathematically, this problem was
10.17
described by Equations 10.2.1 and 10.2.3 by setting kiim to zero (one-site problem). Of the exhaustive
trials of all potential surface-complex species and combination, as described in Bond et al. (2007) and as shown in Section 9, the following two surface-complexation reactions best describe the batch data over the full range of electrolyte compositions and solid/solution ratios:
SOH + UO22+ + H2O = SOUO2OH + 2H+ log K = -3.71 (10.2.5)
SOH + UO22+ + 2CO3
2- + H+ = SOUO2(HCO3)2- log K = 30.71 (10.2.6)
Note that these two log K constants and the surface-site concentration (SOH) are the only parameters needed to describe U(VI) desorption in this model. The model reasonably described all batch-desorption results (Figure 9.8) given its simplicity. As described for sediment 69, the measured chemical compositions (Table 10.5) and labile U(VI) in the sediment (Table 10.4) were used in constraining the mass balance of chemical components. The surface-complexation-desorption model developed in Section 9, coupled with advection/dispersion, also well described U(VI) release in column systems, except at initial 2–3 PV (Figure 10.4). The initial mismatch was attributed to the large changes in effluent chemical composition from uncharacterized sediment-electrolyte reactions that were not modeled. The average measured influent/effluent chemical compositions (Table 10.6) were fixed in the column geochemical model.
The model over-predicted the adsorption of spiked U(VI) and under-predicted subsequent desorption (Figure 10.5b), indicating that short-term adsorption and desorption was weaker than that in the contaminated sediment. A slight reduction in the surface-complexation constants by 0.08 and 0.01 log unit for reactions 10.2.5 and 10.2.6, respectively, improved the match between the predicted and measured adsorption and desorption results. The calculations, both with and without reaction-constant adjustments, under-predicted the tailing at extended pore volumes (e.g., >1200 PV). The long tailing required a small concentration of kinetic-sorption sites in the model for adequate description, as was the case for sediment 69. The difference between the calculated- and measured-breakthrough curves in Figure 10.5b was also consistent with the presence of such kinetic sites, suggesting that U(VI) adsorption properties may have changed after the long duration of electrolyte leaching. The dissolution of non-stoichiometric calcium carbonates during the experiment may have exposed intra-grain adsorption sites that exhibited kinetic behavior.
10.2.3 Findings Regarding Mass Transfer and Plume Migration in Calcite-Containing Sediments from Tank Farm Core 3832
• There was a soluble fraction of U(VI) in both sediments that was released at concentrations that were 10–100 times the drinking-water standard of 30 ppb (0.126 µmol L-1) in the first five pore volumes. These concentrations were consistent with the estimated in-situ pore-water concentrations reported in Table 6.2.
• The extent of U(VI) desorption in both sediments was solution-dependent and was well represented by surface-complexation reactions that accounted for the effects of pH and aqueous complexation on desorption. The batch-and-column data for sediment 69 required a two-site (equilibrium and kinetic) model for adequate description. The kinetic site was mass-transfer limited, and represented approximately 40% of the adsorption sites. For sediment 110, semi-quantitative description of the batch-and-column data adsorption and desorption data for both contaminant and spiked U(VI) required only two equilibrium surface-complexation reactions.
10.18
• The calcite-rich, silty sediment 110 (Cold Creek member) displayed a higher sorption affinity and larger site concentration for U(VI) than sediment 69 (Hanford Formation), because of its mineralogy and surface area. The stronger U(VI) sorption in sediment 110 implied that the calcite-rich formation may effectively retard the downward migration of the existing vadose-zone U plume.
• Short-term adsorption reactions of spiked U(VI) were somewhat weaker than for contaminant U(VI), indicating a small residence-time effect. For sediment 110, electrolyte leaching apparently generated kinetic sites for U(VI) sorption that led to more extended desorption tailing. At first approximation, the geochemical behavior of both contaminant and spiked U(VI) within a given sediment could be described with an identical set of reaction constants.
• U(VI) desorption was highly sensitive to solution composition—especially pH, carbonate, and calcium—that drew sediment U(VI) into the fluid phase by aqueous complexation. Soluble carbonates existed in these sediments that changed aqueous compositions with time. Accurate modeling of U(VI) sorption and desorption in the sediments requires understanding and numerical integration of the dissolution mechanisms controlling pore-water compositions as they influence desorption kinetics.
• The overall U-plume sampled by the 3832 Borehole is highly retarded by strong adsorption reactions with Cold Creek sediment, but contaminant U(VI) is labile, is not sequestered, and is free to migrate given the constraints of strong-equilibrium surface reactions.
10.3 Scale-Dependent U(VI) Desorption in the 300 Area Sediment
A groundwater-U(VI) plume exists in the 300 Area, which has been the focus of long-term monitoring and geochemical studies (Section 5, Section 6, Section 8, Peterson et al. 2005; Zachara et al. 2005; Williams et al. 2007). The groundwater plume (Figure 6.10) has been slow to dissipate after source-term removal (Peterson et al. 2005). One reason for this appears to be the slow rate of release of sorbed U(VI) from contaminated sediments at the site (Zachara et al. 2005; Qafoku et al. 2005; Bond et al. 2007). Mass transfer regulates this slow-kinetic process (Qafoku et al. 2005), and still-ongoing research with sediments from the site seeks to understand the mineral-physical controls on mass transfer. A preliminary conceptual model holds that mass transfer occurs for U(VI) that is either adsorbed or precipitated within 1-mm- thick, poorly porous grain coatings of micron-sized phyllosilicates and waste-sediment-reaction products deposited on larger lithic fragments and river cobble (see Figures 8.11 and 8.12).
Column experiments were performed to investigate scale-dependent U(VI) desorption in a contaminated sediment collected from the capillary fringe beneath the remediated North Process Pond. More specifically, the study sought to determine mass-transfer rates in sediment with in-situ textural properties to provide insights on true mass-transfer rates that might occur in the field. The collection and characterization of these sediments was reported in Zachara et al. (2005), and Bond et al. (2007). Contaminated capillary-fringe sediments are believed to be a significant long-term source of U(VI) that has sustained groundwater U concentrations within the plume after source-term removal (Peterson et al. 2005). Experimental insights were consequently sought on U(VI)-release rates and mechanisms relevant to the field scale. A simple question posed was whether mass-transfer processes needed to be explicitly considered to estimate temporal fluxes of U(VI) from the deep-vadose zone to groundwater.

10.19
The material studied (NPP 1-14) was a coarse-textured alluvial sediment containing a significant mass percentage of river cobble (Table 10.7). This sediment was similar to those described from this site in Section 5, Section 6, and Section 9. U(VI) was primarily associated with its minor, fine-grained (<2 mm) mass fraction (Table 10.7). U(VI) desorption was investigated from both the field-textured sediment using a large column (80 cm length by 15 cm inner diameter), and from its <2mm-size fraction in a smaller laboratory column (10 cm length by 3.4 cm inner diameter). Both the field-textured sediment and its <2-mm-size fraction were leached with U(VI)-free, synthetic groundwater (SGW) (Table 10.8). Effluent samples were frequently collected for pH, U(VI), and major cation and anion analyses. Br transport was performed during and after the U(VI)-desorption experiment. Tracer pentafluorobenzoic acid (PFBA) and tritium were also used in the large column to further investigate the physical mass-transfer properties of the porous medium. The PFBA experiment was initiated at the 76th pore volume of U(VI) leaching from the sediment by switching the influent solution to PFBA-SGW. PFBA was measured by UV/VIS spectroscopy at 262 nm (Shimadzu BioSpec 1601). Tritium breakthrough was measured after U(VI) desorption and the PFBA experiment by injecting tritium-labeled SGW. The effluent tritium was determined by scintillation counting and associated software (Beckman LS 9800, Irvine, CA). The measured tritium was reported as total disintegrations per minute (DPM), which included the background scintillation count (about 32 DPM).
Table 10.7. Size and U(VI) Distributions in NPP1-14 Sediment.
Size Range (mm) Mass Fraction (%) Total U(VI) (nmol/g) Cobbles >12.5 74.5 <22 2.0–12.5 17.2 <19 Sand 1.0–2.0 2.64 26 0.5–1.0 2.34 <18 0.25–0.5 0.78 <21 0.149–0.25 0.33 37 0.106–0.149 0.19 <23 0.053–0.149 0.20 <23 Silt+Clay <0.053 1.78 125 Sand+Silt+Clay <2.0 8.30 47.81
Table 10.8. Average Electrolyte Compositions (mmol/L) for NPP1-14 Small and Large Desorption Columns.
Na Ca Mg K DIC(a) SO4 NO3 SiO2 pH Influent SGW 1.53 0.60 0.53 0.43 1.05 0.98 0.57 0.00 8.05 Small Column Effluent(b) 1.25 0.91 0.29 0.10 1.09 0.86 0.54 0.23 7.70 Large Column Effluent(c) 1.79 0.77 0.33 0.21 1.11 0.90 0.58 0.11 7.66 (a) dissolved inorganic carbon. (b) averaged from small column effluent compositions. (c) averaged from the large column effluent compositions.

10.20
10.3.1 Experimental Results
The rate of U(VI) release from the <2-mm sediment fraction was time-variable in the small column, showing a faster initial rate that resulted in the highest effluent-U(VI) concentration within the first pore volume (Figure 10.6a). The effluent-U(VI) concentration quickly decreased with time from the first PV, but after the fifth PV, the decrease became much slower, indicating that sediment U(VI) was associated with multiple sites that had different thermodynamic and/or kinetic properties. In contrast, the transport of tracer Br behaved ideally (Figure 10.6b). The effluent-U(VI) concentrations significantly increased during the SF events, showing strong kinetic behavior of uranyl mass transfer from the sediment to aqueous phase. Following the spike of the effluent-U(VI) concentration after each SF event, there was a period of about five PV of quick decrease in effluent-U(VI) concentration, followed by a slower period.
a) U(VI)
Time (PV)0 20 40 60 80 100 120
U(V
I), μ
mol
/L
0.00
0.05
0.10
0.15
0.20
0.25
DataSC-DR model
SF 24 h SF 46 hSF 72 h SF 96 h
b) Br
Time (PV)0 2 4 6 8 156 158 160 162
Br,
C/C
0
0.0
0.2
0.4
0.6
0.8
1.0
DataModel
Figure 10.6. Effluent U(VI) Concentrations (a) and Br breakthrough Curve (b) in a Column with
<2-mm NPP1-14 Sediment. Symbols are the experimental data and lines are the modeling results. The Br data were modeled with advection and dispersion only, and the U(VI) data were modeled with advection and dispersion coupled with U(VI) desorption kinetics that was described with a coupled model of surface-complexation reactions with a distributed-rate expression (SC-DR) (detail in text).
This phenomenon was consistent after all the SF events, suggesting that faster-kinetic sites had been recharged by the U(VI) released from the slower sites during the SF durations. The effluent-U(VI) concentrations, after ignoring the spikes from SF events, decreased with time, reflecting a lowered thermodynamic-driving force for desorption that accompanied U(VI) removal from the sediment. The effects of increasing SF durations at later leaching times (e.g., 96 hours) were muted by these thermodynamic effects.
U(VI) desorption from the field-textured sediment in the large column (Figure 10.7) was similar in trend to the <2-mm size fraction in the small column (Figure 10.6). The evolved U(VI) concentrations in the large column were lower, however, in spite of the application of a longer residence in the large column (22.7 hours) as compared to the small column (1.2 hours). The effluent U(VI) concentrations also decreased faster as a function of time in the large column. These apparent differences in behavior resulted from dilution of U(VI)-containing fine-grained materials by the larger gravels and cobbles in the field-textured sediment (Table 10.7), and from physical non-ideality in the large column as described below.
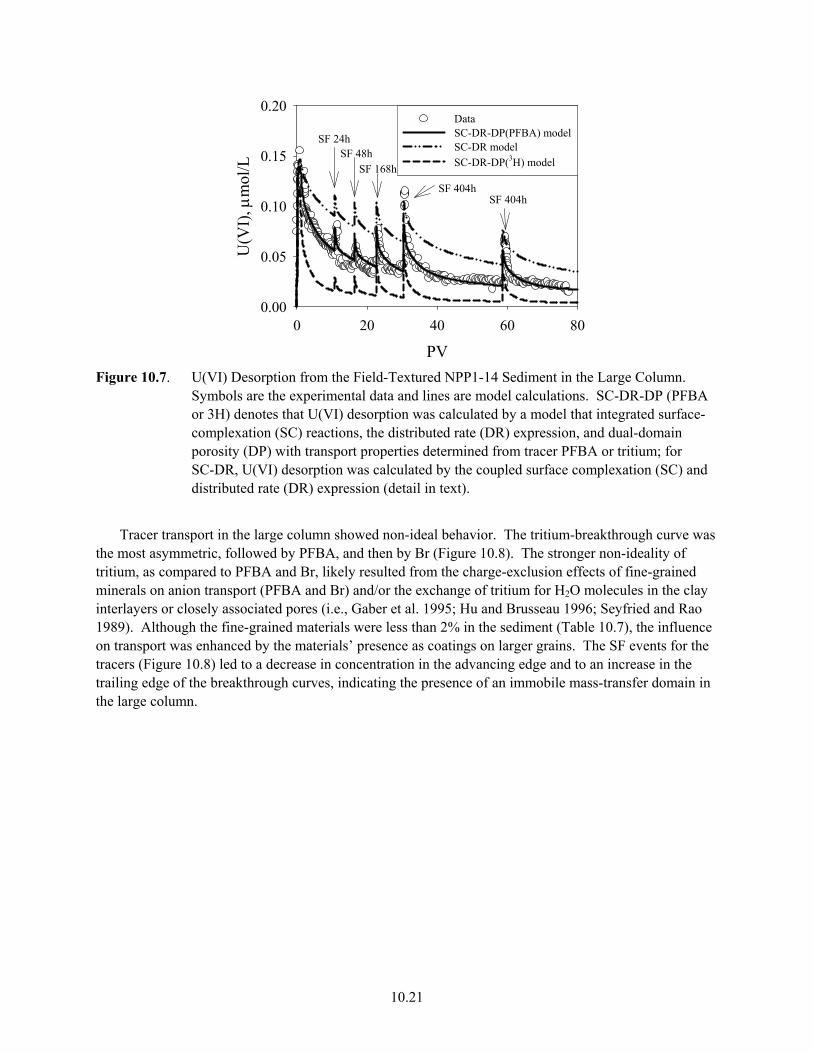
10.21
PV0 20 40 60 80
U(V
I), μ
mol
/L
0.00
0.05
0.10
0.15
0.20DataSC-DR-DP(PFBA) modelSC-DR modelSC-DR-DP(3H) model
SF 24hSF 48h
SF 168h
SF 404hSF 404h
Figure 10.7. U(VI) Desorption from the Field-Textured NPP1-14 Sediment in the Large Column.
Symbols are the experimental data and lines are model calculations. SC-DR-DP (PFBA or 3H) denotes that U(VI) desorption was calculated by a model that integrated surface-complexation (SC) reactions, the distributed rate (DR) expression, and dual-domain porosity (DP) with transport properties determined from tracer PFBA or tritium; for SC-DR, U(VI) desorption was calculated by the coupled surface complexation (SC) and distributed rate (DR) expression (detail in text).
Tracer transport in the large column showed non-ideal behavior. The tritium-breakthrough curve was the most asymmetric, followed by PFBA, and then by Br (Figure 10.8). The stronger non-ideality of tritium, as compared to PFBA and Br, likely resulted from the charge-exclusion effects of fine-grained minerals on anion transport (PFBA and Br) and/or the exchange of tritium for H2O molecules in the clay interlayers or closely associated pores (i.e., Gaber et al. 1995; Hu and Brusseau 1996; Seyfried and Rao 1989). Although the fine-grained materials were less than 2% in the sediment (Table 10.7), the influence on transport was enhanced by the materials’ presence as coatings on larger grains. The SF events for the tracers (Figure 10.8) led to a decrease in concentration in the advancing edge and to an increase in the trailing edge of the breakthrough curves, indicating the presence of an immobile mass-transfer domain in the large column.
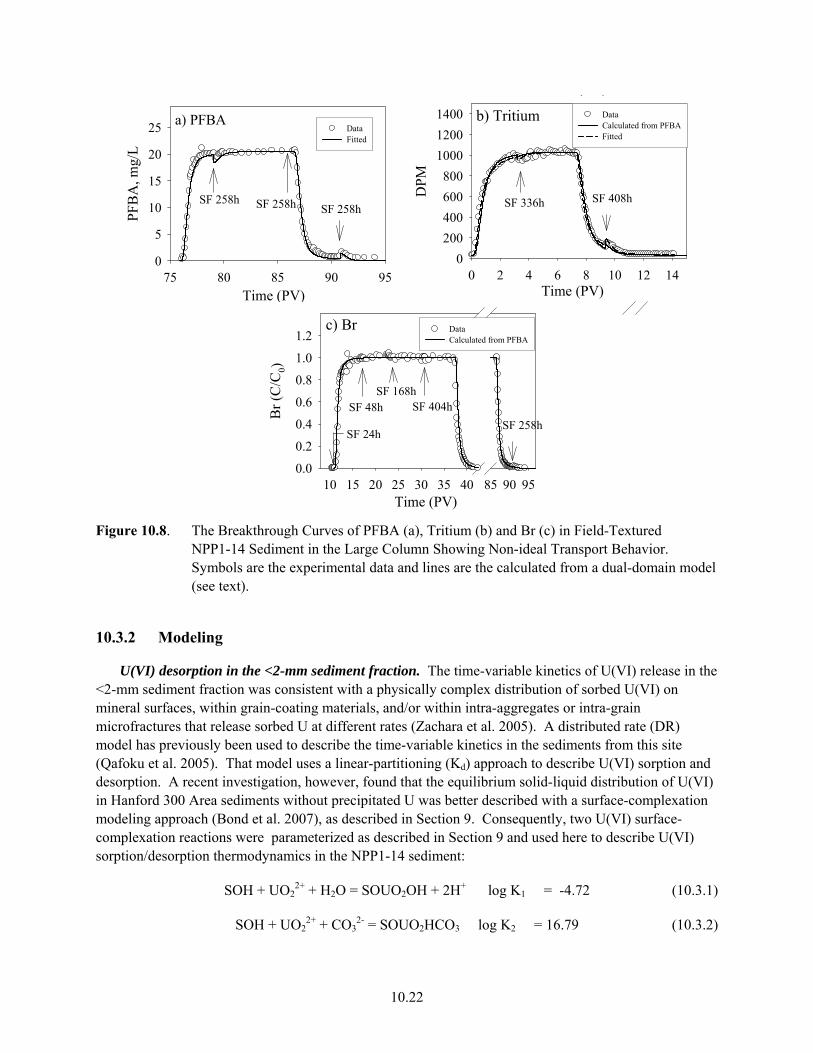
10.22
a) PFBA
Time (PV)75 80 85 90 95
PFB
A, m
g/L
0
5
10
15
20
25 DataFitted
SF 258h SF 258h SF 258h
b) Tritium
Time (PV)0 2 4 6 8 10 12 14
DPM
0200400600800
100012001400 Data
Calculated from PFBAFitted
SF 408h
( )
SF 336h
c) Br
Time (PV)10 15 20 25 30 35 40 85 90 95
Br (
C/C
0)
0.0
0.2
0.4
0.6
0.8
1.0
1.2 DataCalculated from PFBA
( )
SF 24h
SF 48hSF 168h
SF 404hSF 258h
Figure 10.8. The Breakthrough Curves of PFBA (a), Tritium (b) and Br (c) in Field-Textured
NPP1-14 Sediment in the Large Column Showing Non-ideal Transport Behavior. Symbols are the experimental data and lines are the calculated from a dual-domain model (see text).
10.3.2 Modeling
U(VI) desorption in the <2-mm sediment fraction. The time-variable kinetics of U(VI) release in the <2-mm sediment fraction was consistent with a physically complex distribution of sorbed U(VI) on mineral surfaces, within grain-coating materials, and/or within intra-aggregates or intra-grain microfractures that release sorbed U at different rates (Zachara et al. 2005). A distributed rate (DR) model has previously been used to describe the time-variable kinetics in the sediments from this site (Qafoku et al. 2005). That model uses a linear-partitioning (Kd) approach to describe U(VI) sorption and desorption. A recent investigation, however, found that the equilibrium solid-liquid distribution of U(VI) in Hanford 300 Area sediments without precipitated U was better described with a surface-complexation modeling approach (Bond et al. 2007), as described in Section 9. Consequently, two U(VI) surface-complexation reactions were parameterized as described in Section 9 and used here to describe U(VI) sorption/desorption thermodynamics in the NPP1-14 sediment:
SOH + UO22+ + H2O = SOUO2OH + 2H+ log K1 = -4.72 (10.3.1)
SOH + UO22+ + CO3
2- = SOUO2HCO3 log K2 = 16.79 (10.3.2)

10.23
where SOH = surface site for uranyl adsorption SOUO2OH and SOUO2HCO3 = sorbed uranyl species.
Other components in the reactions are aqueous species; and K1 and K2 are the equilibrium constants. These two surface-complex species were consistent with the observed-florescence spectra of sorbed U(VI) in the sediment.
The DR model described in Qafoku et al. (2005) was modified to accept the multi-component surface-complexation model, as described below:
xC
vxC
Dt
mt
C iiM
k
kii
∂∂
−∂
∂=
∂∂
+∂
∂∑
=2
2
1
, i =1, 2, …, N (10.3.3)
)( k
ikik
ki mQ
tm
−=∂
∂α , i =1, 2, …, N; k = 1, 2, …M (10.3.4)
where Ci = total aqueous concentration of chemical component i k
im = total sorbed concentration of chemical component i at sorption site k D = dispersion coefficient v = pore velocity N = total number of chemical components in the system αk = rate constant at site k k
iQ = thermodynamic extent of sorbed chemical component i at site k M = total number of sorption sites.
Note that the sorbed concentration ( kim ) and thermodynamic extent ( k
iQ ) were normalized to pore volume. The rate constants (αk, k =1, 2, …, M) in Equation 10.3.4 were assumed to follow a lognormal-probability distribution to minimize the number of parameters in the model:
( ) ⎟
⎠⎞
⎜⎝⎛ −−= 2
2 )ln(2
1exp2
1)( μασασπ
αp (10.3.5)
where p = probability of a site that has a correspondent rate constant of α μ and σ = the two parameters defining the probability function.
When parameters μ and σ are known, the rate constant αk in Equation 10.3.4 can be determined by the following equation:
αα
αα
αα
dpSfkk
k
Tk )(2/
2/∫Δ+
Δ−
= (10.3.6)
where fk = defined as the site concentration for sorption site k that has an averaged rate constant αk ST = total sorption site concentration in the sediment.
10.24
In the following numerical calculations, fk for each site was taken as ST/M. With fk, the thermodynamic extent of sorbed-chemical component i at site k ( k
iQ ) can be determined from the mass-action equations of the surface-complexation reactions (Equations 10.3.1 and 10.3.2) in equilibrium with local aqueous-chemical composition in the column. The total uranyl sorption site density (ST) was assumed to be 3.84 μmol/m2, and the surface area of the <2-mm size fraction was measured to be 20.4 m2/g (Bond et al. 2007).
The coupled surface complexation and distributed rate (SC-DR) model contained two equilibrium constants (K1 and K2; in Equations 10.3.1 and 10.3.2), two transport parameters (D and v; in Equations 10.3.3), and two kinetic parameters (μ and σ; in Equation 10.3.5), with the respective values provided in Table 10.9. Parameter v was experimentally measured, and D was determined from the Br-breakthrough curve (Figure 10.6b). The equilibrium constant for surface species SOUO2OH (Equation 10.3.1) was taken from Bond et al. (2007). The remaining three parameters (K2 in Equation 10.3.2, and μ and σ in Equation 10.3.5) were determined by fitting the U(VI)-effluent concentrations in Figure 10.6a.
Table 10.9. Parameters in Modeling U(VI) Desorption from NPP1-14 Sediment in Small and Large Columns.
Parameters Symbol Unit Small Column Large Column Column length L cm 10.5 80.0 Pore velocity v cm/h 8.60 3.52 Dispersion coefficient D cm2/h 15.25 46.52 Total Porosity θ / 0.41 0.32 Soil bulk density ρb kg/L 1.56 1.88 Logarithm mean rate μ log(h-1) -9.96 -9.96 Standard deviation σ log(h-1) 2.68 2.68 Porosity Ratio θim/θm / NA 0.20 (PFBA & Br) 0.50 (Tritium) Mass transfer coefficient ω h-1 NA 1.45x10⁻² (PFBA and U)
3.87x10⁻² (Br) 4.28x10⁻² (Tritium)
The numerical simulations included eight chemical components—including UO22+, CO3
2-, Na+, Ca2+, Mg2+, NO3
-, H+, and SOH—and 43 relevant aqueous species. The averaged concentrations of the major chemical concentrations and pH values measured in the effluent and influent solutions (Table 10.8) were used for U(VI) speciation calculations because the calculated difference of U(VI) speciation using the influent and effluent solutions was minor. All aqueous-speciation reactions were treated as equilibrium reactions that were used to determine local aqueous-species concentrations and activities. The Davies expression was used in calculating aqueous-activity coefficients. Only those chemical components that were related to U(VI) surface complexes were considered in the sorbed phase (i.e., CO3
2-, H+, and UO22+).
To minimize the number of parameters, the first-order-rate constant for each sorption site was assumed to be independent of chemical speciation. The total measured U(VI) in the sediment was used as the initial sorbed-uranium concentration, which was assumed to be at equilibrium on all sorption sites.
The SC-DR model well described the effluent data (Figure 10.6a), except that it underestimated the effluent-U(VI) concentration within the first pore volume. The underestimation apparently resulted more from the presence of higher carbonate and calcium concentrations within the first pore volume (data not shown) than the average calcium and carbonate concentrations used in the modeling. Higher carbonate
10.25
and calcium concentrations would decrease the thermodynamic extent ( kiQ ) of U(VI) sorption, which in
turn, would increase the rate of U(VI) release from the sediment according to Equation 10.3.4.
Scaling of SC-DR model for U(VI) desorption in the field-textured sediment. The SC-DR model, as described above and applied to the <2-mm sediment, was tested for its ability to describe U(VI) desorption in the large column after scaling it to the sorbed U(VI) and sorption-site concentration in the field-textured sediment (Table 10.7). Independently determined transport parameters (v, D, and θ) for the large column (Table 10.9) were used in the simulation. The immobile domain in the large column was not considered in this case and, thus, all sediment U(VI) and sorption sites were assumed to contact the mobile domain. The simulation, however, over-predicted the effluent-U(VI) concentrations (Figure 10.7, dotted line), suggesting that consideration of the immobile domain was necessary to model the rate of U(VI) release from the field-textured sediment.
The following approach was taken to extend the SC-DR model to the multiple-domain properties in the field-textured sediment:
)(2
2
1
,imi
mi
m
immi
mi
M
k
mki
mi CC
xC
vxC
Dt
mt
C−−
∂∂
−∂
∂=
∂∂
+∂
∂∑
= θθ
ω (10.3.7)
)( ,,
,mk
imk
ik
mki mQt
m−=
∂∂
α (10.3.8)
)(
1
,imi
mi
M
k
imki
imi CC
tm
tC
−=∂
∂+
∂∂
∑=
ω (10.3.9)
)( ,,
,imk
iimk
ik
imki mQt
m−=
∂∂
α (10.3.10)
where miC and im
iC = aqueous concentrations of chemical component i θm and θim = porosities in the mobile and immobile domains, respectively ω = mass transfer coefficient between the mobile and immobile domains mk
im , and imkim , = concentrations
mk
iQ , and imkiQ ,
= thermodynamic extents of sorbed chemical component i at site k, in the mobile and immobile domains, respectively.
Both sorbed and thermodynamic extents were normalized to their respective aqueous-pore volumes in the mobile (θm) and immobile (θim) domains. Other parameters were as described previously. The SC-DR model, as characterized for the fine-grain materials, was used to describe U(VI) desorption kinetics in both the mobile and immobile domains.
Parameter v and total porosity (θm + θim) were experimentally measured. The dispersion coefficient (D), the ratio of immobile to mobile porosity (β = θim /θm), and the mass-transfer coefficient (ω) were determined from the tracer-breakthrough curves in Figure 10.7 using Equations 10.3.7 and 10.3.9, after ignoring the sorption term in both mobile and immobile domains. The PFBA-breakthrough curve was
10.26
first used to determine these dual-domain parameters, and the determined parameters were then used to describe Br- and tritium-breakthrough curves after multiplying the mass-transfer constant (ω) by a factor of 2.67 and 2.96 for Br and tritium, respectively, to account for their diffusion-coefficient differences. Molecular-diffusion coefficients at 25°C are 7.78 x 10⁻¹⁰, 20.8 x10⁻¹⁰, and 23.0x10⁻¹⁰ m2/s for PFBA, Br, and 3H2O, respectively (Cussler 1995; Hu and Brusseau 1996). The dual-domain model reasonably well described all tracer data of PFBA, tritium, and Br with the parameter values listed in Table 10.9. Modeling of the tritium data was improved by increasing the ratio of immobile-to-mobile porosities (Figure 10.8b, Table 10.9). This ratio of immobile-to-mobile porosities was 20% for the PFBA and Br data, and 50% for the tritium data (Table 10.9). The result was qualitatively consistent with a charge-exclusion effect for PFBA and Br transport, and full access of tritium diffusion into all microporous domains of the sediments.
Diffusion coefficients of uranyl species in carbonate solutions are not well understood. One calculation showed that the diffusion coefficient of species UO2(CO3)3
4- was 7.2 x 10⁻¹⁰ m2/s (Yamaguchi and Nakayama 1998), which was close to the PFBA diffusion coefficient (7.78 x 10⁻¹⁰ m2/s). Consequently, the mass-transfer coefficient (ω) determined from PFBA was directly used to describe U(VI)-mass transfer between the immobile and mobile domains because UO2(CO3)3
4- was one of the major aqueous species under the experimental condition (Section 4).
The total initial sorbed-U(VI) concentration and sorption-site concentration in the field-textured sediment were determined based on mass fraction of <2-mm size materials in the whole sediment. The <2-mm materials were assumed to be distributed in the mobile and immobile domains according to the ratio of the respective porosities. The sorbed U(VI) and sorption-site concentration in the immobile and mobile domains were then calculated based on the mass of <2-mm size fraction in these regions.
Two simulations were performed using the coupled-surface complexation, distributed-rate expression, and dual-domain porosity model (SC-DR-DP). The first simulation used the immobile and mobile porosities determined from PFBA, and the other simulation used the porosities determined from tritium. The simulated effluent U(VI) using the dual-domain porosities determined from PFBA matched well with the experimental results, while the model using the tritium dual-domain porosities under-predicted the data (Figure 10.7). The modeling indicated that the physical transport of U(VI) in the dual-domain porous medium was more similar to anionic PFBA than to neutrally charged tritium. The result was expected, as speciation calculations suggested that aqueous-U(VI) species was present as anionic uranyl carbonate species that were probably charge-excluded from those sites that a only neutral, small species, such as tritium, could access through diffusive mass transfer.
10.3.3 Findings Regarding the Scale-Up of Mass Transfer Parameters to Field-Textured Contaminated Sediments
• Coarse-textured subsurface sediments dominated by gravel-sized rock fragments and above are typically screened to <2 mm for laboratory study. This size fractionation is performed because the <2-mm materials are those that are reactive with contaminants, and the <2-mm materials are easier to manipulate in the laboratory. However, it is unknown how kinetic parameters that are measured on <2-mm materials apply to the field.
• Uranyl desorption from the <2-mm fraction was controlled by kinetic processes that exhibited time-variable, multi-site behavior. A multi-component kinetic model that integrated uranyl surface-
10.27
complexation reactions and a distributed-rate expression (SC-DR) successfully described the kinetics of U(VI) release from the <2-mm size fraction of the contaminated sediment.
• The apparent rate of U(VI) release from the field-textured sediment was much slower than from the <2-mm fraction. The slower rate collectively resulted from 1) the dilution of sorbed U(VI) and other sorption sites with less-reactive, larger grains, and 2) physical interactions between the fine and coarse fractions that created domains of sorbed U(VI) that were inaccessible to water advection. A mathematical model that integrated these factors successfully described U(VI) desorption in both the <2-mm and the field-textured sediment using a common set of chemical-reaction and mass-transfer parameters.
• The success in modeling U(VI)-desorption behavior from contaminated sediments at two scales implied that the geochemical processes that were characterized in the laboratory and embodied in the SC-DR were the true processes controlling U(VI)-release rate and extent. The modeling approach described in this study demonstrated a means for up-scaling mass-transfer parameters measured in the laboratory to the field.
• The dual-domain mass-transfer properties were tracer-dependent. Accurate scaling of geochemical reactions and kinetics required using those tracers that exhibited similar mass-transport properties to the dominant-uranyl species. Ion size, charge, and diffusion-rate control microscopic-transport velocities and intra-grain or micropore access; which in turn, influence macroscopic transport. Of the tracers used in this study, PFBA provided the mass-transfer information that best described uranyl-reactive transport.
• Although Br transport could be described by the same mass-transfer properties as those determined from PFBA, after correction for the associated diffusion-coefficient difference, the non-ideality of the Br-breakthrough curve was not as obvious as for PFBA because of the much larger Br-diffusion coefficient. On the other hand, tritium displayed stronger non-ideal behavior than either PFBA or Br, which apparently resulted from its ability to diffuse into domains with high negative-charge density that were not accessible to the other tracers and/or anionic U(VI) species.
10.4 Importance of Kinetic and Mass-Transfer Processes in U(VI) Migration at Hanford
Column dissolution/desorption studies were performed with U(VI)-contaminated sediments from three different and distinct sites, including deep-vadose-zone plumes from the B (241-BX-102, Borehole E33-45) and TX (Borehole 3832) Tank Farms, and the vadose-zone/groundwater plume in 300 Area (316-1/2). Laboratory column experiments, where sediments were subjected to an advective flux of an electrolyte with defined chemical composition, were used to simulate the leaching process that may occur in the field as recharge waters migrate through plumes or zones of sorptive U(VI) retardation. One important objective of these studies was to evaluate whether the release rate of sorbed U(VI) was rapid or if it was kinetically controlled. Another objective was to determine the causes of slow release, if observed, particularly with regard to the nature of mass-transfer limitation. A third objective was to evaluate whether a common model could describe the release behavior observed in sediments from all three sites.
10.28
Unfortunately, the release behavior of U(VI) was found to be quite different in sediments from each site. A common element was that kinetic behavior was the norm; however, the details of the kinetics showed marked differences between the sites. These behaviors were as follows:
• U(VI) was present in BX sediments as intra-grain uranyl-silicate precipitates. The release of U(VI) to porewater was very slow, and was controlled by the chemical kinetics of uranyl-silicate dissolution, as coupled with diffusive mass transfer from intra-grain fractures and pores.
• Sorbed U(VI) was present in TX sediments as poorly defined surface complexes on calcium carbonate and Fe(III)-oxides. The release rate of U(VI) to pore water was relatively rapid, nearly conforming to an equilibrium-type reaction. A kinetically controlled reaction for one of the sediments was required to describe the desorption data.
• Sorbed U(VI) was present in 300 Area sediments as both precipitates and surface complexes, but only a sediment with surface complexes was described herein. The desorption of surface complexes was slow in the sediment studied, and stop-flow studies demonstrated that reaction slowness resulted from diffusion-limited mass transfer of U(VI) from sorption sites in aggregates or particle-coatings of micro-porous phyllosilicates or products of waste-sediment reaction.
The mass-transfer limited kinetically controlled release of U(VI) from both the BX and 300 Area sediments was sufficiently slow that accurate models of future plume migration would have to explicitly consider this process. In contrast, the simpler equilibrium approach would probably suffice for future projections of the TX plume.
The different functional forms of the observed kinetic behavior dictated that different kinetic models be applied to each site. For example, the distributed-rate model (DRM) that yielded excellent simulations of the time-variant release of U(VI) from sediment NPP1-14 (and for other 300 Area sediments in Qafoku et al. 2005), yielded inferior simulations of the kinetic desorption data from the BX and TX sediments. Similarly, the two-site model applied to TX sediment 69 yielded poor simulations of the desorption data from NPP1-14. There was little model interchangeability between the different site sediments. Hence, there was little opportunity to converge on a single mass-transfer model. However, a given model always seemed to apply to all sediments from a single site.
The differences in kinetic behaviors, and need for models of different type, were found to result from factors that were quite different between the sites: 1) the chemical nature of the original U(VI)-containing waste stream as it governed the nature and extent of waste-sediment reactions, 2) the total U(VI) concentration in the waste stream as it influenced whether precipitation or adsorption will predominate, 3) the lithologic properties (chemical, mineralogic, and physical) of the sediments as a control on surface area, site concentration, site affinity, and site location, and 4) the existing chemical speciation and physical location of sorbed U(VI) as they define the current microscopic-reaction model. An important generalization was that waste sources that caused significant waste-sediment reaction (such as the 300 Area Process Ponds) exhibited the slowest U(VI) desorption or dissolution rates. Other Hanford disposal sites that exhibit commonalities in the above factors may well be described with a single model, but the sites described herein exhibit sufficient differences to preclude a unified kinetic/mass-transfer approach.
10.5 Summary and Implications • Both short and long-term adsorption/desorption reactions of contaminant U(VI) can exhibit strong
kinetic behavior in Hanford sediments. This behavior is believed to result from the diffusion of

10.29
U(VI) both to and from adsorption sites in particle and grain interiors, and is termed mass transfer. This finding is not universal to all Hanford sediments. Deep vadose-zone sediments from beneath the TX Tank Farm displayed negligible kinetic behavior for adsorbed U(VI), while shallow vadose-zone and aquifer sediments from the 300 Area consistently displayed significant kinetic behavior.
• Kinetic behavior is most common for adsorbed contaminant U(VI) that has been in-ground for extended periods, and for waste plumes that were initially in gross disequilibrium with subsurface conditions. This is most commonly revealed through desorption measurements. The sediment types or lithologies most likely to display mass-transfer effects are not known.
• Precipitated contaminant U(VI) invariably displays kinetic-release rates because dissolution is fundamentally slower than desorption, and the precipitates often exist in diffusionally restricted physical environments. Particle-coating secondary-mineral products resulting from waste-rock reactions are common to sediments containing uranyl precipitates, and these further slow the rates of precipitate dissolution.
• Various models exist to describe mass-transfer-limited desorption or dissolution in sediments. The authors hoped that a single modeling approach would suffice for all Hanford sediments displaying this type of kinetic behavior, but found that different approaches were needed for materials from different waste plumes. The authors speculate that this results from variations in sediment microporosity. Microporosity is influenced by sediment lithology, along with the nature and extent of waste-sediment reaction.
• Quantifying the mass-transfer process, and explicitly considering it for waste sites where it has been documented to be important, will improve the quality and accuracy of forward predictions of U(VI) migration. Mass transfer slows the rate of exchange of contaminant from sediment to water, and increases the apparent retardation. Due consideration of this process will affect the nature of remedial actions chosen for U(VI)-contaminated waste sites at Hanford.

11.1
11.0 Status of a Generalized Reactive Transport Model for Uranium
11.1 Concept of a Generalized Model
As the disposal inventories in Section 3 indicate, U is an important, long-lived contaminant at Hanford, and its subsurface transport behaviors must be understood for adequate protection of future groundwater quality. Moreover, this understanding must be translated into robust and improved reactive-transport models to predict the migration velocities of existing vadose-zone and groundwater plumes. Past scientific campaigns at Hanford have developed generalized geochemical models that predict the solid-liquid distribution of both 137Cs+ (Zachara et al. 2002; Liu et al. 2003, 2004a; Steefel et al. 2003) and 90Sr2+ (McKinley et al. 2006) as a function of aqueous and/or waste composition and Hanford sediment properties. The models were natural and culminating endpoints of significant scientific research that identified controlling reactions, thermodynamic and kinetic parameters, and determined sediment properties. These reaction-based models serve as examples of those that can be applied to a wide range of different Hanford Sites without calibration, and that form the basis for reasonably accurate reactive-transport calculations with a minimum of empiricism.
A group of investigators that includes all of the report authors and a number of un-named collaborators has been working toward a similar, generalized, reaction-based geochemical model for U(VI) at the Hanford Site. The motivation for this model is the complex aqueous, crystal, and surface chemistry of U(VI), commonality in waste streams representing major inventory sources (e.g., Section 3), and the relatively uniform, natural subsurface geochemical conditions found at Hanford. The need for such a model was discussed in Section 5, where the Kd concept was reviewed, and Kd values for different Hanford sediments were shown to vary over a large range as a result of differences in water composition and pH affecting aqueous speciation and surface-complexation extent, along with differences in texture and mineralogy that influence the distribution and concentration of adsorbents. Moreover, the presence of precipitated U in certain Hanford locations (Sections 8 and 10) precludes a Kd-based reactive-transport approach that is invalid for precipitation/dissolution attenuation mechanisms (see Liu et al. 2004b), and that suffers from other problems (Bethke and Brady, 2000). The objective, however, is not to discuss the merits and limitations of Kd-based models, as they serve a useful and necessary role when properly applied, and many views on them exist. Rather, the authors propose an alternative and complementary approach that relies on scientific research and advances made over the past 10 years in the application of surface-complexation theory to heterogeneous natural materials. This approach, which can be used in combination with more traditional ones, may lessen the uncertainty of performance-assessment calculations in the long run.
The challenge in developing a generalized model for U(VI) at Hanford results from its complex chemistry. In contrast, previous successes with generalized-model development for Cs+ and Sr2+ were facilitated by the relative simplicity of their corresponding elemental geochemistry at Hanford that involved only a few aqueous complexes and multi-component ion exchange as the dominant attenuation mechanism. As is seen herein, U is present as a background constituent in Hanford sediments, and is released to natural waters in low, but significant concentrations (Section 2), exhibits complex-aqueous speciation (Section 4), demonstrates unique isotopic signatures useful in waste-source tracking as a result of the nuclear fuel cycle and specific Hanford operations (Section 7), precipitates in many mineral forms (Section 6 and Section 8; Finch and Murikami 1999), and participates in surface-complexation reactions on multiple mineral surfaces that are very sensitive to pH and aqueous composition (Section 5, Section 9,

11.2
and Section 10). Furthermore, studies of Hanford contaminated sediments from multiple locations indicate that over long contact times, U(VI) may diffuse deeply into particle interiors or interact with waste-sediment reaction products in ways that markedly slow its release back to infiltrating waters (Section 6 and Section 10). Given these complexities, what phenomena should be included in a generalized model, and what should its capabilities be?
11.2 Envisioned Model Capability and Content
The studies summarized in this report regarding the retardation chemistry of U(VI) in 1) contaminated sediments obtained from the field, and 2) pristine sediments spiked with U(VI) in the laboratory reveal that a first-order descriptive/predictive-geochemical model of U(VI) must explicitly and robustly deal with aqueous complexation, adsorption/desorption, and precipitation/dissolution processes. Precipitation/dissolution is most important in the near-field, where U(VI) concentrations are high, waste-sediment reactions operative, and pH varies well beyond natural ranges. In contrast, adsorption-desorption is probably the single most important attenuation mechanism from the near to the far field. Mass transfer is also considered of critical importance to deal with non-equilibrium-transport events, which appear to be significant for U(VI) that has experienced long in-ground residence times, source-term areas where waste-sediment reactions have been significant, and hydrologic zones where advective water transport is rapid and water-residence time short (e.g., 300 Area U plume). Mass transfer is likely to limit the effectiveness of U(VI) remedial actions (Haggerty and Gorelick 1995), and must, therefore, be explicitly considered at some point. All of these processes are strongly influenced by U(VI) aqueous speciation (Section 4), as described throughout this report.
A multi-process, reaction-based geochemical model (Table 11.1) is envisioned, which can describe 1) the initial waste-emplacement, reaction and migration event, if the source-waste composition can be specified, 2) the future migration behavior of U(VI) in both vadose-zone and aquifer plumes given the existing aqueous-system composition, U(VI) geochemical speciation, and mineralogy/texture along the flowpath, and 3) the response of aqueous and sorbed-U(VI) concentrations in the vadose zone or groundwater to remedial actions. The model would be driven by multi-component geochemical reaction networks that have been documented to occur in Hanford sediment influenced by different waste-source discharges, and that control U(VI) geochemical behavior in short- and long-term contaminated sediments.
Adsorption-desorption in the model would be described using a generalized, composite surface-complexation modeling approach (GCSCM) as described by Davis et al. (1998), Davis et al. (2004a), and discussed and implemented in Sections 9 and 10. In this approach, surface-complexation reactions are parameterized between specific aqueous-uranyl species, and undifferentiated sediment-surface sites with concentrations that are proportional to surface area. The large area of the Hanford Site, the presence of numerous lithologies of different mineralogic character (e.g., silt to gravel, with and without calcite), and presence of sediments, with surface chemistries that have been modified by waste-driven reactions, suggest that the overall model contains GCSCM parameters for a set of key, representative Hanford sediment types. The model parameters would allow robust accounting for the effects of variation in aqueous dissolved carbonate (HCO3
- + CO32-), Ca2+, and pH; solid-phase extractable Fe(III), surface area,
and calcium carbonate content. The model would be an equilibrium model, with kinetic effects accounted for by mass transfer to and from the reactive surface sites.

11.3
Table 11.1. Essential Components of a Generalized Geochemical Model1 for U at Hanford.
Priority development
step Phenomena Nature of
model Approach
Status of database or parameter
development Aqueous
complexation Equilibrium mass action
NEA database Complete
1
Adsorption/ desorption
Equilibrium mass action2
Generalized, composite SCM approach for a limited number of representative Hanford sediment types. Robust accounting for DIC, pH, Ca, sediment texture, and key mineralogic parameters
Under development
2
Precipitation/ dissolution
Kinetic mass action3
Discrete phase approach including U(VI) phases with known rapid precipitation kinetics (e.g., oxyhydroxides) and those directly observed in Hanford sediments (silicates and phosphates)
Some parameters available, others under development
3 Mass transfer Coupled
reaction-diffusion4
Continue investigations of representative contaminated materials to identify generalizable patterns of behavior
Some available
1 The geochemical model described here would be linked with a competent hydrologic code to perform reactive transport calculations; an example would be the STOMP code. The generalized uranium model (GUM) is fully compatible with most state-of-the-art reactive-transport simulators.
2 The surface-complexation reactions are considered to be rapid, given many literature reports. Kinetic effects, if they occur during either adsorption or desorption, are attributed to mass transfer.
3 The geochemical kinetic aspects of precipitation/dissolution are accounted for here. Other kinetic effects are attributed to mass transfer.
4 The functional form of the coupled reaction-diffusion model has not been finalized. The DRM (Section 10), however, has already been integrated into STOMP.
Precipitation and dissolution would be described by kinetic mass-action relationships (Liu et al. 2004b; Liu et al. 2006), as these reaction types are much slower than adsorption-desorption. The crystal chemistry of U(VI) is very complex, with over 150 distinct uranyl mineral phases identified (Finch and Murikami 1999), many exhibiting complex stoichiometry. The Hanford model would only contain U(VI) phases with known rapid-precipitation kinetics (such as the oxyhydroxides schoepite, metaschoepite, bequerelite), and those directly observed to precipitate in Hanford sediments (e.g., uranyl silicates and phosphates of different types; Section 8). Thermodynamic data describing the stability of these phases is partially available (e.g., Grenthe et al. 1992; 1995), while that for other phases of importance is being measured by Hanford investigators (e.g., Ilton et al. 2006). Kinetic information is sparse, but relevant data is emerging for key Hanford phases as the research community becomes aware of the need (e.g., Wellman et al. 2006; Liu et al. 2006). The kinetic capability of the model for precipitation-dissolution model is likely to be qualitative for the near future because of the availability of suitable kinetic information.
While mass transfer is a critical process to consider in the generalized model, insufficient research has been performed to identify a suitable, common modeling approach that is universally descriptive of the kinetic-release behavior of U(VI) from contaminated Hanford sediments of different types and waste sources (see Section 10). The researchers’ experience to date suggests that approximately 50% of Hanford’s waste sites or plumes may exhibit strong kinetic/mass-transfer behavior; while the remainder,
11.4
especially those that exhibit slow moisture flow, may be adequately described with an equilibrium approach. It is suggested that mass transfer be included in the general model through direct coupling of geochemical-reaction terms of select species with diffusion (approximated as a first-order kinetic process) as shown in Sections 10.1 and 10.2. There are numerous forms of these microscopic-transport models, but most are degenerate to a similar set of equations and assumptions (Haggerty and Gorelick 1995). The two-site and distributed-rate models (DRM) are potential candidates for the generalized model, in that these are numerically simple and straightforward to parameterize, and have already been linked with the surface-complexation adsorption model by Hanford researchers.
11.3 Modeling Challenges and Needed Research
As noted in Table 11.1 and throughout this report, significant progress toward this multiple-process model has been made. The model has been assembled incrementally and populated with process descriptions and thermodynamic, kinetic, and empirical parameters found necessary to describe U(VI) fluxes to and from contaminated sediments in the laboratory. In fact, all aspects of the model have been tested through applications to specific case studies with Hanford materials as demonstrated in Sections 8, 9, and 10, and cited publications within those sections. The ability of the model to describe, simulate, and predict the complex behaviors of U(VI) in the laboratory setting has ranged from fair to outstanding. The model, including mass transfer, has been used within the STOMP code to simulate 2-D, field-scale U(VI) transport in the 300 Area U plume.
The model, including processes and associated parameters, however, are incomplete. The following challenging geochemical situations are among many that exceed the current capabilities of the model:
• Waste sites or plumes where complex mineral products of past sediment-waste reactions, including coprecipitates and solid solutions, exert a controlling influence on U(VI) solid-liquid distribution.
• Deep vadose-zone plumes where accurate prediction of pore-water composition (as influenced by coupled multi-component ion exchange and dissolution reactions) is needed for realistic SCM calculations.
• Subsurface systems containing sorbed U(VI) in multiple speciation states with different and uncharacterized kinetic reactivities or unknown thermodynamic properties.
• Vadose-zone U(VI)-source terms that contain precipitated U(VI) in complex intra-grain locations or mineral-surface coatings that contain bathing fluids of unknown composition.
Research is needed to improve the overall scientific understanding of U(VI) geochemistry at Hanford, and to develop comprehensive conceptual models of U(VI) speciation, reactivity, and migration in the major-inventory sites discussed in Section 3. Studies are necessary to further parameterize the process-specific models described in Table 11.1. A robust parameter base is needed that will enable generalized predictions of U(VI) mobility based on a tractable set of site-characterization measurements. The following are key research needs that remain to establish a science-based generalized geochemical model for U at Hanford:
• Sampling, characterization, speciation measurements, and mechanistic studies of U(VI)-contaminated sediments from key sites with known waste sources, especially those of U-plant origin.

11.5
• Carefully conceptualized U(VI)-adsorption studies on a representative set of Hanford sediments from the deep-vadose zone and unconfined aquifer as needed to parameterize a generalized, multi-component surface-complexation adsorption model.
• Thermodynamic and kinetic studies of precipitated U(VI) phases in Hanford sediments (and model analogues) as needed to quantify and describe solubility-controlled source terms.
• Improved approaches to accurately predict the pore-water composition of deep vadose-zone sediments as a function of lithology, mineralogy, and waste inputs of different type.
• Additional studies of kinetic and mass-transfer processes in contaminated sediments, exhibiting different geochemical speciation to clarify future modeling needs, and to identify generalized patterns of time-dependent behavior that are common to Hanford sediment/waste types.
This report has summarized the current scientific understanding of the geochemistry and reactive-transport behavior of U at the Hanford Site. The primary conclusions and high-level findings are summarized in the Executive Summary. Much is known about the geochemistry of U at Hanford, based on more than 40 years of research, but recorded observations have been difficult to rationalize in a common framework because of vagaries in waste composition and experimental methodologies, and the inherent complexity of U geochemistry. This report is intended as a first step in the integration and analysis of this complex data and information set. The report takes stock of the current understanding, and explores research needed to perform defensible, long-term predictions of U(VI) subsurface migration. The Hanford Site, and its scientific and engineering community, is well positioned to develop a predictive capability for U migration as needed for groundwater protection and remediation with additional focused-research investments. The report authors and sponsors seek comments and feedback from the broader science and Hanford community on the concept, content, and utility of a generalized-descriptive model for U, and the future research steps needed to make it a useful reality.


12.1
12.0 References
Allison JD, DS Brown, and KJ Novo-Gradac. 1998. MINTEQA2/PRODEFA2, A Geochemical Assessment Model for Environmental Systems: User Manual Supplement for Version 4.0. U.S. Environmental Protection Agency, Washington, D.C.
Anderson JD. 1990. A History of the 200 Area Tank Farms. WHC-MR-0132, Westinghouse Hanford Company, Richland, Washington.
Anderson RF, MQ Fleischer, and AP LeHuray. 1989a. “Concentration, Oxidation State, and Particulate Flux of Uranium in the Black Sea.” Geochimica et Cosmochimica Acta 53(9):2215-2224.
Anderson RF, AP LeHuray, M Fleischer, and JW Murray. 1989b. “Uranium Deposition in Saanich Inlet Sediments, Vancouver Island.” Geochimica et Cosmochimica Acta 53(9):2205-2213.
Anderson RT, HA Vrionis, I Ortiz-Bernad, CT Resch, PE Long, R.Dayvault, K Karp, S Marutzky, DR Metzler, A Peacock, DC White, M Lowe, and DR Lovley. 2003. “Stimulating the In Situ Activity of Geobacter Species to Remove Uranium from the Groundwater of a Uranium-Contaminated Aquifer.” Applied and Environmental Microbiology 69(10):5884-5891.
Arai Y, MA Marcus, N Tamura, JA Davis, and JM Zachara. 2007. “Spectroscopic Evidence for Uranium Bearing Precipitates in Vadose Zone Sediments at the Hanford 300-Area Site.” Environmental Science and Technology 41(13):4633-4639.
Arnold T, T Zorn, H Zanker, G Bernhard, and H Nitsche. 2001. “Sorption Behavior of U(VI) on Phyllite: Experiments and Modeling.” Journal of Contaminant Hydrology 47(2-4):219-231.
Baes CF and RE Mesmer. 1976. The Hydrolysis of Cations. Wiley, New York.
Bargar JR, R Reitmeyer, and JA Davis. 1999. “Spectroscopic Confirmation of Uranium(VI)-Carbonato Adsorption Complexes on Hematite.” Environmental Science and Technology 33(14):2481-2484.
Bargar JR, R Reitmeyer, JJ Lenhart, and JA Davis. 2000. “Characterization of U(VI)-carbonate Ternary Complexes on Hematite: EXAFS and Electrophoretic Mobility Measurements.” Geochimica et Cosmochimica Acta 64(16):2737-2749.
Barnett MO, PM Jardine, and SC Brooks. 2002. “U(VI) Adsorption to Heterogeneous Subsurface Media: Application of a Surface Complexation Model.” Environmental Science and Technology 36(16):937-942.
Benjamin MM. 2002. Water Chemistry. McGraw Hill, Boston.
Berkovits D, H Feldstein, S Ghelberg, A Hershkowitz, E Navon, and M Paul. 2000. “236U in Uranium Minerals and Standards.” Nuclear Instruments and Methods in Physics Research Section B: Beam Interactions with Materials and Atoms 172(1-4):372-376.

12.2
Bernhard G, G Geipel, T Reich, V Brendler, S Amayri, and H Nitsche. 2001. “Uranyl(VI) Carbonate Complex Formation. Validation of the Ca2UO2(CO3)2 (aq) Species.” Radiochimica Acta 89(8):511-518.
Bethke CM. 2005. Geochemist Workbench Release 6.0. University of Illinois, Urbana-Champaign.
Bethke CM and PV Brady. 2000. “How the Kd Approach Undermines Ground Water Cleanup.” Ground Water 38(3):435-443.
Bjornstad BN, KR Fecht, and AM Tallman. 1987. Quaternary Stratigraphy of the Pasco Basin Area South-Central Washington. RHO-BW-SA-563A, Rockwell Hanford Operations, Richland, Washington.
Bjornstad BN. 1990. Geohydrology of the 218-W-5 Burial Ground, 200-West Area, Hanford Site. PNL-7336, Pacific Northwest Laboratory, Richland, Washington.
Bradbury MH and FA Sarott. 1995. Sorption Databases for the Cementitious Near-Field of a L/ILW Repository for Performance Assessment. PSI-95-06. Paul Scherrer Institut, Villigen, Switzerland.
Brady PV and CM Bethke. 2000. “Beyond the Kd Approach.” Ground Water 38(3):321-322.
Brooks SC, JK Fredrickson, SL Carroll, DW Kennedy, JM Zachara, AE Plymale, SD Kelly, KM Kemner, and S Fendorf. 2003. “Inhibition of Bacterial U(VI) Reduction by Calcium.” Environmental Science and Technology 37(9):1850-1858.
Brown CF, R.J Serne, BN Bjornstad, DG Horton, DC Lanigan, RE Clayton, MM Valenta, TS Vickerman, IV Kutnyakov, KN Geiszler, SR Baum, KE Parker, and MJ Lindberg. 2006. Characterization of Vadose Zone Sediments Below the C Tank Farm: Borehole C4297 and RCRA Borehole 299-E27-22. PNNL-15503, Pacific Northwest National Laboratory, Richland, Washington.
Burns PC. 1999. “The Crystal Chemistry of Uranium.” Chapter 2 in Uranium: Mineralogy, Geochemistry and the Environment, eds. PC Burns and R Finch, Reviews in Mineralogy Vol. 38, Mineralogical Society of America, Washington, D.C.
Callen AC.1955. Fabrication of Enriched Uranium Aluminum Fuel Slugs & Thorium Target Slugs for U-233 Production. HW-38384-RD, General Electric Company, Richland, Washington.
Cantrell KJ, RJ Serne, and GV Last. 2002. Hanford Contaminant Distribution Coefficient Database and Users Guide. PNNL-13895, Pacific Northwest National Laboratory, Richland, Washington.
Cantrell KJ, RJ Serne, and GV Last. 2003a. Hanford Contaminant Distribution Coefficient Database and User’s Guide. PNNL-13895 Rev. 1, Pacific Northwest National Laboratory, Richland, Washington.
Cantrell KJ, RJ Serne, and GV Last. 2003b. Applicability of the Linear Sorption Isotherm Model to Represent Contaminant Transport Process in Side-Wide Performance Assessment. CP-17089 Revision 0, Fluor Hanford, Inc., Richland, Washington.
Catalano JG, JP Mckinley, JM Zachara, SM Heald, SC Smith, and GE Brown Jr. 2006. “Changes in Uranium Speciation through a Depth Sequence of Contaminated Hanford Sediments.” Environmental Science and Technology 40(8):2517-2524.

12.3
Catalano JG, SM Heald, JM Zachara, and GE Brown Jr. 2004. “Spectroscopic and Diffraction Study of Uranium Speciation in Contaminated Vadose Zone Sediments from the Hanford Site, Washington State.” Environmental Science and Technology 38(10):2822-2828.
Cherdyntsev VV 1971. Uranium-234. Israel Program for Scientific Translations, Jerusalem.
Chisholm-Brause CJ, SD Conradson, CT Buscher, PG Eller, and DE Morris. 1994. “Speciation of Uranyl Sorbed at Multiple Binding Sites on Montmorillonite.” Geochimica et Cosmochimica Acta 58(17):3625-3631.
Chisholm-Brause, CJ, JM Berg, RA Matzner, and DE Morris. 2001. “Uranium(VI) Sorption Complexes on Montmorillonite as a Function of Solution Chemistry.” Journal of Colloid and Interface Science 233(1):38-49.
Chisholm-Brause CJ, JM Berg, KM Little, RA Matzner, and DE Morris. 2004. “Uranyl Sorption by Smectites: Spectroscopic Assessment of Thermodynamic Modeling.” Journal of Colloid and Interface Science 277(2):366-382.
Christensen JN, PE Dresel, ME Conrad, K Maher, and DJ DePaolo. 2004. “Identifying the Sources of Subsurface Contamination at the Hanford Site in Washington Using High-Precision Uranium Isotopic Measurements.” Environmental Science and Technology 38(12):3330-3337.
Christensen JN, ME Conrad, DJ DePaolo, and PE Dresel. 2007. “Isotopic Studies of Contaminant Transport at the Hanford Site, WA.” Vadose Zone Journal (in press).
Corbin RA, BC Simpson, MJ Anderson, WF Danielson III, JG Field, TE Jones, and CT Kincaid. 2005. Hanford Soil Inventory Model Rev. 1. RPP-26744, Rev 0, CH2M HILL Hanford Group, Inc., Richland, Washington.
Cowan, GA and AE Norris. 1978. Investigations of the Natural Fission Reactor Program. Progress Report, October 1977--September 1978. LA-7536-PR, Los Alamos National Laboratory, Los Alamos, New Mexico.
Curtis GP, P Fox, M Kohler, and JA Davis. 2004. “Comparison of in-situ Uranium Kd Values with a Laboratory Determined Surface Complexation Model.” Applied Geochemistry 19(10):1643-1653.
Curtis GP, J Davis, and DL Naftz. 2006. “Simulation of Reactive Transport of Uranium(VI) in Groundwater with Variable Chemical Conditions.” Water Resources Research 42(4):Art. No.W04404.
Cussler EL. 1995,©1984. Diffusion: Mass Transfer in Fluid Systems. Cambridge University Press, Cambridge, England.
Davis JA. 2001. Surface Complexation Modeling or Uranium (VI) Adsorption on Natural Mineral Assemblages. NUREG/CR-6708. U.S. Nuclear Regulatory Commission, Washington, D.C.
Davis JA and DB Kent. 1990. “Surface Complexation Modeling in Aqueous Geochemistry.” Chapter 6 in Mineral-Water Interface Geochemistry, eds. MF Hochella, Jr. and AF White, Reviews in Mineralogy Vol. 23, Mineralogical Society of America, Washington, D.C.

12.4
Davis JA, JA Coston, DB Kent, and CC Fuller. 1998. “Application of the Surface Complexation Concept to Complex Mineral Assemblages.” Environmental Science and Technology 32(19):2820-2828.
Davis JA, DE Meece, M Kohler, and GP Curtis. 2004a. “Approaches to Surface Complexation Modeling of Uranium(VI) Adsorption on Aquifer Sediments.” Geochimica et Cosmochimica Acta 68(18):3621-3641.
Davis JA, SB Yabusaki, CI Steefel, JM Zachara, GP Curtis, GD Redden, LJ Criscenti, and BD Honeyman. 2004b. “Assessing Conceptual Models for Subsurface Reactive Transport of Inorganic Contaminants.” EOS 85(44):449.
Davis JA, M Ochs, M Olin, TE Payne, and CJ Tweed. 2005. NEA Sorption Project Phase II –Interpretation and Prediction of Radionuclide Sorption onto Substrates Relevant for Radioactive Waste Disposal Using Thermodynamic Sorption Models. NEA No. 5992, Nuclear Energy Agency, OECD Publishing, Paris.
Davis WD and JL Mewherter. 1962. “Abundance of U-236 in Nature.” Geochimica et Cosmochimica Acta 26:681-684.
Dickson FJ, KD Hawkins, and TJ White. 1989. “Calcium Uranium Titanate - A New Pyrochlore.” Journal of Solid State Chemistry 82 (1):146-150.
Dong W, WP Ball, C Liu, Z Wang, AT Stone, and JM Zachara. 2005. “Influence of Calcite and Dissolved Calcium on U(VI) Sorption to a Hanford Subsurface Sediment.” Environmental Science and Technology 39(20):7949-7955.
Dong W, SC Brooks. 2006. “Determination of the Formation Constants of Ternary Complexes of Uranyl and Carbonate with Alkaline Earth Metals (Mg2+, Ca2+, Sr2+, and Ba2+) Using Anion Exchange Method.” Environmental Science and Technology 40(15):4689-4695
Dresel PE, JC Evans, and OT Farmer. 2002. Investigation of Isotopic Signatures for Sources of Groundwater Contamination at the Hanford Site. PNNL-13763, Pacific Northwest National Laboratory, Richland, Washington.
Drever JI. 1997. The Geochemistry of Natural Waters. 3rd ed. Prentice-Hall Inc., Upper Saddle River, New Jersey.
Dzombak DA and FM Morel. 1990. Surface Complexation Modeling: Hydrous Ferric Oxide. John Wiley & Sons, New York.
Elzinga EJ, CD Tait, RJ.Reeder, KD Rector, RJ Donohoe, and DE Morris. 2004. “Spectroscopic Investigation of U(VI) Sorption at the Calcite-water Interface.” Geochimica et Cosmochimica Acta 68(11):2437-2448.
Field JG and TE Jones. 2006. Tank Farm Vadose Zone Contamination Volume Estimates. RPP-23405 Rev. 2, CH2M HILL Hanford Group, Inc., Richland, Washington.
12.5
Finch WI. 1996. Uranium Provinces of North America: Their Definition, Distribution, and Models, U.S. Geolological Survey Bulletin 2141, U.S. Government Printing Office, Washington, D.C.
Finch R and T Murakami. 1999. “Systematics and Paragenesis of Uranium Minerals.” Chapter 3 in Uranium: Mineralogy, Geochemistry and the Environment, eds. PC Burns and R Finch, Reviews in Mineralogy Vol. 38, Mineralogical Society of America, Washington, D.C.
Firestone RB and VS Shirley. 1996. Table of Isotopes. 8th ed. John Wiley & Sons, Inc., New York.
Fleischer RL. 1980. “Isotopic Disequilibrium of Uranium: Alpha-Recoil Damage and Preferential Solution Effects.” Science 207(4434):979-981.
Fox PA, JA Davis, and JM Zachara. 2006. “The Effect of Calcium on Aqueous Uranium(VI) Speciation and Adsorption to Ferrihydrite and Quartz.” Geochimica et Cosmochimica Acta 70(6):1379-1387.
Fredrickson JK, JM Zachara, DW Kennedy, RK Kukkadapu, JP McKinley, SM Heald, C Liu, and AE Plymale. 2004. “Reduction of TcO4
- by Sediment-associated Biogenic Fe(II).” Geochimica et Cosmochimica Acta 68(15):3171-3187.
Friday KK. 2004. Tri-Party Agreement Databases, Access Mechanism and Procedures. DOE/RL-93-69 Rev 4, U.S. Department of Energy, Richland, Washington.
Gaber HM, WP Inskeep, SD Comfort, and JM Wraith. 1995. “Non-equilibrium Transport of Atrazine through Large Intact Soil Cores.” Soil Science Society of America Journal 59(1):60-67.
Gascoyne M. 1992. “Geochemistry of the Actinides and Their Daughters.” Chapter 2 in Uranium-Series Disequilibrium: Applications to Earth, Marine, and Environmental Sciences, 2nd ed, eds. M Ivanovich and RS Harmon. Clarendon Press, Oxford, England.
Gerber MS. 1992. Past Practices Technical Characterization Study: 300 Area, Hanford Site. WHC-MR-0388. Westinghouse Hanford Company, Richland, Washington.
Ginder-Vogel M, CS Criddle, and S Fendorf. 2006. “Thermodynamic Constraints on the Oxidation of Biogenic UO2 by Fe(III) (Hydr)oxides. Environmental Science and Technology 40(11):3544-3550.
Grenthe I, H Wanner, and I Forest, eds. 1992. Chemical Thermodynamics of Uranium, Chemical Thermodynamics 1, North-Holland, Amsterdam.
Grenthe I, MCA Sandino, I Puigdomenech, and MH Rand. 1995. “Corrections to the Uranium NEA-TDB “Review. Appendix D in Chemical Thermodynamics of Americium, eds. RA Silva, G Bidoglio, M Rand, P Robouch, H Wanner, and I Puigdomenech., Chemical Thermodynamics 2, Elsevier, Amsterdam.
Guillaumont R and FJ Mompean, eds. 2003. Update on the Chemical Thermodynamics of Uranium, Neptunium, Plutonium, Americium and Technetium, Chemical Thermodynamics 5. Elsevier, Amsterdam.
Gydesen SP. 1954. Hanford Experience with Thorium. HW-31222, General Electric Company, Richland, Washington.
12.6
Haggerty R and SM Gorelick. 1995. “Multiple-rate Mass Transfer for Modeling Diffusion and Surface Reactions in Media with Pore-scale Heterogeneity.” Water Resources Research 31(10):2383-2400.
Haggerty R and SM Gorelick. 1998. “Modeling Mass Transfer Processes in Soil Columns with Pore-scale Heterogeneity.” Soil Science Society of America Journal 62(1):62-74.
Haggerty R, CF Harvey, CF von Schwerin, and LC Meigs. 2004. “What Controls the Apparent Timescale of Solute Mass Transfer in Aquifers and Soils? A Comparison of Experimental Results.” Water Resources Research 40(1): Art. No.W01510, doi:10.1029/2002WR001716.
Harker AB 1988. “Tailored Ceramics.” Chapter 5 in Radioactive Waste Forms for the Future, eds. W Lutze and RC Ewing, North Holland, Amsterdam.
Harley N, E Foulkes, LH Hilborne, A Hudson, and CR Anthony. 1999. Depleted Uranium, A Review of the Scientific Literature as It Pertains to Gulf War Illnesses Vol. 7, Rand, Santa Monica, California.
Hart SR and A Zindler. 1989. “Isotope Fractionation Laws - a Test Using Calcium.” International Journal of Mass Spectrometry and Ion Processes 89(2-3):287-301.
Hartman MJ and PE Dresel, eds. 1997. Hanford Site Groundwater Monitoring for Fiscal Year 1996. PNNL-11470, Pacific Northwest National Laboratory, Richland, Washington.
Hartman MJ, LF Morasch, and WD Webber, eds. 2005. Hanford Site Groundwater Monitoring for Fiscal Year 2004. PNNL-15070, Pacific Northwest National Laboratory, Richland, Washington.
Hartman MJ, LF Morasch, and WD Webber, eds. 2006. Hanford Site Groundwater Monitoring for Fiscal Year 2005. PNNL-15670, Pacific Northwest National Laboratory, Richland, Washington.
Hartman MJ, LF Morasch, and WD Webber, eds. 2007. Hanford Site Groundwater Monitoring Summary for Fiscal Year2006. PNNL-16346, Pacific Northwest National Laboratory, Richland Washington.
Heald SM, DL Brewe, EA Stern, KH Kim, FC Brown, DT Jiang, ED Crozier, and RA Gordon. 1999. “XAFS and Micro-XAFS at the PNC-CAT Beamlines.” Journal of Synchrotron Radiation 6(3):347-349.
Heaney PJ, EP Vicenzi, LA Giannuzzi, and KJT Livi. 2001. “Focused Ion Beam Milling: A Method of Site-specific Sample Extraction for Microanalysis of Earth Materials.” American Mineralogist 86(9):1094-1099.
Heeb CM, FW Knight, and HG Spencer. 1963. Irradiation and Performance of Depleted Uranium. HW-77688, General Electric Company, Richland, Washington.
Herbelin AL and JC Westall. 1999. FITEQL: A Computer Program for the Determination of ChemicalEequilibrium Constants from Experimental Data. Version 4.0. Department of Chemistry, Oregon State University, Corvallis, Oregon.
Hidaka H and P Holliger. 1998. “Geochemical and Neutronic Characteristics of the Natural Fossil Fission Reactors at Oklo and Bangombe, Gabon.” Geochimica et Cosmochimica Acta 62(1):89-108.
12.7
Higley BA, DE Place, RA Corbin, and BC Simpson. 2004. Hanford Defined Waste Model, Rev. 5.0. RPP-19822, Rev. 0, prepared by CH2M HILL Hanford Group, Inc., for the U.S. Department of Energy, Richland, Washington.
Hooper PR.. 1982. “The Columbia River Basalts.” Science 215(4539):1463-1468.
Horton DG, HT Schaef, RJ Serne, CF Brown, MM Valenta, TS Vickerman, IV Kutnyakov, SR Baum, KN Geiszler, and KE Parker. 2003. Geochemistry of Samples from Borehole C3177 (299-E24-21). PNNL-14289, Pacific Northwest National Laboratory, Richland, Washington.
Hsi C-KD and D Langmuir. 1985. Adsorption of Uranyl onto Ferric Oxyhydroxides: Application of the Surface Complexation Site-binding Model.” Geochimica et Cosmochimica Acta 49(9):1931-1941.
Hu Q and ML Brusseau. 1996. “Transport of Rate-limited Sorbing Solutes in an Aggregated Porous Medium: A Multiprocess Non-ideality Approach.” Journal of Contaminant. Hydrology 24(1):53-73.
Hudson EA, JJ Rehr, and JJ Bucher. 1995. “Multiple-Scattering Calculations of the Uranium L3-Edge X-Ray-Absorption Near-Edge Structure. Physical Review B 52(19):13815-3826.
Ilton ES, C Liu, W Yantansee, Z Wang, DA Moore, AR Felmy, and JM Zachara. 2006. “The Dissolution of Synthetic Na-boltwoodite in Sodium Carbonate Solutions.” Geochimica et Cosmochimica Acta 70(19):4836-4849.
Ilton, ES, NP Qafoku, C Liu, DA Moore, and JM Zachara. 2007. “Advective Removal of Intraparticle Uranium from Contaminated Vadose Zone Sediments, Hanford, USA.” Environmental Science and Technology (in press).
Jang JH, BA Dempsey, and WD Burgos. 2007. “A Model-based Evaluation of Sorptive Reactivities of Hydrous Ferric Oxide and Hematite for U(VI).” Environmental Science and Technology 41(12):4305-4310.
Jaquish RE. 1989. Uranium-236 as an Indicator of Fuel-Cycle Uranium in Ground Water. Presented at the Thirty-fifth Annual Conference on Bioassay, Analytical and Environmental Radiochemistry, October 30-November 2, 1989, Charleston, North Carolina. PNL-SA-17410, Pacific Northwest Laboratory, Richland, Washington.
Jenne EA. 1998.” Adsorption of Metals by Geomedia: Data Analysis, Modeling, Controlling Factors, and Related Issues.” Chapter 1 in Adsorption of Metals by Geomedia: Variables, Mechanisms, and Model Applications, ed. EA Jenne, Academic Press, San Diego, California.
Jones TE, BC Simpson, MI Wood, and RA Corbin. 2000. Preliminary Inventory Estimates for Single-Shell Tank Leaks in T, TX, and TY Tank Farms. RPP-7218, Rev 0, CH2M HILL Hanford Group, Inc., Richland, Washington.
Jones TE, BC Simpson, MI Wood, and RA Corbin. 2001. Preliminary Inventory Estimates for Single-Shell Tank Leaks in B, BX, and BY Tank Farms. RPP-7389, Rev 0, Prepared by CH2M HILL Hanford Group, Inc. for the U.S. Department of Energy, Richland, Washington.
12.8
Kalmykov N and GR Choppin. 2000. “Mixed Ca2+/UO22+/CO3
2- Complex Formation at Different Ionic Strengths.” Radiochimica Acta 88(9-11):603-606.
Kaplan DI and RJ Serne. 2000. Geochemical Data Package for the Hanford Immobilized Low-Activity Tank Waste Performance Assessment (ILAW PA). PNNL-13037, Rev. 1. Pacific Northwest National Laboratory, Richland, Washington.
Kaplan DI, TL Gervais, and KM Krupka. 1998. “Uranium(VI) Sorption to Sediments under High pH and Ionic Strength Conditions.” Radiochimica Acta 80(4):201-211.
Kelly SD, MG Newville, L Cheng, KM Kemner, SR Sutton, P Fenter, NC Sturchio, and C Spotl. 2003. “Uranyl Incorporation in Natural Calcite.” Environmental Science and Technology 37(7):1284-1287.
Kennedy I. 1979. “Some Interesting Radioactive Minerals from the Bancroft Area, Ontario.” Mineralogical Record 10(3):153-158.
Kigoshi K. 1971. “Alpha-Recoil Thorium-234 - Dissolution into Water and Uranium-234/Uranium-238 Disequilibrium in Nature.” Science 173(3991):47-48.
Kincaid CT, PW Eslinger, WE Nichols, AL Bunn, RW Bryce, TB Miley, MC Richmond, SF Snyder, and RL Aaberg. 2000. Groundwater/Vadose Zone Integration Project, System Assessment Capability (Revision 0), Assessment Description, Requirements, Software Design, and Test Plan. BHI-01365 Draft A, Bechtel Hanford, Inc., Richland, Washington.
Knepp AJ. 2002. Field Investigation Report for Waste Management Area B-BX-BY. RPP-14 10098, Rev. 0, prepared by Jacobs Engineering Group, Inc. for CH2M HILL Hanford Group, Inc., Richland, Washington.
Kohler M, GP Curtis, DB Kent, and JA Davis. 1996. “Experimental Investigation and Modeling of Uranium(VI) Transport under Variable Chemical Conditions.” Water Resources Research 32(12):3539-3551.
Kohler M, GP Curtis, DE Meece, and JA Davis. 2004. “Methods for Estimating Adsorbed Uranium(VI) and Distribution Coefficients of Contaminated Sediments.” Environmental Science and Technology 38(1):240-247.
Kowal-Fouchard A, R Drot, E Simoni, and JJ Ehrhardt. 2004. “Use of Spectroscopic Techniques for Uranium(VI)/Montmorillonite Interaction Modeling.” Environmental Science and Technology 38(5):1399-1407.
Krupka KM, RJ Serne, and DI Kaplan. 2004. Geochemical Data Package for the 2005 Hanford Integrated Disposal Facility Performance Assessment. PNNL-13037, Rev. 2. Pacific Northwest National Laboratory, Richland, Washington.
Lang LW. 1963. Use of Depleted Uranium for Higher Isotope Pu. HW-77578, General Electric Company, Richland, Washington.
12.9
Langmuir D. 1978. “Uranium Solution-mineral Equilibria at Low Temperatures with Applications to Sedimentary Ore Deposits.” Geochimica et Cosmochimica Acta 42(6):547-569.
Langmuir D. 1997. Aqueous Environmental Geochemistry. Prentice-Hall, Upper Saddle River, New Jersey.
Last GV, EJ Freeman, KJ Cantrell, MJ Fayer, GW Gee, WE Nichols, BN Bjornstad, DG.Horton. 2006. Vadose Zone Hydrology Data Package for Hanford Assessments. PNNL-14702, Rev. 1, Pacific Northwest Laboratory, Richland, Washington.
Lehfeldt DC. 1957. Segregation of Enriched Uranium Waste. HW-52412, General Electric Company, Richland, Washington.
Lenhart JJ, SE Cabaniss, P MacCarthy, and BD Honeyman. 2000. “Uranium(VI) Complexation with Citric, Humic, and Fulvic Acids.” Radiochimica Acta 88(6):345-353.
Lerch JA 1998. 618-4 Burial Ground Excavation Report. BHI-01200 Rev 1. Bechtel Hanford Inc, Richland, Washington.
Liu C, JM Zachara, SC Smith, JP McKinley, and CC Ainsworth. 2003. “Desorption Kinetics of Radiocesium from Subsurface Sediments at Hanford Site, USA.” Geochimica et Cosmochimica Acta 67(16):2893-2912.
Liu C, JM Zachara, and SC Smith. 2004a. “A Cation Exchange Model to Describe Cs+ Sorption at High Ionic Strength in Subsurface Sediments at Hanford Site, USA.” Journal of Contaminant Hydrology 68(3-4):217-238
Liu C, JM Zachara, O Qafoku, JP McKinley, SM Heald, and Z Wang. 2004b. “Dissolution of Uranyl Microprecipitates from Subsurface Sediments at Hanford Site, USA.” Geochimica et Cosmochiica. Acta 68(22):4519-4537.
Liu C, JM Zachara, W Yantansee, PD Majors, and JP McKinley. 2006. “Microscopic Reactive Diffusion of Uranium in the Contaminated Sediments at Hanford, United States.” Water Resources Research 42(12): Art. No. W12420, doi:10.1029/2006WR005031.
Logue BA, RW Smith, and JC Westall. 2004. “U(VI) Adsorption on Natural Iron-coated Sands: Comparison of Approaches for Modeling Adsorption on Heterogeneous Environmental Materials.” Applied Geochemistry 19(12):1937-1951.
Lomness JK, BW Kempshall, LA Giannuzzi, and MB Watson. 2001. “TEM of Sub-Micrometer Particles Using the FIB Lift-Out Technique.” In Proceedings Microscopy and Microanalysis 2001, ed. GW Bailey, pp. 950-951. August 5-9, 2001, Long Beach, California. Springer, New York.
Lumpkin GR and RC Ewing. 1995. “Geochemical Alteration of Pyrochlore Group Minerals: Pyrochlore Subgroup.” American Mineralogist 80(7-8):732-743.
Lumpkin GR and RC Ewing. 1996. “Geochemical Alteration of Pyrochlore Group Minerals: Betafite Subgroup.” American Mineralogist 81(9-10):1237-1248.

12.10
Luo S, T-L Ku, R Roback, M Murrell, and T McLing. 2000. “In-situ Radionuclide Transport and Preferential Groundwater Flows at INEEL (Idaho): Decay-series Disequilibrium Studies.” Geochimica et Cosmochimica Acta 64(5):867-881.
Mackay DM and JA Cherry. 1989. “Groundwater Contamination: Pump-and-Treat Remediation.” Environmental Science and Technology 23(6):630-636.
Maher K, DJ DePaolo, ME Conrad, and RJ Serne. 2003. “Vadose Zone Infiltration Rate at Hanford, Washington, Inferred from Sr Isotope Measurements.” Water Resources Research 39(8): Art. No. 1204.
Maher K, DJ DePaolo, and JN Christensen. 2006. “U-Sr Isotopic Speedometer: Fluid Flow and Chemical Weathering Rates in Aquifers.” Geochimica et Cosmochimica Acta 70(17):4417-4435.
Manceau A, L Charlet, MC Boisset, B Didier, and L Spadini. 1992. “Sorption and Speciation of Heavy Metals on Hydrous Fe and Mn oxides: From Microscopic to Macroscopic.” Applied Clay Sci. 7(1-3):201-223.
Mann FM, RJ Puigh, SH Finfrock, EJ Freeman, R Khaleel, DH Bacon, MP Bergeron, BP McGrail, SK Wurstner, K Burgard, WR Root, and PE LaMont. 2001. Hanford Immobilized Low-Activity Tank Waste Performance Assessment: 2001 Version. DOE/ORP-2000-24. U.S. Department of Energy, Office of River Protection, Richland, Washington.
Mann FM, RJ Puigh, SH Finfrock, R Khaleel, and MI Wood. 2003a. Integrated Disposal Facility Risk Assessment. RPP-15834, Rev. 0. CH2M HILL Hanford Group, Inc., Richland, Washington.
Mann FM, BP McGrail, DH Bacon, RJ Serne, KM Krupka, RJ Puigh, R Khleel, and SH Finfrock. 2003b. Risk Assessment Supporting the Decision on the Initial Selection of Supplemental ILWA Technologies. RPP-17675, Rev. 0. CH2M HILL Hanford Group, Inc., Richland, Washington.
Martell AE. 1971. “Principles of Complex Formation.” pp. 239-263 in Organic Compounds in Aquatic Environments, eds. S. Faust and JV Hunter, Marcel Dekker, New York.
Martell AE and RM Smith. 1977. Critical Stability Constants Vol. 3: Other Organic Ligands. Plenum Press, New York.
Mason, CFV, WRJR Turney, BM Thomson, N Lu, PA Longmire, and CJ Chisholm-Brause. 1997. “Carbonate Leaching of Uranium from Contaminated Soils.” Environmental Science and Technology 31(10):2707-2711.
McCain R, P Henwood, and C Koizumi. 2006. Detection and Quantification of Natural and Anthropogenic Uranium by High-Resolution Spectral Gamma Logging. HGLP-LDR-028, SM Stoller, Richland, Washington.
McKinley JP, JM Zachara, SC Smith, and GD Turner. 1995. “The Influence of Uranyl Hydrolysis and Multiple Site-binding Reactions on Adsorption of U(VI) to Montmorillonite.” Clays and Clay Minerals 43(5):586-598.

12.11
McKinley JP, TO Stevens, JK Fredrickson, JM, Zachara, FS Colwell, KB Wagnon, SC Smith, SA Rawson, and B Bjornstad. 1997. “Biogeochemistry of Anaerobic Lacustrine and Paleosol Sediments within an Aerobic Unconfined Aquifer.” Geomicrobiology Journal 14(1):23-39.
McKinley JP, JM Zachara, SM Heald, A Dohnalkova, M Newville, and SR Sutton. 2004. “Microscale Distribution of Cesium Sorbed to Biotite and Muscovite.” Environmental Science and Technology 38(4):1017-1023.
McKinley JP, JM Zachara, C Liu, and SM Heald, BI Prenitzer, and BW Kwmpshall. 2006. “Microscale Controls on the Fate of Contaminant Uranium in the Vadose Zone, Hanford Site, Washington.” Geochimica et Cosmochimica Acta 70(8):1873-1887.
McKinley JP, JM Zachara, SC Smith, and C Liu. 2007. “Cation Exchange Reactions Controlling Desorption of 90Sr2+ from Coarse-grained Contaminated Sediments at the Hanford Site, Washington.” Geochimica et Cosmochimica Acta 71(2):305-325.
Missana T, M Garcia-Gutierrez, and C Maffiotte. 2003. “Experimental and Modeling Study of the Uranium (VI) Sorption on Goethite.” Journal of Colloid and Interface Science 260(3):291-301.
Myers DA. 2005. Field Investigation Report for Waste Management Areas T and TX-TY. RPP—16 23752 Rev. 0-A, CH2M HILL Hanford Group, Inc., Richland, Washington.
Nuclear Energy Agency and International Atomic Energy Agency (NEA). 1999. Environmental Activities in Uranium Mining and Milling. OECD, Paris.
O'Loughlin EJ, SD Kelly, RE Cook, R Csencsits, and KM Kemner. 2003. “Reduction of Uranium(VI) by Mixed Iron(II)/Iron(III) Hydroxide (Green Rust): Formation of UO2 Nanoparticles.” Environmental Science and Technology 37(4):721-727.
Osmond JK and JB Cowart. 1976. “The Theory and Uses of Natural Uranium Isotopic Variations in Hydrology.” Atomic Energy Review 14(4):621-679.
Osmond JK and JB Cowart. 1992. “Ground Water.” Chapter 9 in Uranium-Series Disequilibrium: Applications to Earth, Marine, and Environmental Sciences, 2nd ed, eds. M Ivanovich and RS Harmon, Clarendon Press, Oxford, England.
Pabalan RT and DR Turner. 1997. “Uranium(VI) Sorption on Montmorillonite: Experimental and Surface Complexation Modeling Study.” Aquatic Geochemistry 2(3):203-226.
Pabalan RT, DR Turner, FP Bertetti, and JD Prikryl. 1998. “Uranium(VI) Sorption onto Selected Mineral Surfaces: Key Geochemical Parameters.” Chapter 3 in Adsorption of Metals by Geomedia: Variables, Mechanisms, and Model Applications, ed. EA Jenne, Academic Press, San Diego, California.
Payne, TE, GR Lumpkin, and TD.Waite. 1998. “Uranium (VI) Adsorption on Model Minerals: Controlling Factors and Surface Complexation Modeling.” Chapter 2 in Adsorption of Metals by Geomedia: Variables, Mechanisms, and Model Applications, ed. EA Jenne, Academic Press, San Diego, California.
12.12
Payne TE, JA Davis, GR Lumpkin, R Chisari, and TD Waite. 2004. “Surface Complexation Model of Uranyl Sorption on Georgia Kaolinite.” Applied Clay Science 26(1-4):151-162.
Peterson RE, EJ Freeman, CJ Murray, PD Thorne, MJ Truex, VR Vermuel, MD Williams, SB Yabusaki, JM Zachara, JL Lindberg, and JP MacDonald. 2005. Contaminants of Potential Concern in 300-FF-5 Operable Unit: Expanded Annual Groundwater Report of Fiscal Year 2004. PNNL-15127, Pacific Northwest National Laboratory, Richland, Washington.
Poston TM.. 1990. A Survey for Elevated Levels of Uranium North of the 300 Area on the Hanford Site. PNL-7271, Pacific Northwest Laboratory, Richland, Washington.
Prenitzer BI, LA Giannuzzi, K Newman, SR Brown, RB Irwin, TL Shofner, and FA Stevie. 1998. “Transmission Electron Microscope Specimen Preparation of Zn Powders Using the Focused Ion Beam Lift-out Technique.” Metallurgical and Materials Transactions A 29(9):2399-2406.
Prikryl JD, A Jain, DR Turner, and RT Pabalan. 2001. “Uranium(VI) Sorption Behavior on Silicate Mineral Mixtures.” Journal of Contaminant Hydrology 47(2-4):241-253.
Qafoku NP, JM Zachara, C Liu, PL Gassman, O Qafoku, and SC Smith. 2005. “Kinetic Desorption and Sorption of U(VI) during Reactive Transport in a Contaminated Hanford Sediment.” Environmental Science and Technology 39(9):3157-3165.
Reeder RJ, M Nugent, CD Tait, DE Morris, SM Heald, KM Beck, WP Hess, and A Lanzirotti. 2001. “Coprecipitation of Uranium(VI) with Calcite: XAFS, Micro-XAS and Luminescence Characterization.” Geochimica et Cosmochimica Acta 65(20):3491-3503.
Reeder RJ, M Nugent, GM Lamble, CD Tait, and DE Morris. 2000. “Uranyl Incorporation into Calcite and Aragonite: XAFS and Luminescence Studies.” Environmental Science and Technology 34(4):638-644.
Reidel SP, NP Campbell, KR Fecht, and KA Lindsey. 1994. Late Cenozoic Structure and Stratigraphy of South-Central Washington. WHC-SA-1764, Westinghouse Hanford Company, Richland, Washington.
Riley RG and JM Zachara. 1992. Chemical Contaminants on DOE Lands and Selection of Contaminant Mixtures for Subsurface Science Research. DOE/ER-0547T, U.S. Department of Energy, Washington, D.C.
Roblyer SP. 1994. Plutonium and Tritium Produced in the Hanford Site Production Reactors. WHC-SD-CP-RPT-014, Westinghouse Hanford Company, Richland, Washington.
Salvage KM and GT Yeh. 1998. “Development and Application of a Numerical Model of Kinetic and Equilibrium Microbiological and Geochemical Reactions. (BIOKEMOD).” Journal of Hydrology 209(1-4):27-52.
Serne RJ and MI Wood. 1990. Hanford Waste-Form Release and Sediment Interaction: A Status Report with Rationale and Recommendations for Additional Studies. PNL-7297, Pacific Northwest Laboratory, Richland, Washington.
12.13
Serne RJ, RC Arthur, and KM Krupka. 1990. Review of Geochemical Processes and Codes for Assessment of Radionuclide Migration Potential at Commercial LLW Sites. NUREG/CR-5548, U.S. Nuclear Regulatory Commission, Washington, D.C.
Serne RJ, AR Felmy, KJ Cantrell, KM Krupka, JA Campbell, H Bolton, and JK Fredrickson. 1995. Characterization of Radionuclide-Chelating Agent Complexes Found in Low-Level Radioactive Decontamination Waste: Literature Review. NUREG/CR-6124, U.S. Nuclear Regulatory Commission, Washington, D.C.
Serne RJ, GV Last, GW Gee, HT Schaef, DC Lanigan, CW Lindenmeier, JW Lindberg, RE Clayton, VL LeGore, RD Orr, IV Kutnyakov, SR Baum, KN Geiszler, CF Brown, MM Valenta, and TS Vickerman. 2002a. Characterization of Vadose Zone Sediment: Borehole 299-E33-45 Near BX-102 in the B-BX-BY Waste Management Area. PNNL-14083, Pacific Northwest National Laboratory, Richland, Washington.
Serne RJ, BN Bjornstad, GW Gee, HT Schaef, DC Lanigan, RG McCain, CW Lindenmeier, RD Orr, VL LeGore, RE Clayton, MJ Lindberg, IV Kutnyakov, SR Baum, KN Geiszler, MM Valenta, TS Vickerman, and LJ Royack. 2002d. Characterization of Vadose Zone Sediment: Borehole 299-E33-46 near Tank B-110 in the B-BX-BY Waste Management Area. PNNL-14119, Pacific Northwest National Laboratory, Richland, Washington.
Serne RJ, CF Brown, HT Schaef, EM Pierce, MJ Lindberg, Z Wang, PL Gassman, and JG Catalano. 2002b. 300 Area Uranium Leach and Adsorption Project. PNNL-14022, Pacific Northwest National Laboratory, Richland, Washington.
Serne RJ, KJ Cantrell, CW Lindenmeier, AT Owen, IV Kutnyakov, RD Orr, and AR Felmy. 2002c. Radionuclide-Chelating Agent Complexes in Low-Level Radioactive Decontamination Waste; Stability, Adsorption and Transport Potential. NUREG/CR-6758, U. S. Nuclear Regulatory Commission, Washington, D.C.
Serne RJ, BN Bjornstad, DG Horton, DC Lanigan, CW Lindenmeier, MJ Lindberg, RE Clayton, VL LeGore, RD Orr, IV Kutnyakov, SR Baum, KN Geiszler, MM Valenta, and TS Vickerman. 2004a. Characterization of Vadose Zone Sediments Below the TX Tank Farm: Boreholes C3830, C3831, C3832, and RCRA Borehole 299-W10-27. PNNL-14594, Pacific Northwest National Laboratory, Richland, Washington.
Serne RJ, BN Bjornstad, DG Horton, DC Lanigan, HT Schaef, CW Lindenmeier, MJ Lindberg, RE Clayton, VL LeGore, KN Geiszler, SR Baum, MM Valenta, IV Kutnyakov, TS Vickerman, RD Orr, and CF Brown. 2004b. Characterization of Vadose Zone Sediments below the T Tank Farm: Boreholes C4104, C4105, 299-W10-196 and RCRA Borehole 299-W11-39. PNNL-14849, Pacific Northwest National Laboratory, Richland, Washington.
Serne RJ, MJ Lindberg, TE Jones, HT Schaef, and KM Krupka. 2007. Laboratory-Scale Bismuth Phosphate Extraction Process Simulation to Track Fate of Fission Products. PNNL-14120, Pacific Northwest National Laboratory, Richland Washington.
Seyfried, MS and PSC Rao. 1987. “Solute Transport in Undisturbed Columns of an Aggregated Tropical Soil: Preferential Flow Effects.” Soil Science Society of America Journal 51(6):1434-1444.

12.14
Silva RJ, G Bidoglio, MH Rand, PB Robouch, H Wanner, and I Puigdomenech. 1995. Chemical Thermodynamics of Americium, Chemical Thermodynamics 2, Elsevier, Amsterdam.
Smith RM and AE Martell. 1982. Critical Stability Constants, Volume 4, Inorganic Complexes. Plenum Press, New York.
Smith RM, AE Martell, and RJ Motekaitis. 2004. NIST Critically Selected Stability Constants of Metals Complexes Database. Version 8.0. U.S. Department of Commerce, National institute of Standards and Technology, Gaithersburg, Maryland.
Sposito G. 1981. The Thermodynamics of Soil Solutions. Oxford University Press, New York.
Sposito G. 1984. The Surface Chemistry of Soils. Oxford University Press, New York.
Steefel, CI and KTB MacQuarrie. 1996. “Approaches to Modeling of Reactive Transport in Porous Media.” Chapter 2 in Reactive Transport in Porous Media, eds. PC Lichtner, CI Steefel, and EH Oelkers, Reviews in Mineralogy Vol 34. Mineralogical Society of America, Washington, D.C. Steefel, CI and P Van Cappellen. 1998. “Preface: Reactive Transport Modeling of Natural Systems.” Journal of Hydrology 209(1-4):1-7.
Steefel CI, S Carroll, P Zhao, and S Roberts. 2003. “Cesium Migration in Hanford Sediment: A Multisite Cation Exchange Model Based on Laboratory Transport Experiments.” Journal of Contaminant Hydrology 67(1-4):219-246.
Steefel CI, DJ DePaolo, and PC Lichtner. 2005. “Reactive Transport Modeling: An Essential Tool and a New Research Approach for the Earth Sciences.” Earth and Planetary Science Letters 240(3-4):539-558.
Stumm W, L Sigg, and B Sulzberger. 1992. Chemistry of the Solid-Water Interface. Wiley, New York.
Stumm W and JJ Morgan. 1996. Aquatic Chemistry. 3rd ed. Wiley, New York.
Sturges DG. 1953a. Enriched Uranium from Hanford Enrichment Programs. HAN-49706, U.S. Atomic Energy Commission, Richland, Washington.
Sturges DG. 1953b. Shipments of Irradiated Enriched Uranium from Hanford to ARCO. HAN-53121, U.S. Atomic Energy Commission, Richland, Washington.
Sturges DG. 1954. Enriched Alloy Slug Cores – “C” Slug Specifications.” HW-33013, General Electric Company, Richland, Washington.
Syed HS. 1998. “Extrapolation Studies on Adsorption of Thorium and Uranium at Different Solution Compositions on Soil Sediments.” Journal of Radioanalytical and Nuclear Chemistry 237(1-2):125-128.
Sylwester ER, EA Hudson, and PG Allen. 2000. “The Structure of Uranium (VI) Sorption Complexes on Silica, Alumina, and Montmorillonite.” Geochimica et Cosmochimica Acta 64(14):2431-2438.

12.15
Turner DR and RT Pabalan. 1999. “Abstraction of Mechanistic Sorption Model Results for Performance Assessment Calculations at Yucca Mountain, Nevada.” Waste Management 19(6):375-388.
Turner GD, JM Zachara, JP McKinley, and SC Smith. 1996. “Surface-charge Properties and UO22+
Adsorption of a Subsurface Smectite.” Geochimica et Cosmochimica Acta 60(18):3399-3414.
Um W and RJ Serne. 2006. Characterization of 200-UP-1 and 200-ZP-1 Operable Unit Aquifer Sediments and Batch Adsorption Distribution Coefficients for Contaminants of Concern - Fiscal Year 2006 Progress. PNNL-16102, Pacific Northwest National Laboratory, Richland, Washington.
Um W, RJ Serne, and KM Krupka. 2004. “Linearity and Reversibility of Iodide Adsorption on Sediments from Hanford, Washington under Water Saturated Conditions.” Water Research 38(8):2009-2016.
Um W, RJ Serne, BN Bjornstad, HT Schaef, CF Brown, VL LeGore, KN Geiszler, SR Baum, MM Valenta, IV Kutnyakov, TS Vickerman, and MJ Lindberg. 2005. Characterization of 200-UP-1 Aaquifer Sediments and Results of Sorption-Desorption Tests Using Spiked Uncontaminated Groundwater. PNNL-15502, Pacific Northwest National Laboratory, Richland, Washington.
Um W, RJ Serne, and KM Krupka. 2007a. “Surface Complexation Modeling of U(VI) Sorption to Hanford Sediment with Varying Geochemical Conditions.” Environmental Science and Technology 41(10):3587-3592.
Um W, RJ Serne, CF Brown, and GV Last.. 2007b. “U(VI) Adsorption on Aquifer Sediments at the Hanford Site.” Journal of Contaminant Hydrology 93(1-4):255-269.
U.S. Department of Energy, Richland Operations Office (DOE/RL). 1994. Phase I Remedial Investigation Report for the 300-FF-5 Operable Unit. DOE/RL-93-21, Rev. 0, U.S. Department of Energy, Richland Operations Office, Richland, Washington.
U.S. Department of Energy, Richland Operations Office (DOE/RL). 1996a. Plutonium: The First 50 Years. DOE/RL-0137, U.S. Department of Energy, Richland Operations Office, Richland, Washington.
U.S. Department of Energy, Richland Operations Office (DOE/RL). 1996b. Hanford Site Background: Part 2, Soil Background for Radionuclides. DOE/RL-96-12, Rev. 0, U.S. Department of Energy, Richland Operations Office, Richland, Washington.
U.S. Department of Energy, Richland Operations Office (DOE/RL). 1997a. Hanford Site Background: Part 3, Groundwater Background. DOE/RL-96-61, Rev. 0, U.S. Department of Energy, Richland Operations Office, Richland, Washington.
U.S. Department of Energy, Richland Operations Office (DOE/RL). 2000. Review of Generation and Flow of Recycled Uranium at Hanford. DOE/RL-2000-43, U.S. Department of Energy, Richland Operations Office, Richland, Washington.
U.S. Department of Energy, Office of River Protection (DOE/ORP). 2006. Initial Single-Shell Tank System Performance Assessment for the Hanford Site. DOE/ORP-2005-01, Rev. 0, U.S. Department of Energy, Office of River Protection, Richland, Washington.
12.16
U.S. Environmental Protection Agency (EPA). 1999. Understanding Variation in Partition Coefficient, Kd, Values: Volume II. Review of Geochemistry and Available Kd Values for Cadmium, Cesium, Chromium, Lead, Plutonium, Radon, Strontium, Thorium, Tritium (3H), and Uranium. EPA 402-R-99-004B, U.S. Environmental Protection Agency, Washington, D.C.
Valocchi AJ. 1984. “Validity of the Local Equilibrium Assumption for Modeling Sorbing Solute Transport through Homogeneous Soils.” Water Resources Research 21(6):808-820.
Villalobos M, MATrotz, and JO Leckie. 2001. “Surface Complexation Modeling of Carbonate Effects on the Adsorption of Cr(VI), Pb(II), and U(VI) on Goethite.” Environmental Science and Technology 35(19):3849-3856.
Waite TD, JA Davis, BR Fenton, and TE Payne. 2000. “Approaches to Modeling Uranium(VI) Adsorption on Natural Mineral Assemblages.” Radiochimica Acta 88(9-11):687-693.
Waite TD, JA Davis, TE Payne, GA Waychunas, and N Xu. 1994. “Uranium(VI) Adsorption to Ferrihydrite: Application of a Surface Complexation Model.” Geochimica et Cosmochimica Acta 58(24):5465-5478.
Waite TD, TE Payne, and JA Davis 1992. Uranium Sorption. Her Majesty’s Inspectorate of Pollution, Great Britain.
Wang F, J Chen, and W Forsling. 1997. “Modeling Sorption of Trace metals on Natural Sediments by Surface Complexation Model.” Environmental Science and Technology 31(2):448-453.
Wang Z, JM Zachara, PL Gassman, C Liu, O Qafoku, W Yantasee, and JG Catalano. 2005a. “Fluorescence Spectroscopy of U(VI)-silicates and U(VI)-contaminanted Hanford Sediment.” Geochimica et Cosmochimica Acta 69(6):1391-1403.
Wang Z, JM Zachara, JP Mckinley, and SC Smith. 2005b. “Cryogenic Laser Induced U(VI) Fluorescence Studies of a U(VI) Substituted Natural Calcite: Implications to U(VI) Speciation in Contaminated Hanford Sediments.” Environmental Science Technology 39(8):2651-2659.
Wang Z, JM Zachara, W Yantasee, PL Gassman, C Liu, and AG Joly. 2004. “Cryogenic Laser Induced Characterization of U(VI) in Hanford Vadose Zone Pore Waters.” Environmental Science and Technology 38(21):5591-5597.
Watrous RA and DW Wootan. 1997. Activity of Fuel Batches Processed through Hanford Separations Plants, 1944 through 1989. HNF-SD-WM-TI-794 Rev. 0, U.S. Department of Energy, Richland, Washington.
Wazne M, G Korfiatis, and X Meng. 2003. “Carbonate Effects on Hexavalent Uranium Adsorption by Iron Oxyhydroxide.” Environmental Science and Technology 37(16):3619-3624.
Wellman DM, JP Icenhower, AP Gamerdinger, and SW Forrester. 2006. “Effects of pH, Temperature, and Aqueous Organic Material on the Dissolution Kinetics of Meta-autunite Minerals, (Na, Ca)2-1[(UO2)(PO4)]2 3H2O.” American Mineralogist 91(1):143-158.

12.17
Wen X, Q Du, and H Tang. 1998. “Surface Complexation Model for the Heavy Metal Adsorption on Natural Sediment.” Environmental Science and Technology 32(7):870-875.
Westall JC. 1986. “Reactions at the Oxide-Solution Interface: Chemical and Electrostatic Models.” In Geochemical Processes at Mineral Surfaces (JA Davis and KF Hayes, eds.), pp. 54-78, ACS Symposium Series 323, American Chemical Society, Washington, D.C.
Westall JC. 1995. “Modeling of the Association of Metal Ions with Heterogeneous Environmental Sorbents.” In Scientific Basis for Nuclear Waste Management XVIII Part 2, eds. T Murakami and RC Ewing, pp. 937-950, Materials Research Society Symposium Proceedings, Volume 353, Materials Research Society, Pittsburgh, Pennsylvania.
Williams JC. 1999. Historical Vadose Zone Contamination from B, BX, and BY Tank Farm Operations. HNF-5231, Fluor Daniel Northwest, Richland, Washington.
Williams WJ. 1947. Office Memorandum: Irradiation of Enriched Uranium Slugs at Hanford. HAN-10309, [U.S. Atomic Energy Commission, Richland, Washington].
Wootan DW and SF Finfrock. 2002. Activity of Fuel Batches Processed through Hanford Separations Plants, 1944 through 1989. RPP-13489, Rev. 0, CH2M HILL Hanford Group, Inc., Richland, Washington.
Yamaguchi T and S Nakayama. 1998. “Diffusivity of U, Pu, and Am Carbonate Complexes in a Granite from Inada, Ibaraki, Japan Studied by Through Diffusion.” Journal of Contaminant Hydrology 35(1-3):55-65.
Yeh GT, WD Burgos, and JM Zachara. 2001. “Modeling and Measuring Biogeochemical Reactions: System Consistency, Data Needs, and Rate Formulations.” Advances in Environmental Research 5(3):219-237.
Zachara JM and JC Westall. 1998. “Chemical Modeling of Ion Adsorption in Soils. Chapter 2 in Soil Physical Chemistry, 2nd ed, ed. DL Sparks, CRC Press, Boca Raton, Florida.
Zachara JM, SC Smith, and LS Kuzel. 1995a. “Adsorption and Dissociation of Co-EDTA Complexes in Iron Oxide-containing Subsurface Sands.” Geochimica et Cosmochimica Acta 59(23):4825-4844.
Zachara JM, PL Gassman, SC Smith, and D Taylor. 1995b. “Oxidation and Adsorption of Co(II)EDTA2- Complexes in Subsurface Materials with Iron and Manganese Oxide Grain Coatings.” Geochimica et Cosmochimica Acta 59(21):4449-4463.
Zachara JM, SC Smith, C Liu, JP McKinley, RJ Serne, and PL Gassman. 2002. “Sorption of Cs+ to Micaceous Subsurface Sediments from the Hanford Site.” Geochimica et Cosmochimica Acta 66(2):193-211.
Zachara JM, JA Davis, C Liu, JP McKinley, NP Qafoku, DM Wellman, and S Yabusaki. 2005. Uranium Geochemistry in Vadose Zone and Aquifer Sediments from the 300 Area Uranium Plume. PNNL-15121, Pacific Northwest National Laboratory, Richland, Washington.

12.18
Zachara JM., J Serne, M Freshley, F Mann, F Anderson, M Wood, T Jones, and D Myers. 2007a. “Geochemical Processes Controlling Migration of High Level Wastes in Hanford’s Vadose Zone. “Vadose Zone J. (in press).
Zachara JM, SM Heald, BH Jeon, RK Kukkadapu, C Liu, JP McKinley, AC Dohnalkova, and DA Moore. 2007b. “Reduction of Pertechnetate [Tc(VII)] by Aqueous Fe(II) and the Nature of Solid Phase Redox Products.” Geochimica et Cosmochimica Acta 71(9):2137-2157.
Zhao XL, MJ Nadeau, LR Kilius, and AE Litherland. 1994. “Detection of Naturally Occurring 236U in Uranium Ore.” Earth and Planetary Science Letters 124(1-4):241-244.
Zhou P and B Gu. 2005. “Extraction of Oxidized and Reduced Forms of Uranium from Contaminated Soils: Effects of Carbonate Concentration and pH.” Environmental Science and Technology 39(12):4435-4440.
PNNL-17031
Distr.1
13.0 Bibliography
Bond DL, JA Davis, and JM Zachara. 2007. “Uranium(VI) Release from Contaminated Vadose Zone Sediments: Estimation of Potential Contributions from Dissolution and Desorption.” Chapter 14 in Adsorption of Metals by Geomedia II, eds. MO Barnett and DB Kent, Elsevier.
Cantrell KJ, RJ Serne, JM Zachara, PE Dresel, KM Krupka, and CF Brown. 2007. Geochemistry Data Package for the Vadose Zone in the Single-Shell Tank Waste Management Areas at the Hanford Site. PNNL-16637, Pacific Northwest National Laboratory, Richland, Washington. NOTE: This is limited distribution and is unpublished in ERICA.
Liu C, JM Zachara, N Qafoku, and Z Wang. 2007. “Scale-dependent Desorption of Uranium in Subsurface Sediments at Hanford, USA.” Water Resources Research (submitted).
McKinley JP, JM Zachara, DE McCready, SM Heald., and KB Wagnon. 2007. “Release of Uranium within the Hanford Vadose Zone Controlled by Sediment Reaction with Original Waste Components.” Vadose Zone Journal (In Press).
Simpson BC, RA Corbin, MJ Anderson, CT Kincaid, and JM Zachara. 2006. Identification and Classification of the Major Uranium Discharges and Unplanned Releases at the Hanford Site Using the Soil Inventory Model (SIM) Rev.1 Results. NUV-06-21106-ES-001-DOC Rev. 1, Nuvotec, Inc., Richland, Washington.
Wang Z, JM Zachara, C Liu, PL Gassman, AR Felmy, C Gillespie, and SB Clark. 2007. “A Cryogenic Fluorescence Spectroscopic Study of Uranyl Carbonate, Phosphate, and Oxyhydroxide Minerals.” Radiochimica Acta (submitted).
Williams BA, CF Brown, W Um, MJ Nimmons, RE Peterson, BN Bjornstad, RJ Serne, FA Spane, and ML Rockhold. 2007. Limited field Investigation Report for Uranium Contamination in the 300 Area, 300-FF-5 Operable Unit, Hanford Site, Washington. PNNL-16435, Pacific Northwest National Laboratory, Richland.
PNNL-17031
Distr.1
Distribution
No. of Copies OFFSITE Vince Adams U.S. Department of Energy
Office of Groundwater & Soil Remediation, EM-22
19901 Germantown Road Germantown, MD 20874 Robert T. Anderson U.S. Department of Energy
Environmental Remediation Science Division, SC-23.4
19901 Germantown Road Germantown, MD 20874-1290 Paul E. Bayer U.S. Department of Energy
Environmental Remediation Science Division, SC-23.4
19901 Germantown Road Germantown, MD 20874-1290 Grover (Skip) Chamberlain U.S. Department of Energy
Office of Contract & Project Execution, EM-52
19901 Germantown Road Germantown, MD 20874 John N. Christensen Lawrence Berkeley National Laboratory 1 Cyclotron Rd. MS 70A4418 Berkeley, CA 94720 Susan Clark Washington State University 1 S.E. Stadium Way Fulmer 147 Pullman, WA 99164-4630
James A. Davis US Geological Survey Bldg. 15, McKelvey Building Menlo Park, CA 94025 Dirk A. Dunning Oregon Office of Energy 625 Marion Street NE Salem, OR 97301-3742 Mark Gilbertson U.S. Department of Energy Energy & Technology Division EM-20/Forrestal Building 1000 Independence Ave., S.W. Washington, DC 20585 Shelly Kelly Argonne National Laboratory 9700 S. Cass Avenue Argonne, IL 60439 James M. Kuperberg U.S. Department of Energy
Environmental Remediation Science Division, SC-23.4
19901 Germantown Road Germantown, MD 20874-1290 David Lesmes U.S. Department of Energy
Environmental Remediation Science Division, SC-23.4
19901 Germantown Road Germantown, MD 20874-1290 Ed Przybylowicz NRC Committee on Development and Implementation of a Cleanup Technology Roadmap Eastman Kodak Company 1219 Crown Point Drive Webster, NY 14580

PNNL-17031
Distr.1
Phil Reed U.S. Nuclear Regulatory Commission Office of Nuclear Regulatory Research Division of Systems Analysis and Regulatory Effectiveness Radiation Protection, Environmental Risk, and Waste Management Branch Mail Stop: T9-F31 Washington, DC 20555-0001 Tom Stoops, LPG Oregon Office of Energy Nuclear Safety Division 625 Marion Street NE Salem, OR 97303 Ronald G. Wilhelm Office of Radiation and Indoor Air 401 M Street, S.W. Mail Code 6603J Washington, DC 20460 No. of Copies ONSITE 9 DOE Richland Operations Office B. Charboneau A6-33 B.L. Foley A6-38 J.P. Hanson A5-13 R.D. Hildebrand A6-38 K.A. Kapsi A5-13 J.G. Morse A6-38 K.M. Thompson A6-38 DOE Public Reading Room (2) H2-53 2 DOE Office of River Protection R.W. Lober H6-60 S.A. Wiegman H6-60
20 CH2M HILL Hanford Group, Inc. R. Calmus S7-75 M.P. Connelly H6-03 J.G. Field H6-03 M. Jaraysi H6-03 J.G. Kristofzki H6-03 F.M. Mann (10) H6-03 W.J. McMahon H6-03 D.A. Myers H6-03 G. Parsons T6-04 H.A. Sydnor H6-03 D.J. Watson H6-03 Fluor Federal Services R. Khaleel E6-17 No. of Copies 12 Fluor Hanford, Inc. M.W. Benecke E6-44 M. Byrnes E6-44 B.H. Ford E6-44 D.G. Horton E6-35 S.M. Narbutovskih E6-44 S. Peterson E6-35 V.J. Rohay E6-44 C. Sutton E6-35 L.C. Swanson E6-35 G.S. Thomas E6-44 B.A. Williams E6-44 M.I. Wood H8-44 S.M. Stoller R. G. McCain B2-62

PNNL-17031
Distr.1
No. of Copies 4 U.S. Environmental Protection Agency A. Boyd B1-46 N. Ceto B1-46 D.A. Faulk B1-46 R. Lobos B1-46 8 Washington State Department of Ecology J.A. Caggiano H0-57 S. Dahl-Crumpler H0-57 D. Goswam H0-57 J.A. Hedges H0-57 A. Huckaby H0-57 J. Lyon H0-57 B. Rochette H0-57 J. Yokel H0-57 34 Pacific Northwest National Laboratory B.N. Bjornstad K6-81 C.A. Brandt K9-04 T.M. Brouns K9-69 C.F. Brown P7-22 P.E. Dresel K6-96 M.J. Fayer K9-33 M.D. Freshley K9-33 J.S. Fruchter K6-96 K.M. Krupka K6-81 G.V. Last K6-81 C. Liu K8-96 W.J. Martin K6-81 J. McKinley K8-96 R. Peterson K6-75 M. Rockhold K9-36 R.J. Serne P7-22 R. Smith K6-96 T. Stewart K6-84 M.B. Triplett K6-52 W. Um P7-22 V. Vermeul K6-96 A. Ward K9-33 J.M. Zachara (10) K8-96
Hanford Technical Library (2) P8-55