uq-42a exotic woody weeds - agrifutures australia · history of prickly acacia – or any other...
TRANSCRIPT

EXOTIC WOODY WEEDS Use of simulation models to predict future distributions under climate change A report for the Rural Industries Research and Development Corporation by Mr D.J. Kriticos University of Queensland, St Lucia Dr R.W. Sutherst CSIRO Entomology, Indooroopilly Dr S.W. Adkins University of Queensland, St Lucia May 2000 RIRDC Publication No 00/62 RIRDC Project No UQ-42A
© 2000 Rural Industries Research and Development Corporation. All rights reserved. ISBN 0 642 58092 8 ISSN 1440-6845 Exotic Woody Weeds - Use of Simulation Models to Predict Future Distributions under Climate Change Publication No. 00/31 Project No. UQ-42A The views expressed and the conclusions reached in this publication are those of the author and not necessarily those of persons consulted. RIRDC shall not be responsible in any way whatsoever to any person who relies in whole or in part on the contents of this report. This publication is copyright. However, RIRDC encourages wide dissemination of its research, providing the Corporation is clearly acknowledged. For any other enquiries concerning reproduction, contact the Publications Manager on phone 02 6272 3186. Researcher Contact Details Dr Steve W Adkins School of Land and Food University of Queensland Phone: 61 07 3365 2072 Fax: 61 07 3365 1177 Email: [email protected]
IRDC Contact Details Rural Industries Research and Development Corporation Level 1, AMA House 42 Macquarie Street BARTON ACT 2600 PO Box 4776 KINGSTON ACT 2604 Phone: 02 6272 4539 Fax: 02 6272 5877 Email: [email protected]. Web: http://www.rirdc.gov.au Published in May 2000 Printed on environmentally friendly paper by Canprint
iii
Foreword In 1995 the National Greenhouse Advisory Committee in Australia published a report on "A generic approach to defining impacts and designing adaptation strategies for pests and diseases under the enhanced greenhouse effect." It described a generic approach to impact assessment suitable for use in evaluating the vulnerability of Australian rural industries to pests, diseases and weeds under climate change. The approach had not been fully tested on different types of problems so that its relevance to different agricultural sectors and regions in Australia was uncertain. RIRDC commissioned the present project to test the use of simulation models as a tool to equip Australian rural industries to respond to the likely impacts of climate change on woody weeds. Firstly, an examination was made of the potential impact of climate change on the distribution and relative abundance of two exotic woody weeds Acacia nilotica ssp. indica Benth. Brenan (prickly acacia) and Cryptostegia grandiflora R. Br. (rubber vine) using the CLIMEX model. This was done in order to determine the wider context in which location-specific responses of the weeds could be analysed using a mechanistic model of the population dynamics of the weeds. A comprehensive simulation model of the population dynamics of Acacia nilotica was then built and its ability to describe the patterns of infestations in different parts of Australia and alternative management strategies for use as adaptation measures were examined. The report describes the results of risk assessments of Acacia nilotica and Cryptostegia grandiflora under climate change. It defines the relative vulnerability of the pastoral industries to changes in the distribution and relative abundance of each species. This project was funded from RIRDC Core Funds which are provided by the Federal Government. This report, a new addition to RIRDC’s diverse range of over 450 research publications, forms part of our Resilient Agricultural Systems R&D program, which aims to enable agricultural production systems that have sufficient diversity, flexibility and robustness to respond to challenges and opportunities. Most of our publications are available for viewing, downloading or purchasing online through our website: • downloads at www.rirdc.gov.au/reports/Index.htm • purchases at www.rirdc.gov.au/pub/cat/contents.html Peter Core Managing Director Rural Industries Research and Development Corporation
iv
Acknowledgments The authors would like to acknowledge the assistance of the following individuals and research groups. Mrs Anne Bourne, Mr Gunter Maywald, Dr Rick Bottomley from CSIRO Entomology in Brisbane; Drs Joel Brown, Tony Grice, Ian Radford, Fleur Tiver from CSIRO Tropical Agriculture in Townsville; Dr Tania Yonow from the CRC for Tropical Pest Management, Dr Bill Burrows from Department of Primary Industries Queensland, Dr Tony Grice Drs Greg McKeon, Dane Panetta and Joe Scanlan, and Mr Joe Vitelli from Department of Natural Resources, Mr Mike Nicholas and Mr Lindsay Whiteman from CSIRO Tropical Agriculture, Townsville; Mr Brew Cameron of Allaru Station; Brian Fells of Garomna Station; Mr Russel Lawton of Marathon South Station; John and Fiona Hamilton of Wivenhoe Station; Jane and David Carter of Wyangarie Station; and the Department of Natural Resources, Tropical Weeds Research Centre, Charters Towers, the Department of Natural Resources Queensland, the Queensland Centre for Climate Applications, and the Meat Research Corporation (project CS219).
Abbreviations ABS Australian Bureau of Statistics CLIMEX CSIRO Entomology CLIMEX climate matching model DYMEX CSIRO Entomology DYMEX population modelling toolkit EI CLIMEX Ecoclimatic Index GCM Global climate models GI CLIMEX Growth Index GIS Geographical information system IPCC Intergovernmental Panel on Climate Change M Million WTO World Trade Organisation

v
Contents
Foreword ......................................................................................................................................... iii
Acknowledgments............................................................................................................................ iv
Abbreviations................................................................................................................................... iv
Executive Summary ....................................................................................................................... vii
1 Introduction...................................................................................................................................1
2 Methods........................................................................................................................................3 2.1 CLIMEX model ......................................................................................................................3 2.2 Climate change scenarios.......................................................................................................4 2.3 Prickly acacia ........................................................................................................................4
2.3.1 Present distribution of prickly acacia................................................................................5 2.3.2 A population model of Acacia nilotica: A tool for exploring weed management and the
effects of climate change.................................................................................................8 2.3.3 The effects of climate change on prickly acacia population dynamics ............................10 2.3.4 Assessing strategies for adaptation to prickly acacia under climate change ...................11
2.4 Rubber Vine..........................................................................................................................12 2.4.1 Present distribution of rubber vine .................................................................................13 2.4.2 Ecology of rubber vine...................................................................................................14
3 Results.........................................................................................................................................15 3.1 Prickly acacia distribution using CLIMEX ..............................................................................15 3.2 Rubber vine distribution using CLIMEX.................................................................................23 3.3 Prickly acacia population dynamics and management using the DYMEX model ..................31
3.3.1 Impacts of prickly acacia invasion..................................................................................31 3.3.2 Effects of climate change on prickly acacia population dynamics...................................31 3.3.3 Effects of climate change on infestation levels of prickly acacia ....................................32 3.3.4 Assessing strategies for adaptation to prickly acacia under climate change ...................35
4 Discussion ..................................................................................................................................36 4.1 Prickly acacia ......................................................................................................................36 4.2 Adaptation responses to rubber vine ........................................................................................37 4.3 Adaptation responses to prickly acacia.....................................................................................37
5 Implications ................................................................................................................................39
6 Recommendations......................................................................................................................40
7 References .................................................................................................................................41

vi
List of tables Table 2.1 Climate change scenarios used in CLIMEX analyses.....................................................4 Table 2.2 Prickly acacia and rubber vine parameters....................................................................7 Table 2.3 Climate change scenarios used in DYMEX analyses ...................................................11 Table 3.1 Sensitivity of upland biomass density (t/ha) to climate change ....................................32
List of figures Figure 2.1 Countries containing prickly acacia ...............................................................................5 Figure 2.2 Occurrence records of prickly acacia.............................................................................6 Figure 2.3 Schematic representation of the prickly acacia population dynamics model. .................9 Figure 2.4 Schematic representation of the livecycle modules of prickly acacia .............................9 Figure 2.5. Australian distribution of rubber vine ...........................................................................12 Figure 2.6 Worldwide distribution of rubber vine ..........................................................................13 Figure 3.1 Current and potential distribution of prickly acacia.......................................................15 Figure 3.2 Ecocolimatic Index for prickly acacia under different climate scenarios.......................17 Figure 3.3 CLIMEX Growth Index (GI) for prickly acacia in Australia. ...........................................18 Figure 3.4 CLIMEX Moisture Index (MI) for prickly acacia in Australia..........................................19 Figure 3.5 CLIMEX Temperature Index (TI) for prickly acacia in Australia....................................20 Figure 3.6 CLIMEX Cold Stress (CS) for prickly acacia in Australia..............................................20 Figure 3.7 CLIMEX Thermal Accumulation ..................................................................................20 Figure 3.8 CLIMEX Wet Stress (WS) for prickly acacia in Australia. Scenarios as for Figure 3.1..21 Figure 3.9 CLIMEX Dry Stress (DS) for prickly acacia in Australia. Scenarios as for Figure 3.2....22 Figure 3.10 Modelled global climatic suitability for rubber vine.......................................................23 Figure 3.11 Modelled Australian climatic suitability for rubber vine ................................................24 Figure 3.12 CLIMEX Climate suitability for rubber vine under different climate scenarios. .............25 Figure 3.13 CLIMEX Growth Index (GI) for rubber vine in Australia ...............................................26 Figure 3.14 CLIMEX Moisture Index (MI) for rubber vine in Australia. ............................................27 Figure 3.15 CLIMEX Temperature Index (TI) for rubber vine in Australia .......................................28 Figure 3.16 CLIMEX Cold Stress (CS) for rubber vine in Australia .................................................28 Figure 3.17 CLIMEX Thermal Accumulation ..................................................................................28 Figure 3.18 CLIMEX Wet Stress (WS) for rubber vine in Australia .................................................29 Figure 3.19 CLIMEX Dry Stress (DS) for rubber vine in Australia ...................................................30 Figure 3.20 Simulated impact of prickly acacia density on pasture production................................31 Figure 3.21 Sensitivity of upland biomass density (t/ha) to climate change at Bowen.....................33 Figure 3.22 Sensitivity of upland biomass density (t/ha) to climate change at Hughenden..............34 Figure 3.23 Sensitivity of upland biomass density (t/ha) to climate change at Boulia......................34 Figure 3.24 Sensitivity of upland biomass density (t/ha) to climate change at Burren Junction.......34 Figure 3.25 Sensitivity of upland biomass density (t/ha) to climate change at Cordillo Downs........35 Figure 3.26 Sensitivity of biomass density for properties with herds of sheep.................................35

vii
Executive Summary Climate change is uncertain and there is concern that long-term changes in climate and changes in the seasonal variability of climates may have severe socio-economic impacts. Climate change is expected to result in a warming across the Australian continent, coincident with increasing atmospheric concentrations of CO2 and possible changes in rainfall. The likely impact of this on woody weeds is unclear. The IPCC concept of vulnerability involves the assessment of the sensitivity of an industry, ecosystem, or region to change, combined with available adaptation options. It is used here in a case study to estimate the likely impacts of climate change on the ecology of Acacia nilotica (L.) Willd. Ex Del. (prickly acacia) and Cryptostegia grandiflora R. Br. (rubber vine), two of the most severe of the woody weeds in tropical Australia. Subsequent effects on pastoral industries and conservation efforts in Australia are also considered Initially the CLIMEX model is used to explore the potential geographical distribution and constraints to expansion of prickly acacia and rubber vine under a range of climate change scenarios using a sensitivity analysis that covered the range of scenarios projected using global climate models (GCMs). The results indicated that the southern distribution of prickly acacia is limited by the length of the growing season and that the area at risk of invasion increases with temperature, rainfall and increased water use efficiency with higher carbon dioxide (CO2) concentrations. Rubber vine was also sensitive to these changes. In order to examine the impacts of prickly acacia further, and to test the advantages of using process-based simulation models to conduct risk assessments, a mechanistic model of the population dynamics of prickly acacia was developed. It constitutes the most comprehensive description yet made of the life-history of prickly acacia – or any other woody weed in Australia and was built using the DYMEX model building toolkit, developed by the CRC for Tropical Pest Management. The model describes the effects of environmental variables and so was able to be used to explore the likely biological response of prickly acacia to a range of climate change scenarios. In addition, the major advantage of the model is that it enables logistical and economic attributes of adaptation strategies to be quantified, which is not possible using CLIMEX. The results of the DYMEX modelling showed that the risks from prickly acacia are sensitive to assumptions about
• changes in water use efficiency of plants under increased concentrations of CO2, with increased recruitment rates and a western expansion of prickly acacia
• increases in rainfall leading to a western expansion of prickly acacia • increases in the length of the growing season with increases in temperature, leading to an increase
in the area at risk in southern States.
The DYMEX model also enabled an assessment of adaptation strategies, which showed that
• containment of dispersal is an effective and economical way of reducing the risk from prickly acacia in the presence of sheep or cattle, control of seeding by biological control is unlikely to be effective due to the intense competition by livestock for seedpods
• capping of bores and replacing open drains with piping removes the habitat conditions that result in the formation of dense thickets alongside the drains. However, once established, the population dynamics of upland populations of prickly acacia appear largely insensitive to the rate of seed being produced alongside bore drains. The large amount of seed produced alongside boredrains is largely lost to self-thinning processes in the presence of cattle
• tactical use of fire, in response to abnormally high seedling survival following abnormally wet seasons, may offer an economical way of minimising recruitment
viii
• climate change scenarios resulted in increased biomass, canopy cover and basal area of prickly acacia in the five representative sites analysed in Australia. This indicates that there is likely to be a significant increase in carbon sequestration if the invasion is not contained.
The model also highlighted the critical role of changed stocking patterns during the mid-1960s ie changing from sheep to cattle enterprises, in the subsequent invasion of paddocks. Cattle dispersal of prickly acacia seed is much more effective than sheep due to different gut-passage survival rates. Under current climatic conditions, pastoral stations in the semi-arid Mitchell Grass Downs that run only sheep may be able to extract a net benefit from prickly acacia. However, the current advantages of running sheep as a means of learning to live with prickly acacia may be diminished in future as expected climate changes alter the population dynamics of prickly acacia. The project results reinforced the utility of the CLIMEX model as a tool for policy-scale risk assessments and of mechanistic models such as DYMEX for evaluation of adaptation options. The DYMEX model proved to be a major undertaking – in terms of both data collection and model development - relative to the modest effort that is required to build a CLIMEX model. However, once built the model can be used to describe the population dynamics and seasonal growth patterns of the weeds and to link the effects of different methods of intervention. The DYMEX model also had the useful feature of being able to readily compare the results of alternative approaches to risk assessments, because it incorporated a facility to optimise control effort based on criteria established by the user, such as profitability.
The large increase in costs and advantages in moving from a CLIMEX-level analysis to a DYMEX mechanistic model-based analysis of system and regional vulnerability needs to be recognised. The difficulty is the large number of target organisms and geographical areas involved in assessing risks from climate change. For example, 20 weeds have been designated ‘Weeds of National Significance’. Australia needs to recognise the strategic value and no-regrets nature of setting a target to develop mechanistic models of all of its species of pests, diseases and weeds of national significance in order to improve the quality and scope of current as well as future decision-making. Such a strategic approach will yield results in terms of quantifiable costs and benefits of different adaptation options. The development of this initial model of prickly acacia using the DYMEX generic modelling software has provided a sound basis on which to start to build models of the other woody-weed species because many of the modules will be readily parameterised to describe the features of the other species. A gap still exists in the lack of a comprehensive DYMEX library of modules that describe the various options for responses to woody weed infestations.
The project initiated national, collaborative interest groups for woody-weed species (Sutherst & Campbell 1999). A powerful workshop format was tested and improved as part of that process to link ecological modellers with weed research and extension officers. This DYMEX software and workshop format are now playing a central role in capturing expert knowledge in the RIRDC National Modelling Network project and they are being adopted by the CRC for Weed Management Systems. Such interest groups and workshops achieve high degrees of leverage and promise to enhance the national effort in weed, pest and disease ecology in Australia very significantly.
In conclusion, the project has helped to equip Australia with the capacity to evaluate risks and adaptation options for woody-weeds in rangelands under climate change. It now remains for governments and industry to implement the necessary policy decisions and provide the resources to put such a process into operation. These ‘no regrets’ actions will significantly enhance the current management of woody weeds in Australia.

1
1 Introduction Broad scale invasion by exotic woody weeds is reducing the profitability and sustainability of pastoral operations and severely impacting on the stability of native ecosystems throughout northern Australia. Currently, 10-20% of the land area in the tropics is affected and the area impacted is likely to increase substantially over time. Climate change is uncertain and there is concern that impacts from both long-term changes in climate and changes in the seasonal variability of climate may have severe socio-economic effects (IPCC 1996). Regional climate change scenarios generated by global climate models (GCM's) (Climate Impact Group 1996) indicate the likelihood of increases in temperature in the south coast of Australia of 0.3-1oC by the year 2030, and 0.6-2.7oC by 2070. Increases in inland areas are projected to range from 0.4-1.4oC by 2030 and 0.7-3.8oC by 2070. Such changes are outside the historical experience of modern agriculture and indicate the need to consider appropriate responses in advance. As the climate changes progressively, society will be less and less able to rely on past climate to make projections to the future. This leaves the use of computer models as one way in which future scenarios can be explored and sensitive industries and regions prepared for the changes. C3 woody weeds will benefit from carbon dioxide (CO2) enrichment, relative to C4 tropical grasses, and also from the projected increases in the frequency of extreme events such as floods which will facilitate germination and establishment of thickets. It is important to prepare Australian agricultural and environmental managers for the expected change in the geographical distribution and population dynamics of woody weeds. In order to conduct case studies it was decided to concentrate on two weeds: Acacia nilotica Benth. Brenan (prickly acacia) and Cryptostegia grandiflora R. Br. (rubber vine). Both weeds are a major concern in northern Australia and are continuing to spread. The IPCC approach to the assessment of impacts under climate change (Parry & Carter 1998) emphasises the need to assess both impacts and adaptation measures in an impact assessment in order to derive a measure of the vulnerability of the system. The concept of vulnerability is applicable to either regions or systems. Top-down approaches use climate change scenarios from GCM's to evaluate likely impacts, while bottom-up approaches use sensitivity analysis to obtain a measure of the responsiveness of a target to a range of conditions that cover the likely climate change scenarios. Hence, the use of scenarios is an attempt at prediction, while sensitivity analysis aims to understand the behaviour of the system in a wider sense. Sensitivity analysis was used in the present analysis in order to avoid the problems with the immature and frequently changing GCM scenarios, which result in analyses being outdated very rapidly. The analyses assessed the vulnerability of pastoral industries and regions to a plausible range of temperatures, as a product of their sensitivity and adaptability, i.e.
Vulnerability = Sensitivity x Adaptability of a specific location and production system.
Sensitivity of an industry or region is used in the sense of responsiveness to changed conditions. It was estimated from the proportional change in the size of the weed population. The options for industries to adapt depend on the sustainability of current technologies under present conditions and their robustness under climate change (Sutherst et al. 1998). The sustainability of chemical technologies and management practices depends on issues such as public health, environmental contamination, production economics and the development of pesticide resistance. Their robustness under different conditions depends also on their amenability to modification to respond to changing intensities, timing and spatial movements of pest plants and animals.
2
In-depth case studies are being conducted in Australia to test the performance of pest impact assessment methodologies (Sutherst et al. 1996) in estimating changes in costs associated with pests under climate change. These studies provide an effective means of testing and enhancing the effectiveness of the methodology. An International Workshop on Impacts Of Climate Change On Pests, Diseases and Weeds in Australia in 1995 (Sutherst 1996) highlighted the need to quantify both the likely changes in the damage to agricultural industries, caused by changes in the status of pests, and also the socioeconomic impacts of noxious species. Case studies will assist in the development and modification of the impact assessment approaches, thereby improving the capability of industry to evaluate risks from climate change. This improved capability will help prepare industry to maintain its competitiveness in the face of climate change impacts and to design more cost-effective adaptive strategies.
1.1 Objectives The objectives of the current project were to conduct case studies to predict the spread of exotic woody weeds in northern Australia under climate change by constructing and validating process-based simulation models.

3
2 Methods
A two-phased approach was taken to the risk assessment of the two target woody weeds in northern Australia, i.e. Acacia nilotica ssp. indica (Benth.) Brenan and Cryptostegia grandiflora Roxb. Firstly, the CLIMEX™ model (Sutherst et al. 1995; Sutherst et al. 1999) was used to examine the geographical distribution of each species, in order to define the wider context in which each exists (Kriticos 1997). Analysis of climatic conditions that favour or constrain a species enables a more detailed analysis to be conducted in the knowledge that the broad response patterns to climate are understood. Once these had been defined, the next level in the hierarchy of analytical tools – a process-based simulation model – was developed for one of the target species, prickly acacia (Kriticos et al. 1999a). The model was built using the DYMEX model-building toolkit (Maywald et al. 1997, 1999) developed by the CRC for Tropical Pest Management. It is modular and includes a number of features that make it particularly useful to biologists. In order to build the model it was necessary to conduct a detailed literature survey and several experiments in collaboration with other parties to understand the field dynamics and responses of prickly acacia to moisture stress and enhanced CO2. Each of the analytical approaches is discussed in more detail below.
2.1 CLIMEX model CLIMEX is a climate-matching model that can either compare climates directly or produce readily interpretable indices derived from the responses of a nominated species to each of the components of climate. In the latter process, rainfall and relative humidity or evaporation are initially combined into a single ‘Soil Moisture Index’ to represent the seasonal availability of moisture. This is then combined with temperature and day-length to estimate a weekly population 'Growth Index' for that species. Extreme climate values are taken into account in a series of 'stress indices' that estimate the threat to that species posed by prolonged adverse periods of excessively cold, hot, dry or wet conditions. Finally the growth and stress indices are combined into an 'Ecoclimatic Index', scaled from 0-100, to represent the overall favourableness of the given geographical location for the permanent survival and propagation of populations of that species. The annual number of day-degrees for development is calculated so that the ability of the plant to fully develop seedpods can be estimated. A species’ climatic requirements are inferred from information on its known geographical distribution, relative abundance, and seasonal phenology. This procedure is the reverse of that usually used to build process-based population models. Some lifecycle data, such as developmental threshold temperatures can be used to fine tune or to interpret the CLIMEX parameter values to give more confidence in them. As more data become available on the species, the parameter values can be steadily refined. The aim is to capture the core features of the species' climatic requirements, not to describe the population dynamics in detail. CLIMEX for Windows 1.1 includes a database of 675 meteorological stations throughout Australia. These stations are of variable quality, and located irregularly across the continent, with marked biases toward the coastal fringes and eastern mountain ranges. In order to overcome the spatial limitations of the supplied meteorological database, a 0.5 degree regular grid of long-term average climate surface variables was generated for Australia using ESOCLIM (Hutchinson, Houlder, Nix, and McMahon 1999). This grid was imported into CLIMEX and used in place of the standard meteorological database for running Australian analyses. To visualise the results, the output was ‘loose-coupled’ to a matching polygon coverage using a GIS.

4
2.2 Climate change scenarios After the CLIMEX parameters had been fitted under the present climate averages, six modified climate scenarios were chosen to reflect the range of possible future climatic conditions in the mid-to-late 21st century. There is little doubt that global average daily temperatures will rise in the order of 2°C sometime during this period (Parry and Carter 1998). Therefore, all of the climate change scenarios include a 2°C increase in daily minimum and maximum temperatures. The uncertainty surrounding the effect of increasing CO2 upon rainfall is much less certain. To account for this uncertainty, rainfall is either increased or decreased by 10%. There is considerable evidence that increased CO2 can affect plants in significant ways, leading to increased plant growth and a reduction in water use. The effect of this should be to reduce the rate at which soil moisture is depleted, prolonging the growth period in seasonally dry climates. To account for this, the soil moisture model was modified by adjusting the evapotranspiration constant Et. In &/,0(;� Et represents the constant proportion of class A pan evaporation that is actually lost to evapotranspiration from the soil profile. The default value of 0.8 was reduced in steps of 0.2 to account for a range of potential increases in plant water use efficiency. Whilst a value of 0.4 for Et is considered extreme, claims have been made that a doubling of CO2 can act like a doubling of rainfall (Farquhar 1997). The scenarios are summarised in Table 1.
Table 2.1 Climate change scenarios used in CLIMEX analyses
Temperature Rainfall Et +2°C +10% 0.8 +2°C +10% 0.6 +2°C +10% 0.4 +2°C -10% 0.8 +2°C -10% 0.6 +2°C -10% 0.4
It is assumed that the impact of rising temperatures upon the evapotranspiration calculations in the soil moisture model is automatically taken into account with climate datasets such as that used in CLIMEX, that use relative humidity and temperature data to estimate potential evaporation. The impacts of climate change are assessed here in terms of the relative sensitivity of the potential distribution of an organism to a set of conditions that represent the range of IPCC scenarios. Thus the results should not be viewed as predictions, but rather as projections, based on the stated assumptions about the plant’s climatic preferences and the chosen climate scenarios.
2.3 Prickly acacia The biotype of prickly acacia found in Australia is believed to be Acacia nilotica ssp. indica, thus model-fitting efforts were focussed on the native distribution of this sub-species. Distribution records of prickly acacia used to fit the CLIMEX parameters included a published distribution map for prickly acacia in Africa and Asia, world-wide point locations of meteorological stations in areas climatically suited to prickly acacia (R. Randall, Western Australian Department of Agriculture, pers. comm.), Queensland Herbarium records (Herbrecs database), Northern Territory Herbarium records, Northern Territory Department of Primary Industries and Fisheries (DPIF) Weeds Databases (K. Sanford-Readhead, Parks and Wildlife Commission of the Northern Territory pers. comm.) and other point locations in Australia (J. Carter, Department of Natural Resources, pers. comm.).

5
In addition to the spatial data sets, information concerning the physiological performance of prickly acacia with respect to some climatic factors was used. The comprehensive nature of the available data makes this analysis the most detailed of its type so far undertaken for prickly acacia or any other woody weed in Australia. 2.3.1 Present distribution of prickly acacia 2.3.1.1 World-wide The global distribution of prickly acacia is primarily tropical (Figure 2.1), though extending into equatorial and sub-tropical climatic regions.
Figure 2.1 Countries containing prickly acacia, Acacia nilotica ssp. indica. Adapted from various authors.

6
2.3.1.2 Australia The present distribution of prickly acacia in Australia was gauged from several sources: Prickly acacia is present in much of Queensland and in isolated pockets of the Northern Territory, New South Wales, and at one location in South Australia (Figure 2.2). The Australian distribution information was used primarily as a means of validating the model.
Figure 2.2 Occurrence records of prickly acacia, Acacia nilotica ssp. indica, in Australia Influence of Climatic Factors on Distribution. Prickly acacia has a wide tolerance of rainfall. It occurs in areas receiving less than 230 mm y-1 and in areas receiving more than 1 500 mm y-1. It is reported to be intolerant of frost, but it can grow in areas where the mean monthly temperature of the coldest month is 16 °C and it can withstand temperatures up to 50 °C. A minimum threshold thermal accumulation each year (degree-days) may be necessary for seed production, so the length of the growing season was tested to see if it could govern the poleward limit of this species. The parameters used in the CLIMEX models are shown in Table 2.2.
7
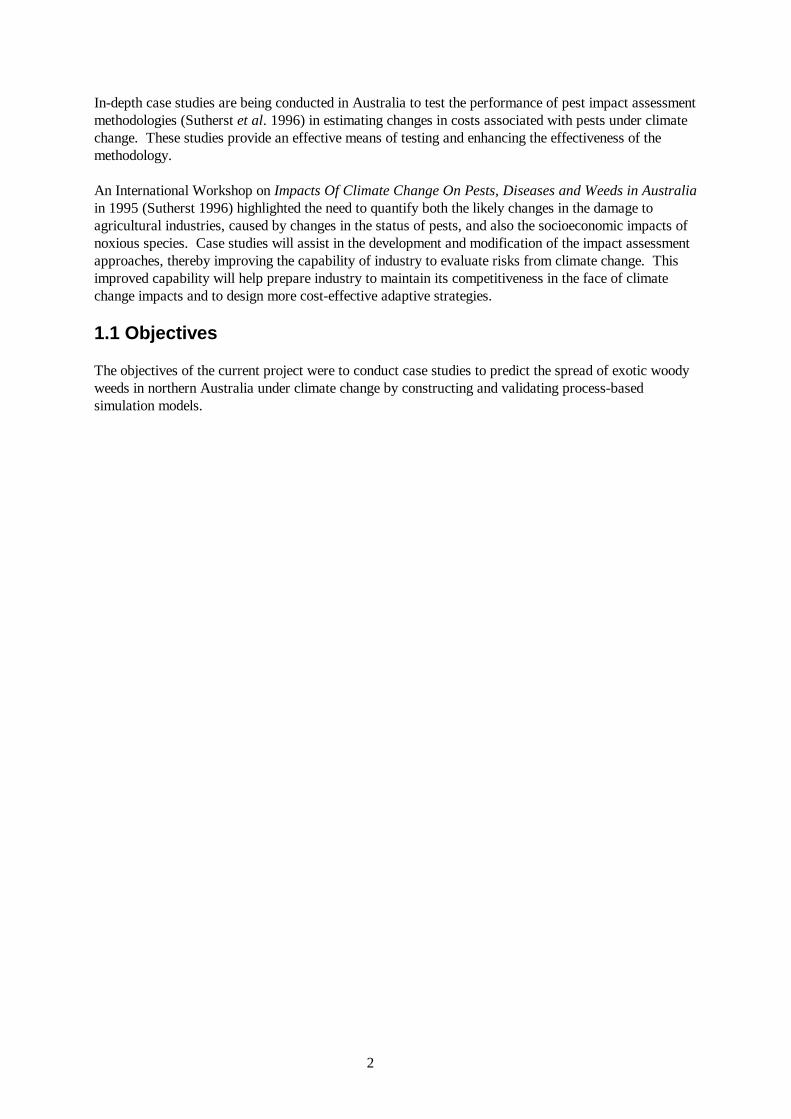
Table 2.2 Prickly acacia and rubber vine parameter values used in the CLIMEX model
Index Parameter Rubber
vine Prickly acacia
Temperature DV0 15 18 DV1 25 25 DV2 37 37 DV3 43 45 PDD 1985 1200 Moisture SM0 0.1 0.045
SM1 0.3 0.2
SM2 1 1.2
SM3 1.3 1.5
Cold Stress TTCS 2.5 2.5
THCS 0.2 0.2
Heat Stress TTHS 43 45
THHS 0.25 0.05
Dry Stress SMDS 0.1 0.045
HDS 0.0025 0.025
Wet Stress SMWS 1.35 1.5
HWS 0.017 0.02
2.3.1.3 Influence of non climatic factors on distribution The climatic factors discussed above will generally determine the outermost bounds of a species’ potential distribution. Within the areas defined as climatically suitable there will be other factors that determine whether a species is found in a particular area. The effects of some of these non-climatic factors are discussed below. Prickly acacia appears to be able to grow on all soils excepts very sandy soils. Landlocked drainage channels allow populations to persist in areas that would otherwise be climatically unsuitable due to a lack of soil moisture. As prickly acacia takes approximately five years to mature, any disturbance regime that destroys the shrubs, and recurs every five years or less will prevent its widespread recruitment. Similarly, a fire regime of intensive burns every five years or less may prevent recruitment of prickly acacia, depending upon the intensity of the fires and the size structure of the population of prickly acacia. Seed germination rates are markedly increased where seeds are scarified by passing through the gut of cattle. In the absence of seed dispersal by cattle it is unlikely that prickly acacia will actively invade and establish in new areas in densities that will cause significant reductions in pasture production. The procedure for estimating the climatic requirements of prickly acacia was firstly to fit the predicted distribution to the known distribution outside of Australia. Where prickly acacia was noted growing in Australia outside of the area predicted to be climatically suitable, based upon its overseas distribution,

8
the parameters were adjusted to reflect this. This adjustment was minor, and only necessary for the southeastern Australian limit. 2.3.2 A population model of A cacia nilotica: A tool for exploring weed management
and the effects of climate change The study of Acacia nilotica has been fragmented in time, space and purpose. Consequently, our knowledge is also fragmented. A plethora of information has been published on prickly acacia over a period of more than a century (Fagg and Greaves 1990). However, despite some good field ecological research and monitoring programs (Bolton, Carter, and Dorney 1987);(Carter, Jones, and Cowan 1991), and an attempt to draw management guidelines from a simple transition matrix model (Mooy, Scanlan, Bolton, and Dorney 1992), a holistic understanding of this ecological system has proved elusive. One reason for this is the lack of a tool suitable for integrating the disparate information, and then representing the system behaviour under various scenarios. In a partial response to these challenges, a computer-based simulation model of the population dynamics of prickly acacia was developed in a collaborative effort involving the current RIRDC project, the University of Queensland, CSIRO Entomology and CSIRO Tropical Agriculture. 2.3.2.1 Model description The prickly acacia model was created using DYMEX ™ (CSIRO Entomology), a generic population-modelling tool that uses climate variables and environmental parameters to drive lifecycles. It does this by describing the life-history properties of the average individual in each cohort on a weekly time-step. The model simulates a paddock through the use of two interconnected lifecycles representing bore drain and upland plant populations (Figure 2.3). The connection between the two populations is via seed dispersal by cattle or sheep. The two lifecycles were necessary because in most parts of Queensland where prickly acacia occurs, paddocks contain open bore drains (artificial channels fed by artesian bores). Trees growing alongside these drains have markedly different growth rates, seedling and juvenile survival rates, fecundities, plant densities and canopy covers than trees growing in adjacent upland habitat. The only difference between the modelled upland and bore drain lifecycles is the way their soil moisture environments are described: the bore drain soil moisture module includes an irrigation component. The model identifies six discrete lifestages: seedbank, seedling, juvenile, adult, flowers and seeds-in-pods (Figure 2.4). The flowers and seeds-in-pods are endostages ie lifestages that are contained within another lifestage – in this case within the adult lifestage. This novel approach allowed us to include processes of selective abortion of flowers and pods in response to frost or drought, as well as differential development rates for pods depending upon their cohort-specific experience of environmental conditions.

9
UplandPlant Lifecycle
Bore DrainPlant Lifecycle
Climate BiophysicalEnvironment
LivestockPatterns
ManagementDisturbance
Intra-paddockDispersal
CarbonSequestration
PastureProduction
LivestockProduction
ClimateChange
LivestockTransport
AreaInfested/Density
Paddock
Figure 2.3 Schematic representation of the prickly acacia population dynamics model.
Solid lines represent direct connections, dashed lines indicate implicit connections.
Seed Seedling Adult Flower Seed in Pod
Seed Dispersal
8SODQG /LIHF\FOH
%RUHGUDLQ /LIHF\FOH
Juvenile
Seed Seedling Adult Flower Seed in PodJuvenile
Figure 2.4 Schematic representation of the livecycle modules of prickly acacia
Used in the population dynamics model. The dotted boxes enclose the adult tree life stages and their respective endostages.

10
The model incorporates size-dependent intraspecific competition (Thomas and Weiner 1989) using a function adapted from (Aikman and Watkinson 1980). This mechanism incorporates the concepts of the zone of influence (Mitchell 1969) and ecological field theory (Walker and Dowling 1991). The surface roots of trees in the uplands frequently extend well beyond the canopy perimeters (pers. obs.). Upland adult trees are widely spaced with respect to their canopies, though seedling and juvenile densities can be quite high. It was assumed that plants compete exclusively for space well outside their canopies during dry periods, but can tolerate higher densities during wetter periods, and at moist sites (eg alongside bore drains and at coastal sites). The lifecycles include mechanisms for germination, seed decay, plant desiccation, growth, maturation, density-dependent effects on growth and mortality, reproduction (including selective abortion), herbivory, interspecific competition with pasture species, and differential seed dispersal due to stocking patterns. The model is driven by weekly averages of daily maximum and minimum temperature, and weekly totals of rainfall and evaporation (Queensland Centre for Climate Applications, 1998). It incorporates the effects of climate change through mechanisms affecting the growth rates of plants, and their water-use efficiency. The atmospheric CO2 concentration, climate sensitivity (increase in global temperature at 2 x CO2), and rainfall can each be adjusted to simulate future climate scenarios. The mechanisms accounting for effects of alterations in CO2 were derived from a literature review of the effects of CO2 alone, and in concert with temperature, nutrient and moisture availability on plant factors (photosynthesis, growth rates, water use efficiency, and competitiveness). Where possible, driving functions and parameters were derived from published empirical relations and manipulative experiments (eg seedling drought tolerance), inferred from the plant's geographical distribution, or derived from analyses of field observations. Remaining parameters were derived through ad hoc iterative parameter-fitting techniques (Starfield and Bleloch 1991). The model was verified with data from the field ecology research program (Radford et al. 1999). In one experiment, seedlings were grown in pots under controlled environmental conditions designed to mimic field conditions as closely as possible. After two weeks growth, the seedlings were subjected to a soil dry-down regime that eventually resulted in death. Plant size, soil moisture level and time to death were noted. 2.3.3 The effects of climate change on prickly acacia population dynamics To assess the effect of climate change on the paddock populations of prickly acacia, the population dynamics model was run with a series of standard scenarios using meteorological data for a range of selected sites that represent a broad range of suitability under current climate. This method standardised factors that would be affected by management decisions. The decision to utilise this approach was taken after consideration of such factors as the longevity of prickly acacia, the limited availability of historical meteorological data, and the time taken to run the model for moderate lengths of time (40 years). The long-lived nature of prickly acacia (35 years) means that the model is sensitive to initialisation conditions ie the model state at the end of a 40 year run can be highly dependent upon the number and size of plants at the beginning of the run. The model is also highly sensitive to the livestock species (cattle or sheep). When comparing effects between sites, the model was run with 100% cattle. The paddock configuration used for all runs was 1000 ha of uplands and 1 ha of high quality habitat surrounding watering points. The rationale for this was that there is a bore-capping program in place in Queensland at present, and bore drains are only present in Queensland. Thus, the most relevant scenario to use is one in which there is a limited number of watering points in the paddock that provide moist habitat for prickly acacia. All model runs were initialised with the same number of adult plants. The chosen initial adult plant densities simulate a moderately invaded paddock in the

11
Mitchell Grass Downs. This provides a basis for the population reaching a dominance level (basal area density) that is limited by climate at each location. In areas where the initial adult plant density cannot be sustained due to climatic conditions, plant mortality is reduced accordingly toward the end of the model run. At more favourable locations the plant can recruit and attain higher densities within the timeframe of the model. A 10 year mean value for selected state variables at the end of the model run can therefore indicate the likely long-term trend in the paddock population under each weather scenario. The climate change scenarios (Table 2.3) were chosen to closely reflect those used in the &/,0(; analysis (Table 2.1). The DYMEX model handles the effects of CO2 on water use efficiency and plant growth rate in a more direct manner than CLIMEX. The rate of increase in evaporation was taken from the (Climate Impact Group 1996). The impact of climate change on rainfall is a poorly understood area of atmospheric research surrounding the enhanced greenhouse effect. To examine the sensitivity of the system to rainfall, scenarios with increases and decreases of 10% were examined.
Table 2.3 Climate change scenarios used in DYMEX analyses
Temperature Rainfall Daily
Evaporation +2°C +10% +3 %/°C +2°C -10% +3 %/°C
It was originally envisaged that we would run the DYMEX model across a 0.5 degree grid of locations across Australia and output summary variables to a GIS for visualisation of the geographical pattern of model response to different climate change scenarios. The length of time required to accomplish this task (i.e. months) proved infeasible with currently available computation power. An attempt will be made to complete this in the future. A key impact of prickly acacia invasion is the reduction in pasture production due to competition. (Mooy et al. 1992) derived a regression equation relating basal area density of prickly acacia to pasture yield. This equation was generated from figures from the Mitchell Grass Downs area. Whilst it is valid and useful to apply this equation within the model when using data from that area, it is not valid across all sites in Australia due to the different pasture productivity under different climatic conditions. However, the general shape of the relationship should hold across all sites ie increased basal area density of prickly acacia leads to significant reductions in pasture yield. 2.3.4 Assessing strategies for adaptation to prickly acacia under climate change The tactical use of fire may provide a cost-effective means of preventing or reducing further recruitment of prickly acacia in infested paddocks (Kriticos et al. 1999b). This is the subject of an ongoing research program by CSIRO Tropical Agriculture, Townsville. The effects of fire on prickly acacia infestations will be included in the model when data becomes available. It has been suggested that capping bores and piping water to fixed water points may be an effective means of reducing the impact of prickly acacia because the trees growing alongside the bore drains typically produce large quantities of seed on a regular basis. The rationale is that by removing the bore drain habitat, the uplands will receive reduced quantities of seed dispersed by livestock and therefore recruitment will be reduced. The likely effects of bore closure will be investigated and reported separately at a later date. There is some evidence that the population-level dynamics of prickly acacia is sensitive to the species of livestock deployed within a paddock (Tiver et al. submitted). This is perhaps reflected in the
12
observations that some graziers do not consider prickly acacia a problem, and others regard it as a net asset (Mackey 1996a; March 1995). The simulated effect of changing the livestock pattern using herds with different proportions of sheep and cattle was investigated using the DYMEX model under a series of climate change scenarios.
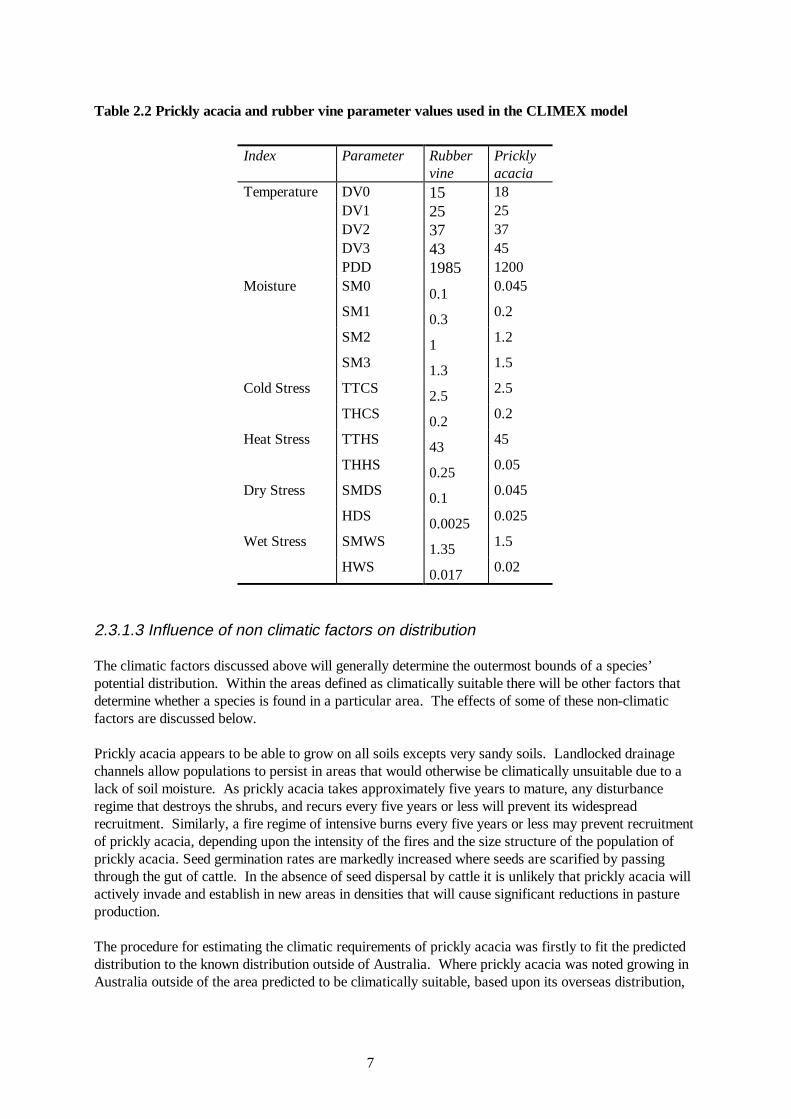
2.4 Rubber Vine Rubber vine Cryptostegia grandiflora Roxb. ex R. Br. was introduced into Australia prior to 1875 as a garden ornamental in several mining towns in north Queensland. The plant spread rapidly and by the early 1900’s had established major populations around Charters Towers, Chillagoe, Georgetown and Rockhampton. It continued to spread and now occupies areas throughout most of Queensland (Figure 2.5). In moist regions it can form extensive infestations, smothering native vegetation. At xeric southern and western locations it is generally found in isolated clumps at moist microsites, or has been deliberately cultivated.
#
#
#
#
#
##
#
Cairns
Boulia
Quilpie
Cooktown
BrisbaneHungerford
Rockhampton
Charleville
Sparse rubber vine
1999 Department of Natural ResourcesStrategic Control Line
Dense rubber vine
Figure 2.5. Australian distribution of rubber vine. Source adapted from Pestinfo system, DNR. Rubber vine has attained weed status due to its ability to form dense monospecific stands that smother native vegetation, especially in riparian habitats. The resulting reduction in biodiversity has caused concern from a conservation perspective. Rubber vine has also attracted criticism because these dense infestations cause reductions in domestic livestock production due to its dominance of the otherwise productive riparian habitat. There are also concerns about the potential for stock poisoning because rubber vine contains several toxic compounds. Four sources of information were used to predict the biotic performance of rubber vine in Australia: its published distribution in the country of origin, Madagascar, its published worldwide distribution, the current distribution of rubber vine in Australia, and finally, some published data on the physiological performance of rubber vine with respect to some climatic factors. The native range of an organism is the most important source of information for CLIMEX analyses. By comparing the range of the organism with climate surfaces we are able to directly infer the response of the population to the climate variables, as opposed to the short-term response to weather sequences.
13
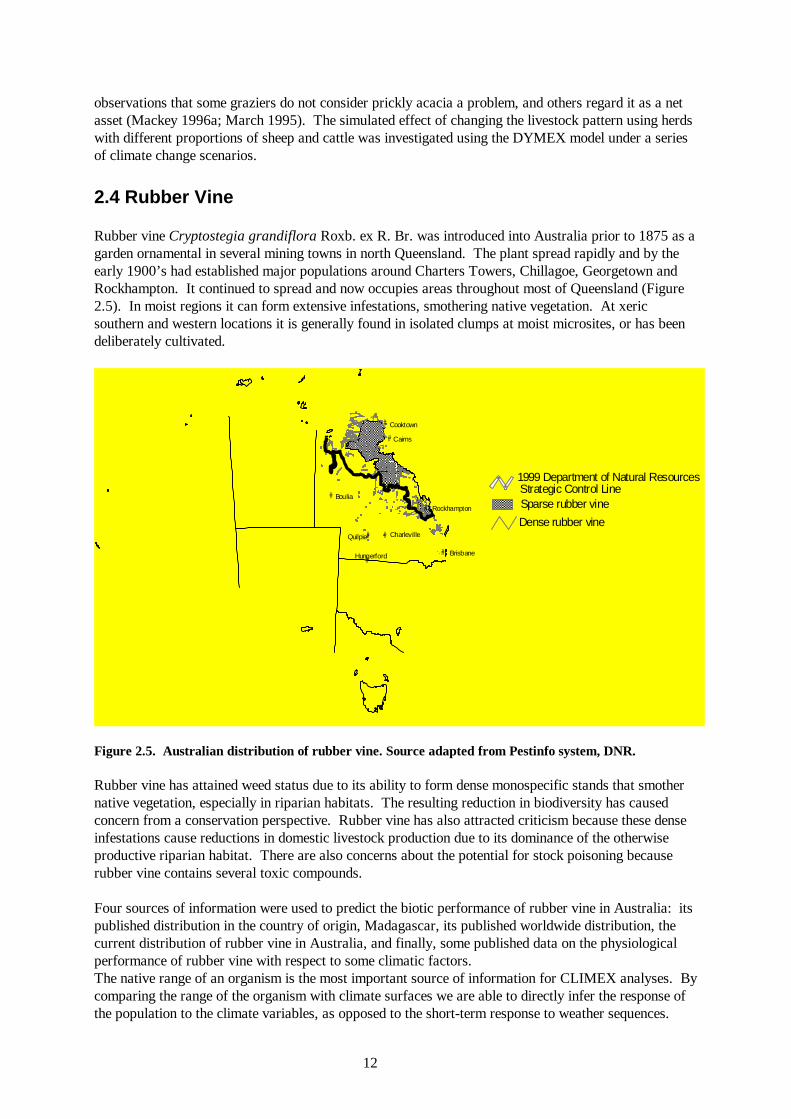
Due to its coarse geographic scale, the world distribution by country information can only be used for a coarse verification of the model. Ideally, the Australian distribution would only used for validation of the model. However, because of the lack of knowledge of the exact climate preferences of rubber vine to some climate variables, it was necessary to include consideration of the Australian distribution of the plant in building the model. The use of reported physiological responses of the plant to weather conditions is complicated by the relationship between short-term weather variables and long-term climate averages. 2.4.1 Present distribution of rubber vine 2.4.1.1 Worldwide The global distribution of rubber vine is shown in Figure 2.6. It is primarily tropical, but extends into equatorial and sub-tropical regions.
Figure 2.6 Worldwide distribution of rubber vine (Jenkins 1944; Tomley 1995). Shaded areas indicate countries with rubber vine, not actual territory occupied. 2.4.1.2 Madagascar The climate of Madagascar in the natural range of rubber vine is characteristically dry tropical with a highly pronounced summer bias in the rainfall. It is important to note that Madagascar is a relatively small landmass, and has a limited amount of climatic variation. This means that rubber vine probably cannot fully express its climatic preferences. This limitation is most likely to be evident in the ability of the plant to survive drier climates than are present in Madagascar because the end of the climatic gradient across the range of rubber vine is limited by sea. The existence of the congeneric Cryptostegia madagascariensis Decne. within the northern range of Cryptostegia grandiflora provides a complication in the analysis. In Madagascar there is a distinct north-south rainfall gradient along the western coast. It is likely that C. madagascariensis is better able to tolerate the wetter conditions to the north, and outcompetes C. grandiflora. In the absence of this competition it is likely that C. grandiflora could persist in moister conditions than it has been noted occupying in Madagascar.
14
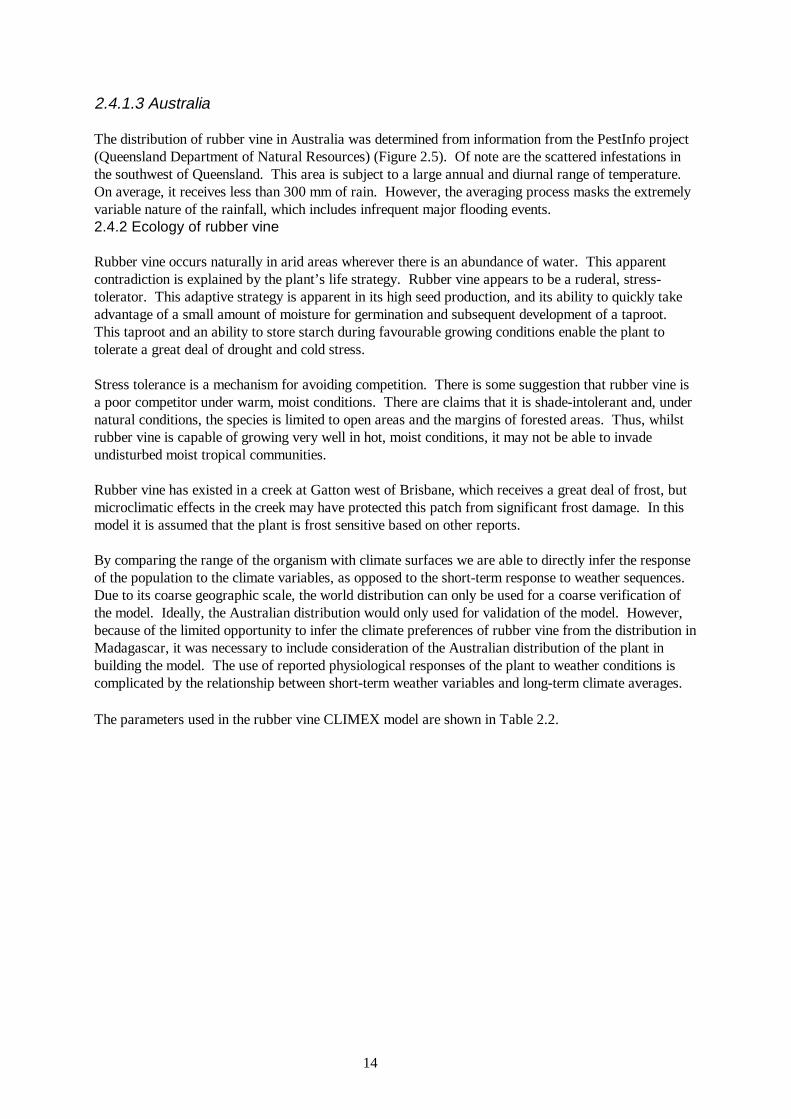
2.4.1.3 Australia The distribution of rubber vine in Australia was determined from information from the PestInfo project (Queensland Department of Natural Resources) (Figure 2.5). Of note are the scattered infestations in the southwest of Queensland. This area is subject to a large annual and diurnal range of temperature. On average, it receives less than 300 mm of rain. However, the averaging process masks the extremely variable nature of the rainfall, which includes infrequent major flooding events. 2.4.2 Ecology of rubber vine Rubber vine occurs naturally in arid areas wherever there is an abundance of water. This apparent contradiction is explained by the plant’s life strategy. Rubber vine appears to be a ruderal, stress-tolerator. This adaptive strategy is apparent in its high seed production, and its ability to quickly take advantage of a small amount of moisture for germination and subsequent development of a taproot. This taproot and an ability to store starch during favourable growing conditions enable the plant to tolerate a great deal of drought and cold stress. Stress tolerance is a mechanism for avoiding competition. There is some suggestion that rubber vine is a poor competitor under warm, moist conditions. There are claims that it is shade-intolerant and, under natural conditions, the species is limited to open areas and the margins of forested areas. Thus, whilst rubber vine is capable of growing very well in hot, moist conditions, it may not be able to invade undisturbed moist tropical communities. Rubber vine has existed in a creek at Gatton west of Brisbane, which receives a great deal of frost, but microclimatic effects in the creek may have protected this patch from significant frost damage. In this model it is assumed that the plant is frost sensitive based on other reports. By comparing the range of the organism with climate surfaces we are able to directly infer the response of the population to the climate variables, as opposed to the short-term response to weather sequences. Due to its coarse geographic scale, the world distribution can only be used for a coarse verification of the model. Ideally, the Australian distribution would only used for validation of the model. However, because of the limited opportunity to infer the climate preferences of rubber vine from the distribution in Madagascar, it was necessary to include consideration of the Australian distribution of the plant in building the model. The use of reported physiological responses of the plant to weather conditions is complicated by the relationship between short-term weather variables and long-term climate averages. The parameters used in the rubber vine CLIMEX model are shown in Table 2.2.
15
3 Results Experience with ecological analyses at the CRC for Tropical Pest Management has shown that it is invaluable to investigate the broad response of any species, using the CLIMEX model, before proceeding to detailed biological observations or modelling. The CLIMEX results define the climatic context into which detailed observations can be placed. Therefore CLIMEX was applied to each of the woody weeds prior to building the mechanistic model of prickly acacia. These results were also found to be useful as a validation tool to check the results of the simulation modelling.
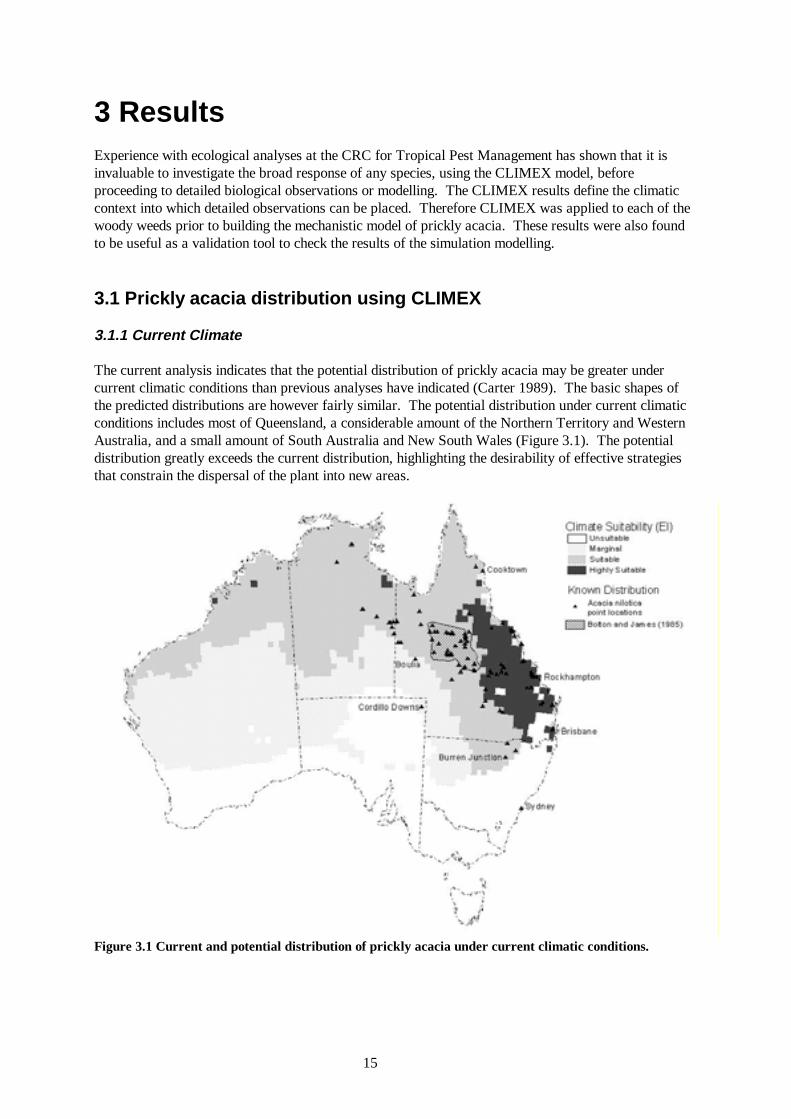
3.1 Prickly acacia distribution using CLIMEX 3.1.1 Current Climate The current analysis indicates that the potential distribution of prickly acacia may be greater under current climatic conditions than previous analyses have indicated (Carter 1989). The basic shapes of the predicted distributions are however fairly similar. The potential distribution under current climatic conditions includes most of Queensland, a considerable amount of the Northern Territory and Western Australia, and a small amount of South Australia and New South Wales (Figure 3.1). The potential distribution greatly exceeds the current distribution, highlighting the desirability of effective strategies that constrain the dispersal of the plant into new areas.
Figure 3.1 Current and potential distribution of prickly acacia under current climatic conditions.
16
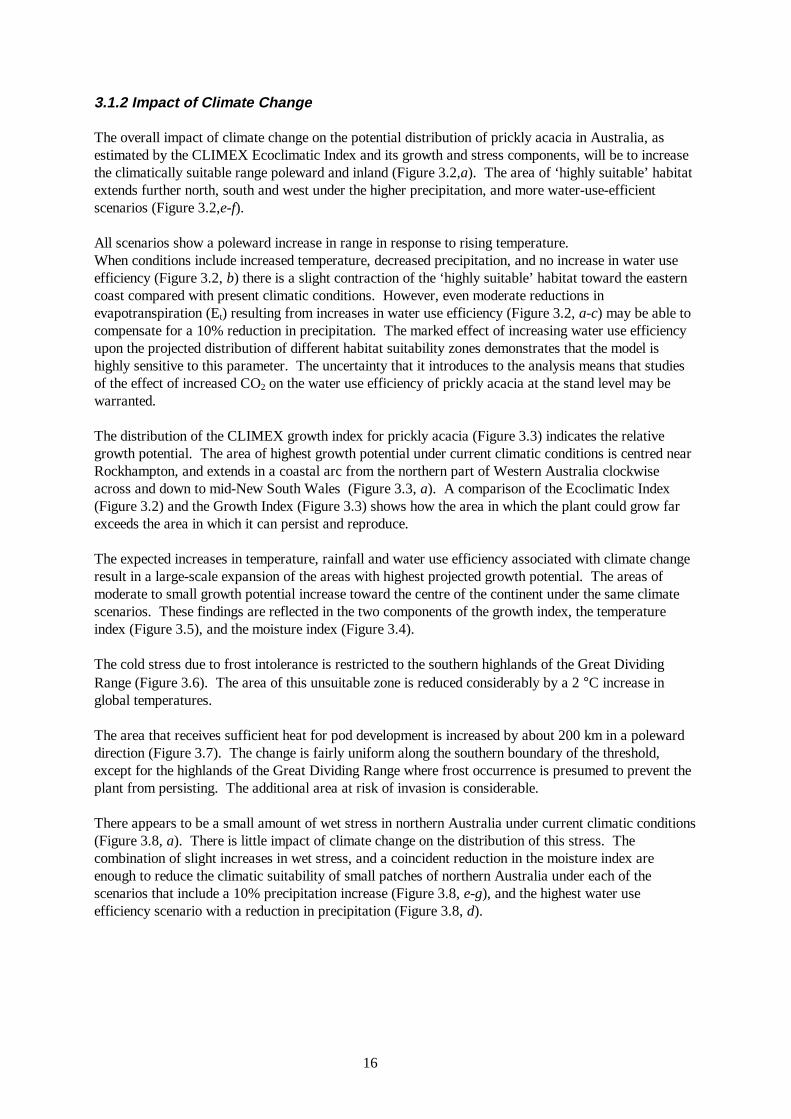
3.1.2 Impact of Climate Change The overall impact of climate change on the potential distribution of prickly acacia in Australia, as estimated by the CLIMEX Ecoclimatic Index and its growth and stress components, will be to increase the climatically suitable range poleward and inland (Figure 3.2,a). The area of ‘highly suitable’ habitat extends further north, south and west under the higher precipitation, and more water-use-efficient scenarios (Figure 3.2,e-f). All scenarios show a poleward increase in range in response to rising temperature. When conditions include increased temperature, decreased precipitation, and no increase in water use efficiency (Figure 3.2, b) there is a slight contraction of the ‘highly suitable’ habitat toward the eastern coast compared with present climatic conditions. However, even moderate reductions in evapotranspiration (Et) resulting from increases in water use efficiency (Figure 3.2, a-c) may be able to compensate for a 10% reduction in precipitation. The marked effect of increasing water use efficiency upon the projected distribution of different habitat suitability zones demonstrates that the model is highly sensitive to this parameter. The uncertainty that it introduces to the analysis means that studies of the effect of increased CO2 on the water use efficiency of prickly acacia at the stand level may be warranted. The distribution of the CLIMEX growth index for prickly acacia (Figure 3.3) indicates the relative growth potential. The area of highest growth potential under current climatic conditions is centred near Rockhampton, and extends in a coastal arc from the northern part of Western Australia clockwise across and down to mid-New South Wales (Figure 3.3, a). A comparison of the Ecoclimatic Index (Figure 3.2) and the Growth Index (Figure 3.3) shows how the area in which the plant could grow far exceeds the area in which it can persist and reproduce. The expected increases in temperature, rainfall and water use efficiency associated with climate change result in a large-scale expansion of the areas with highest projected growth potential. The areas of moderate to small growth potential increase toward the centre of the continent under the same climate scenarios. These findings are reflected in the two components of the growth index, the temperature index (Figure 3.5), and the moisture index (Figure 3.4). The cold stress due to frost intolerance is restricted to the southern highlands of the Great Dividing Range (Figure 3.6). The area of this unsuitable zone is reduced considerably by a 2 °C increase in global temperatures. The area that receives sufficient heat for pod development is increased by about 200 km in a poleward direction (Figure 3.7). The change is fairly uniform along the southern boundary of the threshold, except for the highlands of the Great Dividing Range where frost occurrence is presumed to prevent the plant from persisting. The additional area at risk of invasion is considerable. There appears to be a small amount of wet stress in northern Australia under current climatic conditions (Figure 3.8, a). There is little impact of climate change on the distribution of this stress. The combination of slight increases in wet stress, and a coincident reduction in the moisture index are enough to reduce the climatic suitability of small patches of northern Australia under each of the scenarios that include a 10% precipitation increase (Figure 3.8, e-g), and the highest water use efficiency scenario with a reduction in precipitation (Figure 3.8, d).

17
Figure 3.2 CLIMEX Climate suitability (Ecoclimatic Index) for prickly acacia under different climate scenarios. $� &XUUHQW FOLPDWH� %� �R& LQFUHDVH LQ WHPSHUDWXUH� ��� GHFUHDVH LQ SUHFLSLWDWLRQ� (W ���� &� �R& LQFUHDVH LQ
WHPSHUDWXUH� ��� GHFUHDVH LQ SUHFLSLWDWLRQ� (W ���� '� �°& LQFUHDVH LQ WHPSHUDWXUH� ��� GHFUHDVH LQ SUHFLSLWDWLRQ� (W
���� (� �R& LQFUHDVH LQ WHPSHUDWXUH� ��� LQFUHDVH LQ SUHFLSLWDWLRQ� (W ���� )� � �R& LQFUHDVH LQ WHPSHUDWXUH� ��� LQFUHDVH
LQ SUHFLSLWDWLRQ� (W ���� *� � �R& LQFUHDVH LQ WHPSHUDWXUH� ��� LQFUHDVH LQ SUHFLSLWDWLRQ� (W ����
18
Figure 3.3 CLIMEX Growth Index (GI) for prickly acacia in Australia. Scenarios as for Figure 3.2.

19
Figure 3.4 CLIMEX Moisture Index (MI) for prickly acacia in Australia. Scenarios as for Figure 3.2.

20
Figure 3.5 CLIMEX Temperature Index (TI) for prickly acacia in Australia. A, current climate; B, 2 °C increase in global temperature.
Figure 3.6 CLIMEX Cold Stress (CS) for prickly acacia in Australia. A, current climate; B, 2 °C increase in global temperature.
Figure 3.7 CLIMEX Thermal Accumulation (accumulated degree-days, PDD). A, current climate; B, 2 °C increase in global temperature Dry stress is increased by reductions in precipitation (Figure 3.9, b) compared with current conditions. As with the moisture index and growth index, moderate increases in water use efficiency can compensate for the reduction in precipitation (Figure 3.9, c). Any increase in precipitation or increase in water use efficiency reduces the area in which prickly acacia would suffer even moderate dry stress.

21
Figure 3.8 CLIMEX Wet Stress (WS) for prickly acacia in Australia. Scenarios as for Figure 3.1.

22
Figure 3.9 CLIMEX Dry Stress (DS) for prickly acacia in Australia. Scenarios as for Figure 3.2.

23
3.2 Rubber vine distribution using CLIMEX Rubber vine originates from Madagascar and that distribution was used to estimate the CLIMEX parameter values. This resulted in the predicted bioclimatic limits of rubber vine in its country of origin exceeding its known natural distribution in that country. The existence of non-climatic factors restricting its distribution in Madagascar is the most likely explanation for the discrepancy between the observed and the predicted distributions. Caution is required when interpreting the results of the bioclimatic analysis presented below. Whilst the predicted climatic suitability is based upon the best available knowledge, there is also a considerable amount of uncertainty regarding the species tolerance to some climatic factors. The limited range of climates in Madagascar and likely low sampling density of the original distribution records, combined with the smoothing effects inherent in the use of long-term average data, which is increased when using interpolated climate surfaces to create ‘grid’ output, are responsible for this uncertainty. 3.2.1 Potential distribution of rubber vine under current conditions The predicted global potential distribution of rubber vine is presented in Figure 3.10. This potential distribution is characteristically tropical, extending into sub-tropical, semi-arid and equatorial areas. It compares favourably with the known distribution of the plant by country from published sources; correctly predicting suitable habitat for all known occurrences of the plant at the country level of resolution. This indicates that the predicted distribution is a fair representation of the data.
Figure 3.10 Modelled global climatic suitability (Ecoclimatic Index) for rubber vine The predicted potential distribution of rubber vine in Australia is presented in Figure 3.11. This differs somewhat from previous analyses primarily in the extension of the southern and southwestern borders. The present result is supported by the discovery of several healthy specimens in Quilpie shire, Charleville and Roma. Specimens have also been discovered in Boulia near the central western border of Queensland, and in Hungerford on the southern border of Queensland

24
Figure 3.11 Modelled Australian climatic suitability (Ecoclimatic Index) for rubber vine
3.2.2 Impact of climate change
The overall impact of climate change upon the distribution of rubber vine will be to increase the range poleward and inland, potentially invading all mainland states except Victoria (Figure 3.11). The area of ‘highly suitable’ habitat extends further northward and westward under the wetter and more water use efficient scenarios (Figure 3.12, e-f). This signals that the southern margins of the Wet Tropics World Heritage Area and the northern section of the Great Dividing Range may come under more intense invasion pressure from rubber vine in the future. The potential distribution is very sensitive to alterations in the water use efficiency due to increasing CO2. All scenarios show a poleward increase in range. Increasing temperatures with decreasing moisture availability and no increase in water use efficiency (Figure 3.12, b) results in a contraction of the highly suitable habitat toward the coast around Rockhampton, compared with present climatic conditions. Increasing water use efficiency, i.e. Figure 3.12, b to c to d and e to f to g has a very large effect upon the distribution of different habitat suitability zones. The distribution of the growth index for rubber vine (Figure 3.13) indicates where it could grow in the absence of climatic stresses and minimum thermal accumulation requirements. The area of highest growth potential under current conditions is centred near Rockhampton. It grows in a predominantly south, and westward direction as temperatures, rainfall and water use efficiency increase. The areas of moderate to small growth potential increase toward the centre of the continent under the same climate scenarios. These findings are reflected in the two components of the growth index, the moisture index (Figure 3.14) and the temperature index (Figure 3.15). The cold stress due to frost intolerance is restricted to the southern highlands of the Great Dividing Range (Figure 3.16). The area of this zone is reduced very little by a 2 °C increase in global temperatures. The area that receives sufficient heat for pod development is increased slightly in a poleward direction (Figure 3.17). The change is fairly uniform along the southern boundary of the threshold, except for the highlands of the Great Dividing Range where frost occurrence also prevents the plant from persisting.

25
Figure 3.12 CLIMEX Climate suitability (Ecoclimatic Index) for rubber vine under different climate scenarios. $� &XUUHQW FOLPDWH� %� �R& LQFUHDVH LQ WHPSHUDWXUH� ��� GHFUHDVH LQ SUHFLSLWDWLRQ� (W ���� &� �R& LQFUHDVH LQ
WHPSHUDWXUH� ��� GHFUHDVH LQ SUHFLSLWDWLRQ� (W ���� '� �°& LQFUHDVH LQ WHPSHUDWXUH� ��� GHFUHDVH LQ SUHFLSLWDWLRQ�
(W ���� (� �R& LQFUHDVH LQ WHPSHUDWXUH� ��� LQFUHDVH LQ SUHFLSLWDWLRQ� (W ���� )� � �R& LQFUHDVH LQ WHPSHUDWXUH�
��� LQFUHDVH LQ SUHFLSLWDWLRQ� (W ���� *� � �R& LQFUHDVH LQ WHPSHUDWXUH� ��� LQFUHDVH LQ SUHFLSLWDWLRQ� (W ����
26
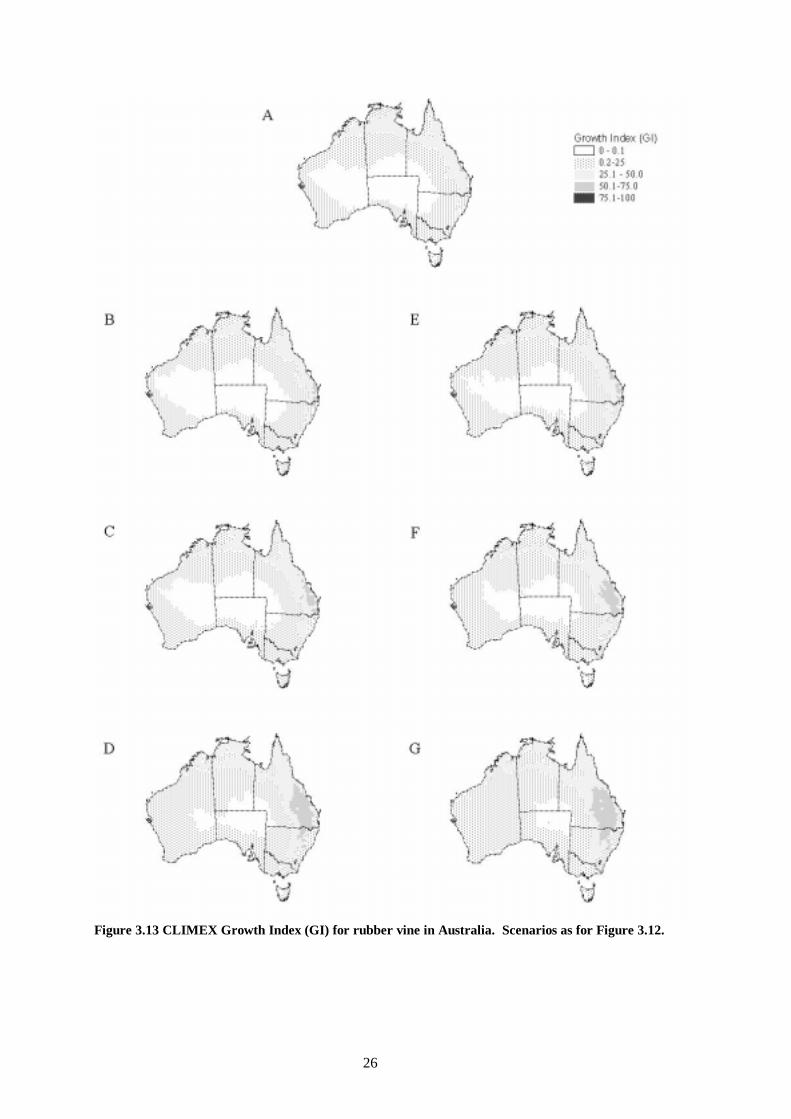
Figure 3.13 CLIMEX Growth Index (GI) for rubber vine in Australia. Scenarios as for Figure 3.12.
27
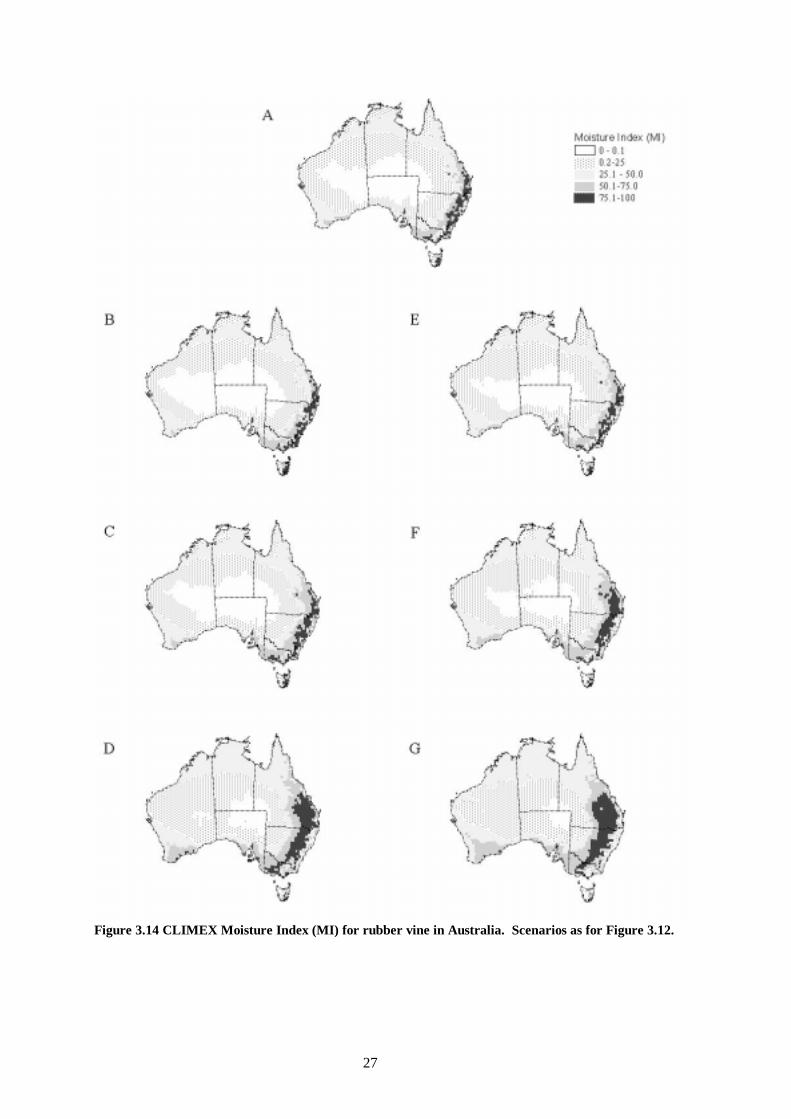
Figure 3.14 CLIMEX Moisture Index (MI) for rubber vine in Australia. Scenarios as for Figure 3.12.

28
Figure 3.15 CLIMEX Temperature Index (TI) for rubber vine in Australia. A, current climate; B, 2 °C increase in global temperature.
Figure 3.16 CLIMEX Cold Stress (CS) for rubber vine in Australia. A, current climate; B, 2 °C increase in global temperature
Figure 3.17 CLIMEX Thermal Accumulation (accumulated degree-days, PDD) for rubber vine in Australia. A, current climate; B, 2 °C increase in global temperature There appears to be a small amount of wet stress in northern Australia under current climatic conditions (Figure 3.18, a). There is little impact of climate change on the distribution of this stress. The combination of slight increases in wet stress, and a coincident reduction in the moisture index are enough to reduce the climatic suitability of small patches of northern Australia under each of the scenarios that include a 10% precipitation increase (Figure 3.18,e-g), and the highest water use efficiency scenario with a reduction in precipitation (Figure 3.18, d).

29
Figure 3.18 CLIMEX Wet Stress (WS) for rubber vine in Australia. Scenarios as for Figure 3.12.

30
Figure 3.19 CLIMEX Dry Stress (DS) for rubber vine in Australia. Scenarios as for Figure 3.12.
Figure 3 10 Climate suitability (Ecoclimatic Index) under different climate scenarios A) Current
31
3.3 Prickly acacia population dynamics and management using the DYMEX model
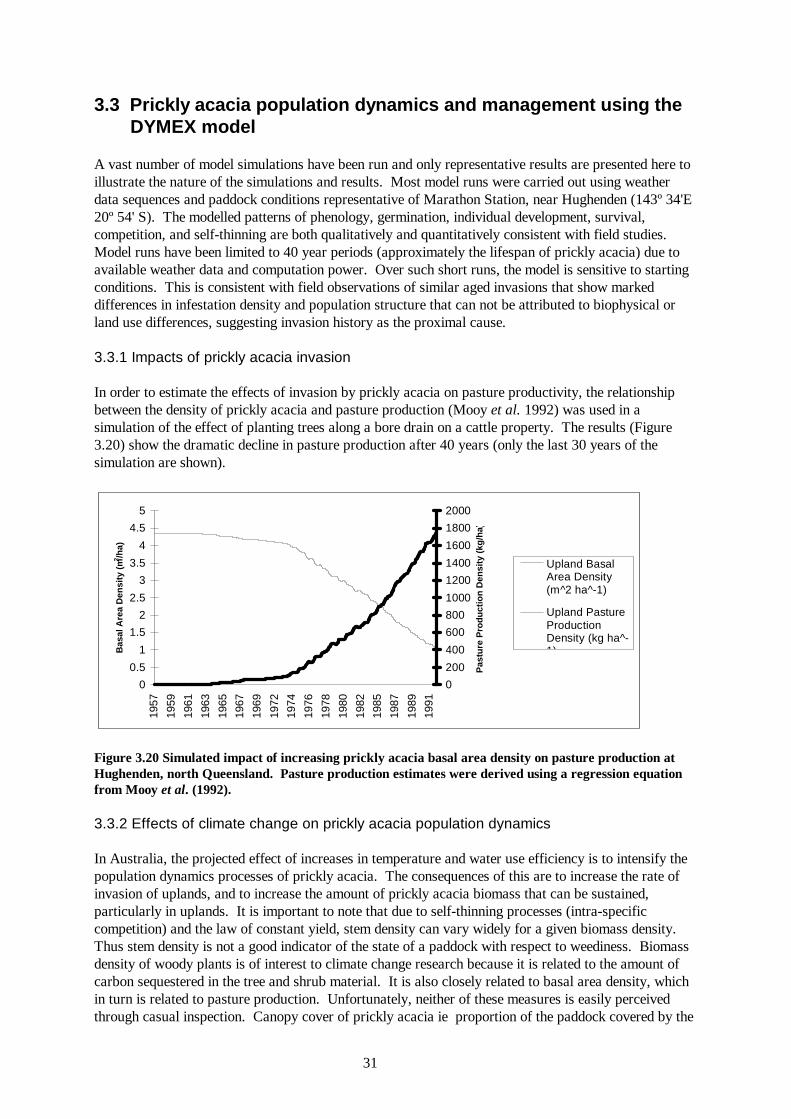
A vast number of model simulations have been run and only representative results are presented here to illustrate the nature of the simulations and results. Most model runs were carried out using weather data sequences and paddock conditions representative of Marathon Station, near Hughenden (143º 34'E 20º 54' S). The modelled patterns of phenology, germination, individual development, survival, competition, and self-thinning are both qualitatively and quantitatively consistent with field studies. Model runs have been limited to 40 year periods (approximately the lifespan of prickly acacia) due to available weather data and computation power. Over such short runs, the model is sensitive to starting conditions. This is consistent with field observations of similar aged invasions that show marked differences in infestation density and population structure that can not be attributed to biophysical or land use differences, suggesting invasion history as the proximal cause. 3.3.1 Impacts of prickly acacia invasion In order to estimate the effects of invasion by prickly acacia on pasture productivity, the relationship between the density of prickly acacia and pasture production (Mooy et al. 1992) was used in a simulation of the effect of planting trees along a bore drain on a cattle property. The results (Figure 3.20) show the dramatic decline in pasture production after 40 years (only the last 30 years of the simulation are shown).
0
0.5
1
1.5
2
2.5
3
3.5
4
4.5
5
1957
1959
1961
1963
1965
1967
1969
1972
1974
1976
1978
1980
1982
1985
1987
1989
1991
Bas
al A
rea
Den
sity
(m
2 /ha)
0
200
400
600
800
1000
1200
1400
1600
1800
2000
Pas
ture
Pro
duct
ion
Den
sity
(kg
/ha
)
Upland BasalArea Density(m^2 ha^-1)
Upland PastureProductionDensity (kg ha^-1)
Figure 3.20 Simulated impact of increasing prickly acacia basal area density on pasture production at Hughenden, north Queensland. Pasture production estimates were derived using a regression equation from Mooy et al. (1992). 3.3.2 Effects of climate change on prickly acacia population dynamics In Australia, the projected effect of increases in temperature and water use efficiency is to intensify the population dynamics processes of prickly acacia. The consequences of this are to increase the rate of invasion of uplands, and to increase the amount of prickly acacia biomass that can be sustained, particularly in uplands. It is important to note that due to self-thinning processes (intra-specific competition) and the law of constant yield, stem density can vary widely for a given biomass density. Thus stem density is not a good indicator of the state of a paddock with respect to weediness. Biomass density of woody plants is of interest to climate change research because it is related to the amount of carbon sequestered in the tree and shrub material. It is also closely related to basal area density, which in turn is related to pasture production. Unfortunately, neither of these measures is easily perceived through casual inspection. Canopy cover of prickly acacia ie proportion of the paddock covered by the
32
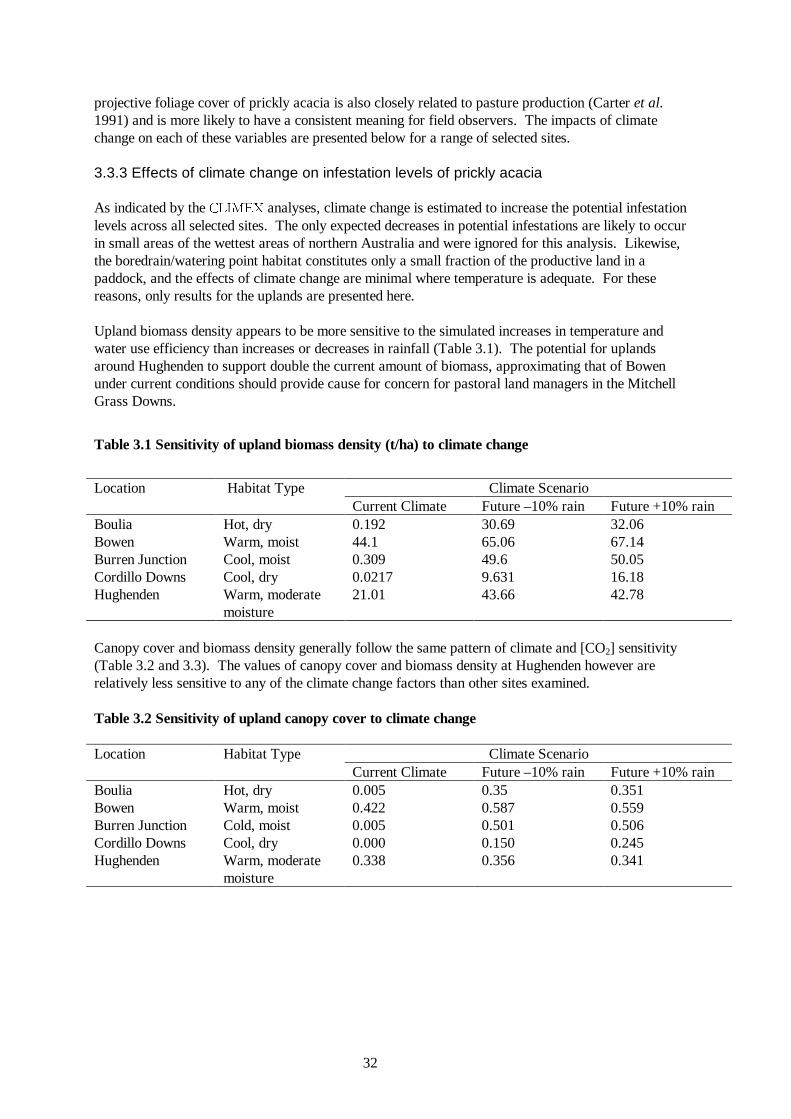
projective foliage cover of prickly acacia is also closely related to pasture production (Carter et al. 1991) and is more likely to have a consistent meaning for field observers. The impacts of climate change on each of these variables are presented below for a range of selected sites. 3.3.3 Effects of climate change on infestation levels of prickly acacia As indicated by the &/,0(; analyses, climate change is estimated to increase the potential infestation levels across all selected sites. The only expected decreases in potential infestations are likely to occur in small areas of the wettest areas of northern Australia and were ignored for this analysis. Likewise, the boredrain/watering point habitat constitutes only a small fraction of the productive land in a paddock, and the effects of climate change are minimal where temperature is adequate. For these reasons, only results for the uplands are presented here. Upland biomass density appears to be more sensitive to the simulated increases in temperature and water use efficiency than increases or decreases in rainfall (Table 3.1). The potential for uplands around Hughenden to support double the current amount of biomass, approximating that of Bowen under current conditions should provide cause for concern for pastoral land managers in the Mitchell Grass Downs.
Table 3.1 Sensitivity of upland biomass density (t/ha) to climate change
Climate Scenario Location Habitat Type
Current Climate Future –10% rain Future +10% rain Boulia Hot, dry 0.192 30.69 32.06 Bowen Warm, moist 44.1 65.06 67.14 Burren Junction Cool, moist 0.309 49.6 50.05 Cordillo Downs Cool, dry 0.0217 9.631 16.18 Hughenden Warm, moderate
moisture 21.01 43.66 42.78
Canopy cover and biomass density generally follow the same pattern of climate and [CO2] sensitivity (Table 3.2 and 3.3). The values of canopy cover and biomass density at Hughenden however are relatively less sensitive to any of the climate change factors than other sites examined. Table 3.2 Sensitivity of upland canopy cover to climate change
Climate Scenario Location Habitat Type Current Climate Future –10% rain Future +10% rain
Boulia Hot, dry 0.005 0.35 0.351 Bowen Warm, moist 0.422 0.587 0.559 Burren Junction Cold, moist 0.005 0.501 0.506 Cordillo Downs Cool, dry 0.000 0.150 0.245 Hughenden Warm, moderate
moisture 0.338 0.356 0.341
33
Table 3.3 Sensitivity of upland basal area density (m2/ha) to climate change
Climate Scenario Location Habitat Type Current Climate Future -10% rain Future +10% rain
Boulia Hot, dry 0.070 5.149 5.159 Bowen Warm, moist 6.211 8.7 8.259 Burren Junction Cold, moist 0.075 7.429 7.355 Cordillo Downs Cool, dry 0.004 2.206 3.609 Hughenden Warm, moderate
moisture 4.973 5.223 5.041
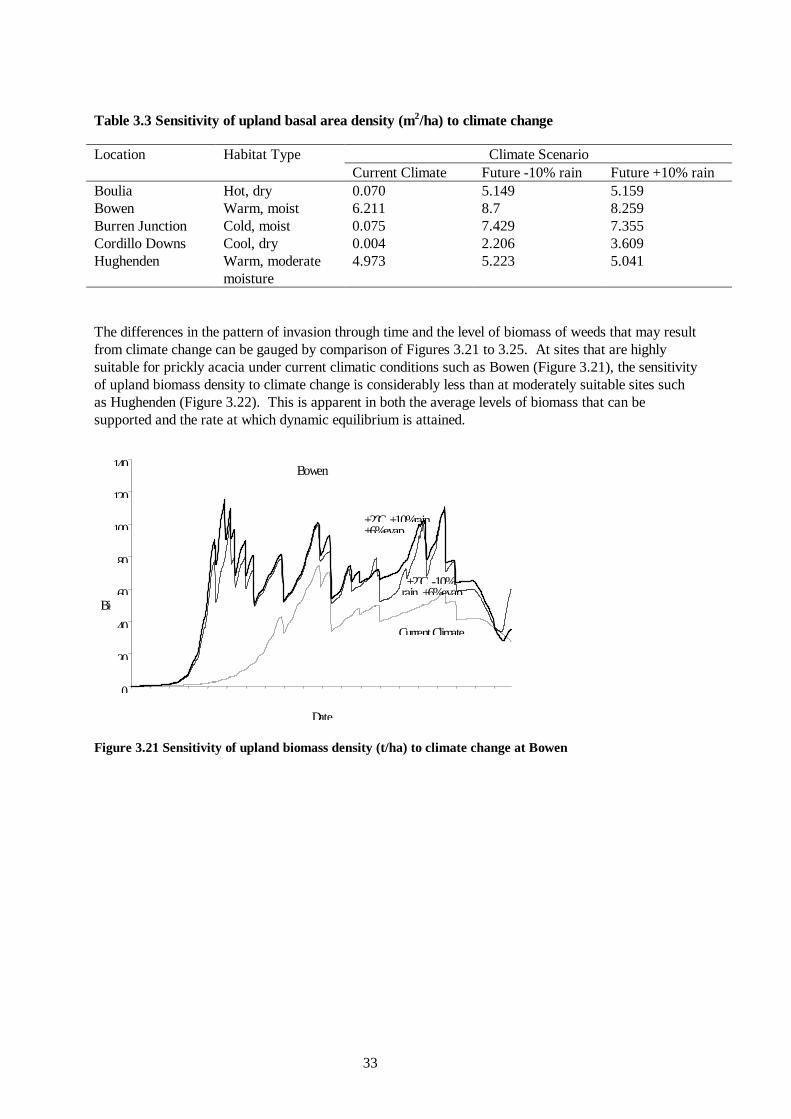
The differences in the pattern of invasion through time and the level of biomass of weeds that may result from climate change can be gauged by comparison of Figures 3.21 to 3.25. At sites that are highly suitable for prickly acacia under current climatic conditions such as Bowen (Figure 3.21), the sensitivity of upland biomass density to climate change is considerably less than at moderately suitable sites such as Hughenden (Figure 3.22). This is apparent in both the average levels of biomass that can be supported and the rate at which dynamic equilibrium is attained.
Bowen
0
20
40
60
80
100
120
140
Date
Bio
CurrentClimate
+2oC -10%rain +6%evap
+2oC +10%rain+6%evap
Figure 3.21 Sensitivity of upland biomass density (t/ha) to climate change at Bowen

34
Hughenden
0
10
20
30
40
50
60
70
J-57
J-59
J-61
J-63
J-65
J-67
J-69
J-71
J-73
J-75
J-77
J-79
J-81
J-83
J-85
J-87
J-89
J-91
J-93
J-95
D
Upl
and
Bio
mas
s D
ensi
ty (
t/ha
)
C
+2oC, -10%rain,+6%evap.
+2oC, +10%rain,+6%evap.
Figure 3.22 Sensitivity of upland biomass density (t/ha) to climate change at Hughenden.
Boulia
0
5
10
15
20
25
30
35
40
45
J-57
J-59
J-61
J-63
J-65
J-67
J-69
J-71
J-73
J-75
J-77
J-79
J-81
J-83
J-85
J-87
J-89
J-91
J-93
J-95
D
Upl
and
Bio
mas
s D
ensi
ty t/
ha
C
+2oC, -10%rain,+6%evap.
+2oC, +10%rain,+6%evap.
Figure 3.23 Sensitivity of upland biomass density (t/ha) to climate change at Boulia
Burren Junction
0
20
40
60
80
100
120
J-57
J-59
J-61
J-63
J-65
J-67
J-69
J-71
J-73
J-75
J-77
J-79
J-81
J-83
J-85
J-87
J-89
J-91
J-93
J-95
D
Upl
and
Bio
mas
s D
ensi
ty (
t/ha
C
+2oC, -10%rain,+6%evap.
+2oC, +10%rain,+6%evap.
Figure 3.24 Sensitivity of upland biomass density (t/ha) to climate change at Burren Junction
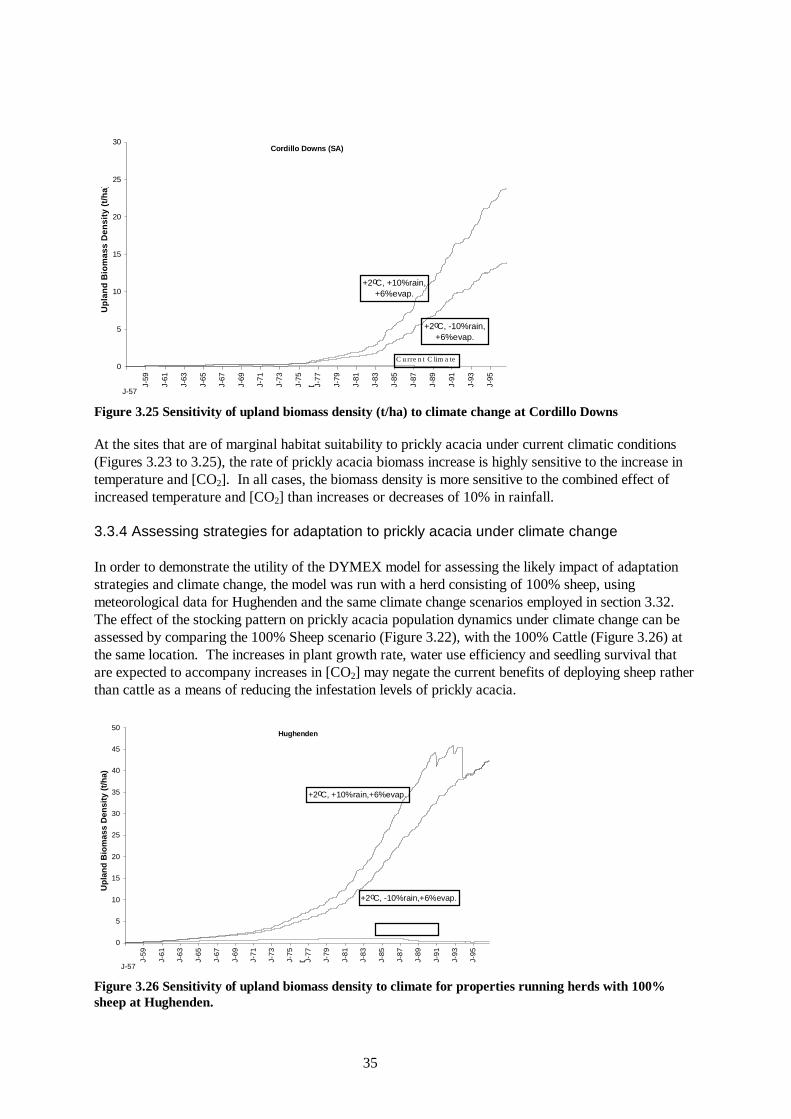
35
Cordillo Downs (SA)
0
5
10
15
20
25
30
J-57
J-59
J-61
J-63
J-65
J-67
J-69
J-71
J-73
J-75
J-77
J-79
J-81
J-83
J-85
J-87
J-89
J-91
J-93
J-95
D
Upl
and
Bio
mas
s D
ensi
ty (
t/ha
)
+2oC, -10%rain,+6%evap.
+2oC, +10%rain,+6%evap.
C u rre n t C lim a te
Figure 3.25 Sensitivity of upland biomass density (t/ha) to climate change at Cordillo Downs At the sites that are of marginal habitat suitability to prickly acacia under current climatic conditions (Figures 3.23 to 3.25), the rate of prickly acacia biomass increase is highly sensitive to the increase in temperature and [CO2]. In all cases, the biomass density is more sensitive to the combined effect of increased temperature and [CO2] than increases or decreases of 10% in rainfall. 3.3.4 Assessing strategies for adaptation to prickly acacia under climate change In order to demonstrate the utility of the DYMEX model for assessing the likely impact of adaptation strategies and climate change, the model was run with a herd consisting of 100% sheep, using meteorological data for Hughenden and the same climate change scenarios employed in section 3.32. The effect of the stocking pattern on prickly acacia population dynamics under climate change can be assessed by comparing the 100% Sheep scenario (Figure 3.22), with the 100% Cattle (Figure 3.26) at the same location. The increases in plant growth rate, water use efficiency and seedling survival that are expected to accompany increases in [CO2] may negate the current benefits of deploying sheep rather than cattle as a means of reducing the infestation levels of prickly acacia.
Hughenden
0
5
10
15
20
25
30
35
40
45
50
J-57
J-59
J-61
J-63
J-65
J-67
J-69
J-71
J-73
J-75
J-77
J-79
J-81
J-83
J-85
J-87
J-89
J-91
J-93
J-95
D
Upl
and
Bio
mas
s D
ensi
ty (
t/ha)
C
+2oC, -10%rain,+6%evap.
+2oC, +10%rain,+6%evap.
Figure 3.26 Sensitivity of upland biomass density to climate for properties running herds with 100% sheep at Hughenden.
36
4 Discussion
4.1 Prickly acacia
From this analysis we can be confident that climate change will greatly increase the area at risk of invasion by prickly acacia. However vulnerability to the climate change impacts is a function of both the sensitivity of the system and its adaptability. These adaptation measures would include any steps taken to limit the spread of prickly acacia into those areas that are currently unsuitable for the plant, and are projected to become suitable under climate change. It would also include any adaptations such as tactical burning of paddocks, altered stocking patterns, or bore control to reduce the potential impact of prickly acacia upon production and conservation values. Of these adaptations, only altered stocking patterns has been investigated here. The results suggest that the current option of increasing the proportion of sheep in a herd to reduce the invasiveness of prickly acacia may not be as useful under future climatic conditions. Thus, even if the relative market value of sheep and cattle was to be reversed compared with recent trends, there may be little benefit to switching herd composition from a weed management perspective.
Whilst most prickly acacia seed is dispersed within the same paddock as the parent plant, a small proportion of seed can be dispersed a great distance away from an infested paddock through the action of transporting livestock to market or agistment. While there are many anecdotal examples of this occurring, the frequency with which prickly acacia is dispersed in this manner remains unknown. The disproportionately high value of even very low frequency, long-distance dispersal events for rapid plant migration has been highlighted in the scientific literature (Clark et al. 1998). This in turn suggests that a high priority be placed upon the early identification and eradication or containment of any outlying populations of prickly acacia. Otherwise so-called ‘sleeper’ or benign populations could become major invasion foci in the future.
There may be populations of prickly acacia in northern New South Wales and southern Queensland that, due to a lack of sufficient heat accumulation, are presently not considered a problem because they seldom if ever produce viable seedpods. The expected future increase in global temperatures may allow these populations to start producing sufficient seeds to become a weed problem in this region. Money spent on education of land managers to the threat of prickly acacia and eradication of currently benign populations of prickly acacia in these southern areas would be worthy of consideration.
Simple paddock quarantine procedures may provide a cheap, simple means of controlling the spread of prickly acacia between livestock paddocks. This simple set of procedures could ensure that prickly acacia never reaches its potential distribution under current climatic conditions, let alone the increased range afforded by expected climate changes. The increased growth potential of the plant within its current range suggests that production costs in many areas that are currently infested could rise. Better growth conditions will lead to increased seed production. If the increased production results in seedpods lying uneaten on the ground, then extra vigilance may be necessary to control flood-dispersed seedlings. The expected increase in CO2 is likely to increase the probability of survival of seedlings and juveniles, leading to more frequent recruitment. This is likely to increase the rate of paddock invasion for light to moderately infested paddocks.
It has been reported previously that it was uneconomical to harvest prickly acacia for commercial wood-chipping (Thompson 1992). Increases in plant growth and survival rates that accompany climate change could perhaps alter the economic balance. This in turn could offer a means of significantly reducing the cost of mechanical control of mature trees. Likewise, increased growth potential could also offer the opportunity of mixing pastoral and agro-forestry activities on the same land with a view to creating a carbon sink to mitigate the effects of increasing [CO2]. Consideration of potential biodiversity impacts and significant modification of current policies will of course be essential if such an enterprise is to be supported by Government agencies. Under this scenario, the standing biomass of prickly acacia could be traded on an open carbon futures market to offset carbon dioxide production elsewhere in the
37
economy. The value of the biomass would depend upon the degree to which the carbon was stabilised. If the trees were harvested and put to use in a manner that significantly reduced the decay rate, then it would have greater value than standing biomass that was left to decay in the paddock when the trees died. The emergence of carbon futures trading markets promises to raise some challenging economic and ethical challenges for range management generally, and woody weed management specifically.
4.2 Adaptation responses to rubber vine The Queensland Government has already developed a strategic response to rubber vine that involves a campaign of chemical eradication of the plant beyond a defined line, and the introduction of biological control agents to reduce the potential invasiveness and impact of the plant generally (Mackey 1996). It is unclear how effective this strategy is likely to be even under current climatic conditions. What is clear is that climate change is increasing the area at risk of invasion by this plant. Whilst most rubber vine seed disperses directly beneath the canopy of the parent plant, a small proportion of seed can be dispersed a great distance away through the action of wind or water. The value of these low frequency, long distance dispersal events for rapid plant migration has been highlighted. This in turn suggests that a high priority be placed upon the early identification and eradication of any outlying populations of rubber vine. Otherwise so-called ‘sleeper’ populations could become major invasion foci in the future. Efforts that reduce the rate of seed production may also reduce the invasion velocity.
4.3 Adaptation responses to prickly acacia The areas predicted to be climatically unsuitable for prickly acacia within Queensland provide an excellent opportunity to test the validity of the model. Deliberate planting of scarified seeds and seedlings in areas predicted to be climatically unsuitable for this species can help validate the model further. The seeds and seedlings should of course be planted in stockproof exclosures to help ensure that pods are not consumed by livestock and spread beyond the experimental area. Investigations using the &/,0(; and DYMEX models suggest that much more of Western Australia, Northern Territory, New South Wales and to a lesser extent South Australia will be under threat of invasion by prickly acacia under a future climate regime (enhanced greenhouse effect) compared to the present threat. Thus, investigating the potential risk of invasion by this species should also be of interest to the responsible administrative bodies in these states. Prickly acacia has also been recognised as a weed of national significance, requiring a coordinated and cooperative approach to the development and implementation of a suitable management plan that recognises the climate change sensitivities. This analysis predicts that most of northern Australia is under threat of invasion by prickly acacia under present climatic conditions. It also shows that the system is quite sensitive to increases in temperature, rainfall and water use efficiency. The costs of developing and implementing a plan to adapt to the increased potential distribution of prickly acacia to the south and toward the centre of the continent are likely to be very similar to dealing with the continued invasion potential under current climatic conditions. That prickly acacia dispersal between paddocks appears largely confined to deliberate planting and livestock movement means that further spread between paddocks may be cheaply arrested through public education, paddock hygiene procedures and perhaps market economic signals that penalise properties infected with prickly acacia. The pattern of paddock invasion in the presence of cattle is such that in all but perhaps the most marginal habitat, prickly acacia populations will rapidly grow to levels that cannot be economically contained using current approaches (Kriticos et al. 1999b). Only low-cost-per-hectare control methods such as fire or biological control may be economical to control these populations on extensive pastoral enterprises. This reinforces the desirability of developing strategies to prevent the spread of prickly acacia between paddocks.

38
If such spread could be prevented using cheap techniques such as stock confinement in prickly acacia-free holding yards prior to transport off-farm, then the costs of adapting to climate change would be negligible. This strategy would also have the added benefit of limiting the spread of other endozoochorous woody weeds such as mesquite (Prosopis spp.) and Parkinsonia (Parkinsonia aculeata).
39
5 Implications The principle objective of the project was to evaluate the available methods for impact assessment of weeds under climate change, using two case studies of different woody weeds. The current project revealed weaknesses in process-based models in that data are rarely collected on those processes that limit populations near the edges of their geographical distributions. Most data is collected only where the species is common. When considering impacts of climate change, this becomes a major issue because of the geographical scale that is necessary. The development of a process-based model of prickly acacia revealed that despite a plethora of published material on this plant (Fagg and Greaves 1990), there remain many important areas of the plant’s ecology and biology that have not been investigated. The systematic framework provided by a population model highlighted these inadequacies. For instance, little is known from experimental data about the relationship between growth factors (soil moisture and air temperature) and growth rates. Population models that are developed as part of a comprehensive research program can therefore help focus the field and experimental research direction toward those aspects of a species behaviour that will lead to a better understanding of the options for better management of the species. These same limitations will need to be addressed if a national approach to integrated pest management (IPM) in general is to be developed. The population model revealed that there were some clear deficiencies in the study of CO2 impacts upon plant growth in particular. For instance, the majority of plant climate change studies have been short-term experiments, involving annual species. Few studies have examined effects of increased CO2 under variable soil moisture and air temperature on the growth rate of mature perennial plants. The conclusion reached is that population models will have to be very advanced and comprehensive to be sufficiently reliable to be used in risk assessments on a national scale. This has given greater impetus to improve the available models in Australia under the national modelling network. In the meantime, it is concluded that the CLIMEX model, which is a simplified, inferential model, is the most appropriate tool for national risk assessments. However, when addressing local impacts and evaluating adaptation options, a process based lifecycle model is necessary. In addition, the IPCC impact assessment framework (Parry and Carter 1998), aimed at deriving estimates of vulnerability rather than just impacts, was found to be very useful and appropriate. The use of sensitivity analyses instead of GCM outputs was based on previous experience. Impact assessments aimed at a particular scenario are limited in their ability to provide a measure of responsiveness of the target industry or region to climate change in general and the results rapidly become dated as the scenarios change. Sensitivity analysis is very useful but suffers from one deficiency in not being able to employ discounting in calculating economic impacts unless a time frame is specified for the changes. When long-range climate change scenarios are used, even low discount rates result in the discounting of future costs to negligible levels. Most costs are therefore accrued in the first few years. Our response was to exclude discounting and opt to provide a generic measure of sensitivity and vulnerability of the system or region being considered. This will be adequate to alert the stakeholders of the sensitive systems to address the issue of climate change.
40
6 Recommendations The following recommendations are aimed at further development of understanding and capacity building in relation to climate change risk assessments for woody weeds in rural industries in Australia. It is recommended that
1. Recognition be given to the need to develop mechanistic models of each of the key species of pests, diseases and weeds in Australia in order to equip the nation to design economically optimal adaptation options for use under current conditions and under future climate change.
2. Steps be taken to initiate a process of developing mechanistic models for each of the key species of woody weed in Australia, including the collection of necessary data to fill knowledge gaps. This is a no-regrets option that is within the nation’s capacity provided that generic modelling tools are used and that the models are used to identify essential new data needs. This will avoid ad hoc and uncoordinated data collection as has happened so often in the past.
3. A systematic process of collation of existing data on biological processes affecting the population dynamics of key species of woody weeds in Australia be instigated at an early date to prepare the nation to manage these severe threats to the productivity and biodiversity of northern Australia. The data could be collated and reviewed using the RIRDC National IPM Modelling Network data collation procedures to identify essential data gaps.
4. Steps be taken to strengthen population modelling capabilities in rural industry research providers, extension agencies and end-users. A start has already been made in this direction with the RIRDC National IPM Modelling Network project, and CSIRO is attempting to introduce secondary students to modelling concepts (now a curriculum item) with the CLIMEX model. These are no-regrets measures that should have beneficial results in the short-term. The initiative will need to include educating tertiary students. The aim would be to inform the various stakeholders on the use and advantages of mechanistic models to explain observable biological phenomena and then to link them to management strategies in order to evaluate the best options under different environmental and economic conditions. Despite the power of modelling techniques (they now even replace the need for nuclear testing) it is still proving difficult to recruit suitably trained graduates in Australia. Training in modelling creates a totally different mindset to that achieved through traditional experimentation.
5. Moves be made to understand the implications of interactive effects, particularly the uncoupling of crop, weed and natural enemy populations. This has the potential to significantly affect the current effectiveness of biological control of some major weeds in different parts of Australia. Indications are that effectiveness will be increased in some areas at the expense of decreases in other areas. If this is not understood it is likely to lead to misinterpretations of changes in the regional status of woody weeds under climate change.
6. Implications of increasing atmospheric concentrations of CO2 on plant-insect interactions also need to be clarified. Changes in the carbon-nitrogen ratios in plant tissues have effects on insect feeding and growth, with variable responses in different taxa. Rural industries need to define the impacts for the specific complex of pests, diseases and weeds on their crop, in order to respond to the inevitable increase in CO2 concentration.
41
7 References Aikman, D.P. and Watkinson, A.R. (1980) A model of growth and self-thinning in even-aged
monocultures of plants. Annals of Botany 45:419-27. Bolton MP, James PA (1985) A survey of Prickly Acacia (Acacia nilotica) in five western Queensland
shires. Report to Stock Routes and Rural Lands Protection Board. Brisbane: Queensland Department of Lands.
Bolton, M.P., Carter, J.O. and Dorney, W.J. (1987) Seed production in Acacia nilotica subsp. indica
(Benth) Brenan. In. Weed Seed Biology Workshop; 1987 Sep; Orange N.S.W. pp 29-34. Carter, J.O. (1989) Potential distribution of prickly acacia. Richmond Prickly Acacia Field Day. p 3-6. Carter J.O., Jones, P. and Cowan D.C. (1991) Control of Woody Weeds in Western Queensland.
Report to the Australian Wool Corporation. (DAQ 25P). Clark, J.S., Fastie, C., Hurtt, G., Jackson, S.T., Johnson, C., King, G.A., Lewis, M., Lynch J., Pacala,
S., Prentice, C., Schupp, E.W., Webb, T. and Wyckoff, P. (1998) Reid's paradox of rapid plant migration. Bioscience. 48(1):13-24.
Climate Impact Group (1996) Climate change scenarios for the Australian region. Melbourne: CSIRO
Division of Atmospheric Research. Fagg, C. W. and Greaves, A. (1990) Acacia nilotica annotated bibliography No. F42. Langton, K. E.,
editor. Walllingford, UK.: C.A.B. International. Farquhar, G. D. (1997) Carbon dioxide and vegetation. Science. 278:1411. Hutchinson, M. F., Houlder, D., Nix, H.A. and McMahon, P. ANUCLIM Version 1.6 [Web Page].
Located at: http://cres.anu.edu.au/software/anuclim.html. Accessed Apr 1999. IPCC (1996) Climate Change 1995: The Science of Climate Change, In Contribution of Working
Group I to the second assessment report of the Intergovernmental Panel on Climate Change. Houghton, J. T., Meira Filho, L. G., Callander, B. A., Harris, N., Kattenberg, A. and Maskell, K. (Eds), Cambridge University Press, Cambridge, 572 pp.
Jenkins, D.W. (1944) Cryptostegia as an emergency source of rubber. United States Board of
Economic Warfare. Technical Bulletin No. 3. Kriticos, D.J. (1997) A climatic analysis of the potential distribution of prickly acacia in Australia: A
report prepared for Land Protection, Queensland Department of Natural Resources. Brisbane, Australia: Cooperative Research Centre for Tropical Pest Management.
Kriticos, D.J., Brown, J.R., Maywald, G.F., Sutherst, R.W. and Adkins, S.W. (1999a) A population
model of Acacia nilotica: A tool for exploring weed management and the effects of climate change. Proceedings of the VI International Rangelands Congress, Townsville Australia.
Kriticos D.J., Brown J.R., Radford I.D., Nicholas M. (1999b) A population model of Acacia nilotica:
Thresholds for Management. Proceedings of the VI International Rangelands Congress Townsville, Australia.
42
Mackey, A. P., (Ed.) (1996) Rubber Vine (Cryptostegia grandiflora) in Queensland. Mackey, A. P.,
Carsten, K., James, P., March, N., Noble, K., Palmer, B., Vitelli, J. and Vitelli, M., (Assessment team). Brisbane: Queensland Department of Natural Resources; (Pest Status Review Series - Land Protection Branch).
March, N. (1995) Woody Weeds Survey: Richmond shire. Unpublished Report, National Landcare
Program . Maywald G.F., Sutherst R.W., and Zalucki M.P. (1997) Generic modelling for integrated pest management.
In MODSIM ’97. Hobart, McDonald AD, McAleer M, (Eds). 3:1115-1116. Maywald G.F., Sutherst R.W., and Zalucki M.P. (1999) DYMEX Modelling Natural Systems. CD-ROM,
90pp Builder guide and 80 pp Simulator guide. CSIRO Publishing. Mitchell, K.J. (1969) Simulation of the growth of even-aged stands of white spruce. Yale University
School of Forestry Bulletin 75:1-48. Mooy, L.M., Scanlan, J.C., Bolton, M.P. and Dorney, W.J. (1992) Management guidelines derived
from ecological studies of prickly acacia (Acacia nilotica). Proceedings of the 1st International Weed Control Congress; Feb 17-21 1992; Monash University Melbourne, Australia. International Weed Science Society and Weed Science Society of Victoria. Pp 347-9.
Parry, M. and T. Carter (1998) Climate Impact and Adaptation Assessment. Earthscan Publications
UK. Queensland Centre for Climate Applications. (1998) The Data Drill [Web Page]. Located at:
http://www.dnr.qld.gov.au/resourcenet/silo/datadril.html. Radford, I.D., Kriticos, D.J., Nicholas, M., and Brown, J.R. (1999) Towards an integrated approach to
management of Acacia nilotica in northern Australia. Proceedings of the VI International Rangeland Congress; Jul 17-23 1999. Townsville.
Starfield, A.M., Bleloch, A.L. (1991) Building models for conservation and wildlife management. 2nd
ed. New York : Macmillan ; London. p 253. Sutherst, R.W. (Ed.). (1996) Impacts of Climate Change on Pests, Diseases and Weeds. Report of an
international workshop sponsored by IGBP-GCTE, Australian Government Department of the Environment, Sports and Territories, and RIRDC
Sutherst, R.W. & Maywald, G.F. (1998). DYMEX modelling workshops: a national, collaborative
approach to pest risk analysis and IPM in Australia. p57-62. In Pest Management - Future Challenges. Proceedings of the 6th Australasian Applied Entomological Research Conference, Vol. 2. Zalucki, M.P. and Drew, R. (Eds) University of Queensland Press.
Sutherst, R.W. & Campbell, S. (1999). Report of the first rubbervine modelling workshop. Charters
Towers, April 21-23, 1998. Department of Natural Resources. Sutherst, R.W., Maywald, G.F. and Skarratt, D.B. (1995). Predicting insect distributions in a changing
climate. In Insects in a Changing Environment. R. Harrington and N.E. Stork (Eds). Academic Press, London.
43
Sutherst, R. W., Maywald, G. F., Yonow, T. and Stevens, P. M. (1999) CLIMEX. Predicting the effects of climate on plants and animals. User guide. Melbourne: CSIRO Publishing.
Sutherst, R.W., Yonow, T., Chakraborty, S., O’Donnell, C. and White, N. (1996). A generic approach
to defining impacts of climate change on pests, weeds and diseases in Australasia. pp 281-307. In Greenhouse: coping with climate change. Bouma, W.J., Pearman, G.I. and Manning, M.R. (Eds.) CSIRO, Melbourne.
Sutherst, R.W., Ingram, J. & Scherm, H. (1998). Global Change and Vector-Borne Diseases.
Parasitology Today. 14:297-299. Thomas, S.C. and Weiner, J. (1989) Including competitive asymmetry in measures of local interference
in plant populations. Oecologia 80:349-55. Thompson, G.K. (1992) Prickly Acacia infestation of the Mitchell Grasslands: Pasture condition,
economic effects, prediction of mass establishment and alternate animal production. National Soil Conservation Program, Final Report. Richmond Landcare Group.
Tiver, F., Nicholas, M., Kriticos, D.J. and Brown, J.R. (submitted) Cattle grazing is associated with
increased regeneration of introduced prickly acacia (Acacia nilotica) in dry tropical north Queensland. Journal of Range Management.
Tomley, A.J. (1995) The Biology of Australian Weeds 26. Cryptostegia grandiflora R. Br. Plant
Protection Quarterly 10(4):122-30. Walker, J. and Dowling, T.I. (1991) A non-stochastic, physiologically-based model of plant invasion
using ecological field theory. Plant Protection Quarterly 6(1):10-3.