upuuppup scaling non-deal roadshow …/media/mlt/newsroom...scaling non-deal roadshow -presentation...
TRANSCRIPT
Non-deal Roadshow -Presentation
September-October 2007
SCALING
UP
UP
UP
UP

1
1
�MapletreeLog -Overview
�Snapshot
�Our portfolio
�Scaling up
�Capital management
�Total returns
�Outlook
Agen
daAg
enda
Agen
daAg
enda
22
2
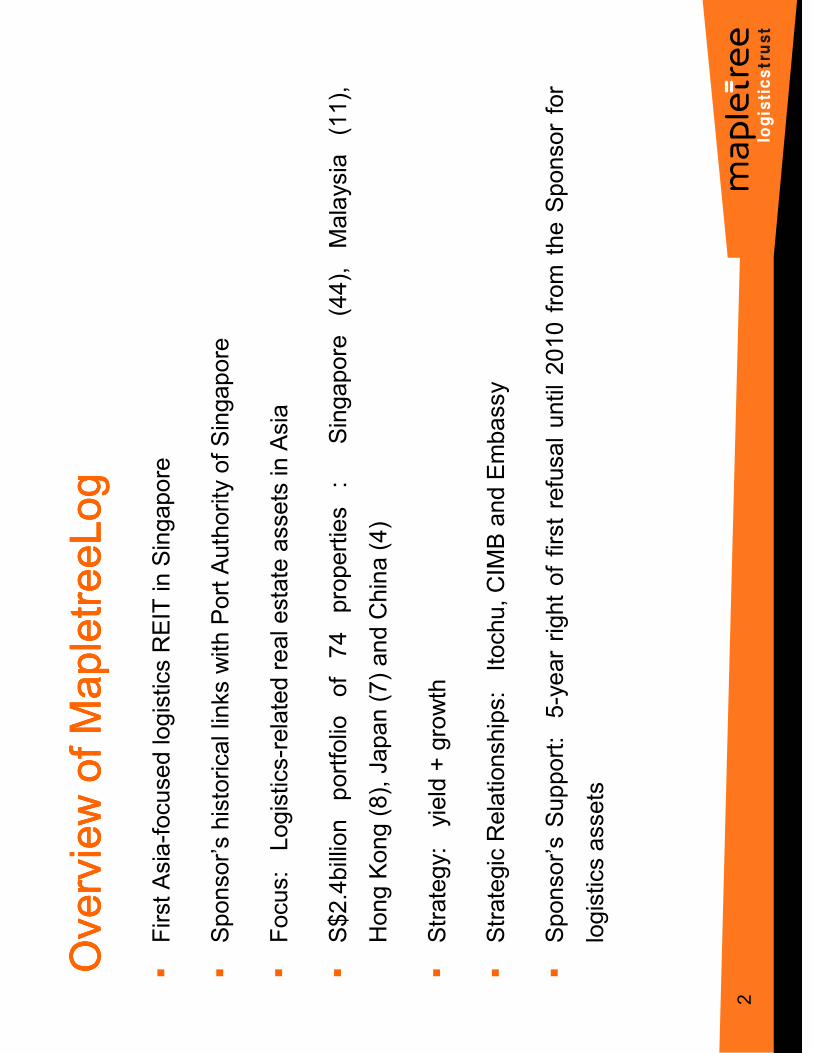
�First Asia-focused logistics REIT in Singapore
�Sponsor’s historical links with Port Authority of Singapore
�Focus: Logistics-related real estate assets in Asia
�S$2.4billion portfolio of 74 properties : Singapore (44), Malaysia (11),
Hong Kong (8), Japan (7) and China (4)
�Strategy: yield + growth
�Strategic Relationships: Itochu, CIMB and Embassy
�Sponsor’s Support: 5-year right of first refusal until 2010 from the Sponsor for
logistics assets
Ove
rvie
w o
f Map
letre
eLog
Ove
rvie
w o
f Map
letre
eLog
Ove
rvie
w o
f Map
letre
eLog
Ove
rvie
w o
f Map
letre
eLog
3
3
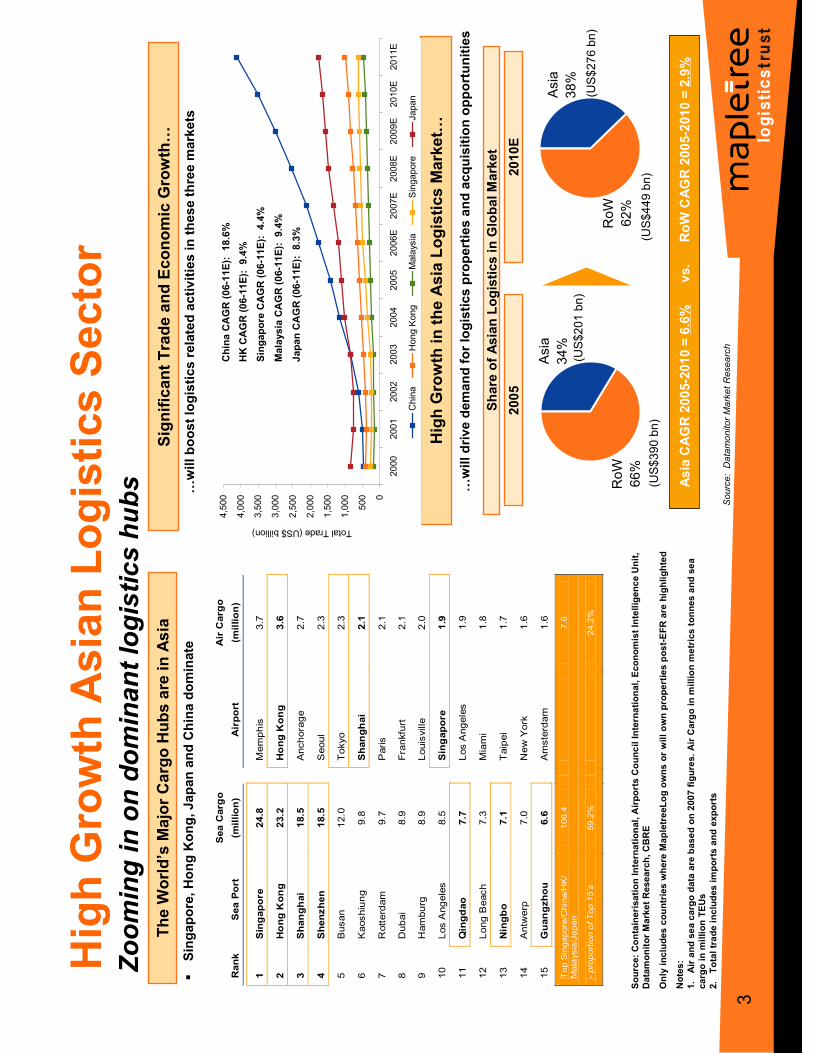
Asia
34%
RoW
66%
Asia
38%
RoW
62%
Zooming in on dominant logistics hubs
Significant Trade and Economic Growth…
…will boost logistics related activities in these three markets
High Growth in the Asia Logistics Market…
…will drive demand for logistics properties and acquisition opportunities
The W
orld’s Major Cargo Hubs are in Asia
Source: Datamonitor Market Research
High Growth Asian Logistics Sector
Source: Containerisation International, Airports Council International, Economist Intelligence Unit,
Datamonitor Market Research, CBRE
Only includes countries where MapletreeLog owns or will own properties post-EFR are highlighted
Notes:
1. Air and sea cargo data are based on 2007 figures. Air Cargoin million metrics tonnes and sea
cargo in million TEUs
2. Total trade includes imports and exports
Rank
Sea Port
Sea Cargo
(million)
Airport
Air Cargo
(million)
1
Singapore
24.8
Memphis
3.7
2
Hong Kong
23.2
Hong Kong
3.6
3
Shanghai
18.5
Anchorage
2.7
4
Shenzhen
18.5
Seoul
2.3
5
Busan
12.0
Tokyo
2.3
6
Kaoshiung
9.8
Shanghai
2.1
7
Rotterdam
9.7
Paris
2.1
8
Dubai
8.9
Frankfurt
2.1
9
Hamburg
8.9
Louisville
2.0
10
Los Angeles
8.5
Singapore
1.9
11
Qingdao
7.7
Los Angeles
1.9
12
Long Beach
7.3
Miami
1.8
13
Ningbo
7.1
Taipei
1.7
14
Antwerp
7.0
New York
1.6
15
Guangzhou
6.6
Amsterdam
1.6
Top Singapore/China/HK/
Malaysia/Japan
106.4
7.6
- proportion of Top 15’s
59.2%
24.2%
�Singapore, Hong Kong, Japan and China dominate
2005
2010E
(US$201 bn)
(US$276 bn)
(US$390 bn)
(US$449 bn)
Asia CAGR 2005-2010 = 6.6%
vs. RoW CAGR 2005-2010 = 2.9%
Share of Asian Logistics in Global Market
0
500
1,000
1,500
2,000
2,500
3,000
3,500
4,000
4,500
2000
2001
2002
2003
2004
2005
2006E
2007E
2008E
2009E
2010E
2011E
Total Trade (US$ billion)
China
Hong Kong
Malaysia
Singapore
Japan
China CAGR (06-11E): 18.6%
HK CAGR (06-11E): 9.4%
Malaysia CAGR (06-11E): 9.4%
Singapore CAGR (06-11E): 4.4%
Japan CAGR (06-11E): 8.3%
4
4
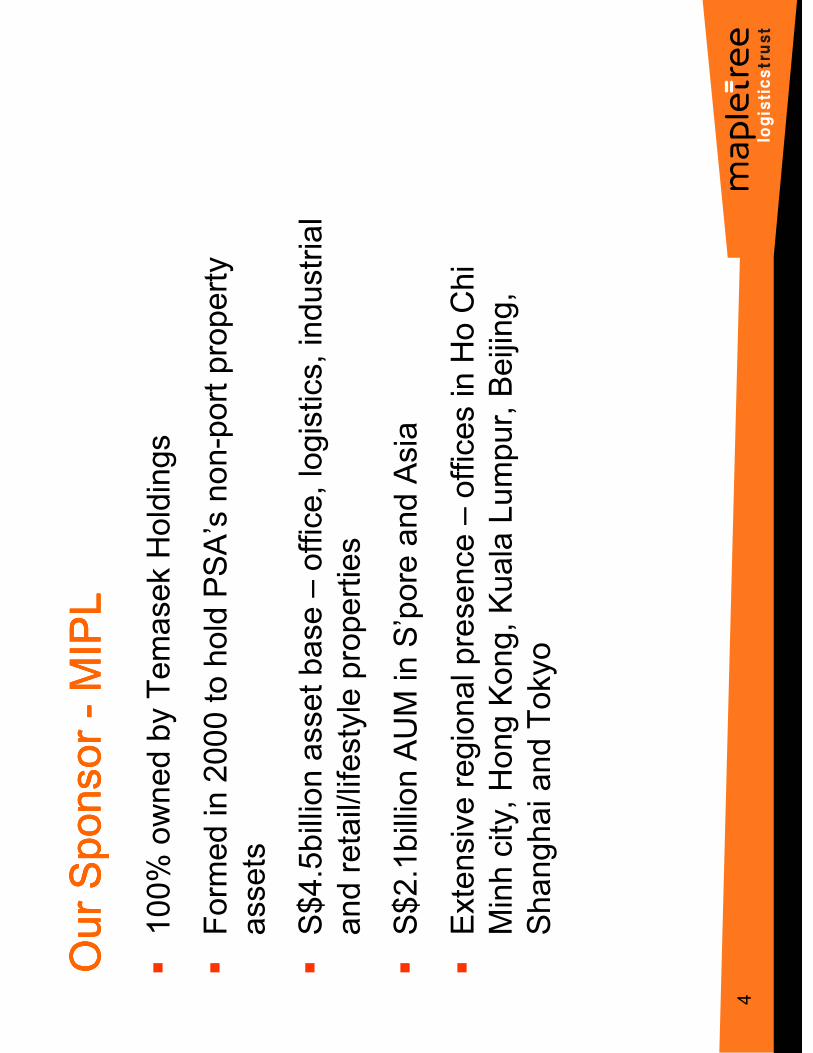
�100% owned by Temasek Holdings
�Form
ed in 2000 to hold PSA’s non-port property
assets
�S$4.5billion asset base –
office, logistics, industrial
and retail/lifestyle properties
�S$2.1billion AUM in S’pore and Asia
�Extensive regional presence –
offices in Ho Chi
Minh city, Hong Kong, Kuala Lumpur, Beijing,
Shanghai and Tokyo
Our
Spo
nsor
O
ur S
pons
or
Our
Spo
nsor
O
ur S
pons
or - ---
MIP
LM
IPL
MIP
LM
IPL
55
5
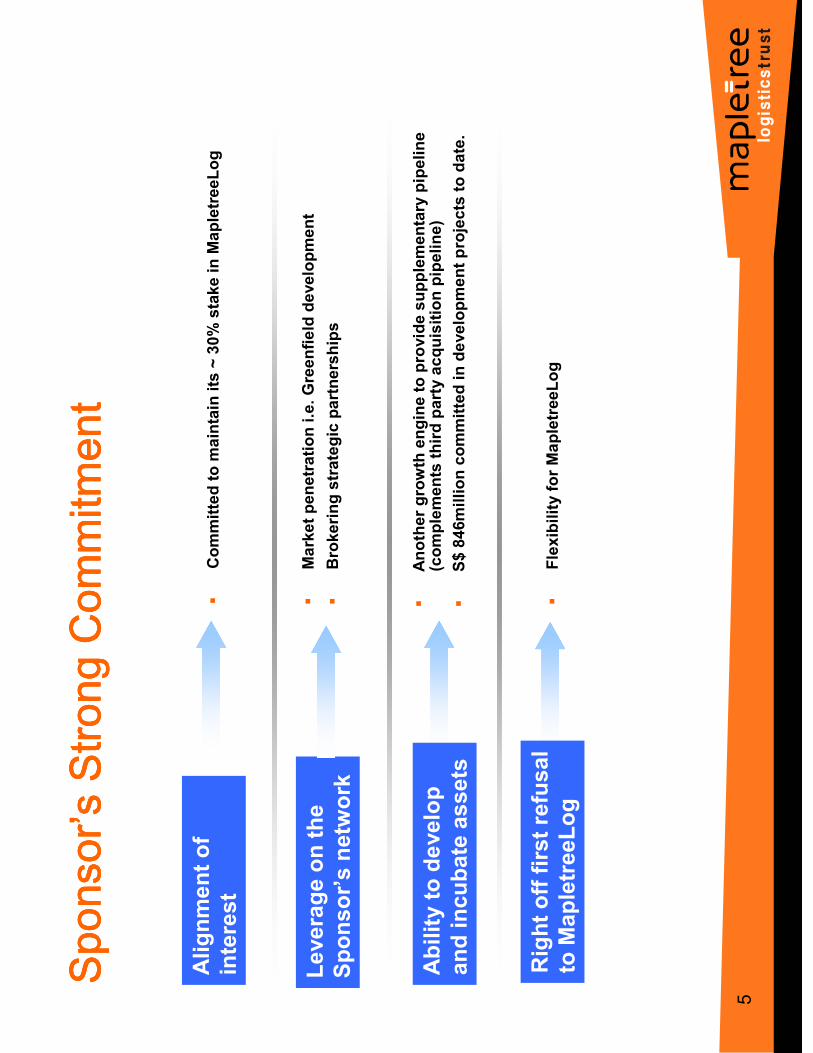
�Committed to maintain its ~ 30% stake in MapletreeLog
Spon
sor’s
Stro
ng C
omm
itmen
tSp
onso
r’s S
trong
Com
mitm
ent
Spon
sor’s
Stro
ng C
omm
itmen
tSp
onso
r’s S
trong
Com
mitm
ent
Alignment of
interest
Ability to develop
and incubate assets
�Another growth engine to provide supplementary pipeline
(complements third party acquisition pipeline)
�Market penetration i.e. Greenfield development
�Brokering strategic partnerships
Leverage on the
Sponsor’s network
�Flexibility for MapletreeLog
Right off first refusal
to MapletreeLog
�S$ 846million committed in development projects to date.

6
6
�MapletreeLog -Overview
�Snapshot
�Our portfolio
�Scaling up
�Capital Management
�Total Returns
�Outlook
Agenda
7
7
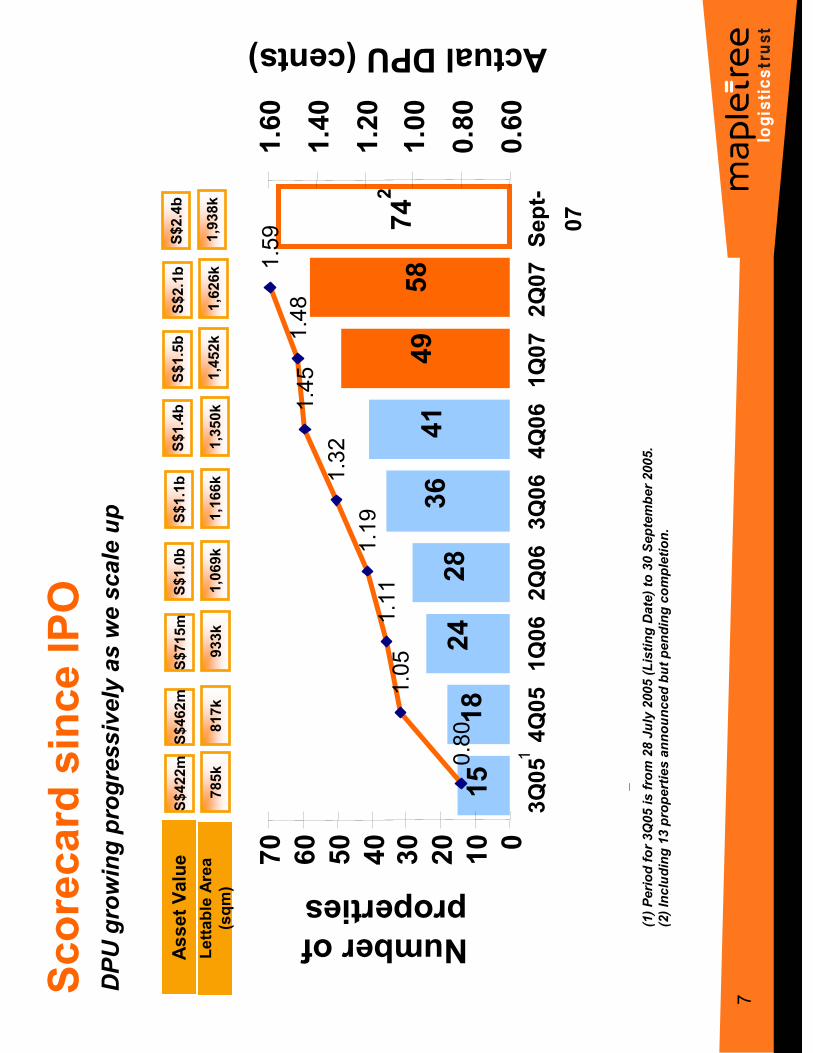
Scorecard since IPO
(1) Period for 3Q05 is from 28 July 2005 (Listing Date) to 30 September 2005.
(2) Including 13 properties announced but pending completion.
DPU growing progressively as we scale up
*
Asset Value
S$422m
S$1.0b
S$1.1b
S$1.4b
S$1.5b
2Q07 forecast DPU1(1.42 cts)
S$2.1b
S$715m
S$462m
2
S$2.4b
742
58
49
41
15
18
24
28
36
0.80
1.05
1.11
1.19
1.32
1.45
1.48
1.59
0
10
20
3040
50
60
70
3Q05
4Q05
1Q06
2Q06
3Q06
4Q06
1Q07
2Q07Sept-
07
Number of properties
0.60
0.80
1.00
1.20
1.40
1.60
Actual DPU (cents)
1
Lettable Area
(sqm)
785k
1,069k
1,166k
1,350k
1,452k
1,626k
933k
817k
1,938k
8
8
Geographical Diversification
Japa
nJa
pan
Japa
nJa
pan
1% 1%1%1%C
hina
Chi
naC
hina
Chi
na1% 1%1%1%
Mal
aysi
aM
alay
sia
Mal
aysi
aM
alay
sia
4% 4%4%4%
Hon
g H
ong
Hon
g H
ong
Kon
gK
ong
Kon
gK
ong
28%
28%
28%
28%
Sin
gapo
reS
inga
pore
Sin
gapo
reS
inga
pore
66%
66%
66%
66%
Japa
nJa
pan
Japa
nJa
pan
1% 1%1%1%C
hina
Chi
naC
hina
Chi
na1% 1%1%1%
Mal
aysi
aM
alay
sia
Mal
aysi
aM
alay
sia
4% 4%4%4%
Hon
g H
ong
Hon
g H
ong
Kon
gK
ong
Kon
gK
ong
28%
28%
28%
28%
Sin
gapo
reS
inga
pore
Sin
gapo
reS
inga
pore
66%
66%
66%
66%
Japa
nJa
pan
Japa
nJa
pan
11%
11%
11%
11%
Chi
naC
hina
Chi
naC
hina
2% 2%2%2%
Mal
aysi
aM
alay
sia
Mal
aysi
aM
alay
sia
3% 3%3%3%
Hon
g H
ong
Hon
g H
ong
Kon
gK
ong
Kon
gK
ong
26%
26%
26%
26%
Sin
gapo
reS
inga
pore
Sin
gapo
reS
inga
pore
58%
58%
58%
58%
Japa
nJa
pan
Japa
nJa
pan
11%
11%
11%
11%
Chi
naC
hina
Chi
naC
hina
2% 2%2%2%
Mal
aysi
aM
alay
sia
Mal
aysi
aM
alay
sia
3% 3%3%3%
Hon
g H
ong
Hon
g H
ong
Kon
gK
ong
Kon
gK
ong
26%
26%
26%
26%
Sin
gapo
reS
inga
pore
Sin
gapo
reS
inga
pore
58%
58%
58%
58%
Country Allocation by NPI –1Q 2007 vs 2Q 2007
49 properties as of 31 March 2007
58 properties as of 30 June 2007
74 properties as of 21 Sept 2007
Singapore
49%
China
7%
Hong Kong
24%
Malaysia
6%
Japan
14%
Actual NPI Contribution
Assumed Gross Rev Contribution*
*Assuming that all new acquisitions announced
after June 2007 have contributed to the total gross
revenue for the m
onth

9
9
Snapshot @ 30 June 2007
Footnotes:
1.
Include derivative financial instruments, at fair value, liability of S$14.9 m
illion.
2.
Include net derivative financial instruments, at fair value, liability of S$3.6 m
illion.
3.
Include net derivative financial instruments, at fair value, liability of S$14.3 m
illion. Excluding this, the
NAV per unit would be S$0.86.
4.
Include net derivative financial instruments, at fair value, liability of S$3.0 m
illion. Excluding this, the NAV
per unit would be S$0.87.
5.
Ratio of EBITDA over interest expense for period up to balance sheet date.
Balance Sheet
31 Mar 2007
S$’000
30 Jun 2007
S$’000
Total assets
1,637,450
2,201,186
Total liabilities
700,334 1
1,243,440 2
Net assets attributable to unitholders
937,116
957,746
NAV per Unit
S$0.85 3
S$0.86 4
Financial Ratio
Aggregate Leverage Ratio
39.0%
54.0%
Total Debt
S$630million
S$1182million
Weighted Average Annualised Interest Rate
4.1%
3.3%
Interest Service Ratio 5
3.4 times
3.3 times
10
10
�MapletreeLog -Overview
�Snapshot
�Our portfolio
�Scaling up
�Capital management
�Total returns
�Outlook
Agen
daAg
enda
Agen
daAg
enda

11
11
6.0%
0.0%
4.9%
0.0%
3.6%
3.0%
2.2%
2.1%
2.1%
0.0%
4.8%
4.3%
3.8%
3.7%
2.8%
2.4%
1.7%
1.7%
1.6%
1.6%
0%
1%
2%
3%
4%
5%
6%
7%
49 properties as at 31 Mar 2007
58 properties as at 30 Jun 2007
Better Tenant Diversification
Reduction in top ten tenants concentration from 29.5% to 28.5% @
30 Jun 2007
…increasing the number of quality tenants from 133 to 189
1
Ever Gain
Group
Teckwah
Industrial
Taiun
NEC
Logistics
Nichirei
Corporation
Fu Yu
corporation
Crescendas
Distribution
DG
Logistik
Senko Co
Vopak
Term
inals
Multinational logistics operators
Singapore listed groups
Private groups
Top ten tenants by gross revenue
12
12
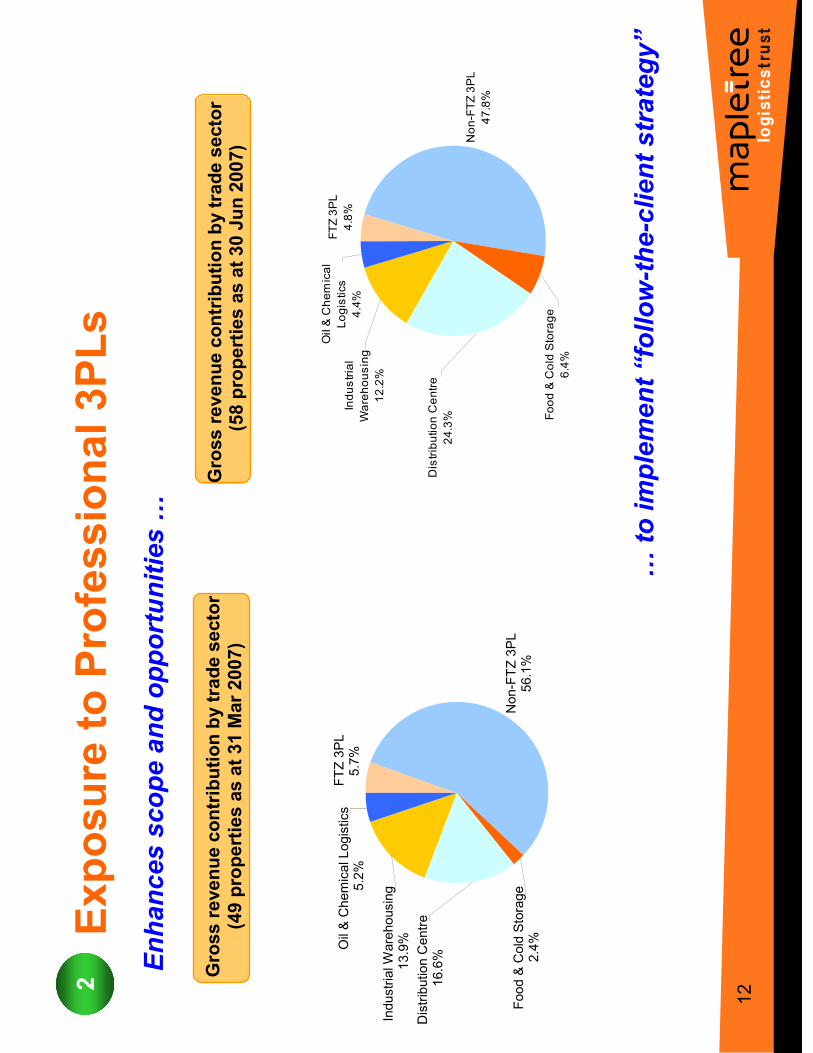
Exposure to Professional 3PLs
Enhances scope and opportunities …
2
…to implement “follow-the-client strategy”
Gross revenue contribution by trade sector
(58 properties as at 30 Jun 2007)
Gross revenue contribution by trade sector
(49 properties as at 31 Mar 2007)
FTZ 3PL
4.8%
Non-FTZ 3PL
47.8%
Oil & Chemical
Logistics
4.4%
Distribution Centre
24.3% Food & Cold Storage
6.4%
Industrial
Warehousing
12.2%
FTZ 3PL
5.7%
Non-FTZ 3PL
56.1%
Industrial W
arehousing
13.9%
Food & Cold Storage
2.4%
Distribution Centre
16.6%
Oil & Chemical Logistics
5.2%

13
13
Shorter Leases to Tap Growing Markets
Lease Expiry Profile by Gross Revenue
5.4 years
6.4 years
Weighted average lease term
to expiry
58 properties
as at 30 Jun 2007
49 properties
as at 31 Mar 2007
3
10.2%
19.5%
10.7%
5.6%
32.0%
5.9%
15.8%
38.6%
18.3%
13.7%
8.3%
5.8%
6.4%
8.5%
0%
5%
10%
15%
20%
25%
30%
35%
40%
45%
Expiring in
2007
Expiring in
2008
Expiring in
2009
Expiring in
2010
Expiring in
2011
Expiring in
2012
Expiring after
2012
49 properties as at 31 Mar 2007
58 properties as at 30 Jun 2007
Shorter Leases to tap
growing markets (47%)
Longer leases form
the
stable core (53%)

14
14
Leas
e Pr
ofile
Leas
e Pr
ofile
Leas
e Pr
ofile
Leas
e Pr
ofile
S$13.1 m
S$7.2 m (55%)
S$5.9 m (45%)
Gross revenue per mth(%)
1.6
1.2 (75%)
0.4 (25%)
Lettable area (million sqm)
Total
Long Leases (>3 yrs)
Short Leases (=<3 yrs)
55%
55%
55%
55%
45%
45%
45%
45%
Shor
t Lea
ses
(<3
yrs)
Shor
t Lea
ses
(<3
yrs)
Shor
t Lea
ses
(<3
yrs)
Shor
t Lea
ses
(<3
yrs)
Long
Lea
ses
(>3
yrs)
Long
Lea
ses
(>3
yrs)
Long
Lea
ses
(>3
yrs)
Long
Lea
ses
(>3
yrs)
15
15
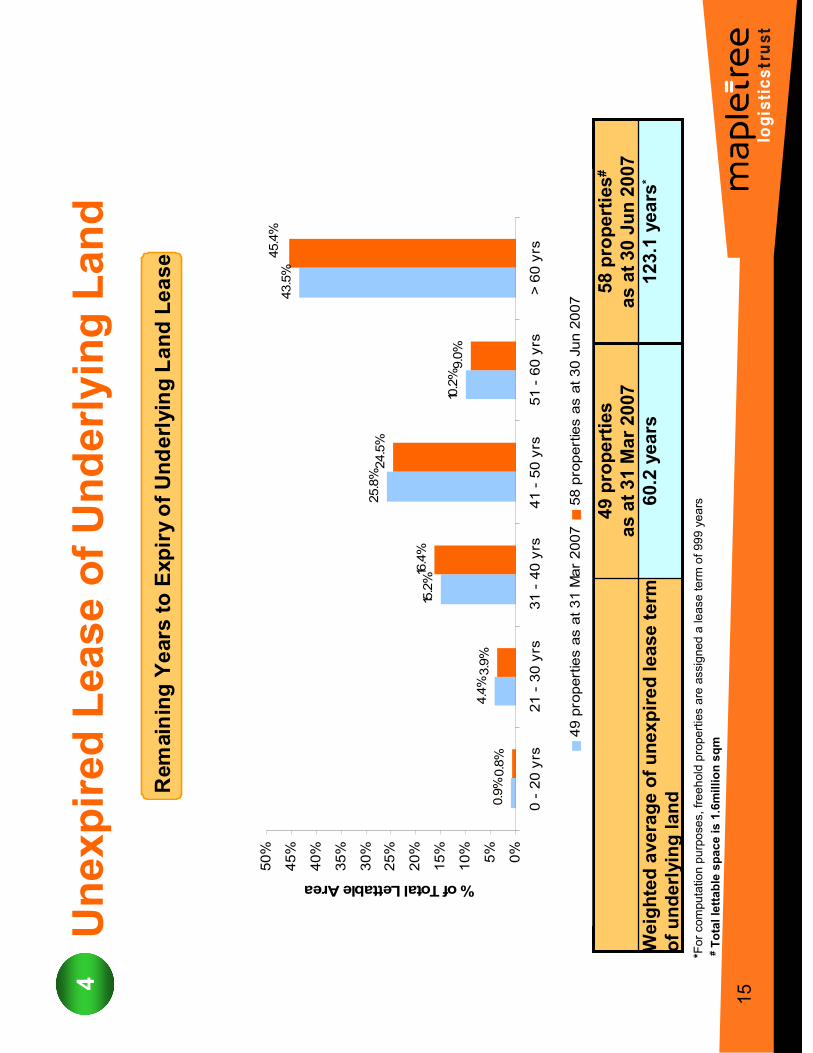
Unexpired Lease of Underlying Land
123.1 years
*60.2 years
Weighted average of unexpired lease term
of underlying land
58 properties#
as at 30 Jun 2007
49 properties
as at 31 Mar 2007
Remaining Years to Expiry of Underlying Land Lease
4
*For computation purposes, freehold properties are assigned a lease term
of 999 years
0.9%
4.4%
15.2%
25.8%
10.2%
43.5%
0.8%
3.9%
16.4%
9.0%
24.5%
45.4%
0%
5%
10%
15%
20%
25%
30%
35%
40%
45%
50%
0 - 20 yrs
21 - 30 yrs
31 - 40 yrs
41 - 50 yrs
51 - 60 yrs
> 60 yrs
% of Total Lettable Area
49 properties as at 31 Mar 2007
58 properties as at 30 Jun 2007
#Total lettable space is 1.6million sqm
16
16
�MapletreeLog -Overview
�Snapshot
�Our portfolio
�Scaling up
�Capital management
�Total Returns
�Outlook
Agen
daAg
enda
Agen
daAg
enda
17
17
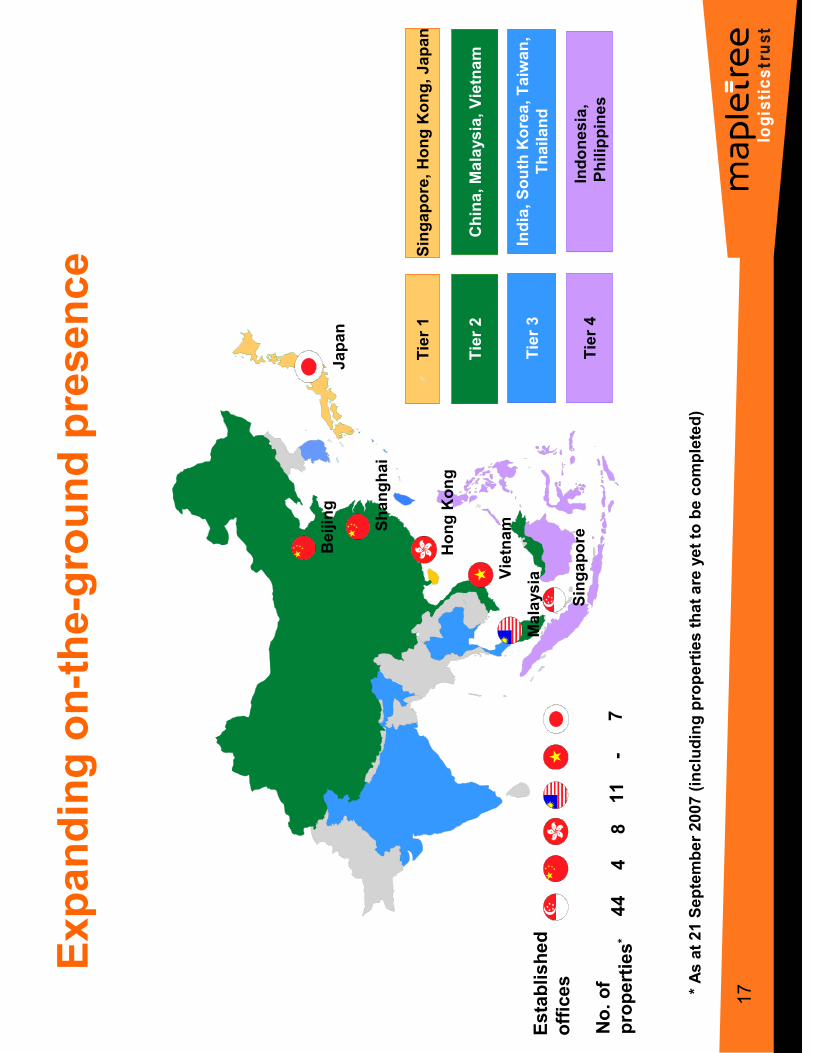
Tier 4
Tier 1
Tier 2
Tier 3
Singapore, Hong Kong, Japan
China, Malaysia, Vietnam
India, South Korea, Taiwan,
Thailand
Indonesia,
Philippines
Established
offices
Singapore
Shanghai
Hong Kong
Malaysia
Japan
Vietnam
Beijing
Expanding on-the-ground presence
No. of
properties*
* As at 21 September 2007 (including properties that are yet to be completed)
44
11
-7
48
18
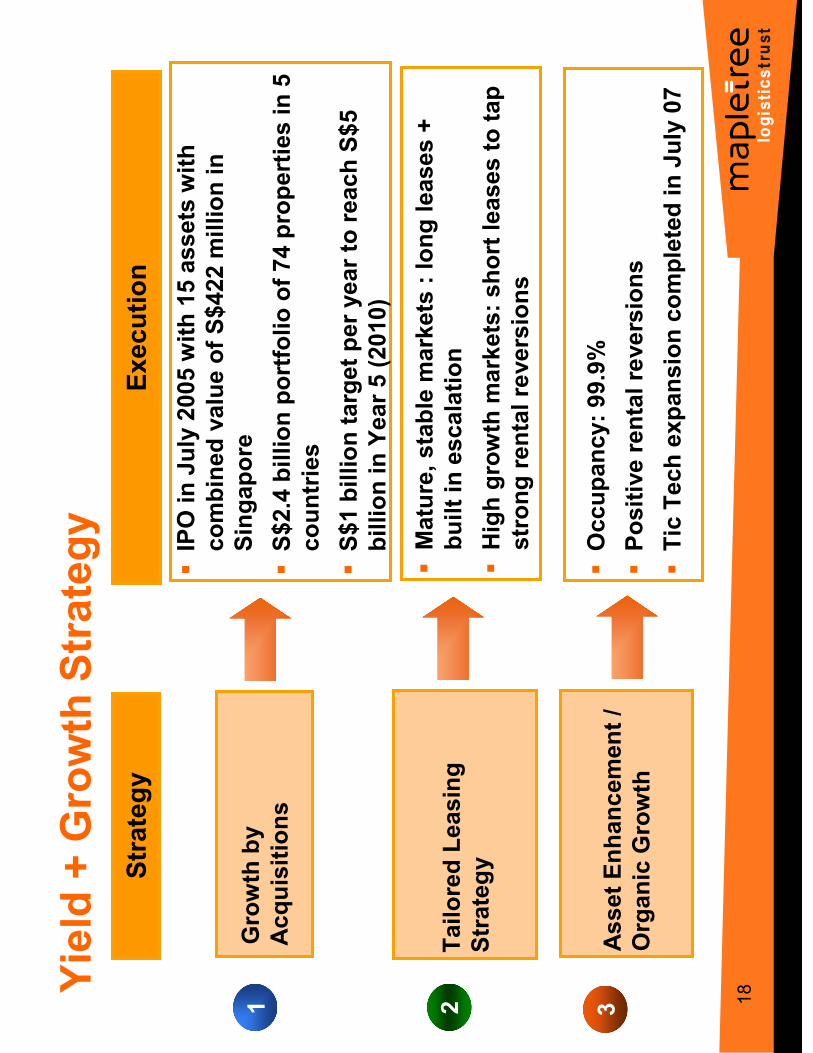
18Yield + Growth Strategy
Execution
�IPO in July 2005 with 15 assets with
combined value of S$422 million in
Singapore
�S$2.4 billion portfolio of 74 properties in 5
countries
�S$1 billion target per year to reach S$5
billion in Year 5 (2010)
�Mature, stable markets : long leases +
built in escalation
�High growth markets: short leases to tap
strong rental reversions
Strategy
Growth by
Acquisitions
Tailored Leasing
Strategy
Asset Enhancement /
Organic Growth
�Occupancy: 99.9%
�Positive rental reversions
�Tic Tech expansion completed in July 07
1 2 3
1919
19
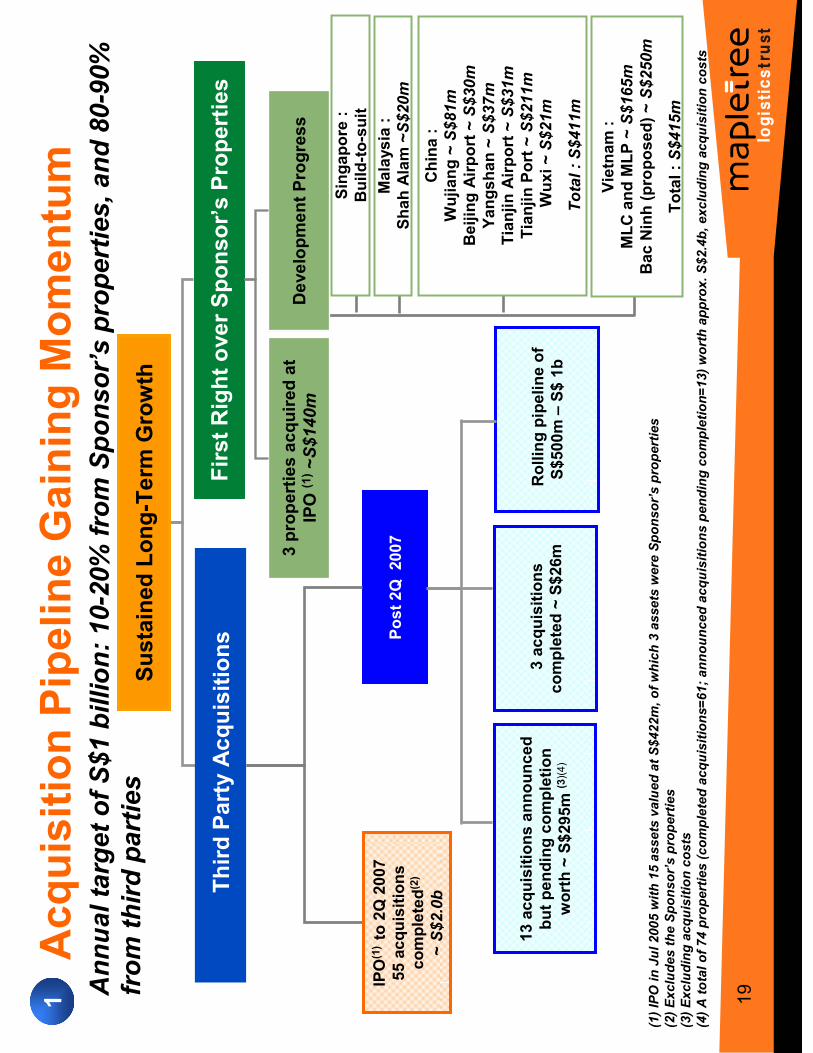
(1) IPO in Jul 2005 with 15 assets valued at S$422m, of which 3 assets were Sponsor’s properties
(2) Excludes the Sponsor’s properties
(3) Excluding acquisition costs
(4) A total of 74 properties (completed acquisitions=61; announced acquisitions pending completion=13) worth approx. S$2.4b, excluding acquisition costs
Post 2Q 2007
IPO(1) to 2Q 2007
55 acquisitions
completed(2)
~ S$2.0b
Annual target of S$1 billion: 10-20% from Sponsor’s properties, and 80-90%
from third parties
Acquisition Pipeline Gaining Momentum
Third Party Acquisitions
Sustained Long-Term
Growth
First Right over Sponsor’s Properties
3 properties acquired at
IPO (1)~S$140m
Development Progress
Singapore :
Build-to-suit
Malaysia :
Shah Alam ~S$20m
China :
Wujiang ~ S$81m
Beijing Airport ~ S$30m
Yangshan ~ S$37m
Tianjin Airport ~ S$31m
Tianjin Port~ S$211m
Wuxi ~ S$21m
Total : S$411m
Vietnam :
MLC and MLP ~ S$165m
Bac Ninh (proposed)~ S$250m
Total :S$415m
1
13 acquisitions announced
but pending completion
worth ~ S$295m (3)(4)
Rolling pipeline of
S$500m –S$ 1b
3 acquisitions
completed ~ S$26m
20
20
Singapore
Japan
4.0
4.5
5.0
5.5
6.0
6.5
7.0
7.5
8.0
Short
Medium
Long
Lease Term
s
Estimated Total Risk-Adjusted Returns (%)
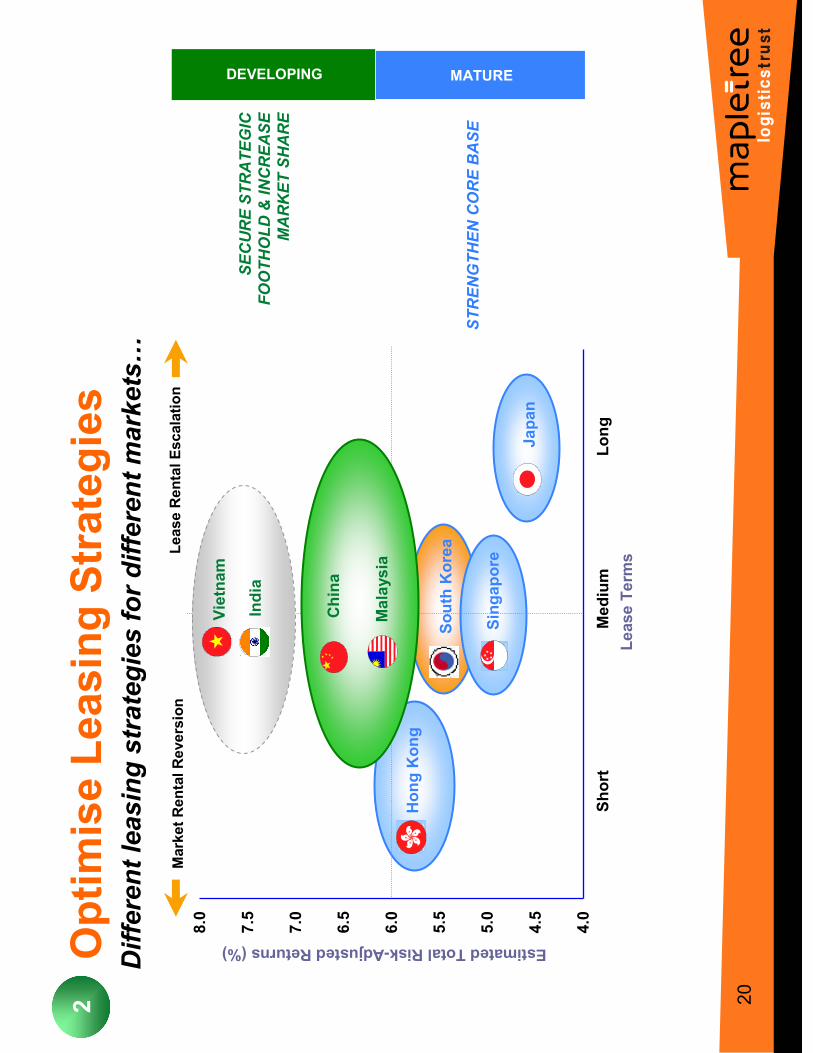
STRENGTHEN CORE BASE
Hong Kong
SECURE STRATEGIC
FOOTHOLD & INCREASE
MARKET SHARE
DEVELOPING MATURE
Market Rental Reversion
Lease Rental Escalation
Vietnam
China
Malaysia
India
Different leasing strategies for different markets…
2Optimise Leasing Strategies
South Korea

21
21
Asset enhancement
3
�Portfolio occupancy as at 30 June 2007: 99.9%
�TIC Tech Centre extension
-Additional 3-storeys, 5,700 sqm
-TOP obtained on 20 July 2007
-Yielding additionalrental income ofS$92,000 per month (17%) from Oct 07
�Summary of renewals for 1H 2007
-80,000 sqm ~ 5% of portfolio
space renewed at positive reversion rates averaging 12%. The
average rental reversion in each country was :
-7%
-Malaysia
-39%
-China
-15%
-Hong Kong
-8%
-S'pore
�Space due for renewal in 2008
-171,000 sqm ~ 9% of portfolio space, due for renewal in 2008, with expected reversion rate of ~
13%.

22
22
Spon
sor’s
com
mitm
ent i
n D
evel
opm
ent P
roje
cts
by
Spon
sor’s
com
mitm
ent i
n D
evel
opm
ent P
roje
cts
by
Spon
sor’s
com
mitm
ent i
n D
evel
opm
ent P
roje
cts
by
Spon
sor’s
com
mitm
ent i
n D
evel
opm
ent P
roje
cts
by
Cou
ntrie
sC
ount
ries
Cou
ntrie
sC
ount
ries
SGD 30
41,100
Mapletree Beijing Airport Logistics Park
China
4
SGD 31
63,400
Tianjin Airport
China
5
SGD 37
46,000
Yangshan Bonded Logistics Park
China
1
SGD 846
1,656,150
Total
SGD 415
745,600
Vietnam
Subtotal
SGD 250
366,000
Proposed Mapletree Logistics Park -Bac Ninh
Vietnam,
Bach Ninh Province
10
SGD 155
356,000
Mapletree Logistics Park (MLP)
Vietnam,
Binh Duong Province
9
SGD 10
23,600
Mapletree Logistics Centre (MLC)
Vietnam,
Binh Duong Province
8
SGD 20
60,000
Malaysia
Subtotal
SGD 20
60,000
Mapletree Taian W
arehouse Development
Malaysia
7
SGD 411
850,550
China
Subtotal
SGD 211
484,000
Tianjin Dongjiang Port
China
6
SGD 81
170,750
Wujiang Logistics Centre
China
3
SGD 21
45,300
Wuxi Logistics Park
China
2
Total Commitment
(SG Dollars)
Total GFA (m
2)
Project Name
Country
S/No.
All figures in Millions

23
23
Spon
sor’s
Dev
elop
men
t Pro
ject
s in
Chi
na
Shanghai
Mapletree Yangshan Bonded
Logistics Park
1
Jiangsu Province
Mapletree W
uxi Logistics Park
1
Beijing
Beijing Airport Logistics Park
2
Tianjin
Tianjin Airport Logistics Park
1
Tianjin Donjiang Port1
Mapletree W
ujiang Logistics
Centre2
1= Existing Site
2= Proposed Site
24
24
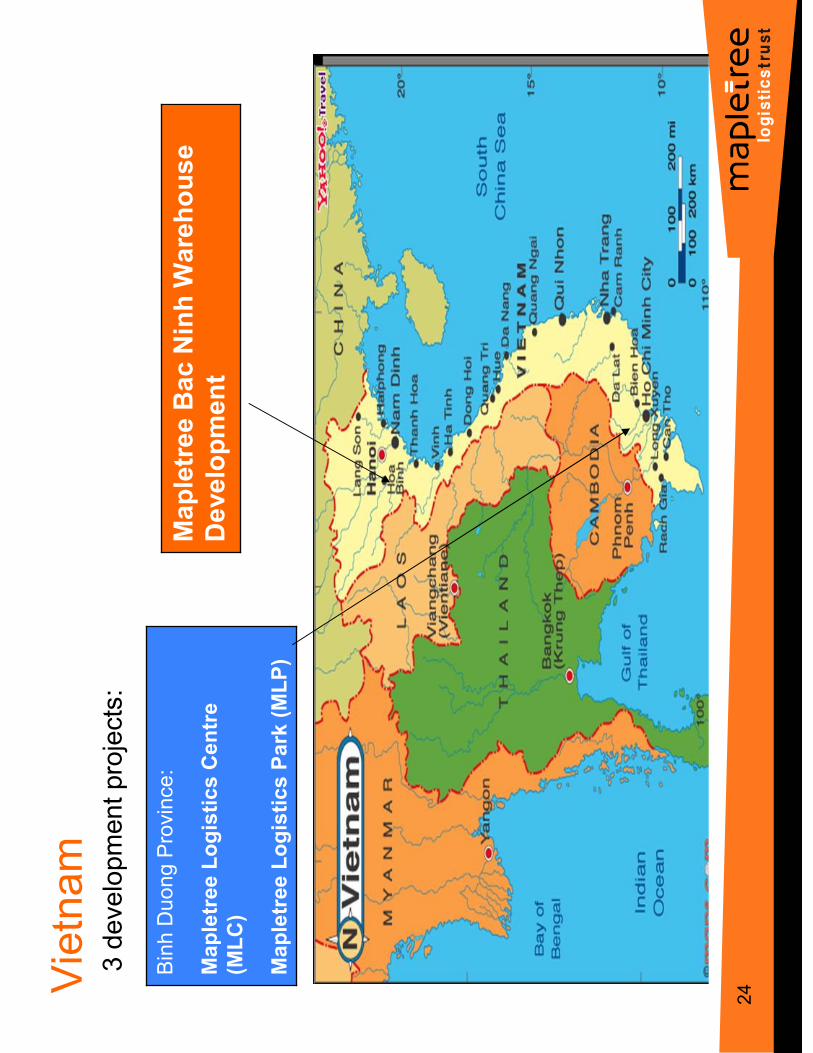
Mapletree Bac Ninh Warehouse
Development
Binh Duong Province:
Mapletree Logistics Centre
(MLC)
Mapletree Logistics Park (MLP)
Viet
nam
3 development projects:
25
25
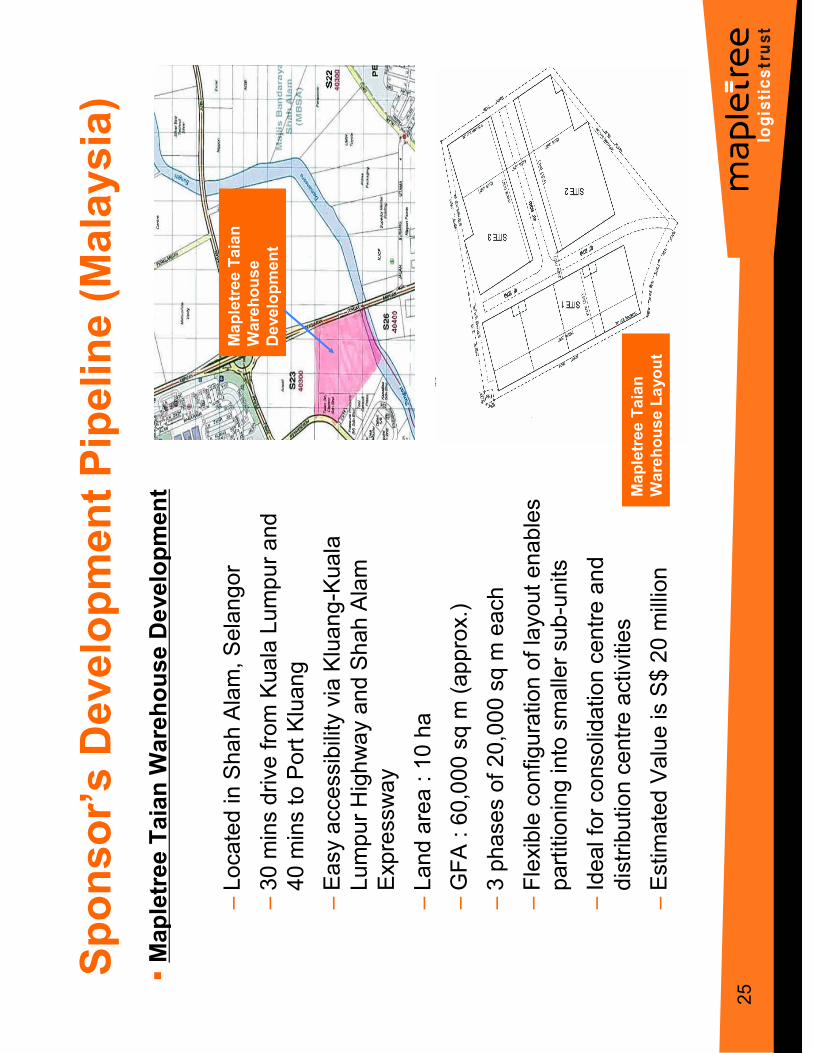
�Mapletree Taian W
arehouse Development
–Located in Shah Alam, Selangor
–30 mins drive from Kuala Lumpur and
40 mins to Port Kluang
–Easy accessibility via Kluang-Kuala
Lumpur Highway and Shah Alam
Expressway
–Land area : 10 ha
–GFA : 60,000 sq m (approx.)
–3 phases of 20,000 sq m each
–Flexible configuration of layout enables
partitioning into smaller sub-units
–Ideal for consolidation centre and
distribution centre activities
–Estimated Value is S$ 20 million
Sponsor’s Development Pipeline (Malaysia)
Mapletree Taian
Warehouse
Development
Mapletree Taian
Warehouse Layout
26
26
�MapletreeLog -Overview
�Snapshot
�Our portfolio
�Scaling up
�Capital Management
�Total Returns
�Outlook
Agen
daAg
enda
Agen
daAg
enda

27
27♦
Strong balance sheet with optimum leverage levels
♦Secure diversified funding sources
♦Competitive cost of debt financing
♦Interest rate management
–~55% of total current borrowings as at 30 June 2007 has been hedged
♦Foreign currency management
–Borrowing in foreign currencies, maintain currency hedges over residual earnings
after interest generated by overseas assetswhere possible and cost perm
itting
Optimise capital management initiatives to deliver…
…competitive risk-adjusted returns and sustainable growth for
Unitholders
Capital Management Strategy

28
28
4%
7%
14%
10%
3%
22%
2%
30%
4%2%
2%
0%
5%
10%
15%
20%
25%
30%
35%
40%
45%
50%
55%
Maturing
in 2007
Maturing
in 2008
Maturing
in 2009
Maturing
in 2010
Maturing
in 2011
Maturing
in 2012
SGD
HKD
JPY
MYR
CNY
8%
10%
25%
42%
4%
7%
4%
0%
5%
10%
15%
20%
25%
30%
35%
40%
45%
Maturing
in 2007
Maturing
in 2008
Maturing
in 2009
Maturing
in 2010
Maturing
in 2011
Maturing
in 2012
SGD
HKD
JPY
MYR
CNY
(1)
Actual Debt as at 31 Mar 2007; excludes deferred consideration of S$ 8.0 million
(2)
Actual Debt as at 31 Jun 2007; excludes deferred consideration of S$ 7.6 million
(3)
This figure reflects the Average Duration of the Actual Debt as at 31 Mar 2007, recalibrated and profiled as at 30 Jun 2007. Before the recalibration, the Average Duration
of the Actual D
ebt as at 31 Mar 2007 was at 3.25 years.
Debt Amount
Debt Maturity Profile
Actual Debt as at 30 Jun 2007(2)
Average Duration (3)
= 3.00 years
S$630 million
Actual Debt as at 31 Mar 2007(1)
42%
4%
36%
10%
8%
S$1,182 million
14%
2%
16%
52%
Average Duration
= 3.13 years
16%
29
29
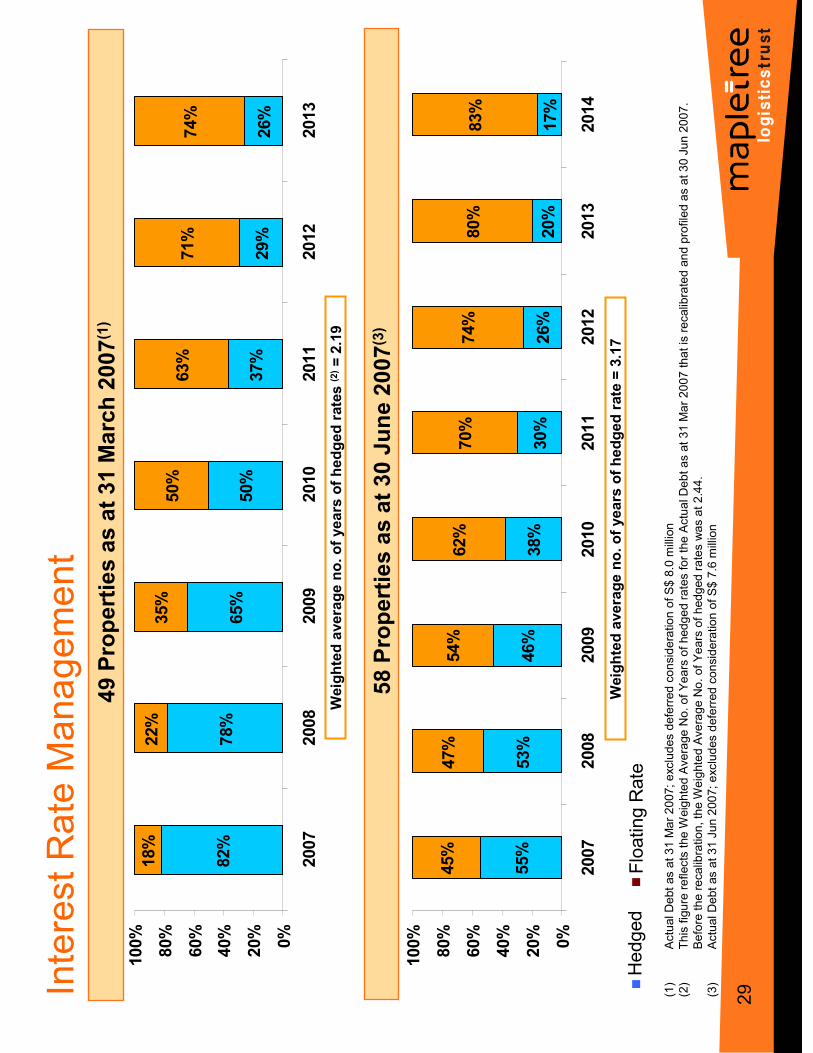
Hedged
Floating Rate
Interest Rate Management
49 Properties as at 31 March 2007(1)
Weighted average no. of years of hedged rates (2
)= 2.19
58 Properties as at 30 June 2007(3)
(1)
Actual Debt as at 31 Mar 2007; excludes deferred consideration of S$ 8.0 million
(2)
This figure reflects the W
eighted Average No. of Years of hedgedrates for the Actual D
ebt as at 31 Mar 2007 that is recalibrated and profiled as at 30 Jun 2007.
Before the recalibration, the W
eighted Average No. of Years of hedged rates was at 2.44.
(3)
Actual Debt as at 31 Jun 2007; excludes deferred consideration of S$ 7.6 million
Weighted average no. of years of hedged rate = 3.17
82%
78%
65%
50%
37%
29%
26%
18%
22%
35%
50%
63%
71%
74%
0%
20%
40%
60%
80%
100%
2007
2008
2009
2010
2011
2012
2013
55%
53%
46%
38%
30%
26%
20%
17%
45%
47%
54%
62%
70%
74%
80%
83%
0%
20%
40%
60%
80%
100%
2007
2008
2009
2010
2011
2012
2013
2014
30
30
SGD
25%
JPY
32%
HKD
35%
CNY
4%
MYR
4%
SGD
44%
JPY 4%
HKD
42%
CNY
4%
MYR
7%
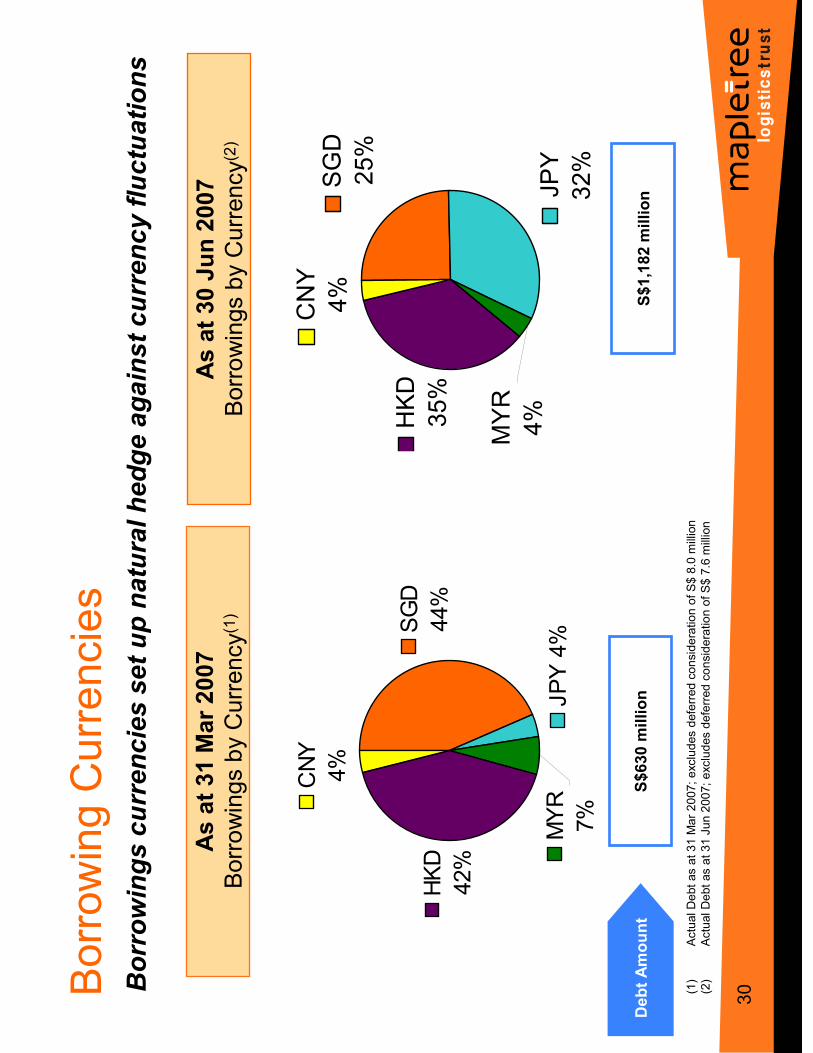
Borrowings currencies set up natural hedge against currency fluctuations
As at 31 Mar 2007
Borrowings by Currency(1)
S$1,182 million
As at 30 Jun 2007
Borrowings by Currency(2)
S$630 million
Borrowing Currencies
Debt Amount
(1)
Actual Debt as at 31 Mar 2007; excludes deferred consideration of S$ 8.0 million
(2)
Actual Debt as at 31 Jun 2007; excludes deferred consideration of S$ 7.6 million
31
31
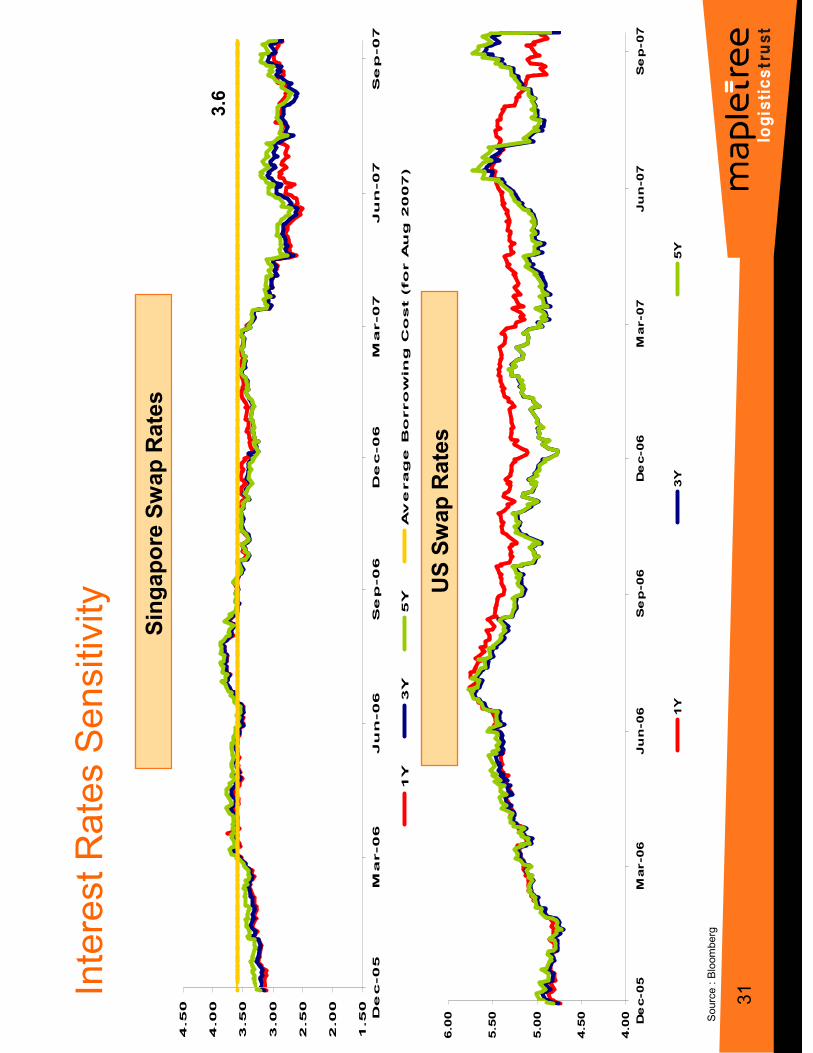
Singapore Swap Rates
Interest Rates Sensitivity
Source : Bloomberg
3.65
1.50
2.00
2.50
3.00
3.50
4.00
4.50
Dec-05
Mar-06
Jun-06
Sep-06
Dec-06
Mar-07
Jun-07
Sep-07
1Y
3Y
5Y
Average Borrowing Cost (for Aug 2007)
3.6
4.00
4.50
5.00
5.50
6.00
Dec-05
Mar-06
Jun-06
Sep-06
Dec-06
Mar-07
Jun-07
Sep-07
1Y
3Y
5Y
US Swap Rates

32
32
-2.00
-1.00
0.00
1.00
2.00
3.00
4.00
5.00 Aug-05
Nov-05
Feb-06
May-06
Aug-06
Nov-06
Feb-07
May-07
Aug-07
1Y3Y
5YAverage Borrowing Cost (for A
ug 2007)
3.60
3.80
4.00
4.20
4.40
4.60
4.80
5.00
5.20
5.40 Aug-05
Jan-06
Jun-06
Nov-06
Apr-07
30-Aug-07
1Y3Y
5YAverage Borrowing Cost (for Aug 2007)
2.40
2.80
3.20
3.60
4.00
4.40
4.80
5.20
5.60 Aug-05
Nov-05
Feb-06
May-06
Aug-06
Nov-06
Feb-07
May-07
Aug-07
1Y
3Y
5YAverage Borrowing Cost (for Aug 2007)
0.00
0.20
0.40
0.60
0.80
1.00
1.20
1.40
1.60
1.80
2.00 Feb-06
May-06
Aug-06
Nov-06
Feb-07
May-07
Aug-07
1Y
3Y
5Y
Average Borrowing Cost (for Aug 2007)
Hong Kong Swap Rates
China Swap Rates
Malaysia Swap Rates
Japan Swap Rates
Interest Rates Sensitivity
Source : Bloomberg
5.0
2.8
4.2
1.5
33
33
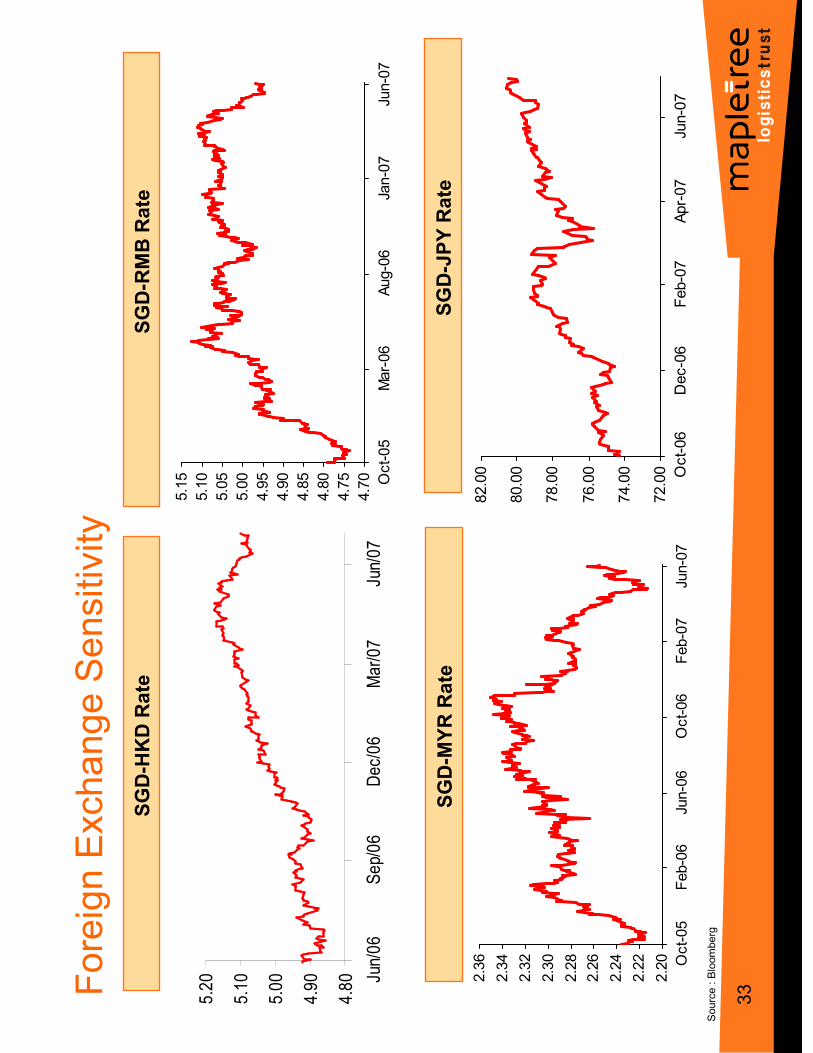
SGD-HKD Rate
SGD-RMB Rate
SGD-MYR Rate
72.00
74.00
76.00
78.00
80.00
82.00 Oct-06
Dec-06
Feb-07
Apr-07
Jun-07
Foreign Exchange Sensitivity
SGD-JPY Rate
4.70
4.75
4.80
4.85
4.90
4.95
5.00
5.05
5.10
5.15 Oct-05
Mar-06
Aug-06
Jan-07
Jun-07
2.20
2.22
2.24
2.26
2.28
2.30
2.32
2.34
2.36 Oct-05
Feb-06
Jun-06
Oct-06
Feb-07
Jun-07
Source : Bloomberg
4.80
4.90
5.00
5.10
5.20 Ju
n/06
Sep/06
Dec/06
Mar/07
Jun/07
34
34
�MapletreeLog -Overview
�Snapshot
�Our portfolio
�Scaling Up
�Capital Management
�Total Returns
�Outlook
Agen
daAg
enda
Agen
daAg
enda
35
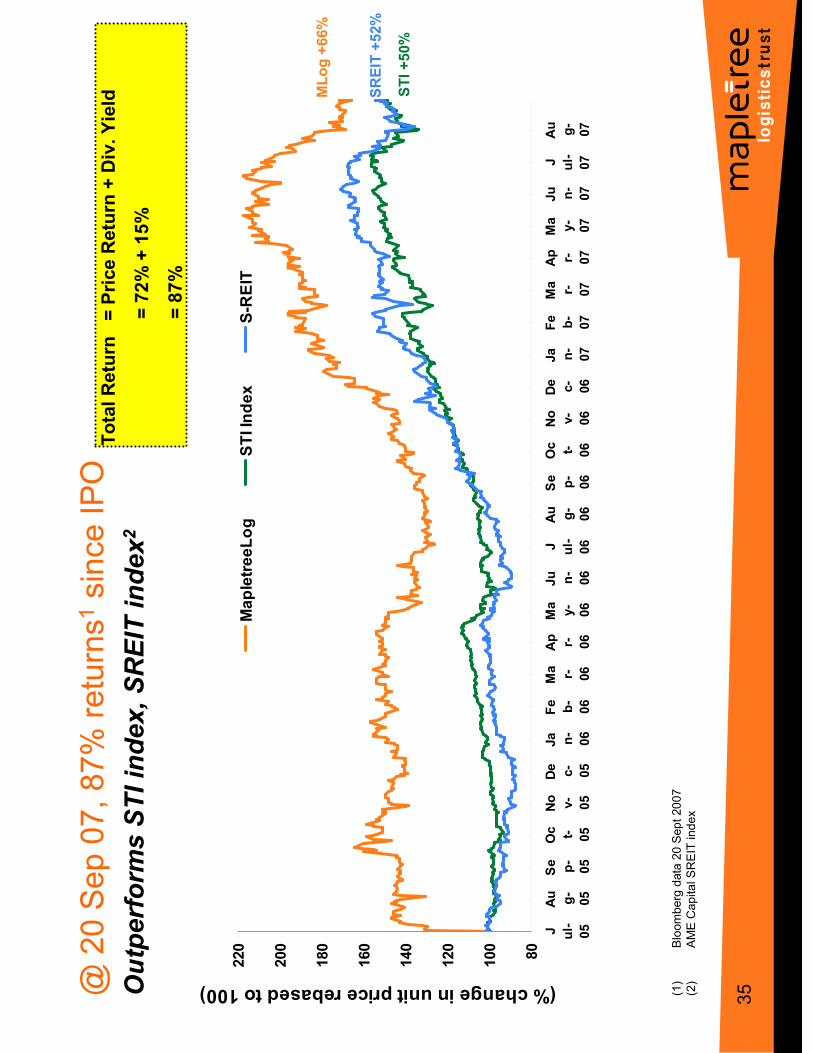
35Outperform
s STI index, SREIT index2
(1)
Bloomberg data 20 Sept 2007
(2)
AME Capital SREIT index
@ 20 Sep 07, 87% returns1since IPO
Total Return = Price Return + Div. Yield
= 72% + 15%
= 87%
80
100
120
140
160
180
200
220
J ul-
05
Au g-
05
Se p-
05
Oc t- 05
No v-
05
De c-
05
Ja n-
06
Fe b-
06
Ma r- 06
Ap r- 06
Ma
y-
06
Ju n-
06
J ul-
06
Au g-
06
Se p-
06
Oc t- 06
No v-
06
De c-
06
Ja n-
07
Fe b-
07
Ma r- 07
Ap r- 07
Ma
y-
07
Ju n-
07
J ul-
07
Au g-
07
(% change in unit price rebased to 100)
MapletreeLog
STI Index
S-REIT
MLog +66%
SREIT +52%
STI +50%

36
36
�MapletreeLog -Overview
�Snapshot
�Our portfolio
�Scaling Up
�Capital Management
�Total Returns
�Outlook
Agen
daAg
enda
Agen
daAg
enda

3737
37
�Successful track record since IPO
�Sound strategy for future growth and scaling up
�Asset size of 61 properties valued ~ S$2.1 billion as at 21 Sept
07 (announced –74 properties –approx. S$2.4 billion)
Why
Map
letre
eLog
?W
hy M
aple
treeL
og?
Why
Map
letre
eLog
?W
hy M
aple
treeL
og?
Experienced
management
team
Focused on Asia
logistics
�Asia logistics industry –high growth
�Pan-Asian platform
–“follow the client strategy
�Geographically diversified
�Anchored in strong mature (Singapore, Hong Kong, Japan)
�Expanding presence in new, developing markets (China, Malaysia, Vietnam)
�Sponsor’s development pipeline
�Organic growth and asset enhancement
Yield plus growth
strategy
�Diversified cashflows from different markets
�Stable core combined with exposure to high growth markets
�Optimal capital structure
Robust Income
stream
3838
38
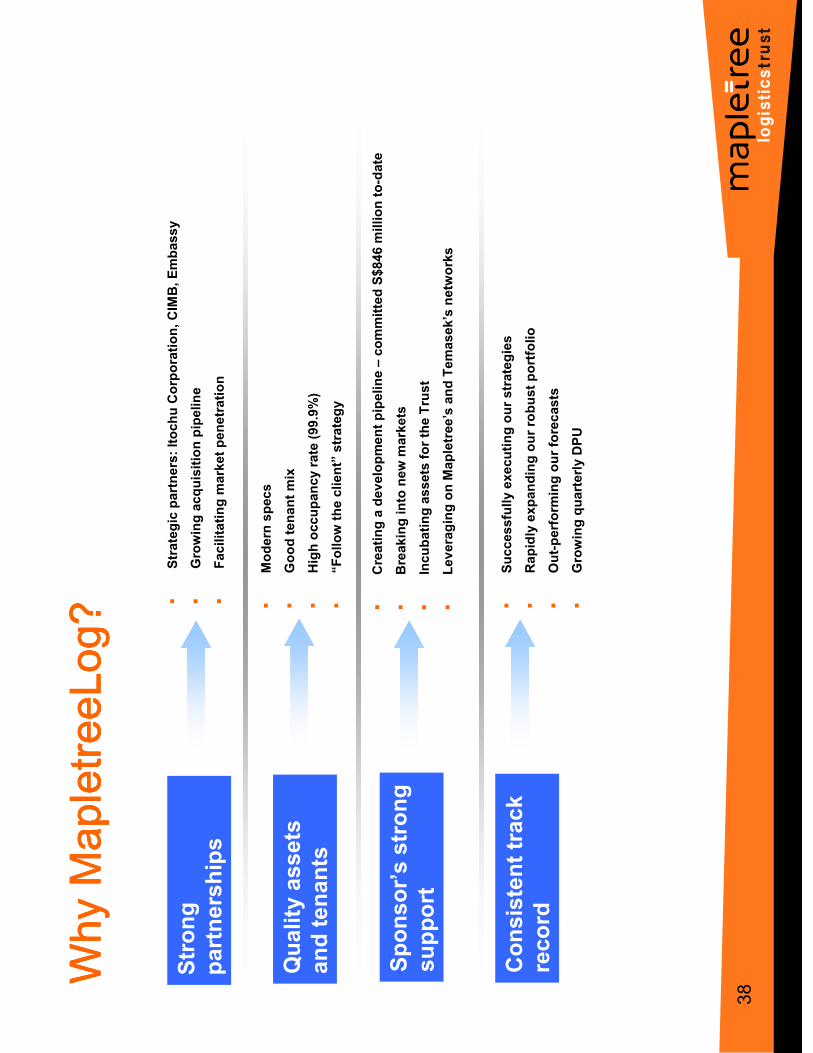
�Strategic partners: Itochu Corporation, CIMB, Embassy
�Growing acquisition pipeline
�Facilitating market penetration
Why
Map
letre
eLog
?W
hy M
aple
treeL
og?
Why
Map
letre
eLog
?W
hy M
aple
treeL
og?
Strong
partnerships
Quality assets
and tenants
Consistent track
record
�Modern specs
�Good tenant mix
�High occupancy rate (99.9%)
�“Follow the client”strategy
�Creating a development pipeline –committed S$846 million to-date
�Breaking into new markets
�Incubating assets for the Trust
�Leveraging on Mapletree’s and Temasek’s networks
�Successfully executing our strategies
�Rapidly expanding our robust portfolio
�Out-perform
ing our forecasts
�Growing quarterly DPU
Sponsor’s strong
support
39
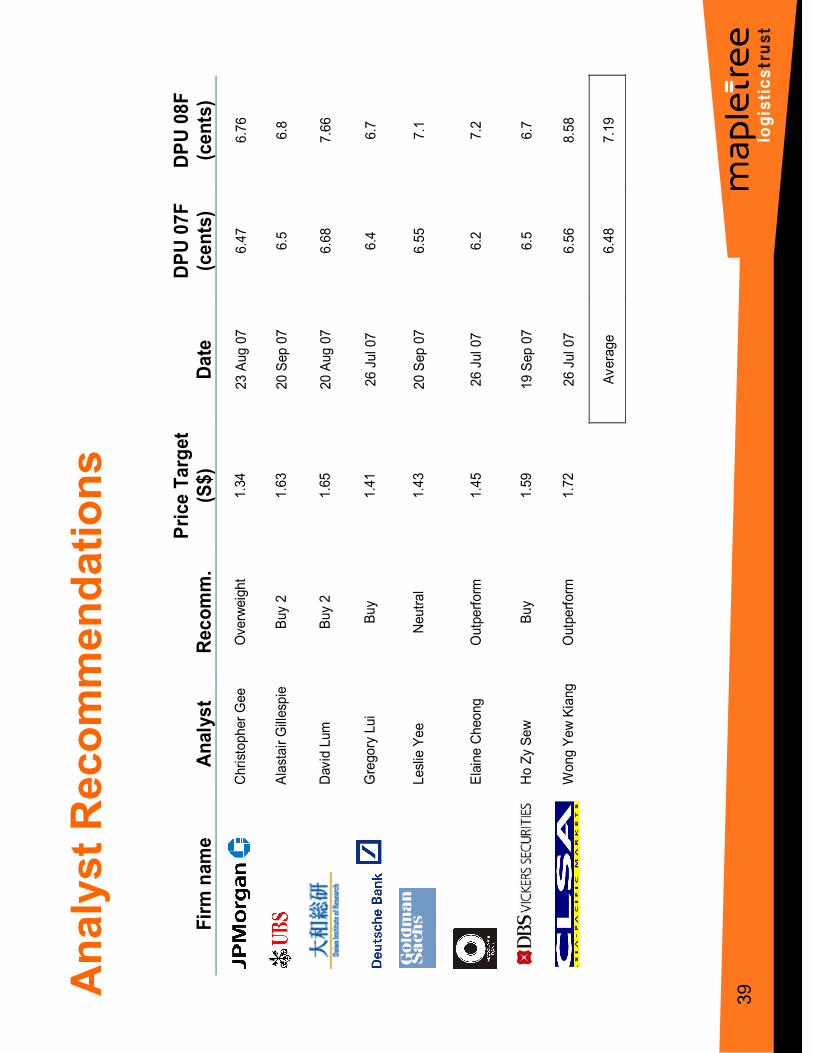
39Analyst Recommendations
Firm name
Analyst
Recomm.
Price Target
(S$)
Date
DPU 07F
(cents)
DPU 08F
(cents)
Christopher Gee
Overweight
1.34
23 Aug 07
6.47
6.76
Alastair Gillespie
Buy 2
1.63
20 Sep 07
6.5
6.8
David Lum
Buy 2
1.65
20 Aug 07
6.68
7.66
Gregory Lui
Buy
1.41
26 Jul 07
6.4
6.7
Leslie Yee
Neutral
1.43
20 Sep 07
6.55
7.1
Elaine Cheong
Outperform
1.45
26 Jul 07
6.2
7.2
Ho Zy Sew
Buy
1.59
19 Sep 07
6.5
6.7
Wong Yew Kiang
Outperform
1.72
26 Jul 07
6.56
8.58
Average
6.48
7.19

40
40
Important Notice
The inform
ation contained in this presentation is for inform
ation purposes only and does not constitute an offer to sell or any solicitation of an offer or invitation to purchase or subscribe for
units in Mapletree Logistics Trust (“MapletreeLog”, and units inMapletreeLog, “Units”) in Singapore or any other jurisdiction, nor should it or any part of it form
the basis of, or be relied upon
in any connection with, any contract or commitm
ent whatsoever.
The past perform
ance of the U
nits and M
apletree Logistics Trust Management Ltd. (the “Manager”) is not indicative of the future perform
ance of MapletreeLog and the Manager.
Predictions, projections or forecasts of the economy or economictrends of the m
arkets are not necessarily indicative of the future or likely perform
ance of MapletreeLog.
The value of the Units and the income derived from them m
ay fallas well as rise. Units are not obligations of, deposits in, or guaranteed by, the M
anager. An investm
ent in Units is subject
to investm
ent risks, including the possible loss of the principal amount invested. Investors have no right to request that the M
anager redeem their U
nits while the U
nits are listed. It is
intended that Unitholders m
ay only deal in their Units through trading on Singapore Exchange Securities Trading Limited (the “SGX-ST”). Listing of the Units on the SGX-ST does not
guarantee a liquid m
arket for the Units.
This presentation m
ay contain forward-looking statements that involve risks and uncertainties. Actual future perform
ance, outcomes and results m
ay differ materially from those expressed
in forward-looking statements as a result of a number of risks, uncertainties and assumptions. Representatives examples of these factors include (without lim
itation) general industry and
economic conditions, interest rate trends, cost of capital and capital availability, competition from similar developments, shifts in expected levels of property rental income, changes in
operating expenses, including employee wages, benefits and training, property expenses and governmental and public policy changes and the continued availability of financing in the
amounts and the term
s necessary to support future business. You are cautioned not to place undue reliance on these forward-looking statements, which are based on the M
anager's
current view of future events. The forecast financial perform
ance of MapletreeLog is not guaranteed and there is no certainty that it can be achieved.
This presentation has been prepared by the M
anager. The inform
ation in this presentation has not been independently verified. Norepresentation, warranty, express or implied, is m
ade as
to, and no reliance should be placed on, the fairness, accuracy,completeness or correctness of the inform
ation and opinions in this presentation. None of the M
anager or any of its agents
or advisers, or any of their respective affiliates, advisers or representatives, shall have any liability (in negligence or otherwise) for any loss howsoever arising from any use of this
presentation or its contents or otherwise arising in connection with this presentation.
Neither this presentation, nor any copy or portion of it, may besent, taken, transm
itted or distributed, directly or indirectly, in or into the United States, Japan or Canada, or to any U.S.
person (as such term
is defined in Regulation S under the Securities Act of 1933, as amended (the “Securities Act”)). It is not an offer of securities for sale into the United States. The Units
may not be offered or sold into the United States, Canada or Japan or to, or for the account or benefit of, U.S. persons unless they are registered or exempt from registration. The Units
have not been and will not be registered under the Securities Act or the securities laws of any state of the United States. There will be no public offer of securities in the United States.
This presentation m
ay not be forwarded or distributed to any other person and m
ay not be reproduced in any manner whatsoever. Any forwarding, distribution or reproduction of this
inform
ation in whole or in part is unauthorised. Failure to comply with this directive m
ay result in a violation of the Securities Act or the applicable laws of other jurisdictions.
The inform
ation in this presentation m
ust not be published outside the Republic of Singapore and in particular, but without lim
itation, must not be published in any United States edition of
any publication.
This document is not intended to be distributed or passed on, directly or indirectly, to any person in the United Kingdom or anyother jurisdiction in which such action could not be lawfully
made. Persons in the United Kingdom or any other jurisdiction inwhich such action would not be lawfully m
ade should not take any action upon this document. These m
aterials do not
constitute an offer, solicitation or other recommendation to invest in MapletreeLog.

41
41
Than
k Yo
uTh
ank
You
Than
k Yo
uTh
ank
You