pemex presentation non-deal roadshow 100623 ri
TRANSCRIPT
Investor Presentation
June 2010June 2010
Forward-Looking StatementsThis presentation contains forward-looking statements. We may also make written or oral forward-lookingThis presentation contains forward looking statements. We may also make written or oral forward lookingstatements in our periodic reports to the Comisión Nacional Bancaria y de Valores (Mexican National Bankingand Securities Commission, or CNBV), and the U.S. Securities and Exchange Commission (SEC), in our annualreport, in our offering circulars and prospectuses, in press releases, in other written materials, and in oralstatements made by our officers, directors or employees to third parties.
We may include forward-looking statements that address, among other things, our:• drilling and other exploration activities;• import and export activities;• projected and targeted capital expenditures and other costs and;• commitments revenues and liquidity etccommitments, revenues and liquidity, etc.
Actual results could differ materially from those projected in such forward-looking statements as a result ofvarious factors that may be beyond our control. These factors include, but are not limited to:
• changes in international crude oil and natural gas prices;• effects on us from competition;• effects on us from competition;• limitations on our access to sources of financing on competitive terms;• significant economic or political developments in Mexico;• developments affecting the energy sector; and• changes in our regulatory environment.
Accordingly, you should not place undue reliance on these forward-looking statements. In any event, thesestatements speak only as of their dates, and we undertake no obligation to update or revise any of them,whether as a result of new information, future events or otherwise. These risks and uncertainties are morefully detailed in PEMEX’s most recent Form 20-F filing with the SEC (www.sec.gov), and the prospectus filedwith the CNBV available through the Mexican Stock Exchange (www bmv com mx) These factors could cause
2
with the CNBV, available through the Mexican Stock Exchange (www.bmv.com.mx). These factors could causeactual results to differ materially from those contained in any forward-looking statement.

Cautionary NoteProved reserves estimates as of December 31, 2009 are consistent with the conclusions of theindependent engineering firms that audit Mexico’s reserves However pursuant to the Regulatoryindependent engineering firms that audit Mexico’s reserves. However, pursuant to the RegulatoryLaw to Article 27 of the Constitution of the United Mexican States Concerning Petroleum Affairs, theNational Hydrocarbons Commission is currently reviewing the hydrocarbon reserves evaluationreports. The Energy Ministry will disclose the hydrocarbon reserves of the country once this review iscomplete. It is possible that differences may arise, particularly with respect to the probable andp p y , p y p ppossible reserves associated with Chicontepec.
As of January 1, 2010, the SEC changed its rules to permit oil and gas companies, in their filings withthe SEC, to disclose not only proved reserves, but also probable reserves and possible reserves. Inaddition, we do not necessarily mean that the probable or possible reserves described herein meety p pthe recoverability thresholds established by the SEC in its new definitions. Investors are urged toconsider closely the disclosure in our Form 20-F “File No. 0-99” and our annual report to CNBV,available at www.pemex.com.
EBITDA is a non-GAAP measure.
Convenience translations into U.S. dollars of amounts in Mexican pesos from 2002 to 2007 have been made at the following exchange rates for the corresponding years in pesos per US$: 2003, 11.23; 2004, 11.26; 2005, 10.77; 2006, 10.88; and 2007, 10.86. In addition, convenience translation into U.S. dollars of amounts in pesos for the income statement have been made at the following average exchange rates in Pesos per U.S.$: 2008, 11.18; 2009, 13.52; and 1Q10, 12.79, unless otherwise noted. Finally, convenience translation into U.S. dollars of amounts in pesos from the balance sheet have been made at the established exchange rate at March 31, 2010 in Pesos per U.S.$ of 12.33. Such translations should not be construed as a representation that the peso amounts have been of could be converted into U S dollars at the foregoing or any other rate
3
could be converted into U.S. dollars at the foregoing or any other rate.
Cumulative or annual variations are computed as compared to the same period of the previous year, unless otherwise specified.
Content
Energy Reform
Upstream
Downstream
PEMEX Sustainability
Investment Program and Debt Strategy
4

Energy Reform
PEMEX Value Creation
Corporate Governance Special Contracting Regime Financial Flexibility
• Board with the participation of professional
• Flexible procurement and contracting.
• Independent financial program (without affecting our free
members.
• Incorporation of best corporate practices.
• Contracts with performance incentives.
cash flows).
• Financing from external sources.corporate practices.
• Schemes to develop and support suppliers and contractors in
d t i
external sources.
• Citizen bonds.
Diff ti t d fi l
5
order to increase participation of Mexican providers.
• Differentiated fiscal regime.
Content
Energy Reform
Upstream
Downstream
PEMEX Sustainabilityy
Investment Program and Debt Strategy
6

Total Reserves by Area
Proved Reserves and Prospective Resources
Oil and Gas
Basin Production
as of December 31, 2009MMMboe
Basin 3P 2P 1P
Burgos and Sabinas 0.9 0.6 0.4
Gas
B
Deep-waters 0.6 0.2 0.1
Southeastern 23.4 17.5 12.6Tampico–Misantla (ATG) 18.5 9.7 0.8Veracruz 0.2 0.2 0.2
Tampico-Misantla
Sabinas
19
Tampico-Misantla
BurgosSabinas
Gulf of Mexico
Deep sea exploration
P ti R
Total(1) 43.1 28.2 14.0Equivalent to(years of production)(1) 31.3 20.5 10.2
dd
tla19.20.3
ddVeracruz
Prospective Resources
Basin MMMboe
Burgos 3.1Deep waters in the Gulf of Mexico 29.5
Southeastern
Sabinas 0.3Sureste (Southeastern) 16.7Tampico-Misantla (ATG) 1.7Veracruz 0.7Y tá Pl tf 0 3
7
(“Sureste”)Yucatán Platform 0.3
Total(1) 52.3
(1) Numbers may not total due to rounding.
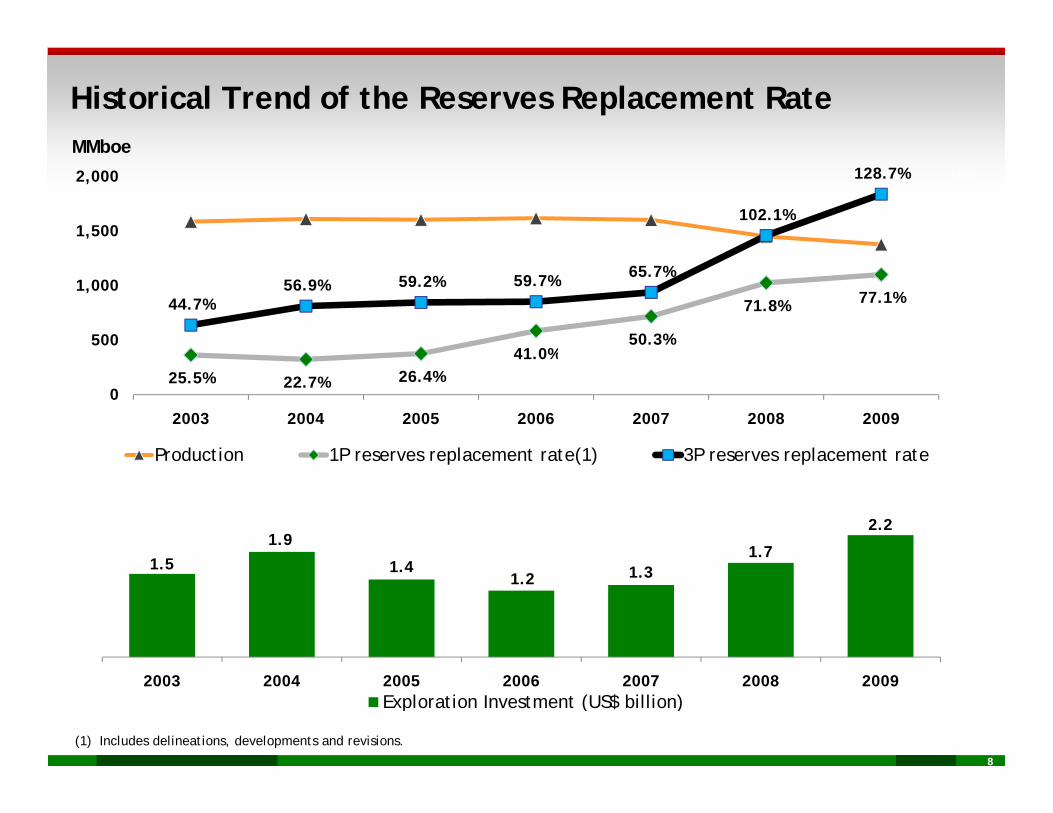
Historical Trend of the Reserves Replacement RateMMboe
102.1%
128.7%
100%
120%
140%
1,500
2,000
MMboe
41 0%50.3%
71.8% 77.1%44.7%56.9% 59.2% 59.7% 65.7%
40%
60%
80%
500
1,000
25.5% 22.7% 26.4%41.0%
0%
20%
02003 2004 2005 2006 2007 2008 2009
Production 1P reserves replacement rate(1) 3P reserves replacement rateProduction 1P reserves replacement rate(1) 3P reserves replacement rate
1 51.9
1.7
2.22
2.5
1.5 1.41.2 1.3
0
0.5
1
1.5
8
2003 2004 2005 2006 2007 2008 2009Exploration Investment (US$ billion)
(1) Includes delineations, developments and revisions.

Upstream Exploration Strategy: Deepwater
Area RiskWater depth
(m)
Prospective resources
(MMboe)1
Perdido
( ) (MMboe)
1. Perdido folded belt Low-Moderate >2000 100-600
2. Oreos Moderate-High 800-2000 40-130
3 Nancan High 500 2500 35 290
2
3Gulf of
Southern Gulf of Mexico
3. Nancan High 500-2500 35-290
4. Jaca-Patini Moderate-High 1000-1500 90-260
5. Lipax Moderate 950-2000 50-200
Low-moderate (Western) 1500-2000 100-480
8
976
5
4Gulf of
Mexico “B”
6. Holok(Western) Moderate-High(Eastern)
600-1100 65-300
7. Temoa High 850-1950 20-270
8 H Hi h
Heavy oil Gas / Light oilLight oil
8. Han High 450-2250 80-350
9. Nox-Hux Moderate 650-1850 90-250
• Nine areas were defined as the most important in Mexican deep waters, considering
9
economic value, prospective size, hydrocarbon type, geological risk, closeness toproduction facilities and environmental restrictions as the most relevant criteria.
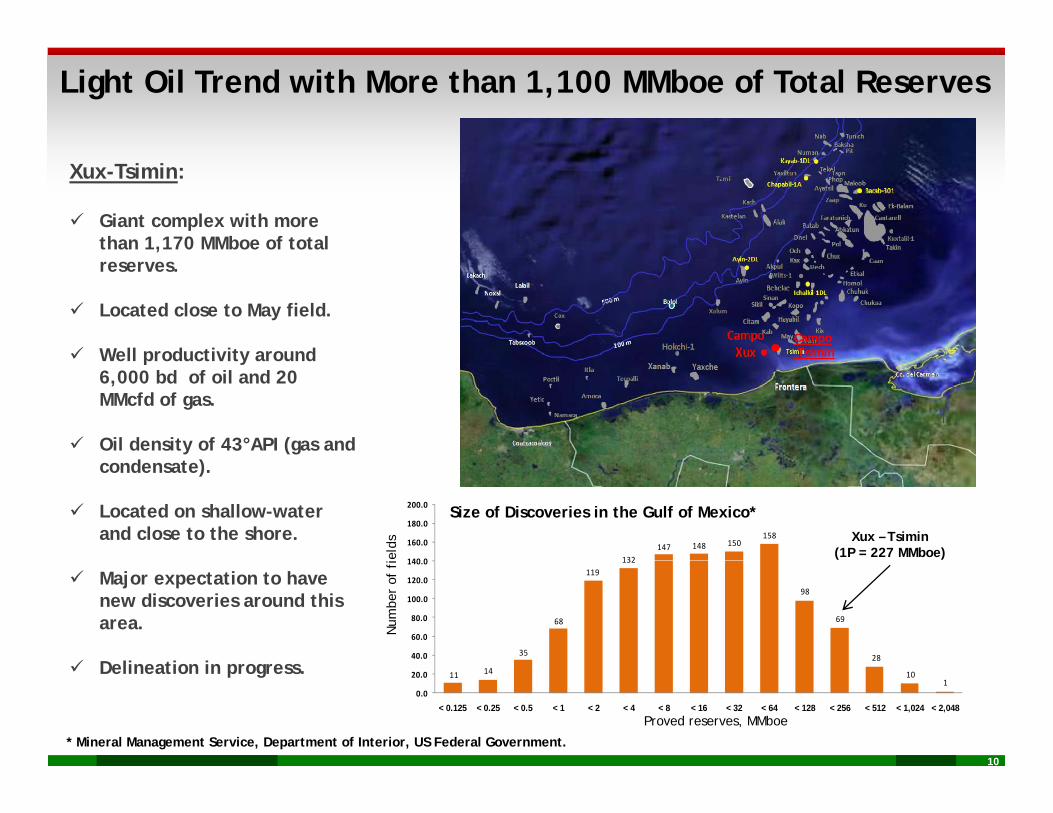
Light Oil Trend with More than 1,100 MMboe of Total Reserves
Xux-Tsimin:
Giant complex with more than 1,170 MMboe of total
CampoTsimin
reserves.
Located close to May field.
Well productivity around Tsimin Well productivity around 6,000 bd of oil and 20 MMcfd of gas.
Oil density of 43°API (gas and
132147 148 150
158
140 0
160.0
180.0
200.0
condensate).
Located on shallow-water and close to the shore. Xux – Tsimin
(1P = 227 MMboe)ield
s
Size of Discoveries in the Gulf of Mexico*
35
68
119132
98
69
2840.0
60.0
80.0
100.0
120.0
140.0
Major expectation to have new discoveries around this area.
D li ti i
Num
ber
of f
i
10
11 14 101
0.0
20.0
< 0.125 < 0.25 < 0.5 < 1 < 2 < 4 < 8 < 16 < 32 < 64 < 128 < 256 < 512 < 1,024 < 2,048
Delineation in progress.
Proved reserves, MMboe
* Mineral Management Service, Department of Interior, US Federal Government.

Heavy Oil Trend with more than 1,200 MMboe of Total Reserves
Producer well
Ayatsil-Tekel:
Giant complex with more than 725 MMboe of total reserves. Pit
Baksha
TunichNab
Numan
Kayab
Kanche
Bok
LemDrilling well
Non-productive well
Delineation well
100
500
Platform
Pipe line
Located close to Maloob field.
Well productivity around 5,000 bd using electric submersible pumps (ESP).
n
Maloob
TsonDL 1
DL 1
Yaxiltun Tekel
PP-M-BPP-M-A
Ayatsil
DL 1
PohpDL 1
Oil density of 12°API.
Development plan in progress.Zaap
DL3
Bacab
PP M A
PP-Zaap-C
E-Ku-A2 PP-Ku-S
PP-Bacab-ALum-A
PB-Ku-H
PP-Zaap-D
PP-Zaap-A
E-Ku-A2
1
2
3
147 148 150158
160.0
180.0
200.0
Pit- Baksha:
Giant complex with more than 510 MMboe of total reserves. Ayatsil-Tekel-Pit-Baksha
(1P = 387 MMboe)
Discoveries sizes in the Gulf of Mexico*
Ku
35
68
119132
98
69
40 0
60.0
80.0
100.0
120.0
140.0 Development based on connection with Ayatsil-Tekel.
Well productivity around 4,500 bd using ESP.
umbe
r of
fie
lds
( )
11
11 14
35 28
101
0.0
20.0
40.0
< 0.125 < 0.25 < 0.5 < 1 < 2 < 4 < 8 < 16 < 32 < 64 < 128 < 256 < 512 < 1,024 < 2,048
Oil density of 12°API.
Development plan in progress.
N
Proved reserves, MMboe* Mineral Management Service, Department of Interior, US Federal Government.
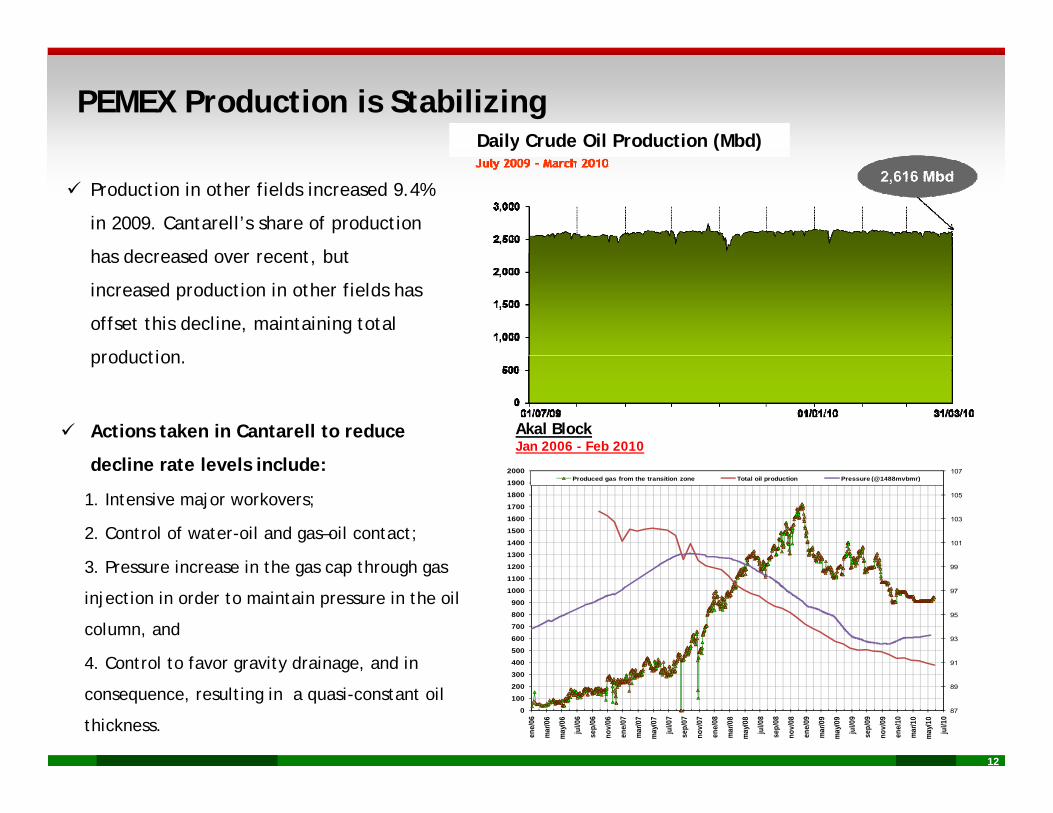
PEMEX Production is StabilizingDaily Crude Oil Production (Mbd)
Production in other fields increased 9.4%
in 2009. Cantarell’s share of production
has decreased o er recent b t
y ( )
has decreased over recent, but
increased production in other fields has
offset this decline, maintaining total
production
Actions taken in Cantarell to reduce
d li l l i l d
production.
Akal BlockJan 2006 - Feb 2010
decline rate levels include:
1. Intensive major workovers;
2. Control of water-oil and gas–oil contact;
3 P i i h h h
101
103
105
107
1300
1400
1500
1600
1700
1800
1900
2000Produced gas from the transition zone Total oil production Pressure (@1488mvbmr)
3. Pressure increase in the gas cap through gas
injection in order to maintain pressure in the oil
column, and
4 Control to favor gravity drainage and in 91
93
95
97
99
400
500
600
700
800
900
1000
1100
1200
12
4. Control to favor gravity drainage, and in
consequence, resulting in a quasi-constant oil
thickness.87
89
91
0
100
200
300
400
ene/
06
mar
/06
may
/06
jul/0
6
sep/
06
nov/
06
ene/
07
mar
/07
may
/07
jul/0
7
sep/
07
nov/
07
ene/
08
mar
/08
may
/08
jul/0
8
sep/
08
nov/
08
ene/
09
mar
/09
may
/09
jul/0
9
sep/
09
nov/
09
ene/
10
mar
/10
may
/10
jul/1
0
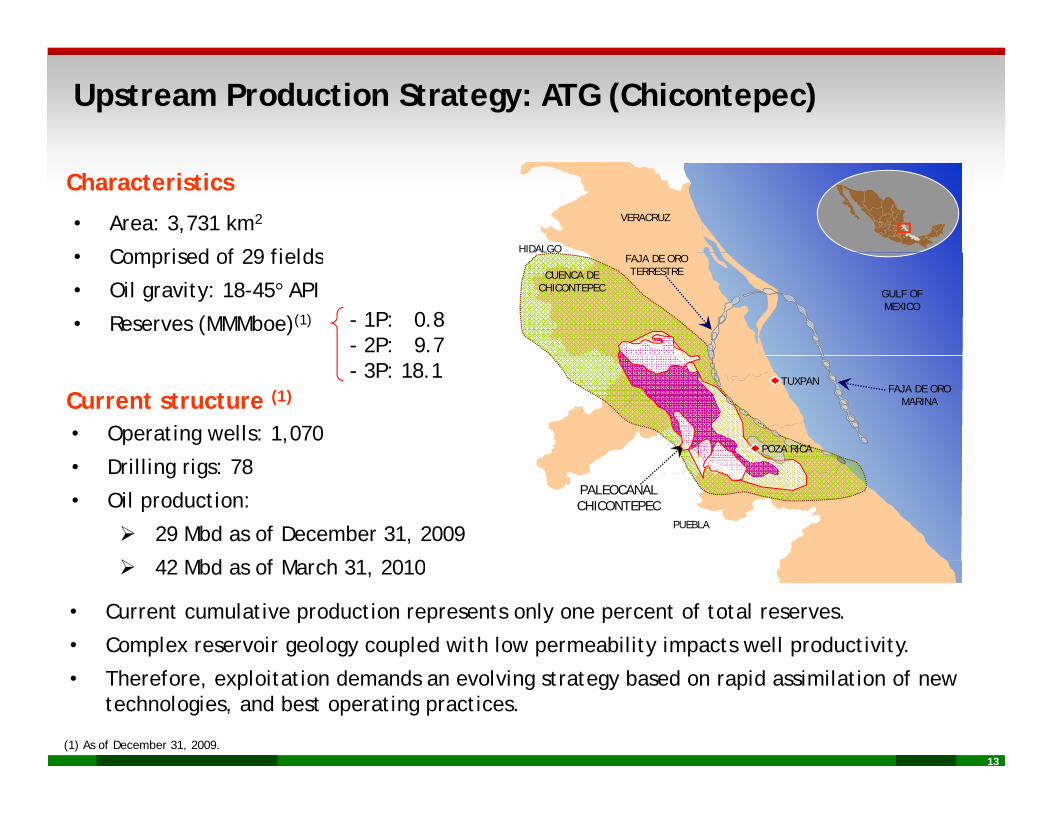
Upstream Production Strategy: ATG (Chicontepec)
VERACRUZ
HIDALGO
• Area: 3,731 km2
Comprised of 29 fields
Characteristics
CUENCA DECHICONTEPEC
FAJA DE OROTERRESTRE
GULF OFMEXICO
• Comprised of 29 fields
• Oil gravity: 18-45° API
• Reserves (MMMboe)(1) - 1P: 0.8- 2P: 9.7
FAJA DE OROMARINA
TUXPAN
POZA RICA• Operating wells: 1,070Current structure (1)
- 3P: 18.1
PALEOCANALCHICONTEPEC
PUEBLA
• Drilling rigs: 78
• Oil production:
29 Mbd as of December 31, 2009
42 Mbd f M h 31 2010 42 Mbd as of March 31, 2010
• Current cumulative production represents only one percent of total reserves.
• Complex reservoir geology coupled with low permeability impacts well productivity.
13(1) As of December 31, 2009.
• Therefore, exploitation demands an evolving strategy based on rapid assimilation of new technologies, and best operating practices.
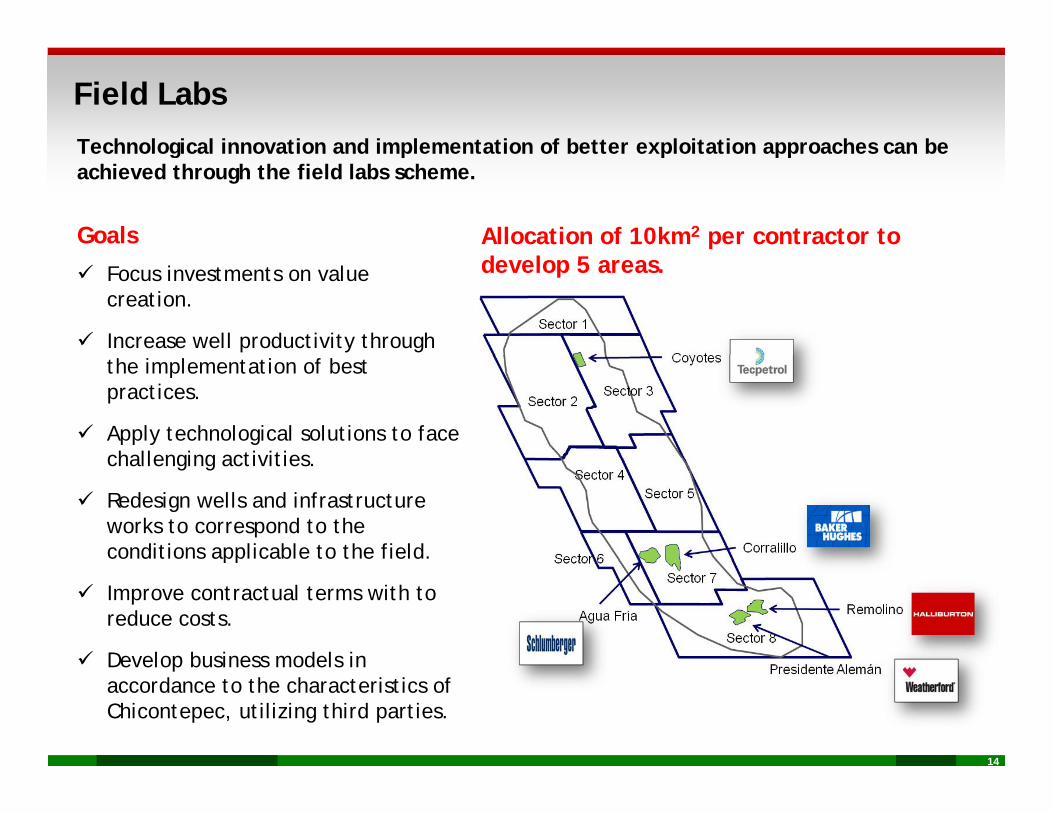
Technological innovation and implementation of better exploitation approaches can be
Field Labs
Goals Allocation of 10km2 per contractor to
Technological innovation and implementation of better exploitation approaches can be achieved through the field labs scheme.
Focus investments on value creation.
Increase well productivity through
develop 5 areas.
the implementation of best practices.
Apply technological solutions to face challenging activities challenging activities.
Redesign wells and infrastructure works to correspond to the conditions applicable to the field. pp
Improve contractual terms with to reduce costs.
Develop business models in
14
Develop business models in accordance to the characteristics of Chicontepec, utilizing third parties.

Mature Fields Represent an Opportunity to Generate Value
202 marginal fields
▪ 202 marginal fields have been identified, with proved reserves representing 29 percent of total reserves. This implies a great
Remaining Reserves and Production to be Recovered (MMboe)
139590
228
519786
opportunity for reclassification.
▪ Furthermore, 57 percent of total 228 451
1P 2P 3P Producción
Reservas Documentada AdicionalReserves Documented Additional
Production
, preserves are documented for production. Our goal is to document an additional 139 MMboe.Benefits
▪ Average production to be recovered in the 2011-2025 period is estimated at 94 Mbd of oil and 162 MMcfd of gas.
▪ The objective is to produce 75 percent of total remaining reserves.j p p g
▪ With support from third parties, we should be able to recover these additional hydrocarbons, through technological improvements and operational efficiency.
▪ Increased execution capacity requires drilling wells in addition to those already
15
c eased e ecut o capac ty equ es d ll g wells add t o to t ose al eady included in our current project portfolio (an average of 500 wells between 2011-2025) in areas such as Cinco Presidentes, Muspac, Poza Rica and Burgos.

Contracting Alternatives: Capability and Execution In the short term, PEMEX must leverage the use of Performance Contracts and alternative contracts
to develop internal capabilities in core businessesto develop internal capabilities in core businesses.
Each project’s execution strategy is defined as a function of its complexity and PEMEX’s internalcapability. The proposed contracting schemes are: Performance Contracts (PC), Field Labs (FL) andTransactional Service Contracts (TSC).
Low Medium High
Internal Capability
InternalCapability:
High PC PCFL
FLTSC
exit
y
Capability:• Human
Resources• Technology• Cost Efficiency
Medium PC FL
FLTSC TSC
Com
ple
Complexity:•Scale
• Cost Efficiency
Low FLTSC TSC TSC
•Scale•Technological
Challenge•Service Market
16
Deep waters Chicontepec Mature Field (Reactivation)
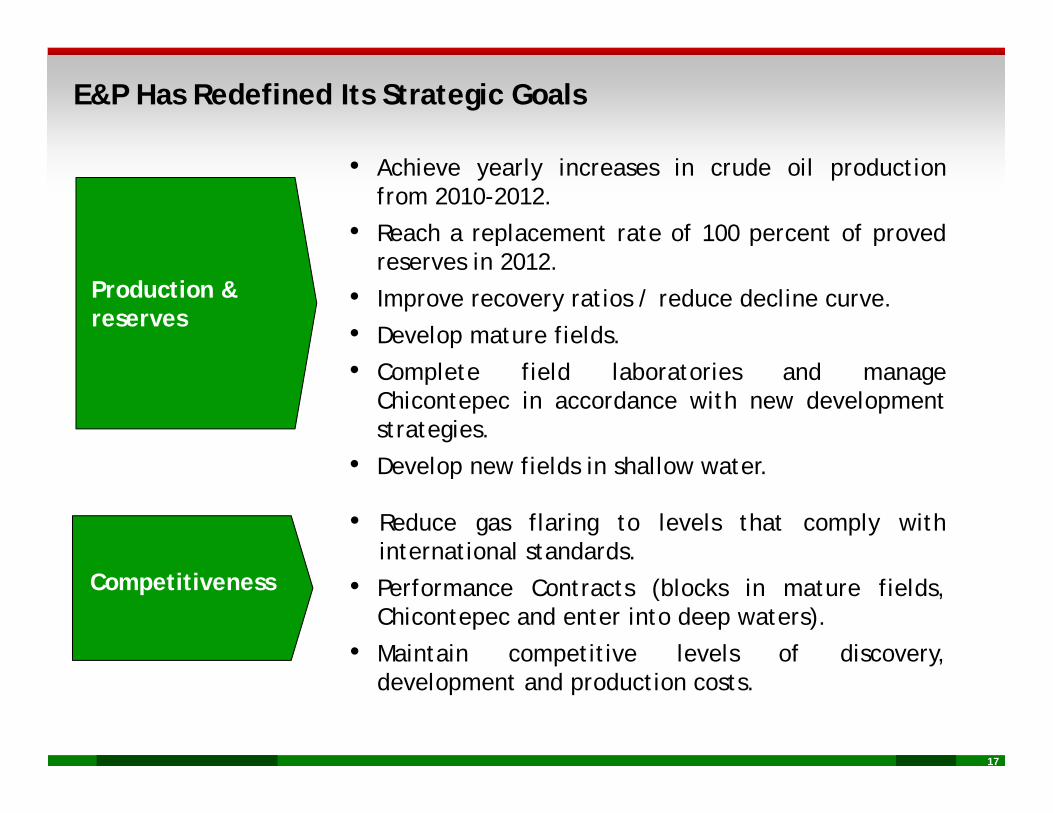
E&P Has Redefined Its Strategic Goals
• Achieve yearly increases in crude oil productionfrom 2010-2012.
• Reach a replacement rate of 100 percent of provedi 2012
Production & reserves
reserves in 2012.
• Improve recovery ratios / reduce decline curve.
• Develop mature fields.
• Complete field laboratories and manageChicontepec in accordance with new developmentstrategies.
D l fi ld i h ll
• Reduce gas flaring to levels that comply withinternational standards.
• Develop new fields in shallow water.
Competitiveness • Performance Contracts (blocks in mature fields,Chicontepec and enter into deep waters).
• Maintain competitive levels of discovery,
17
p y,development and production costs.

Content
Energy Reform
Upstream
Downstream
PEMEX Sustainabilityy
Investment Program and Debt Strategy
18
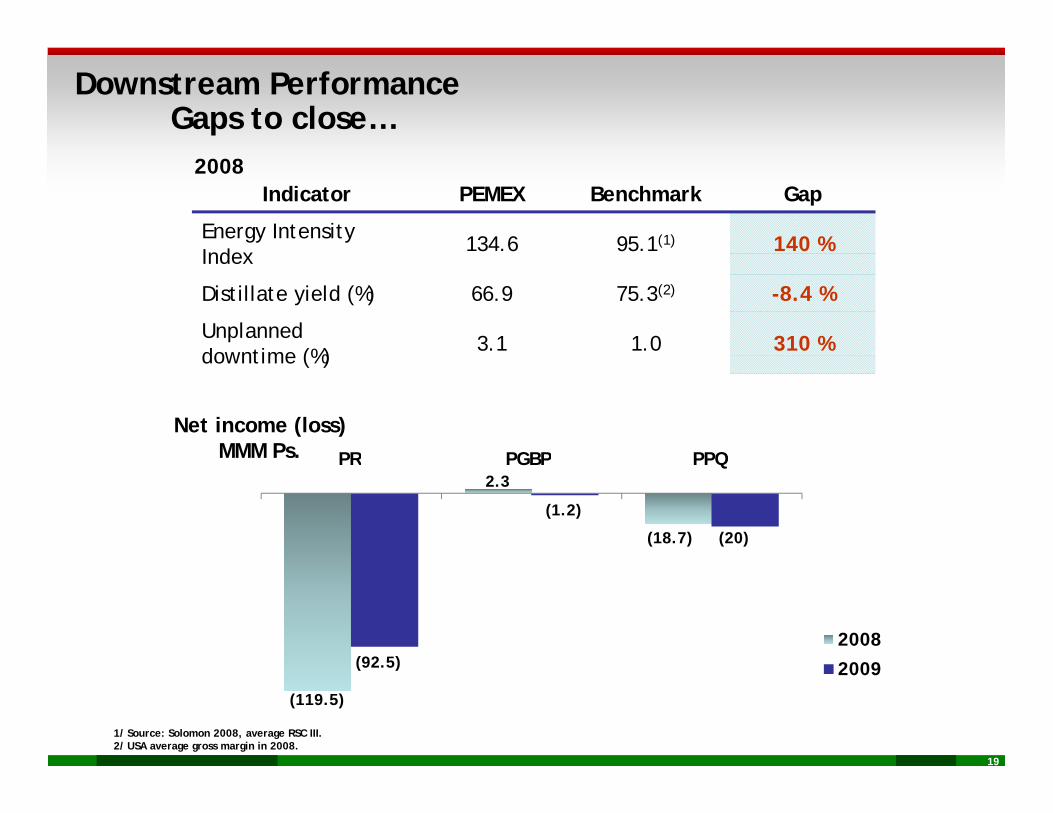
Downstream PerformanceGaps to close…
Indicator PEMEX Benchmark Gap
Energy Intensity Index 134.6 95.1(1) 140 %
2008
Index
Distillate yield (%) 66.9 75.3(2) -8.4 %
Unplanned downtime (%) 3.1 1.0 310 %downtime (%)
Net income (loss)MMM Ps. PR PGBP PPQ
(20)
. PR PGBP PPQ2.3
(1.2)
(18.7)
2008
2009(92 5)
19
1/ Source: Solomon 2008, average RSC III.2/ USA average gross margin in 2008.
2009
(119.5)
(92.5)

Refining Strategies• Maintenance and reliability improvements.
Increase reliability and profitability
y p• Yield improvements in gasoline and middle distillates.• Integrated optimization of the SNR (National Refining
System).
Deep conversionProjects atMinatitlán, Salamanca and Tula
• Minatitlán to start in 4Q-2010.• Salamanca to start in 2014.• Tula project to be merged with new capacity project.• Salina Cruz scope and startup date to be determined.
New refined products supply • New supply projects under study.
C li i h d d h h i d l l
Fuels qualityNOM-086
• Compliance with standard through imports and localproduction.
• Third and final public bid for gasoline: Dec. 2009.• First public bid for diesel: Jan 2010 (Cadereyta).
R i i bid b i d i 2011
• New pipeline (Tuxpan-México) scheduled to start operationsin 2010.
l f l
Increase importcapacity and
• Remaining bids to be assigned in 2011.
20
• Relocation of terminals.• Redefinition of inventory requirements.• Turnaround maintenance in marine terminals.
strengthen storage and distribution
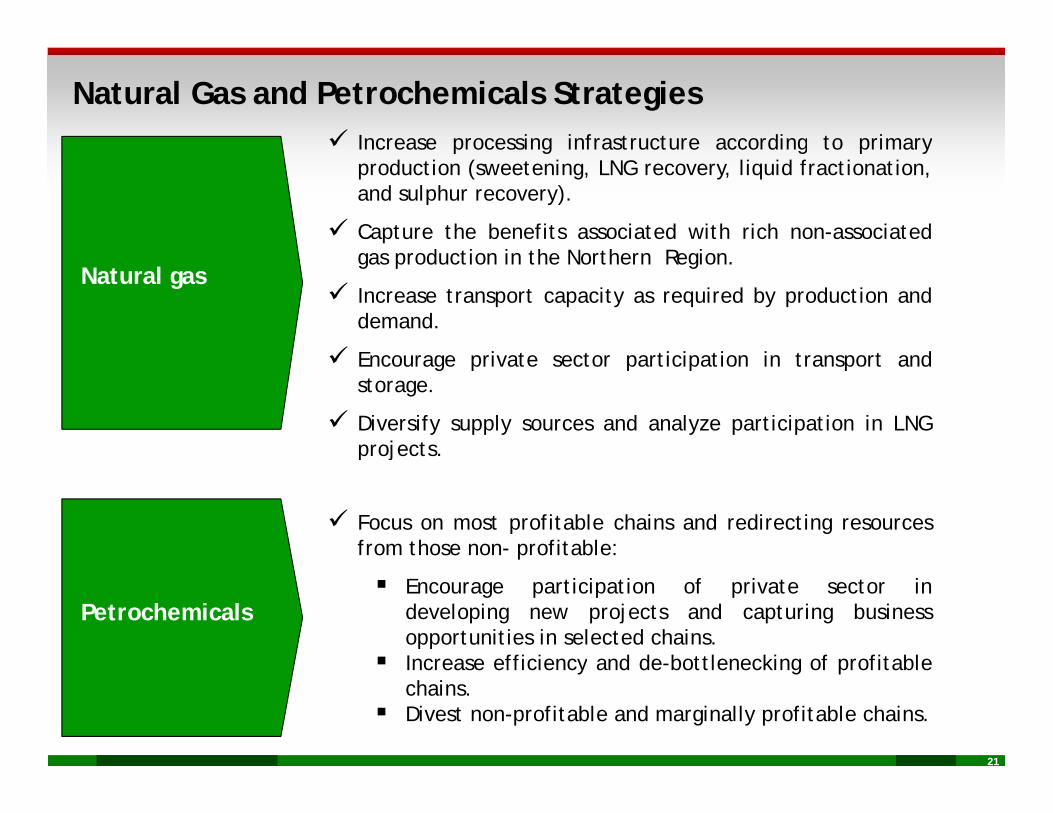
Natural Gas and Petrochemicals Strategies Increase processing infrastructure according to primaryp g g p y
production (sweetening, LNG recovery, liquid fractionation,and sulphur recovery).
Capture the benefits associated with rich non-associatedg d ti i th N th R gigas production in the Northern Region.
Increase transport capacity as required by production anddemand.
Encourage private sector participation in transport and
Natural gas
Encourage private sector participation in transport andstorage.
Diversify supply sources and analyze participation in LNGprojects.p j
Focus on most profitable chains and redirecting resourcesfrom those non- profitable:
Petrochemicals Encourage participation of private sector in
developing new projects and capturing businessopportunities in selected chains.
Increase efficiency and de-bottlenecking of profitable
21
Increase efficiency and de-bottlenecking of profitablechains.
Divest non-profitable and marginally profitable chains.
Content
Energy Reform
Upstream
Downstream
PEMEX Sustainabilityy
Investment Program and Debt Strategy
22

Public Finance Public Policies
Pemex Sustainability
•Explicit role and objectives of the Federal Government.T t b idi
•Adequate fiscal regime.•Alternative tax sources.
Public Finance Public Policies
•Transparent subsidies.
•Corporate Governance
GovernanceEnergy Security
Equilibrium •Exploration investments.•New market design.•Investment in refining and distribution
•Corporate Governance.•Business decisions autonomy.
•Financial, budgetary and operational flexibility.
•Value creation and growth. •Environmental protection and social responsibility.
distribution.operational flexibility.
PEMEX Long-Term SustainabilityValue c eat o a d g owt .
•Strategic focus and process orientation.•Operational excellence.•Superior project execution.•Infrastructure modernization
v o e tal p otect o a d soc al espo s b l ty.•Industrial Safety.•Flexible labor relationships.•Development of human resources and research and development capabilities
23
•Infrastructure modernization.•Procurement flexibility.•Financial sustainability.
development capabilities.•Alignment of Union and PEMEX objectives.
Content
Energy Reform
U tUpstream
Downstream
PEMEX Sustainability
Investment Program and Debt Strategy
24

Investments (1)(2)(3)
Billion pesosTOTAL 263.4
32.0
251.9
2.0%Pemex-Petroquímica
Pemex- Gas y
113.7 122.9 127.0150.4
170.1201.7
251.9220.0
12%Pemex-Refinación
2.0%Pemex Gas y PetroquímicaBásica
3.
2003 2004 2005 2006 2007 2008 2009 2010 E(7)
Pemex-Exploración y Producción
84%
US$ billion10.7 10.9 10.8 13.8 15.6 18.1(4) 18.6(5) 20.4E(6)(7)
( )
25
(1) Figures may not total due to rounding(2) Includes upstream maintenance expenditures(3) Nominal figures
(4) Pesos per US$: 11.15 (7) “E” means Estimated(5) Pesos per US$: 13.52(6) Pesos per US$: 12.94
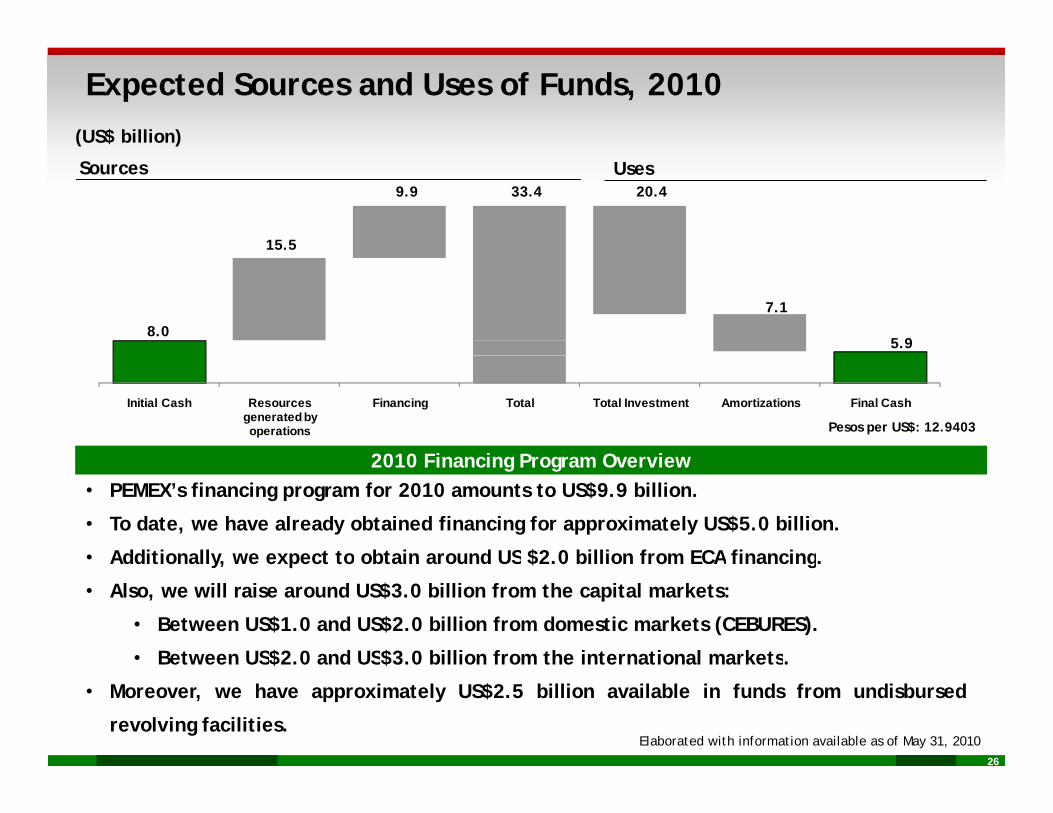
Expected Sources and Uses of Funds, 2010(US$ billion)
15.5
9.9 33.4 20.4Sources Uses
8.0
7.1
5.9
2010 Financing Program Overview
Initial Cash Resources generated by operations
Financing Total Total Investment Amortizations Final Cash
Pesos per US$: 12.9403
• PEMEX’s financing program for 2010 amounts to US$9.9 billion.
• To date, we have already obtained financing for approximately US$5.0 billion.
• Additionally we expect to obtain around US $2 0 billion from ECA financing
2010 Financing Program Overview
Additionally, we expect to obtain around US $2.0 billion from ECA financing.
• Also, we will raise around US$3.0 billion from the capital markets:
• Between US$1.0 and US$2.0 billion from domestic markets (CEBURES).
• Between US$2.0 and US$3.0 billion from the international markets.
26
Between US$2.0 and US$3.0 billion from the international markets.
• Moreover, we have approximately US$2.5 billion available in funds from undisbursed
revolving facilities.Elaborated with information available as of May 31, 2010

Debt Portfolio7 3
Maturity Profile – Consolidated DebtUS$ billion
6.2 5.7
5.2 5.3 4.9
4.3
7.3 US$ billion
Outstanding amount as of March 2010: 50 U.S.$ billion
4.3
2.5 2.2
3.0 3.4
2010 2011 2012 2013 2014 2015 2016 2017 2018 2019 2020
Debt by InstrumentPercentage
Debt by Currency ExposurePercentage
Pesos20%4%
Other
Cebures
49%15%
15%
BankLoans
InternationalBonds
27
Dollars80%
17%ECAs