uptake and partitioning of mineral nutrients · uptake and partitioning of mineral nutrients in...
TRANSCRIPT
UPTAKE AND PARTITIONING OF MINERAL NUTRIENTS
IN CONCORD GRAPE
By
SUPHASUK PRADUBSUK
A dissertation submitted in partial fulfillment of the requirements for the degree of
DOCTOR OF PHILOSOPHY IN SOIL SCIENCE
WASHINGTON STATE UNIVERSITY
Department of Crop and Soil Science
MAY 2008

ii
To the faculty of Washington State University:
The members of the committee appointed to examine the dissertation of SUPHASUK PRADUBSUK find it satisfactory and recommend that it be accepted.
Chair
iii
ACKNOWLEDGEMENTS
I would like to express my gratitude for everyone who helped me throughout the
completion of my degree: First and foremost, my advisor, Joan Davenport, who not only
brought me into this program but also encouraged and challenged me to accomplish it. Her
steady energy, high-quality work and creativity has always been my inspiration on research.
I am very grateful to the other members of my committee, Richard Koenig, Robert
Stevens, Markus Keller, and Donald Horneck, for providing me critical research insights and
answering my questions with their valuable time. Their academic excellence has also been a
great value to my dissertation.
I would like to thank the faculty of WSU that have done an excellent job of
teaching the courses I have taken as well as WSU Crop and Soil Science department for
their help during my four years of study here.
I would like to acknowledge my co-workers, Kyle Bair, Kelly Whitley, and Jaimi
Marden for fieldwork support, technical assistance and sample analysis. Also thanks to all the
summer students who have helped me collect and process samples.
I want to express my deepest gratitude to my passed away father, whom I will always
remember as my first teacher, to my mother and my brother for believing in me and tirelessly
encouraging me to reach my goals. Without their love and support, the success of this
program would not have been possible.
Finally, I want to thank Washington State Concord Grape Research Council for
providing the financial support for this research.

iv
UPTAKE AND PARTITIONING OF MINERAL NUTRIENTS IN CONCORD GRAPE
Abstract
by SUPHASUK PRADUBSUK, Ph.D. Washington State University
May 2008 Chair: Joan R. Davenport
The objectives of this research were to develop methodology for root and tissue
sampling to monitor the nutrient status of Concord grapes (Vitis labruscana Bailey),
investigate seasonal distribution pattern of Concord grape roots, investigate seasonal
pattern of macronutrients and micronutrient uptake and redistribution in Concord grapes,
and identify the tissue type and the best time to sample grapevines for routine nutritional
evaluation.
The study was conducted in a 42 year-old Concord vineyard. The site was furrow
irrigated fine sandy loam. In 2005, six vines were excavated at 6500 C degree days. The
results showed a higher density of fine roots when sample spacing was closer to the vine
trunk at 20, 60, 120 cm from the vine trunk.
In 2006, four vines were excavated at winter pruning, budbreak, 3-4 leaves,
bloom, veraison, harvest, and post-harvest. Different tissue fractions were measured for
biomass and analyzed for C, N, P, K, Ca, Mg, B, Fe, Mn, Cu and Zn. Similar nutrient
concentrations between fruiting shoots and vegetative shoots as well as between trunk and
cordon throughout the growing season suggests that the most efficient way to sample the
whole plant tissues for 2007 was to collect 9 tissue types (woody tissues, canes, coarse
roots, fine roots, shoots, leaf blades, petioles, shoot tips and clusters) in parallel growth
stages to 2006.
The result showed that the seasonal dynamics of nutrient contents, except Fe, Cu
and Zn, which highly fluctuated between years, shared a practical pattern: translocation of
v
nutrients from woody tissues to active growing organs at the beginning of season,
majority uptake of N, Ca and Mn from soil occurred from bloom to harvest while P, K,
Mg and B occurred from bloom to veraison, and restoration of N, P, K, Ca, Mg, B and
Mn back to woody tissues occurred after veraison until before leaf fall with no further
nutrient uptake. Leaf blade analysis at bloom seems to best to represent vine’s nutrient
status for fertilizer recommendation since substantial nutrient uptake from the soil
occurred after bloom and leaf blades indicate overall status of nutrients.
vi
TABLE OF CONTENTS Page
ACKNOWLEDGEMENTS........................................................................................... iii ABSTRACT..................................................................................................................
iv
LIST OF TABLES.........................................................................................................
vii
LIST OF FIGURES.......................................................................................................
ix
CHAPTER ONE. LITERATURE REVIEW.................................................................
1
Literature Cited..................................................................................................... 7 CHAPTER TWO. ESTABLISHMENT OF METHODOLOGY FOR PLANT TISSSUE AND ROOT SAMPLING
Introduction.......................................................................................................... 11 Materials and Methods......................................................................................... 13 Results and Discussion......................................................................................... 14 Conclusions.......................................................................................................... 17 Literature Cited..................................................................................................... 18 Table..................................................................................................................... 21 Figures.................................................................................................................. 22
CHAPTER THREE. DISTRIBUTION OF CONCORD ROOT
Introduction.......................................................................................................... 26 Materials and Methods......................................................................................... 29 Results and Discussion......................................................................................... 30 Conclusions......................................................................................................... 33 Literature Cited..................................................................................................... 34 Tables................................................................................................................... 37 Figures.................................................................................................................. 40
CHAPTER FOUR. MINERAL NUTRIENT PARTITIONING AND UPTAKE IN CONCORD GRAPE
Introduction.......................................................................................................... 46 Materials and Methods......................................................................................... 48 Results and Discussion......................................................................................... 49 Conclusions.......................................................................................................... 62 Literature Cited..................................................................................................... 64 Tables................................................................................................................... 67 Figures.................................................................................................................. 73
CHAPTER FIVE. SUMMARY AND CONCLUSIONS............................................. 76
vii
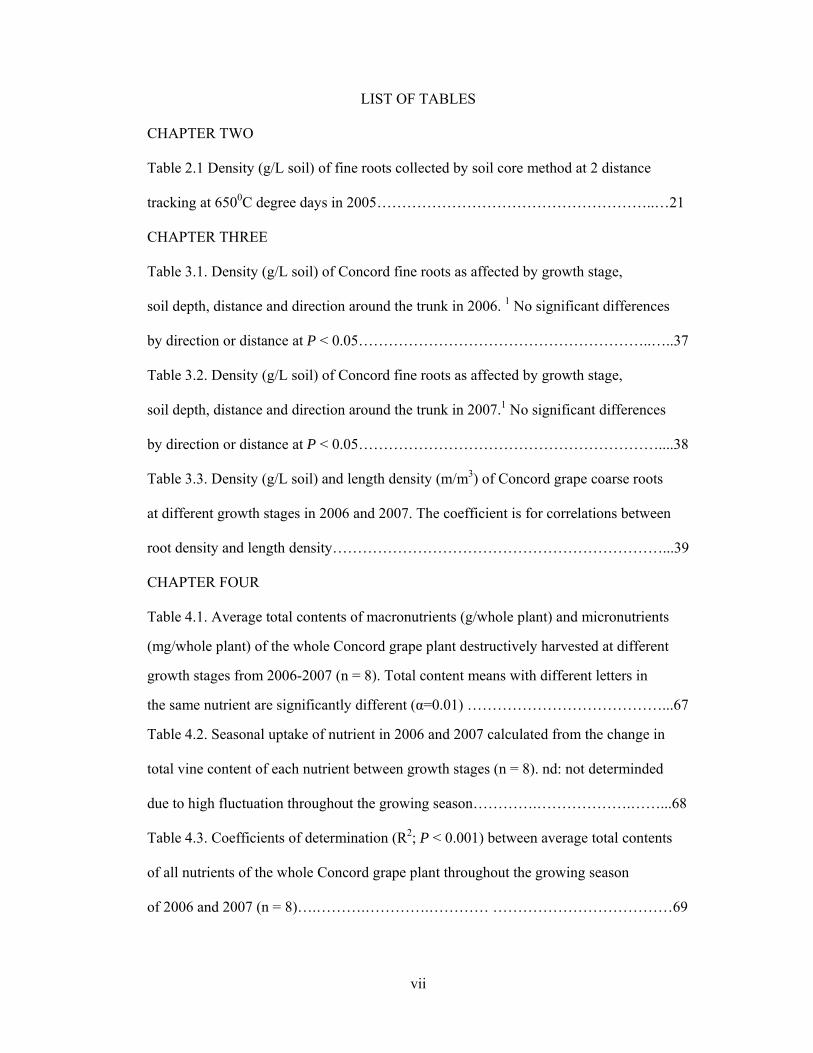
LIST OF TABLES
CHAPTER TWO
Table 2.1 Density (g/L soil) of fine roots collected by soil core method at 2 distance
tracking at 6500C degree days in 2005………………………………………………..…21
CHAPTER THREE
Table 3.1. Density (g/L soil) of Concord fine roots as affected by growth stage,
soil depth, distance and direction around the trunk in 2006. 1 No significant differences
by direction or distance at P < 0.05…………………………………………………..…..37
Table 3.2. Density (g/L soil) of Concord fine roots as affected by growth stage,
soil depth, distance and direction around the trunk in 2007.1 No significant differences
by direction or distance at P < 0.05……………………………………………………....38
Table 3.3. Density (g/L soil) and length density (m/m3) of Concord grape coarse roots
at different growth stages in 2006 and 2007. The coefficient is for correlations between
root density and length density…………………………………………………………...39
CHAPTER FOUR
Table 4.1. Average total contents of macronutrients (g/whole plant) and micronutrients
(mg/whole plant) of the whole Concord grape plant destructively harvested at different
growth stages from 2006-2007 (n = 8). Total content means with different letters in
the same nutrient are significantly different (α=0.01) …………………………………...67
Table 4.2. Seasonal uptake of nutrient in 2006 and 2007 calculated from the change in
total vine content of each nutrient between growth stages (n = 8). nd: not determinded
due to high fluctuation throughout the growing season………….……………….……...68
Table 4.3. Coefficients of determination (R2; P < 0.001) between average total contents
of all nutrients of the whole Concord grape plant throughout the growing season
of 2006 and 2007 (n = 8)….……….………….………… ………………………………69
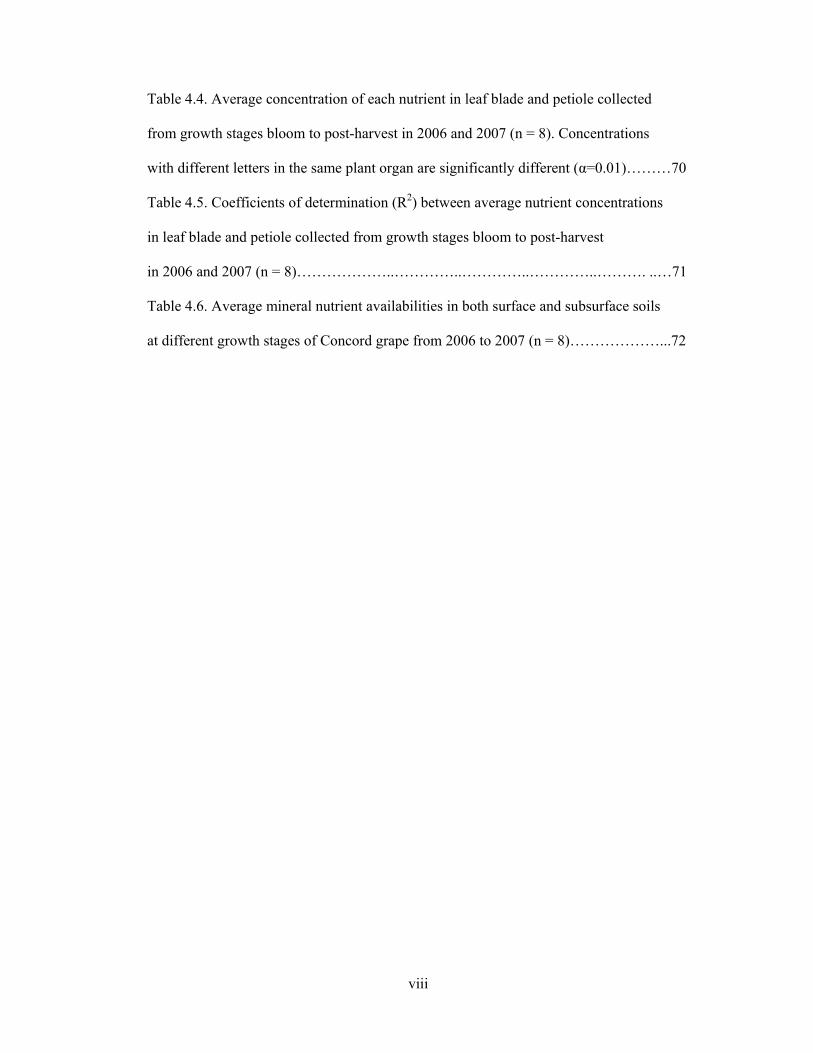
viii
Table 4.4. Average concentration of each nutrient in leaf blade and petiole collected
from growth stages bloom to post-harvest in 2006 and 2007 (n = 8). Concentrations
with different letters in the same plant organ are significantly different (α=0.01)………70
Table 4.5. Coefficients of determination (R2) between average nutrient concentrations
in leaf blade and petiole collected from growth stages bloom to post-harvest
in 2006 and 2007 (n = 8)………………..…………..…………..…………..………. ..…71
Table 4.6. Average mineral nutrient availabilities in both surface and subsurface soils
at different growth stages of Concord grape from 2006 to 2007 (n = 8)………………...72
ix
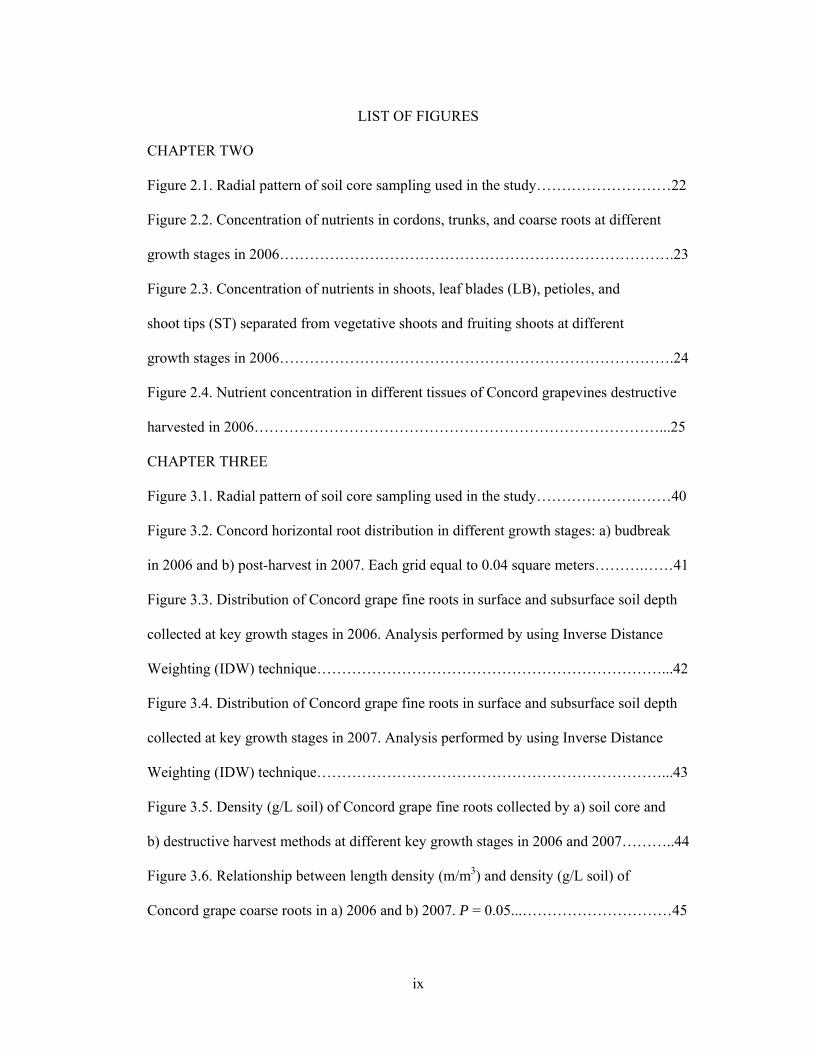
LIST OF FIGURES
CHAPTER TWO
Figure 2.1. Radial pattern of soil core sampling used in the study………………………22
Figure 2.2. Concentration of nutrients in cordons, trunks, and coarse roots at different
growth stages in 2006…………………………………………………………………….23
Figure 2.3. Concentration of nutrients in shoots, leaf blades (LB), petioles, and
shoot tips (ST) separated from vegetative shoots and fruiting shoots at different
growth stages in 2006…………………………………………………………………….24
Figure 2.4. Nutrient concentration in different tissues of Concord grapevines destructive
harvested in 2006………………………………………………………………………...25
CHAPTER THREE
Figure 3.1. Radial pattern of soil core sampling used in the study………………………40
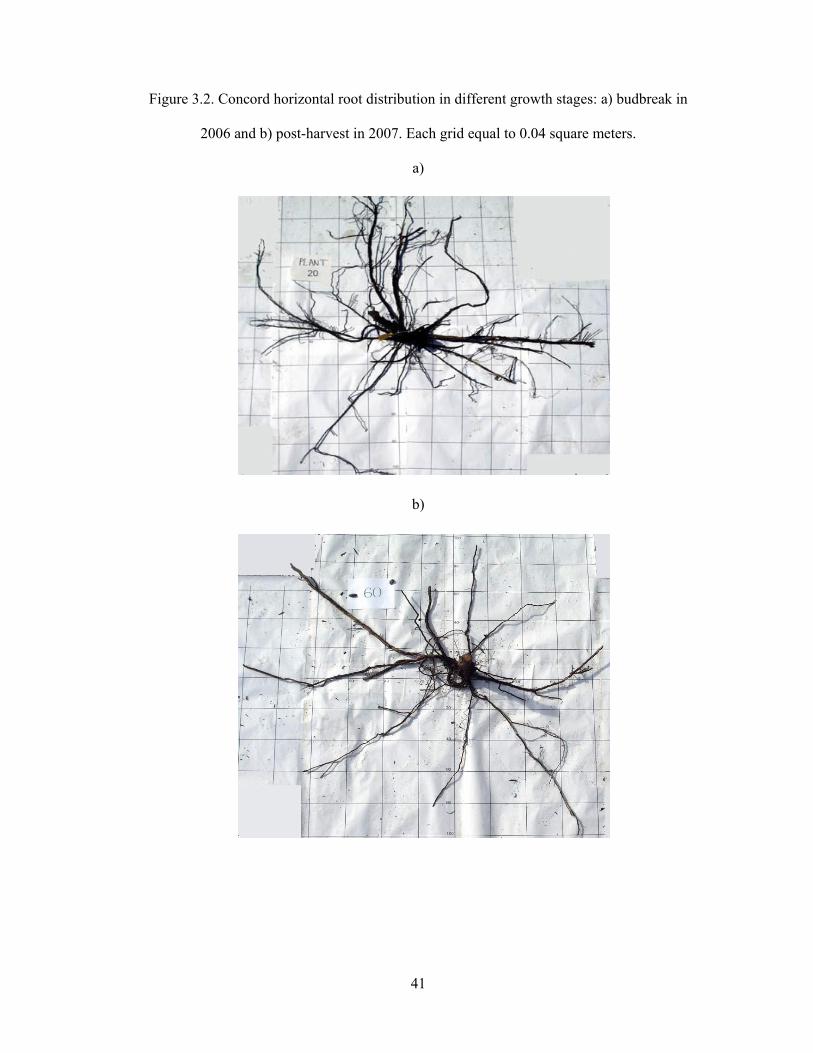
Figure 3.2. Concord horizontal root distribution in different growth stages: a) budbreak
in 2006 and b) post-harvest in 2007. Each grid equal to 0.04 square meters……….……41
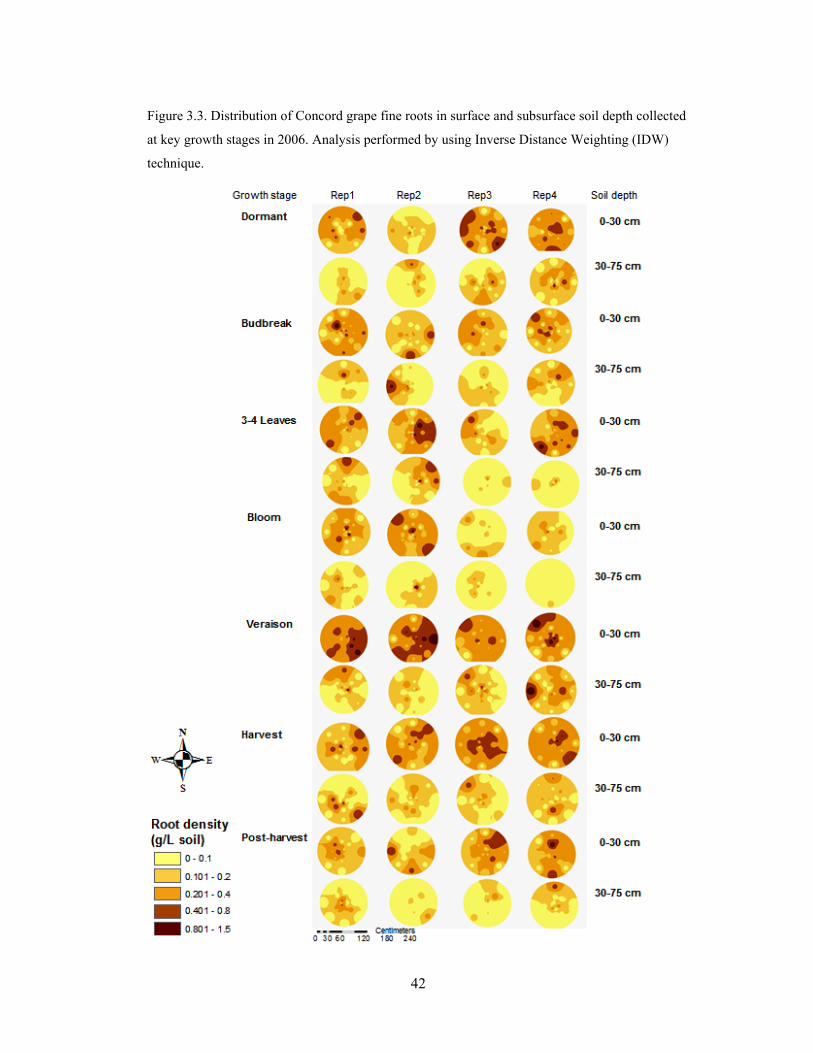
Figure 3.3. Distribution of Concord grape fine roots in surface and subsurface soil depth
collected at key growth stages in 2006. Analysis performed by using Inverse Distance
Weighting (IDW) technique……………………………………………………………...42
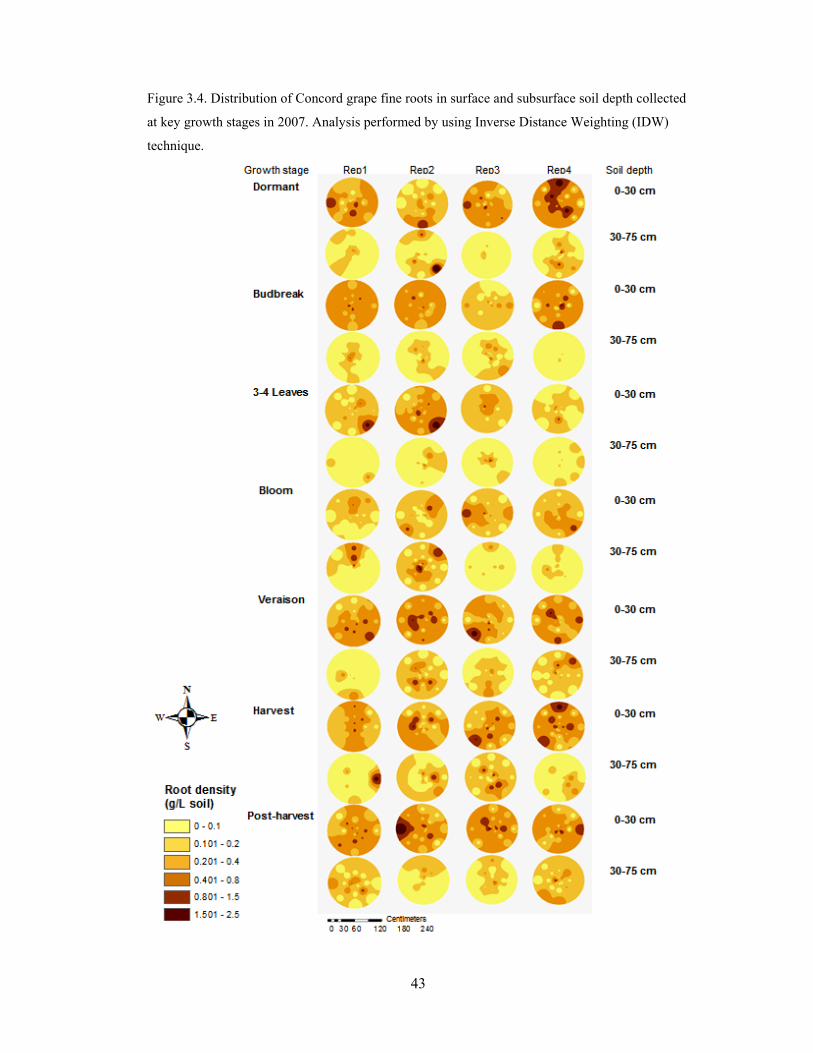
Figure 3.4. Distribution of Concord grape fine roots in surface and subsurface soil depth
collected at key growth stages in 2007. Analysis performed by using Inverse Distance
Weighting (IDW) technique……………………………………………………………...43
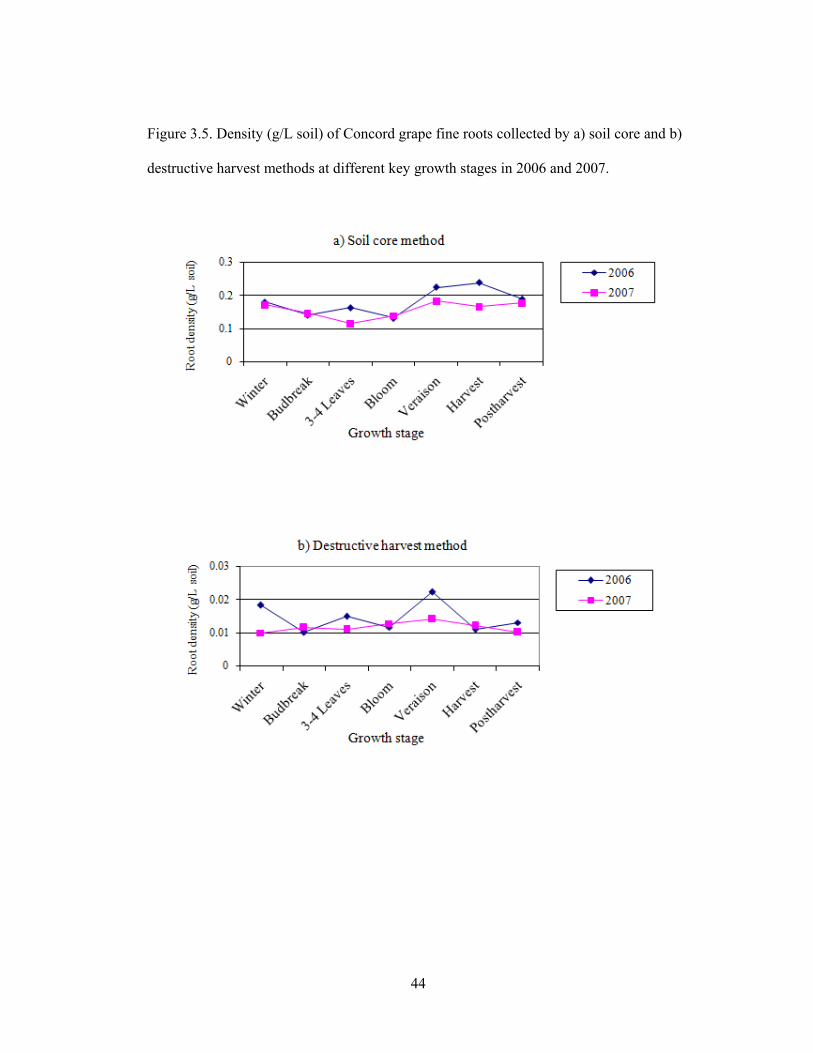
Figure 3.5. Density (g/L soil) of Concord grape fine roots collected by a) soil core and
b) destructive harvest methods at different key growth stages in 2006 and 2007………..44
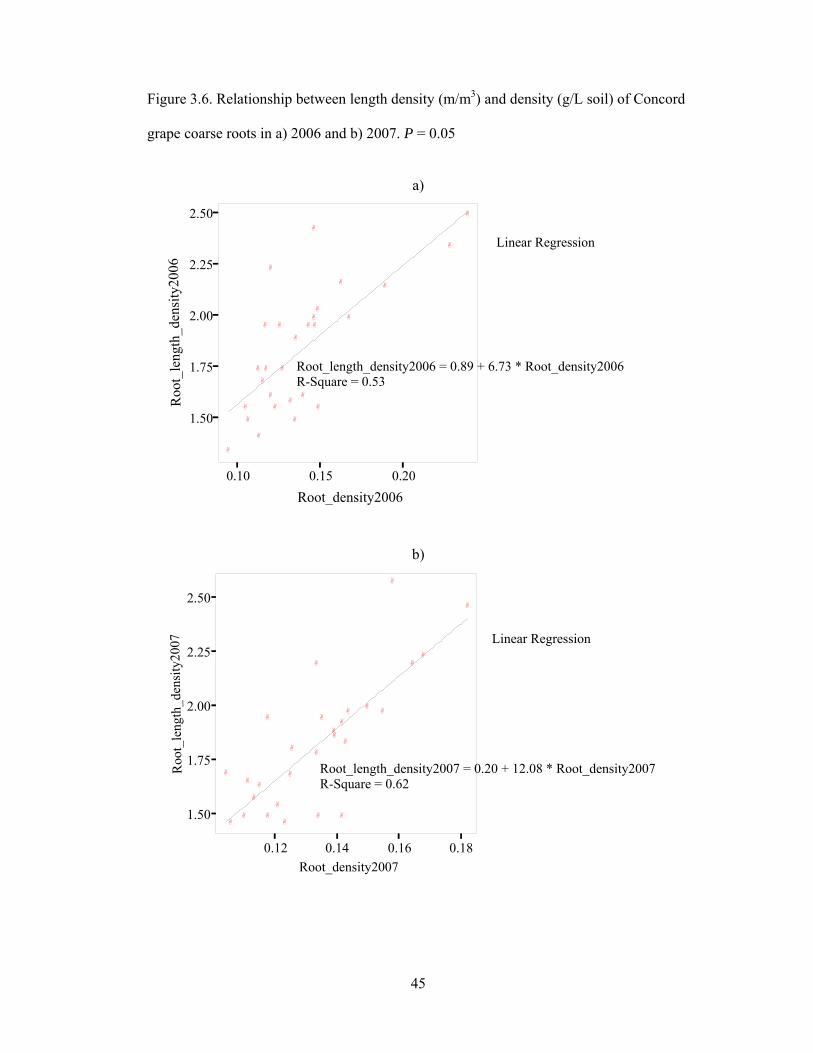
Figure 3.6. Relationship between length density (m/m3) and density (g/L soil) of
Concord grape coarse roots in a) 2006 and b) 2007. P = 0.05...…………………………45
x
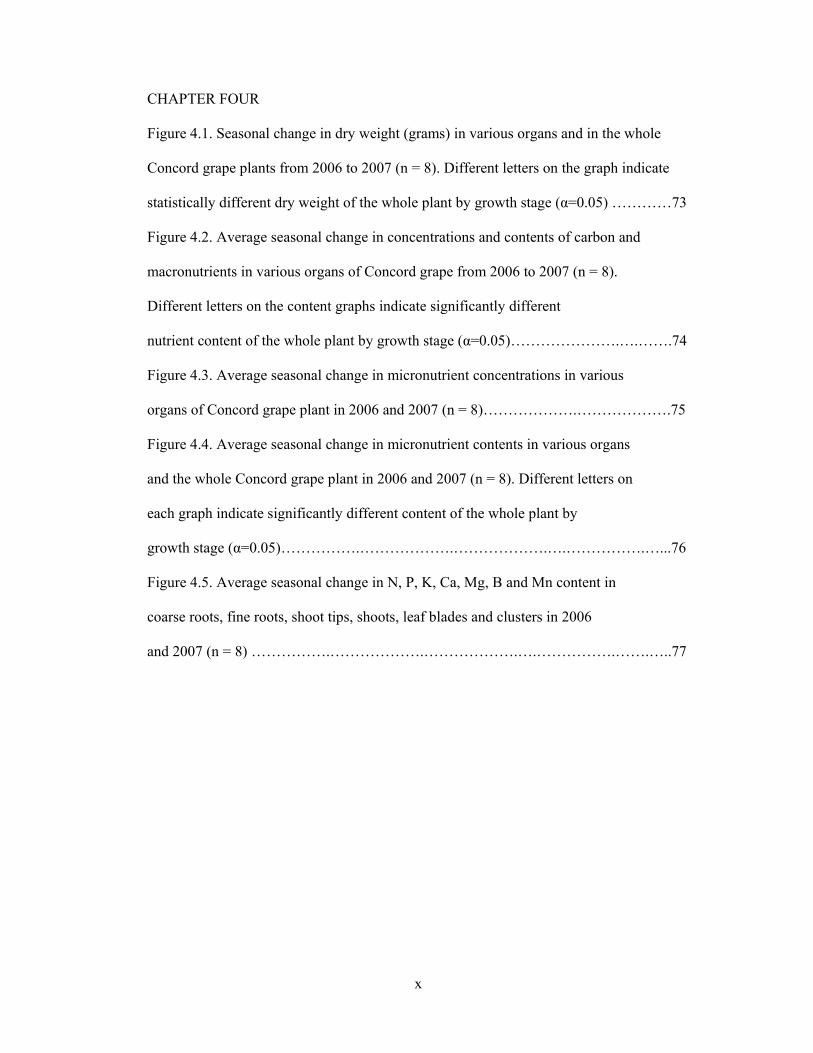
CHAPTER FOUR
Figure 4.1. Seasonal change in dry weight (grams) in various organs and in the whole
Concord grape plants from 2006 to 2007 (n = 8). Different letters on the graph indicate
statistically different dry weight of the whole plant by growth stage (α=0.05) …………73
Figure 4.2. Average seasonal change in concentrations and contents of carbon and
macronutrients in various organs of Concord grape from 2006 to 2007 (n = 8).
Different letters on the content graphs indicate significantly different
nutrient content of the whole plant by growth stage (α=0.05)………………….….…….74
Figure 4.3. Average seasonal change in micronutrient concentrations in various
organs of Concord grape plant in 2006 and 2007 (n = 8)……………….……………….75
Figure 4.4. Average seasonal change in micronutrient contents in various organs
and the whole Concord grape plant in 2006 and 2007 (n = 8). Different letters on
each graph indicate significantly different content of the whole plant by
growth stage (α=0.05)…………….……………….……………….….…………….…...76
Figure 4.5. Average seasonal change in N, P, K, Ca, Mg, B and Mn content in
coarse roots, fine roots, shoot tips, shoots, leaf blades and clusters in 2006
and 2007 (n = 8) …………….……………….……………….….…………….…….…..77
1
CHAPTER ONE
LITERATURE REVIEW
Grape (Vitis sp.) is a perennial crop in which mineral nutrient concentration
changes over time throughout the growing season. Some of the mineral nutrients are
newly taken up from the soil each year and some are redistributed throughout the plant
from woody and root tissues that function as storage organs. Mineral uptake can occur
throughout the year, although the majority occurs during the growing season. Concord
grape (Vitis labruscana Bailey) has emerged as the dominant cold climate American
variety. Washington is the leading state in Concord grape production, and accounts for
approximately 50 percent of the U.S. production (USDA NASS, 2008). Concord grape
does not reach full production until about the fifth year after planting (Aegerter and
Folwell, 1996). Size and seasonal duration of vegetative, reproductive and storage sinks
might vary with vine age (Borchert, 1976), cultivars (Colugnati et al., 1997), and variable
weather conditions (Robinson, 2005). Direct comparison of winegrape (Vitis vinifera L.)
and Concord nutrient uptake and portioning may not be possible due to differences in
management strategies (e.g., pruning, thinning) as well as desired crop yield levels
(typically less than 8 Mg/ha for wine grape and over 20 Mg/ha for Concord).
Petiole analysis is a useful tool that commercial grape growers use to determine
nutrient status of a vine during the growing season for fertilizer recommendations.
However, concentrations in this plant part do not provide information on nutrient uptake
or allocation of nutrients in various organs. With the economic pressures for high yields
and production efficiency of juice grapes in the US, growers are encouraged to use other
information regarding plant growth and fruit quality, specific to their site, to support the
interpretation of leaf or petiole nutrient data. Changes in whole-vine nutrient content
(concentration x biomass) is exceptionally important to understand mineral nutrient
2
uptake in grapes, since grapevines have the capacity to store and re-allocate potentially
large quantities of carbon and mineral nutrient reserves (Roubelakis-Angelakis and
Kliewer, 1992). To understand the relationship between vine performance (i.e., yield,
quality) and the concentration of mineral nutrients in specified parts of grape plants, there
is limited quantitative knowledge of nutrient uptake patterns in mature grapevines,
presumably because of the difficulties in experimentation presented by large biomass.
Nitrogen has been the primary nutrient examined in whole-vines studies. Most
studies report that grapevine takes up the most N between bloom and veraison (Williams,
1987; Lohnertz, 1991; Williams and Biscay, 1991; Hanson and Howell, 1995; Bates et
al., 2002). However, Conradie (1980, 1981) reported substantial N uptake after harvest in
potted Chenin Blanc grown in the South Africa. He reported N uptake during the
postharvest period comprised 27% and 37% of the total annual N uptake (Conradie, 1980,
1986) and provided 60% of the stored N for the next season (Conradie, 1992).
Cheng and Xia (2004) experimented in one year old Concord grape and found that
fall foliar urea application increased the proportion of vine N content mobilized for the
growth of shoots, leaves and fruits. They reported that both vegetative growth and
fruiting of young Concord vines are largely determined by reserve N, not by reserve
carbohydrates, and that current-season N supply plays a very important role in sustaining
vine growth and development, especially fruit growth. However this significant effect
might be seen only in young grape plants as a larger proportion of the N taken up during
active vine growth is used for structural growth and less is available for storage.
While research focusing on N uptake in whole vines has been conducted in
several different growing regions, little has been done on other nutrients. Potassium
uptake in whole vines was examined in several studies (Conradie, 1981; Williams and
Biscay, 1991; and Schreiner et al., 2006). These studies showed that the bulk of K uptake
3
occurred between bloom and veraison. Of the three studies, only Conradie (1981) in
South Africa and Schreiner et al. (2006) in Oregon examined P, Ca, and Mg uptake in
their whole vine studies. Their results agreed that the time of maximum Ca and Mg
uptake was between bloom and veraison. However, the Oregon study on 23-year-old
Pinot Noir showed that P uptake occurred predominantly before bloom while the South
African study on 2-year-old Chenin Blanc showed peak uptake between bloom and
veraison. This is probably because differences in subtle factors such as vine age, soil
texture, temperature, water management, root density and nutrient availability contribute
to differences in grapevine performance and nutrient uptake. Schreiner et al. (2006) also
reported that uptake for most macro elements was very closely related to canopy demand,
whereas concentrations of micronutrients Fe, Mn, B, Zn, and Cu in whole vine varied
highly from vine to vine.
The root system serves important physiological and biological functions, and it
has been shown that both grape yield and quality are dependent on root health (Morlat
and Jaquet, 1993). Nutrient uptake is a key for vine growth and fruit production. While
nutrient uptake depends on the quality of root environment, there are difficulties in
properly calibrating tissue tests in woody perennials because precise experiments are not
easy to conduct with large, long-lived plants that explore a variable root zone (Robinson,
2005). Root spatial distribution is mainly related to local soil environment, bulk density,
and water content. The ratio of fine to coarse roots increased in soil with high water
potential (Van Zyl, 1988). Grapevine root density increases with the age of the plant to
reach a constant value after 5 to 10 years (Smart and Coombe, 1983). Depending on age,
variation in root diameters is usually between 6-100 mm. Small permanent roots (diam. 1-
2 mm) arise from the main framework and grow horizontally and vertically. These roots
extend and branch in a few main extension root that are generally thin (diam. 1-2 mm).
4
These fine roots grow rapidly and die within weeks after emergence but are replaced
continuously (Richards, 1983)
Grapevine roots show a very distinctive growth pattern with two main growing
phases, one at flowering and the other near harvest (Van Zyl, 1988). This differs from
woody tree species where the main root growth phase occurs before budburst (Deans and
Ford, 1986). Grapevines do not form terminal buds at the end of shoots, which continue
to grow late into the season, with individual flower parts forming soon after budbreak
(Smart and Coombe, 1983). This probably results from the temperature requirement and
the sink demand related to the growth of shoots and roots. In early spring, soil
temperature is lower than air temperature, which favors bud growth. Shoots are active
sinks for assimilates and root growth is apparently delayed until the set of leaves emerge
which allow a net positive photosynthesis balance. Later, berry growth competes with
roots for assimilates until harvest (Delrot et al., 2001).
Changes in root physiology with root age can strongly influence nutrient
acquisition and competition. Bouma et al. (2001) measured the effect of root age on
respiration and P uptake in fine roots of apple (Malus domestica Borkh) and orange
(Citrus aurantium L.) and found both declined rapidly with age. The decline in P
absorptive capacity with root age is consistent with several studies showing a decline in
hydraulic conductivity. Van Rees and Comerford (1990) reported that pigmented roots
had diminished Ca and K uptake compared to young white roots. Volder et al. (2005)
reported that both nitrate uptake and root respiration declined rapidly with increasing root
age. They found that the decline in both N uptake and root respiration corresponded with
a strong decline in root N concentration, suggesting N translocation out of the roots.
However, they found no correlation between root age and specific root length or
5
diameter, nor a relationship between root age and C concentration, which suggest that the
decline in N concentration was due to N moving out of roots, rather than a dilution effect.
Plant nutrient demand changes with different stages of vine physiological
development, resulting in different nutrient concentration throughout the plant
(Christensen, 1969). When nutrient deficiency occurs, mobile nutrients are moved from
older leaves to the growing tip and symptoms appears in the older tissue, whereas
immobile nutrients show deficiency symptoms in actively growing shoot tips or in the
younger leaves (Robinson, 2005). Several investigations have compared two methods of
tissue analysis, total N in leaf blades or petioles vs. NO3- in petioles, to assess N status in
grapevines. The main disadvantage of using total N as an indicator of the N status of
grapevines in the relatively narrow range often found between deficient and adequately
supplied vineyard with N (Kliewer, 1971). Bertoni and Morard (1982) found that the
level of total N in blade and petioles was not closely correlated and suggested that both
tissue should be analyzed separately. Christensen (1984) reported that leaf blade total N
was not as useful as petiole NO3- to determine N needs of vineyards. Although blades
contain more N than petioles, much of it is in organic forms, such as proteins which tend
not to vary as much as NO3- and NH4
+ in grape leaf tissues.
Petiole nutrient results may not always reflect the nutrient status in other parts of
the vine. Davenport et al. (2003) studied Concord grape response to variable rate fertilizer
application by using soil and tissue samples to evaluate crop nutrient status. The research
found that analysis of leaf blades was more related to yield than petiole analysis.
Different leaf sampling times have been studied for the nutritional diagnosis of vineyards.
Choice of sampling time should be made according to the diagnostic purpose. For
example, a four year study by Porro et al. (1995) on leaf sampling time to diagnose
nutrient status of Chardonnay in Italy found that lowest variability in leaf nutrient levels
6
was at fruit set for P, K and Mg, and at veraison for N, Ca and B. They concluded that
fruit set is the most suitable time to evaluate P, K, Ca and Mg status and veraison
sampling better for N.
In cold climate regions, the rapid drop of temperature and short time period
between harvest and leaf fall may significantly affect mobilization of nutrients from
leaves back to storage organs, and may limit nutrient uptake from soil as well.
Understanding nutrient movement throughout various plant tissues and plant nutrient
uptake, as well as the limitation of reserve nutrients, on growth and fruiting of grapevine
is important for optimizing viticultural practices to improve growth and yield in cool
climate regions.
Whole plant sampling can be used to look at nutrient partitioning and distribution/
redistribution. With the extensive root system of Concord grape, fine roots are mainly
involved in nutrient and water uptake. It is also important to develop techniques for fine
root sampling to determine the extent that represents its highest production. This will
make possible of resample the same plant for mass gain, which will pave the way for long
term study in this perennial plant.
The objectives of this research were to (i) develop methodology for root and tissue
sampling to monitor the nutrient status of Concord grapes, (ii) investigate seasonal
distribution pattern of Concord grape fine roots, (iii) investigate seasonal pattern of
macronutrients and micronutrient uptake and redistribution in Concord grapes, and (iv)
identify the choice of tissue type (petiole or leaf blade) and the best time to sample
grapevines for routine nutritional evaluation.
7
LITERATURE CITED
Aegerter, A.F., and R.J. Folwell. 1996. Concord grape establishment and production costs
in Washington. Cooperative extension. Washington State Univ.
Bates, T.R., R.M., Dunst, and P. Joy. 2002. Seasonal dry matter, starch and nutrient
distribution in Concord grapevine roots. HortScience 37: 313-316.
Bertoni, G., and P. Morard. 1982. Blade or petiole analyses as a guide for grape nutrition.
Commun. Soil Sci. Plant Anal. 13: 593-605.
Borchert, R. 1976. The concept of juvenility in woody plants. Acta Hortic. 56: 21–33.
Bouma, T.J., R.D. Yahai., A.D. Elkin, U. Hartmond, D.E. Flores-Alva, and D.M.
Eissenstat. 2001. Estimating age-dependent costs and benefits of root with
contrasting life span: comparing apples and oranges. New Phytologist 150: 685-695.
Cheng, L., G. Xia, and T. Bates. 2004. Growth and fruiting of young ‘Concord’
grapevines in relation to reserve nitrogen and carbohydrates. J. Am. Hortic. Sci.
129: 660-666.
Christensen, P. 1969. Use of tissue analysis in viticulture. Cooperative extension, Pub.
NG10-00. U.C. Kearney Agricultural Center, University of California.
Christensen, L.P. 1984. Nutrient level comparisons of leaf petioles and blades in twenty-
six grape cultivars over three years (1979 through 1981). Am. J. Enol. Vitic. 35:
124-133.
Colugnati, G., A. Boschin, F. Bregant, S. Tagliavini, and M. Montanari. 1997.
Preliminary results concerning the effects of a new fertilizer for grape nutrition.
Acta Hortic. 448: 403-410.
Conradie, W.J. 1980. Seasonal uptake of nutrients by Chenin blanc in sand culture: I.
Nitrogen. S. Afr. J. Enol. Vitic. 1:59-65.
8
Conradie, W. J. 1981. Seasonal Uptake of Nutrients by Chenin Blanc in Sand Culture: II.
Phosphorus, Potassium, Calcium and Magnesium. S. Afr. J. Enol. Vitic. 2(1): 7-13.
Conradie, W.J. 1986. Utilization of nitrogen by the grape-vine as affected by time of
application and soil type. S. Afr. J. Enol. Vitic. 40: 91-98.
Conradie, W.J. 1992. Partitioning of nitrogen by the grapevine during autumn and the
utilization of nitrogen reserves during the following growing season. S. Afr. J. Enol.
Vitic. 13: 45-51.
Hanson, E.J., and G.S. Howell. 1995. Nitrogen accumulation and fertilizer use efficiency
by grapevines in short-season growing areas. HortScience 30(3): 504-507.
Davenport, J.R., J.M. Marden, L.J. Mills, and M.J. Hattendorf. 2003. Response of
Concord grape to variable rate nutrient management. Am J. Enol. Vitic. 54(4): 286-
293.
Deans, J. D., and E. D. Ford. 1986. Seasonal patterns of radial root growth and starch
dynamics in plantation-grown Sitka spruce trees of different ages. Tree Physiology
1: 245-251.
Delrot, S., S. Picaud, and J.P. Gaudillere. 2001. Water transport and Aquaporins in
grapevine. P. 241-262. In K.A. Roubelakis-Angelakis (ed.), Molecular Biology &
Biotechnology of grapevine, Netherlands.
Kliewer, W.M. 1971. Effect of nitrogen on growth and composition of fruits from
‘Thompson Seedless’ grapevines. J. Am. Hortic. Sci. 96: 816-19.
Lohnertz, O. 1991. Soil Nitrogen and the Uptake of Nitrogen in Grapevines. p. 1-11. In
J.M. Rantz, (ed.) Proc. Int. Symp. on Nitrogen in Grapes and Wine, Seattle, WA.
18-19 June 1991. Am. Soc. Enol. And Vitic., Davis, CA.
Morlat, R., and Jacquet, A. 1993. The soil effects on the grapevine toor system in several
vineyards of the Loire valley (France). Vitis. 32 35-42.
9
Porro, D., Stefanini, M., Failla, O., and Stringari, G. 1995. Optimal leaf sampling time in
diagnosis of grapevine nutritional status. Acta Horticulturae 383: 135-142.
Richards, D. 1983. The grape root system. Hortic. Rev. 5: 127-168.
Roubelakis-Angelakis, K.A., and W.M. Kliewer. 1992. Nitrogen metabolism in
grapevine. Hortic. Rev. 14: 407-452.
Robinson, J.B. 2005. Critical plant tissue values and application of nutritional standards
for practical use in vineyards. p. 61-68. In P. Christensen and D.R. Smart (eds.) Proc.
Symp. on Soil Environment and Vine mineral Nutrition, Sandiago, CA. 29-30 June
2004. Am. Soc. Enol. And Vitic., Davis, CA.
Schreiner, R.P., C.F. Scagel, and J. Baham. 2006. Nutrient uptake and distribution in a
mature ‘Pinot Noir’ vineyard. HortScience 41(2): 336-345.
Smart, R.E., and B.G. Coombe. 1983. Water relations in grapevines. In: T.T. Kozlowski
ed. Water deficits and plant growth. New York, United States of America,
Academic Press Inc.
Van Rees, K.C.J., and N. Comerford. 1990. The role of woody roots of slash pine
seedlings in water and nutrient absorption. Can. J. Forest Res. 20: 1183–1191.
Van Zyl, J.L. 1988. Response of grapevine to soil water regimes and irrigation systems.
In: Van Zyl, J.L. (Ed) The grapevine root and its environment. Pretoria: Department
of agriculture and water supply. p 30-43.
Volder, A., D.R. Smart, A.J. Bloom, and D.M. Eissenstat. 2005. Rapid decline in nitrate
uptake and respiration with age in fine lateral roots of grape: implications for root
efficiency and competitive effectiveness. New Phytologist 165: 493-502
USDA-National Agricultural Statistics Service (NASS). 2008. Non-citrus Fruits and Nuts
2007 Preliminary Summary [Online]. Available at
http://usda.mannlib.cornell.edu/usda/current/NoncFruiNu/NoncFruiNu-01-23-
10
2008.pdf (accessed 23 January 2008; verified 23 January 2008). USDA-NASS,
Washington, D.C.
Williams, L.E. 1987. Growth of 'Thompson seedless' grapevines: II. Nitrogen
distribution. J. Am. Soc. Hortic. Sci. 112: 330-333.
Williams, L.E, and P.J. Biscay. 1991. Partitioning of dry weight, nitrogen, and potassium
in Cabernet Sauvignon grapevines from anthesis until harvest. Am. J. Enol. Vitic.
42: 113-117.
11
CHAPTER TWO
ESTABLISHMENT OF METHODOLOGY
FOR PLANT TISSUE AND ROOT SAMPLING
INTRODUCTION
While nutrient uptake is key for vine growth and fruit production, there is limited
understanding of seasonal patterns of nutrient accumulation and uptake in mature, field
grown grapevines largely due to the difficulties of experimentation presented by large
woody biomass and variable root zones. Size and seasonal duration of vegetative,
reproductive and storage sinks can vary with vine age (Borchert, 1976). Research
conducted on the plant nutrient content of potted vines with a continuous nutrient supply
or of field grown young vines, where the roots and permanent tissues are still not fully
developed, may not represent an extensive pattern of nutrient accumulation and uptake
associated with older vines grown in the field. Whereas nutrition experiments on mature
vine have been focused on leaf blade and petiole analysis, they lack data from permanent
structures involved in nutrient storage and the extensive root system involved in water
and nutrient uptake (Chang and Kliewer, 1991; Colugnati et al., 1995; Robinson, 2005).
Hence, these studies only provide a partial picture of nutrient uptake for the whole vine
and may not fully calibrate tissue tests.
Balance of nutrients should be a high priority for vineyard management because
there is a direct impact on how well the plants grow and on juice quality. Concord grape
(Vitis labruscana Bailey) is a cold climate juice grape variety that evolved in the New
England region in predominantly acid soils derived from granite rocks. Approximately 50
percent of the U.S. Concord grape is now grown in Washington State (USDA-NASS,
2008). The neutral to alkaline soils of central and eastern Washington result in a different
12
chemical environment for Concord roots which may limit the availability of many
micronutrients, including Fe, B, Cu, and Zn (Shuman, 1991). Iron deficiency can result in
yield loss because it is one of the most common nutrients associated with chlorosis in
Concord grape growing in calcareous soils where a cold, wet soil environment prior to
bloom impedes the root growth and/or function and triggers plant chlorosis (Davenport
and Stevens, 2006).
Cheng et al. (2004) found that fall foliar urea application increased the proportion
of vine N content mobilized for the growth of shoots, leaves and fruits in one year old
Concord vines. They reported that both vegetative growth and fruiting of young Concord
vines are largely determined by reserve N, not by reserve carbohydrates, and that current-
season N supply plays a very important role in sustaining vine growth and development.
Bates et al. (2002) studied the effects of soil pH on Concord grapevines and reported that
liming soil resulted in higher Mg and lower K concentration in leaf and petiole tissues.
However, excessive K fertilization of grapevines may cause potential loss of juice acidity,
which is deleterious to the quality of grape juice product (Morris et al., 1980). There is a
strong relationship between vine size and nutrient uptake. Schreiner et al. (2006) reported
that uptake for most macronutrients was very closely related to canopy demand, whereas
concentrations of micronutrients Fe, Mn, B, Zn, and Cu in whole vine varied highly from
vine to vine.
Whole plant sampling can be used to look at nutrient partitioning and distribution/
redistribution. We hypothesize that vine destructive harvest, biomass determination, and
nutrient analysis of whole, field-grown Concord grape in association with soil analysis
will provide a full picture of their nutrient partitioning. The objective of the study was to
develop methodology for root and tissue sampling of Concord grape. The aim was to use
13
the acquired methodology in studying nutrient partitioning and uptake at main
physiological stages of Concord grape in the next growing season.
MATERIALS AND METHODS
The study was conducted in a 42 year-old own-rooted Concord single-curtain
vineyard (lat 460 15’ 59” N, long 1190 44’ 4” W) at the Irrigated Agriculture Research and
Extension Center (IAREC) in Prosser, WA. The site is furrow irrigated and has been
managed with uniform fertilization, water and pest management practices. Due to the
great diversity in plant sizes of this very old vineyard, all grape plants in the 1.5 acre
vineyard were measured to determine uniform sized vines for excavation, which included
12.8-15.0 cm trunk circumference at 30 cm above the soil surface, 87-99 cm trunk length
from soil surface to cordon split, and 25-36 cm cordon length prior to attachment to the
cordon wire.
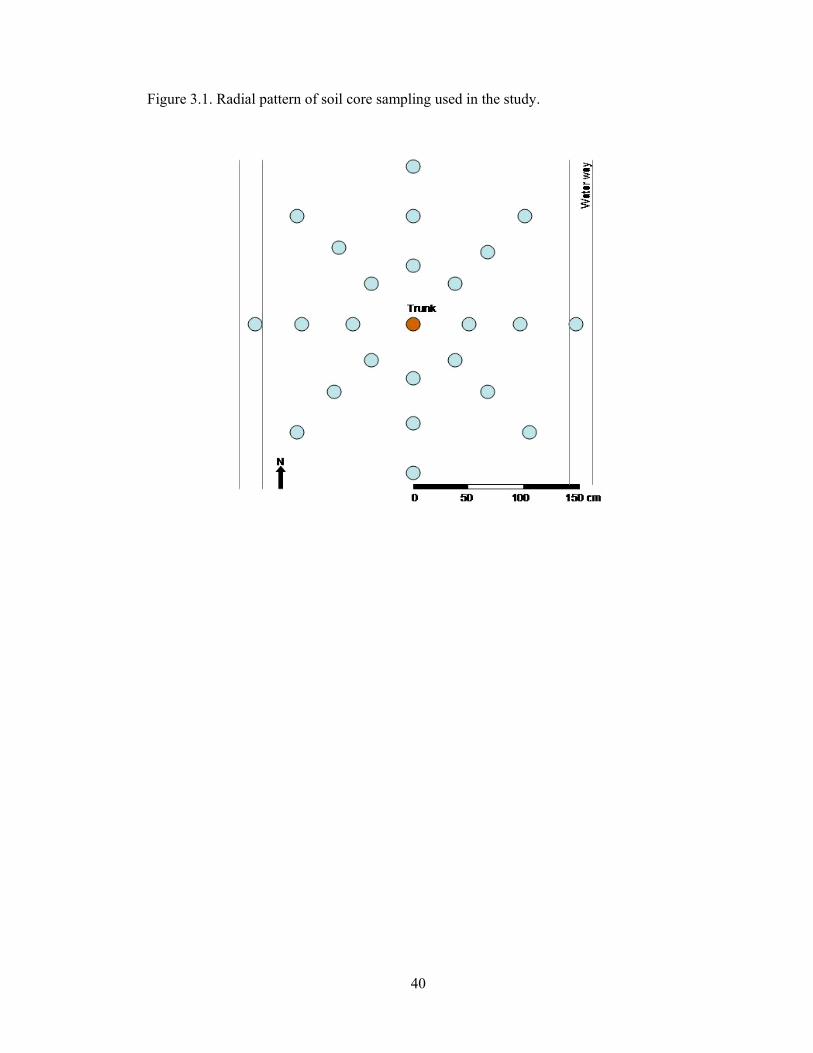
In 2005, at 6500 C degree-days, two different root sample interval spacings (20,
60, 120 cm and 50, 100, 150 cm in a radial pattern around the vine trunk) were compared
on three vines to determine the extent that represented the highest density of fine roots
(Fig. 2. 1). Soil cores (6.25 cm diam.) were collected from 0-30 cm and 30-75 cm to
represent the surface and subsurface soil depths. Soil core samples were composited
across each single radius. Fine roots (< 4 mm diam.) were separated from the soil by
washing through a 2 mm wet sieve and were expressed on a per liter soil basis for
comparison purposes.
In 2006, four whole Concord grape plants were excavated at winter pruning, bud
break, 3-4 leaves, bloom, veraison, harvest, and post-harvest. Separated plant tissues were
dried, weighed, ground and analyzed for nutrient elements. Total N and C were analyzed
using dry combustion (Yeomans and Bremner, 1991) with a LECO CNS 2000 (St.

14
Joseph, MN). Tissue analysis for P, K, Ca, Mg, Na, Cu, Fe, Mn, Zn and B was
determined by commercial lab (Brookside Laboratories, Inc, OH) using Inductively
Coupled Plasma Spectroscopy (Soltanpour et al., 1996). The samples digested with nitric
acid and hydrogen peroxide in a CEM microwave were analyzed on a Thermo Jarrell Ash
1100 ICP (Franklin, MA).
RESULTS AND DISCUSSION
Fine root sampling
As shown in Table 2.1, density of fine roots was higher with spacing closer to the
vine (20, 60, 120 cm) than with more distant spacing (50, 100, 150 cm). The high root
densities are consistent with findings of Bassoi et al. (2003) who studied grapevines cv.
Italia grafted on the rootstock IAC-313 and found grape root concentration decreased
with distance from the trunk within 1 m soil depth and 1 m away from the trunk.
Although Concord grapevine roots on a loess soil were found to reach 4 m in depth and
over 7 m in horizontal spread (Doll, 1955), a vineyard environment with closer vine
spacing resulted in a smaller and denser root system (Morano, 1995).
In subsequent collections, based on 2.4 m vine spacing and 2.7 m row distance,
fine root sampling will be conducted by using the radial pattern at 20, 60, and 120 cm
from the trunk to achieve highest root density without overlapping of roots among
neighboring vines. In addition, each soil core sample (48 samples/plant) will be washed
individually to better illustrate fine root distribution patterns around grape trunk.
Plant tissue sampling: Nutrient composition in different tissues
Concentrations of mineral nutrients in different tissues were significantly
different, except between trunk and cordon (Fig. 2.2) as well as similar tissues - shoots,

15
leaf blades, petioles, and shoot tips separated from fruiting shoots and vegetative shoots
(Fig. 2.3). Concentrations of all nutrients from trunk and cordon were very similar
throughout the growing season and significantly lower than coarse root in every growth
stage for the nutrients N, P, Ca, and Fe. Apparently, nutrient distribution was unrelated to
differentiation among above ground woody tissues as well as among similar tissues from
fruiting shoots and vegetative shoots. Consequently, plant destructive harvest for the 2007
growing season combined woody tissues from cordon and trunk as well as similar tissues
of shoots, leaves, petioles, and shoot tips from vegetative shoots and fruiting shoots.
Petioles showed higher concentrations of K, P, Mg, B and Zn than leaf blades.
This is probably because analysis of petioles indicates the current movement of nutrient
toward the leaf blade and therefore is sensitive to the status of mobile nutrients such as K,
P and Mg. In contrast, concentrations of N, Ca, Mn, Cu and Fe in blades were higher
than in petioles (Fig. 2.3). This is probably because the portion of some nutrients like N
(Christensen, 1984) and Fe (Smith and Cheng, 2006) were in forms that were not
available for assimilation by plants, and immobile nutrients tend not to move around in
the plant phloem (Robinson, 2005). In addition, when compared with petioles, there was
less fluctuation of P, Mg, and Zn concentrations in the blade throughout the growing
season. Thus, blades seem to better indicate overall status of nutrients, including mobile
nutrients.
Blades and shoot tips appeared to have very close nutrient concentrations, except
for Ca, Zn, Mn and B, which had higher concentrations in leaf blades than in shoot tips at
bloom (Fig. 2.3). These are immobile nutrients which do not move freely in the plant
phloem (Marschner, 2002), which means that they cannot be translocated from mature
leaves to the shoot tip. In later growth stages, however, Ca, Zn, Mn and B concentrations
in shoot tips increased to become very close to those in blades. Highest concentrations of
16
Ca and Mn occurred in leaf blades at harvest, probably because with low mobility in plant
phloem; they became immobile once deposited in individual leaves and continuously
increased in concentration throughout the season.
Plant tissue sampling: Seasonal pattern of nutrient concentrations
Based on the same nutrient concentrations found between fruiting shoots and
vegetative shoots, as well as between trunk and cordon, sampling for seasonal patterns of
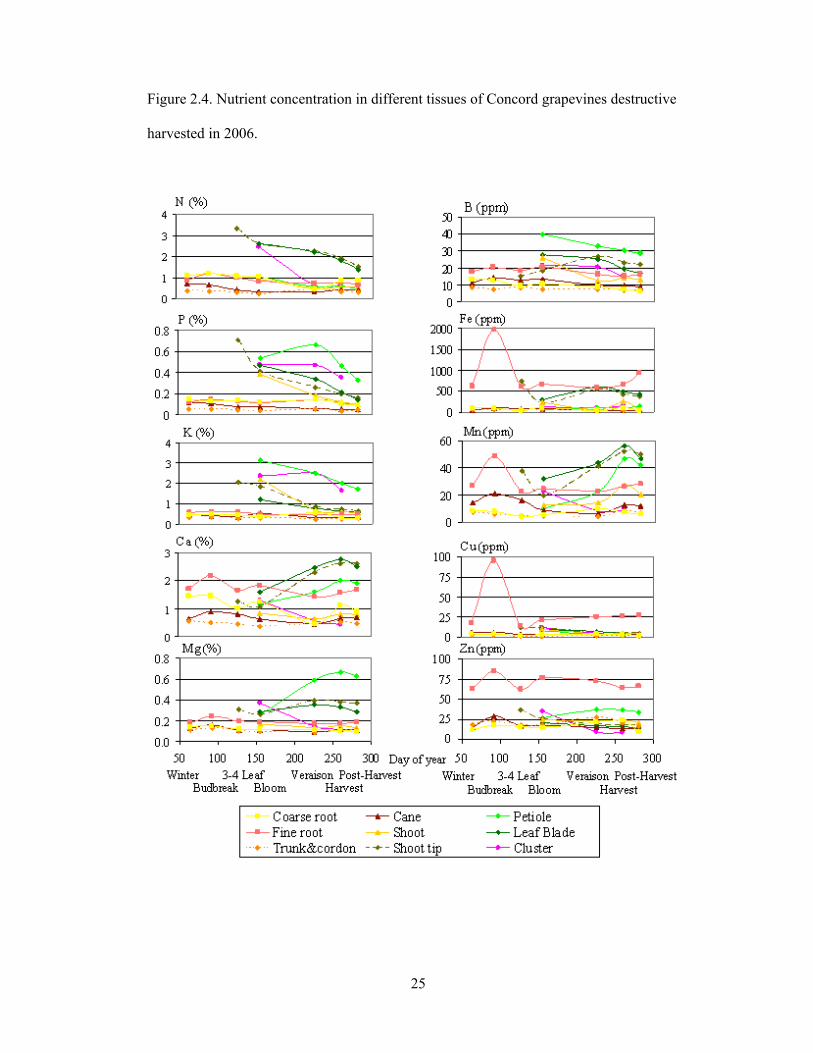
nutrient concentrations was reduced from 14 to 9 tissue types (Fig. 2.4) to give a clear and
concise seasonal pattern of nutrient concentration of Concord grape.
After the shoots showed 3-4 leaves, the large increase in all macronutrients in the
shoot tips correlated to a decrease in the woody tissues, coarse roots and canes (Fig. 2.4).
At bloom, N concentrations in leaf blades shoot tips, and clusters, and P concentrations of
these organs plus petioles were similar, whereas there was a wider range of K
concentration in these organs. In the following stages, N concentration in cluster
considerably decreased whereas concentrations of P and K in the clusters remained
consistently high through harvest. Ca and Mg showed highest concentrations at harvest in
leaf blades, shoot tips and petioles. The annual tissues, including leaf blades, shoot tips,
petioles and clusters, showed very high concentration of N, P, K and Mg in comparison to
woody tissues and coarse roots. Remarkably, these high concentrations in the actively
growing tissues are consistent with their known high mobility in the plant phloem
(Epstein and Bloom, 2005).
Seasonal pattern of micronutrient concentrations varied considerably as to which
organ and growth stage they attained the highest concentration. Fine roots at budbreak
appeared to have highest concentrations of Fe, Cu and Zn. Leaf blades, shoot tips and
17
petioles showed highest concentration of B at bloom, and showed highest concentration
of Mn at harvest.
CONCLUSION
Density of fine roots was higher when sample spacing was closer to the vine
trunk; therefore, a fine root sampling pattern at 20, 60, 120 cm from trunk was chosen for
the study in 2006 and 2007. Each soil core in subsequent collections were washed and
weighted individually to better illustrate root distribution patterns.
The same nutrient concentrations between fruiting shoots and vegetative shoots as
well as between trunk and cordon suggested the most efficient way to sample whole plant
tissues is to sample woody tissues, canes, coarse roots, fine roots, shoots, leaf blades,
petioles, shoot tips and clusters.
The results of nutrient analysis reflected the mobility of nutrients. Nitrogen, P, K
and Mg, known to be high mobility in the plant phloem (Epstein and Bloom, 2005),
where there were very high concentrations in annual organs including leaf blades, shoot
tips, petioles and clusters. Conversely, large fractions of low mobility nutrient elements in
the plant phloem, like Ca, B, Fe, Mn and Zn, were found in fine roots and permanent
structure including woody tissues and coarse roots.
18
LITERLATURE CITED
Bates, T., R. Dunst, T. Taft, and M. Vercant. 2002. The vegetative response of Concord
grapevines to soil pH. HortScience 37 (6): 890-893.
Bassoi, L.H., J.W. Hopmans, L.A. Castro Jorge, C.M. Alencar, and J.A.M.E. Silva. 2003.
Grapevine root distribution in drip and microsprinkler irrigation. Sci. Agri. 60: 377-
387.
Borchert, R. 1976. The concept of juvenility in woody plants. Acta Hortic. 56: 21–33.
Chang, S.-S. and W.M. Kliewer. 1991. Effect of nitrogen forms and rates, shading, and
presence and absence of Ca++ on the growth, tissue nitrogen compositions, and fruit
quality of grapevines. p. 228-238. In J.M. Rantz, (ed.) Proc. Int. Symp. on Nitrogen
in Grapes and Wine, Seattle, WA. 18-19 June 1991. Am. Soc. Enol. and Vitic.,
Davis, CA.
Cheng, L, G. Guohai, and T. Bates. 2004. Growth and fruiting of young Concord
grapevines in relation to reserve nitrogen and carbohydrates. J. Amer. Soc. Hort.
Sci. 129(5): 660-666.
Christensen, L.P. 1984. Nutrient level comparisons of leaf petioles and blades in. twenty-
six grape cultivars over three years. Amer. J. Enol. Vitic. 35: 124-133.
Colugnati, G., R. Camerlynck, L. Kiekens, and P. Bekaert. 1995. Contents patterns of Fe,
Mn and B in four grapevine cultivars. Acta Hortic. 383: 273-277.
Davenport, J. R., and R. G. Steven. 2006. High soil moisture and low soil temperature are
associated with chlorosis occurrence in Concord grape. HortScience 41: 418-422.
Doll, C.C. 1955. Studies of Concord grape roots in loess soil. Proc. Amer. Soc. Hort. Sci.
65:175-182.
Epstein, E. and A. J. Bloom. 2005. Mineral Nutrition of Plants: Principles and
Perspectives, 2nd ed. Sinauer, Sunderland, Massachusetts.
19
Marschner, H. 2002. Mineral nutrition of higher plants, 2nd ed. Academic Press, London,
UK.
Morano, L. 1995. An analysis of Vitis species and rootstock crosses: Vineyard root
distribution patterns, root growth and metabolic response to flooding in the
greenhouse and associated soil and plant communities of wild vines. Thesis,
Department of Viticulture and Enology, University of California, Davis.
Morris, J. R., D. L. Cawthon, and J. W. Fleming. 1980. Effects of high rates of potassium
fertilization on raw product quality and changes in pH and acidity during storage of
Concord grape juice. Am. J. Enol. Vitic. 31: 323-8.
Robinson, J.B. 2005. Critical plant tissue values and application of nutritional standards
for practical use in vineyards. p. 61-68. In P. Christensen and D.R. Smart (eds.) Proc.
Symp. on Soil Environment and Vine mineral Nutrition, Sandiago, CA. 29-30 June
2004. Am. Soc. Enol. And Vitic., Davis, CA.
Schreiner, R.P., C.F. Scagel, and J. Baham. 2006. Nutrient uptake and distribution in a
mature ‘Pinot Noir’ vineyard. HortScience 41(2): 336-345.
Shuman, L.M. 1991. Chemical forms of micronutrients in soils. In: J.J. Mortvedt., F.R.
Cox, L.M. Shuman, R.M. Welch (Eds) Micronutrients in Agriculture, 2nd edn, Soil
Sci. Soc. Am., Madison, WI.
Smith, B. R., and L. L. Cheng. 2006. Fe-EDDHA alleviates chlorosis in Concord
grapevines grown at high pH. HortScience 41: 1498-1501.
Soltanpour, P.N., G.W. Johnson, S.M. Workman, J.B. Jones, Jr., and R.O. Miller. 1996.
Inductively coupled plasma emission spectrometry and inductively coupled plasma–
mass spectrometry. p. 91–139. In D.L. Sparks et al. (eds.) Methods of soil analysis.
Part 3. SSSA Book Ser. 5. SSSA, Madison, WI.
20
USDA-National Agricultural Statistics Service (NASS). 2008. Non-citrus Fruits and Nuts
2007 Preliminary Summary [Online]. Available at
http://usda.mannlib.cornell.edu/usda/current/NoncFruiNu/NoncFruiNu-01-23-
2008.pdf (accessed 23 January 2008; verified 23 January 2008). USDA-NASS,
Washington, D.C.
Yeomans, J.C., and J.M. Bremner. 1991. Carbon and nitrogen analysis of soils by
automated combustion techniques. Comm. Soil Sci. Plant Anal. 22: 843-850.
21
Table 2.1. Density (g/L soil) of fine roots collected by soil core method at 2 distance
tracking at 6500C degree days in 2005.
Distance from trunk Total Plant Soil depth 20 cm 60 cm 120 cm
0-30 cm 0.78 1.48 1.23 0.88 1 30-75 cm 0.77 0.70 0.32
0-30 cm 1.34 1.35 0.70 2 30-75 cm 0.45 0.65 0.19
0.78
0-30 cm 1.22 0.41 0.72 0.52 3 30-75 cm 0.29 0.24 0.23
50 cm 100 cm 150 cm 0-30 cm 0.67 0.39 1.11 0.53 4
30-75 cm 0.59 0.25 0.19 0-30 cm 0.48 0.57 0.56 0.46 5
30-75 cm 0.39 0.18 0.60 6 0-30 cm 0.30 0.18 0.70 0.34 30-75 cm 0.61 0.06 0.17

22
Figure 2.1. Radial pattern of soil core sampling used in the study.

23
Figure 2.2. Concentration of nutrients in cordons, trunks, and coarse roots at different
growth stages in 2006.
24
Figure 2.3. Concentration of nutrients in shoots, leaf blades (LB), petioles, and shoot tips
(ST) separated from vegetative shoots and fruiting shoots at different growth stages in 2006.
25
Figure 2.4. Nutrient concentration in different tissues of Concord grapevines destructive
harvested in 2006.
26
CHAPTER THREE
DISTRIBUTION OF CONCORD ROOTS
INTRODUCTION
Compared to other crops, grapevines appear to have low root densities in soil
(Smart and Coombe, 1983) but extensive lateral and vertical spread of root systems
(Smart et al., 2005). It has been shown that both grape yield and quality are dependent on
the health status of the roots (Morlat and Jaquet, 1993) and fine roots are mostly involved
in water and nutrient uptake. The rate of nutrient uptake by the plant depends not only on
the mobility of the nutrients in the soil but also on a well distributed and functioning root
system, which is influenced by access to the plant nutrients required for growth.
Nutrients are transported in soil by either diffusion through the soil solution or
mass flow of the soil solution through soil pores. Diffusion is the main mechanism for
movement of P and K to the root surface (Marschner, 2002) while mass flow generally
satisfies N, S, Ca, Na, Mg and B requirement of plants growing in most soils (Tinker and
Nye, 2000). However, meeting plant demand for K, P, Cu, Fe, Mn, and Zn is challenging
due to their generally low concentrations in the soil solution (Cass, 2005). Concentrations
of K and P are much lower at root surface than in bulk soil, whereas concentrations of
Mn, Fe, Zn, and Cu in the soil solution mainly depend on the soil pH, redox potential, and
soil organic matter content, and may fluctuate throughout the season in temperate
climates (Sinclair et al., 1990).
In addition to mass flow and diffusion, a small portion of plant nutrient
requirements is met by root interception. The degree of contact between perennial plant
roots and soils varies with root types, age, and the surrounding environment. Root-soil
contact can be good if the root deformed the soils during its growth rather than using an
27
existing channel (Atkinson and Wilson, 1979), whereas root-soil contact can be reduced
by diurnal changes in root diameter due to water stress (Huck et al., 1970), and has been
shown to be poor after browning and decay of the root cortex, as the loss of cortex can
cause a 50% reduction in root diameter (Rogers, 1968).
Grapevine root size and density increases with the age of the plant, reaching a
consistent value after 5 to 10 years (Smart and Coombe, 1983). The majority of the
grapevine root system is usually within the top 1 m of the soil (Hellman, 2003), however,
individual roots can grow much deeper under favorable soil conditions. Different grape
varieties showed no clear differences in root distribution patterns; however, studies on
rooting patterns generally reported highest root densities within 1.5 m of grapevine trunk
(Saayman and Van Huyssteen, 1980; Mckenry, 1984; Nagarajah, 1987).
Grapevines have a complicated branching root system. Small permanent roots
arise from the main framework and grow either horizontally or vertically. Fine roots grow
rapidly and die within weeks after emergence but are continuously replaced (Richards,
1983). Two flushes of new root growth are believed to occur around bloom and after
harvest (Mullins et al., 1992). New root production begins very slowly after budbreak,
and significantly accelerates during the rapid shoot growth period. A second root growth
period has been shown after harvest in warm climate regions where the postharvest
growth period may be long (Van Zyl and Van Hayssteen, 1987).
Generally, root distribution studies include root biomass or root length as a
function of soil depth, distance from the plant stem, and position of neighboring plants
(Bassoi et al., 2003). Root distribution is mainly related to the local soil environment,
specifically temperature, bulk density, texture, water and nutrient availability. Many
management factors such as mechanical resistance, aeration, frequency and depth of
tillage, mulching and organic matter content may also affect root distribution patterns
28
(Kirchhof et al., 1991; Morlat and Jaquet, 1993; Richards, 1983). Types of irrigation
system have been shown to affect root distribution (Morano and Kliewer, 1994). Stevens
and Douglas (1994) reported that in the horizontal direction, roots of drip-irrigated plants
were concentrated under the vine row, and 50% of the root length was within 45 cm
distance from the plant row, in comparison with 35% of the root length in the same
distances when grapes were irrigated by microsprinkler. Araugo et al. (1995) reported that
furrow irrigated vines had a deep and widespread root system, suggesting that the water
alleyway in this system could have a directional effect on root distribution.
There are several methods to study grape root distribution, and the choice of
method depends on specific site conditions, the accuracy required, availability of data
about the expected root distribution, soil depth, and soil texture. For nondestructive
observation techniques, root distribution analysis by the monolith method requires cutting
a monolith of the soil, from which the roots are separated by washing. Bassoi et al. (2003)
used this method to study grapevine root distribution under drip and microsprinkler
irrigation. Eissenstat et al. (2001) and Comas et al. (2005) used the minirhizontron tube
installation and video imaging to study environmental effects on root production in
Concord grape. Nagarajah (1987) and Stevens and Douglas (1994) used the soil core
method to study rooting patterns of grapevine under different soil textures and different
irrigation systems, respectively. For destructive observation techniques, Schreiner (2003)
used the destructive harvest method to study mineral allocation in Pinot Noir vines, and
the profile method by Bohm (1979), Jackson (1996), and Padgett-Johnson (1999)
provided information of root-wall intercepts recorded from a wall of the trench excavated
parallel to the vine row.
In the present study, distribution of Concord grape roots was studied by using soil
core sampling and destructive harvest methods. The objectives of this study were (i) to
29
investigate seasonal distribution pattern of Concord grape fine roots, (ii) to determine
distribution of the fine roots as affected by soil depth, distance from the trunk, and
azimuth direction, and (iii) to provide a broad distribution pattern of Concord grape
coarse roots.
MATERIALS AND METHODS
The sampling site location was a 42 year-old own-rooted Concord vineyard (lat
460 15’ 59” N, long 1190 44’ 4” W) at the Irrigated Agriculture Research and Extension
Center (IAREC) in Prosser, WA. The vineyard was on a Warden fine sandy loam (coarse-
silty, mixed, superactive, mesic Xeric Haplocambid). The site is furrow irrigated and has
been managed with uniform fertilization, water and pest management practices.
In 2006 and 2007 at winter pruning, bud break, 3-4 leaves, bloom, veraison,
harvest, and post-harvest, soil cores were collected at 20, 60, and 120 cm distance from
the trunk in a radial pattern (Fig. 3.1), and were separated into surface (0-30 cm) and
subsurface (30-75 cm) soil depths. Each core was washed individually to remove fine
roots (< 4 mm diam.). Four vines with uniform size were sampled at each growth stage
and then destructively harvested at the comparable dimensions (2.4 x 2.7 x 1 m) of the
soil volume. Coarse roots and fine roots were separated from the excavated vines after
length measurement of coarse roots (Fig. 3.2).
The root mass data from soil core sampling was extrapolated across the area of
collection by using Inverse Distance Weighting (IDW) method in ArcGIS 9 (ESRI,
Redland, CA) with power = 2 and number of neighbor samples = 24. Density (grams of
dry roots per liter of soil) of fine roots separated from the soil core sampling method was
analyzed in relation to growth stage, soil depth, distance from the trunk, and direction
around the trunk. Distribution of fine roots from soil cores and destructive harvests were
30
then determined by quantifying root density, whereas those of coarse roots were
determined by root density and length density (meter length per cubic meter of soil), all of
which were compared based on plant basis and growth stages. The SPSS 15.0 (SPSS,
Chicago, IL) was used to perform all the statistical analysis.
RESULTS AND DISCUSSION
Distribution of fine roots sampled by soil cores
Fine root distribution of Concord grape was strongly influenced by growth stage.
In the 2006 growing season, fine root density at the plant growth stages winter, budbreak,
and 3-4 leaves were not significantly different. The fine root density was lowest at bloom
and almost doubled by veraison, then declined again at later growth stages (Table 3.1). In
2007, fine root density was not significantly different at winter and budbreak, then
declined at 3-4 leaves and bloom. The density increased at veraison and remained close to
that level until the end of growing season (Table 3.2).
The data in 2006 and 2007 showed the general occurrence that root densities at
surface soil (0-30 cm) were significantly higher than subsurface soil (30-75 cm) root
density at every growth stage. The average root densities of surface soil were
approximately two times of those of the subsurface soil. This is probably because the fine
sandy loam texture of the furrow irrigated vineyard soil has a rather high water holding
capacity and a relatively slow water infiltration rate, encouraging root growth to be more
dense and widely distributed in the surface rather than subsurface soil. This is consistent
with other findings in grape. Eissenstat et al. (2001) found that most of the roots of
Concord grapevines grown in gravelly loam were confined in the top 40 cm soil depth.
Nagarajah (1987) studied rooting patterns of own rooted Thompson seedless (Vitis
vinifera L.) and Thompson seedless on Ramsay (V. champinii; hybrid of V. candicans x
31
V. rupestris) rootstocks in coarse soil and found that roots were concentrated in the
surface layers and sharply reduced in growth in the deeper layers of the moderately coarse
and fine soils. Padgett-Johnson (1999) reported over 95% of Ramsay roots in the upper
60 cm of soil in a 1 m square area within the berm of the vine row and trenched
perpendicular to the vine row. Smart et al. (2005) took a thorough look at over 200 root
studies and found that on average, 63% of roots were found in the top 60 cm of soil.
Non-significant differences in root density with direction around the trunk found
at surface soil implies that fine root density within 120 cm of the trunk had the highest
density in the surface soil. The subsurface soil depth had very low fine root densities,
which made it difficult to notice significant effects of distance and direction around the
trunk. However, it could be implied from the lowest values of root densities found at 120
cm from trunk in the subsurface soil that the further away from the trunk, the lower the
concentration of fine roots.
Seasonal maps of fine root distribution in 2006 (Fig. 3.3) and 2007 (Fig. 3.4)
showed that grapevine roots were not uniformly distributed throughout plant growth stage
and the soil profile, which was consistent with the results from statistical analysis of field
data. Since the root distribution appeared to have large changes in the surface soil within
a short distance, the edge effects of the root maps derived from the interpolation method
suggest that grapevine roots have low densities in soil across an extensive lateral and
vertical spread.
Distribution of fine roots sampled by destructive harvest
In 2006, two peaks of root density were found in 3-4 leaves and veraison periods,
whereas in 2007 there were only small changes in root density during the growing season
(Fig. 3.5a and 3.5b). Apart from the very small amount of young white fine roots found
32
during the growing season between 3-4 leaves and veraison, there was no other clear
evidence to confirm that a fall flush of root is common. The similarity between patterns of
fine root distribution in 2006 and 2007 was that the root density decreased after harvest,
which implies that roots typically do not grow during the dormant season. The fine roots
collected by soil cores showed a 10 x greater density than the root density found with the
destructive harvest method (Fig. 3.4), which suggests that the amounts of fine roots
collected by soil core method were sufficient to represent the whole plant fine roots for
further nutrient analysis even in the growth stage that the grapevine had lowest
production of fine roots.
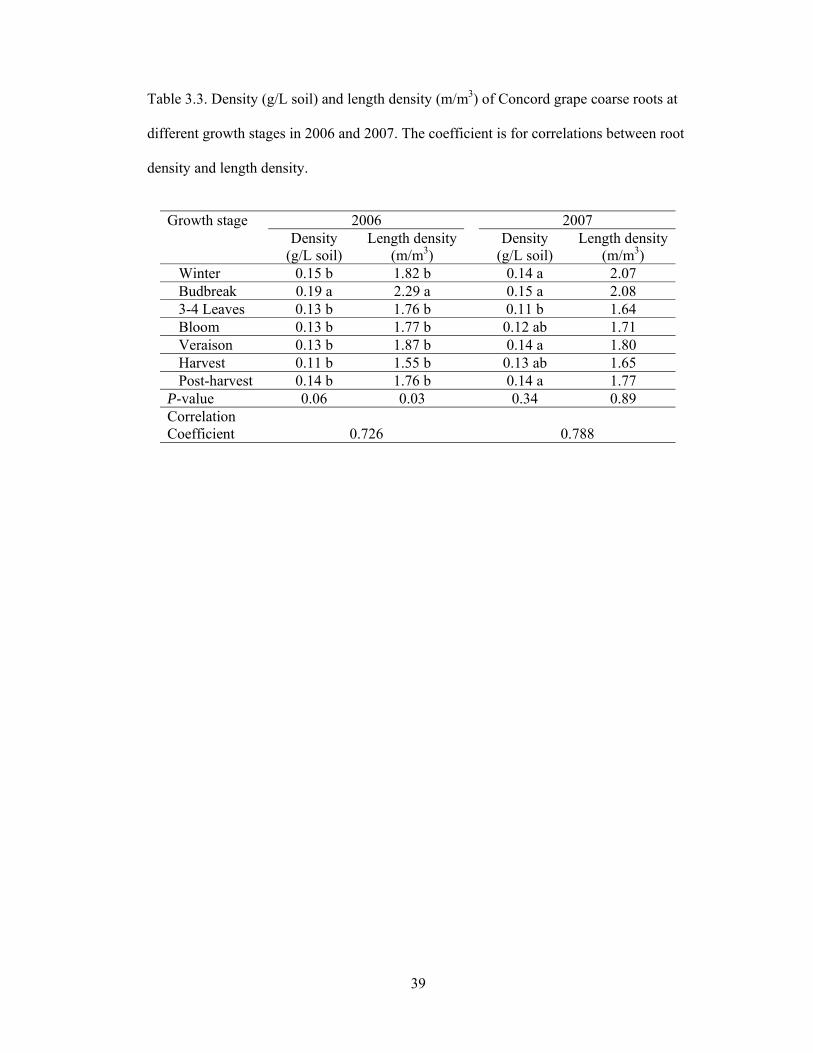
Distribution of coarse roots
In this study, root density and root length density were determined from root
biomass and root length (Fig. 3.2) within a certain soil volume unit to characterize the
presence of coarse roots as a function of soil depth and distance from the trunk. Concord
coarse roots appeared to have density between 0.11-0.19 g/L soil and length density range
between 1.5 and 2.3 m/m3 (Table 3.3). In this regard, the root density seems to correspond
well with the root length density based on medium-high positive correlation, especially in
2006 when both density and length density at budbreak were higher than other growth
stages. During the growing season in 2007, root length density did not significantly differ
by growth stage whereas the density of coarse roots did. Root length density and root
density were correlated in both years (Fig. 3.6a and Fig. 3.6b), with R2 0.53 and 0.62 for
2006 and 2007, respectively, suggesting an intermediate relationship between root length
density and root density. More root parameters, for instance root diameter, might be
required for investigation to understand dynamics of the coarse root system.
33
Concord root distribution in relationship to irrigation furrow
The result of the fine root distribution analysis showed root response to long-term
furrow irrigation with non-uniform distribution patterns that could extensively spread
beyond the distance between plants (2.4 m) and rows (2.7 m) as well as toward 1 m soil
depth. The widespread root system that develops under furrow irrigation may less depend
on fertilizer management than a root system that is area confined due to irrigation
(Atkinson, 1980) and the furrow irrigated vineyards may lead to inefficient control of
plant growth with fertilizer and water use. Concord grape has high water demand
compared to wine grapes (Reynolds et al., 2005). Hence, to ensure yield and quality of
Concord grape growing in arid area like central Washington with furrow irrigation, it is
important to supply adequate irrigation water to the root system.
CONCLUSION
Fine root distribution of Concord grape was strongly influenced by growth stage
and soil depth but was not affected by distance from or direction around the trunk. Root
densities at surface soil were higher than subsurface soil at every growth stage and
surface soil within 120 cm of the trunk represented the area that had the highest root
distribution. This suggested a basic pattern of fine roots where most of these roots were
concentrated in the top 30 cm of soil and the root density was sharply reduced with depth
and distance from the vine trunk. Understanding the fine root distribution in the
subsurface soil is needed to show area of root contacts which can relate to the different
mobilities of soil nutrients. Distribution of Concord fine roots and coarse roots varied
slightly from one year to the next. Reasonable correlation between root length density and
root density of coarse roots was found to support the fine root distribution pattern.
34
LITERATURE CITED
Araujo, F., L.E. Williams, D.W. Grimes, and M.A. Matthews. 1995. A comparative study
of young Thompson seedless grapevines (Vitis vinifera L.) under drip and furrow
irrigation I: Root and soil water distributions. Sci. Hortic. 60: 235-249.
Atkinson, D. 1980. The distribution and effectiveness of the roots of tree crops. Hortic
Rev. 2: 424-490.
Atkinson, D., and S. Wilson. 1979. The root-soil interface and its significance for fruit
tree roots of different ages. p 259-271. In J. L. Harley and R. S. Russell (eds.) The
Soil-Root Interface, Academic Press, London.
Bassoi, L.H., J.W. Hopmans, L.A. Castro Jorge, C.M. Alencar, and J.A.M.E. Silva. 2003.
Grapevine root distribution in drip and microsprinkler irrigation. Sci. Agri. 60: 377-
387.
Bohm, W. 1979. Methods of Studying Root Systems. Springer Verlag, Berlin.
Cass , A. 2005. Effects of soil physical characteristics on mineral nutrient availability,
movement, and uptake. p 3-11. In L.P. Christensen and D.R. Smart (eds.) Proc.
Symp. on Soil Environment and Vine Mineral Nutrition, San Diego, CA. 29-30
June 2004. Am. Soc. Enol. and Vitic., Davis, CA.
Comas, L.H., L.J. Anderson, R.M. Dunst, A.N. Lakso, and D.M. Eissenstat. 2005.
Canopy and environmental control of root dynamics in a long-term study of
Concord grape. New Phytol. 167: 829-840.
Eissenstat, D.M., L.H. Comas, and L.J. Anderson. 2001. Root biology in grapes: A case
study of the effects of canopy pruning and irrigation on Concord root dynamics.
Pennsylvania Fruit News 81: 74-76.
Hellman, E.W. Grapevine structure and function. p. 5-19. In E.W. Hellman (ed.). 2003.
Oregon Viticulture. Oregon State University Press. Corvallis, OR.
35
Huck, M.G., B. Klepper, and H.M. Taylor. 1970. Diurnal variations in root diameter.
Plant Physiol. 15: 529-530.
Jackson, R.B., J. Canadell, J.R. Ehleringer, H.A. Mooney, O.E. Sala, and E.-D. Schulze.
1996. A global analysis of root distributions for terrestrial biomes. Oceologia 108:
389-411.
Kirchhof, G., J. Blackwell, and R.E. Smart. 1991. Growth of vineyard roots into
segmentally ameliorated acidic subsoils. Plant and Soil. 134: 121-126.
Marschner, H. 2002. Mineral nutrition of higher plants. 2nd ed. Academic Press, NY.
McKenry, M.V. 1984. Grape root phenology relative to control of parasitic nematodes.
Am. J. Enol. Vitic. 35: 206-211.
Morano, L., and W.M. Kliewer. 1994. Root distribution of three grapevine rootstocks
grafted to Cabernet Sauvignon grown on a very gravelly clay loam soil in Oakville,
California. Am. J. Enol. Vitic. 45: 345-348.
Morlat, R., and A. Jacquet. 1993. The soil effects on the grapevine root system in several
vineyards of the Loire valley (France). Vitis 32(1): 35-42.
Mullins, M.G., A. Bouquet, and L.E. Williams. 1992. Biology of the grapevine.
Cambridge Univ. Press, Cambridge, UK.
Nagarajah, S. 1987. Effects of soil texture on the rooting patterns of irrigated vineyards.
Am. J. Enol. Vitic. 38: 54-60.
Padgett-Johnson, M. 1999. Vine water relations, growth and root distribution of several
Vitis species under irrigated and non-irrigated conditions. Thesis, Plant Biology,
University of California, Davis.
Reynolds A.G., W.D. Lowrey, and C. de Savigny. 2005. Influence of irrigation and
fertigation on fruit composition, vine performance, and water relations of Concord
and Niagara grapevines. Am. J. Enol. Vitic. 56(2): 110-128.
36
Richards, D. 1983. The grape root system. Hort. Reviews 5: 127-168.
Rogers, W.S. 1968. Amount of cortical and epidermal tissue shed from roots of apple. J.
Hort. Sci 43: 527-528
Saayman, D., and L. Van Huyssteen. 1980. Soil preparation studies: I. The effect of depth
and method of soil preparation and of organic material on the performance of Vitis
vinifera (var. Chenin blanc) on a Hutton/Sterspruit soil. S. Afr. J. Enol. Vitic. 1:
107–121.
Schreiner, R.P. 2003. Mycorrhizal colonization of grapevine rootstocks under field
conditions. Am. J. Enol. Vitic. 54: 143-149
Sinclair, A.H., L.A, Mackie-Dawson, and D.L. Linehan, 1990. Micronutrients inflow
rates and mobilization into soil solution in the root zone of winter wheat (Triticum
aestivum L.). Plant Soil 122: 13-146.
Smart, D.R., E. Schwass, A.N. Lakso, and L. Morano. 2005. Grapevine rooting patterns:
A comprehensive analysis and review. p 153–174. In L.P. Christensen and D.R.
Smart (eds.) Proc. Symp. on Soil Environment and Vine Mineral Nutrition, San
Diego, CA. 29-30 June 2004. Am. Soc. Enol. and Vitic., Davis, CA.
Smart. R.E., and B.G. Coombe. 1983. Water relation of grapevines. In: Water Deficit and
Plant Growth, Vol. III. T.T. Kozlowski (Ed.). pp 137-196. Academic Press, NY.
Stevens, R.M., and T. Douglas. 1994. Distribution of grapevine roots and salt under drip
and full-ground cover microjet irrigation systems. Irrig. Sci. 15: 147-152.
Tinker, P. B., and P. H. Nye. 2000. Solute movement in the rhizosphere. Oxford
University Press. Oxford, NY.
Van Zyl, J.L., and L. Van Huyssteen. 1987. Root pruning. Deciduous Fruitgrower. 39:
20-25.
37
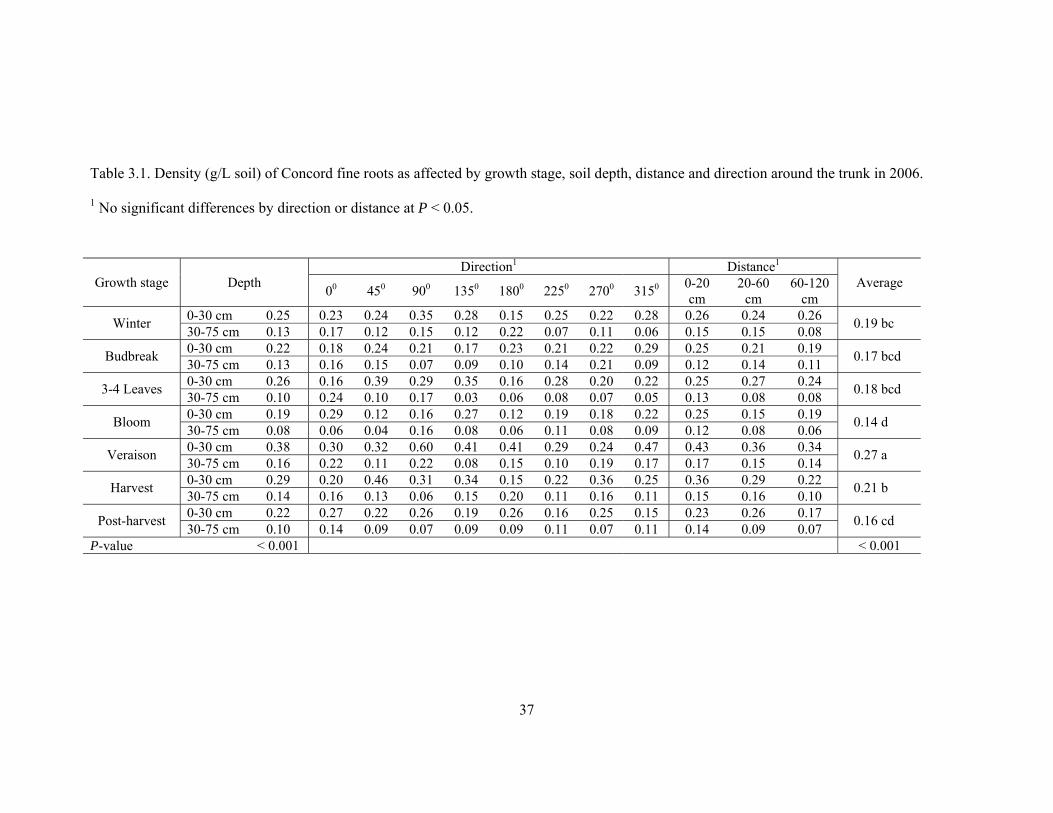
Table 3.1. Density (g/L soil) of Concord fine roots as affected by growth stage, soil depth, distance and direction around the trunk in 2006.
1 No significant differences by direction or distance at P < 0.05.
Direction1 Distance1 Growth stage Depth 00 450 900 1350 1800 2250 2700 3150 0-20
cm 20-60
cm 60-120
cm Average
0-30 cm 0.25 0.23 0.24 0.35 0.28 0.15 0.25 0.22 0.28 0.26 0.24 0.26 Winter 30-75 cm 0.13 0.17 0.12 0.15 0.12 0.22 0.07 0.11 0.06 0.15 0.15 0.08 0.19 bc
0-30 cm 0.22 0.18 0.24 0.21 0.17 0.23 0.21 0.22 0.29 0.25 0.21 0.19 Budbreak 30-75 cm 0.13 0.16 0.15 0.07 0.09 0.10 0.14 0.21 0.09 0.12 0.14 0.11 0.17 bcd
0-30 cm 0.26 0.16 0.39 0.29 0.35 0.16 0.28 0.20 0.22 0.25 0.27 0.24 3-4 Leaves 30-75 cm 0.10 0.24 0.10 0.17 0.03 0.06 0.08 0.07 0.05 0.13 0.08 0.08 0.18 bcd
0-30 cm 0.19 0.29 0.12 0.16 0.27 0.12 0.19 0.18 0.22 0.25 0.15 0.19 Bloom 30-75 cm 0.08 0.06 0.04 0.16 0.08 0.06 0.11 0.08 0.09 0.12 0.08 0.06 0.14 d
0-30 cm 0.38 0.30 0.32 0.60 0.41 0.41 0.29 0.24 0.47 0.43 0.36 0.34 Veraison 30-75 cm 0.16 0.22 0.11 0.22 0.08 0.15 0.10 0.19 0.17 0.17 0.15 0.14 0.27 a
0-30 cm 0.29 0.20 0.46 0.31 0.34 0.15 0.22 0.36 0.25 0.36 0.29 0.22 Harvest 30-75 cm 0.14 0.16 0.13 0.06 0.15 0.20 0.11 0.16 0.11 0.15 0.16 0.10 0.21 b
0-30 cm 0.22 0.27 0.22 0.26 0.19 0.26 0.16 0.25 0.15 0.23 0.26 0.17 Post-harvest 30-75 cm 0.10 0.14 0.09 0.07 0.09 0.09 0.11 0.07 0.11 0.14 0.09 0.07 0.16 cd
P-value < 0.001 < 0.001
38
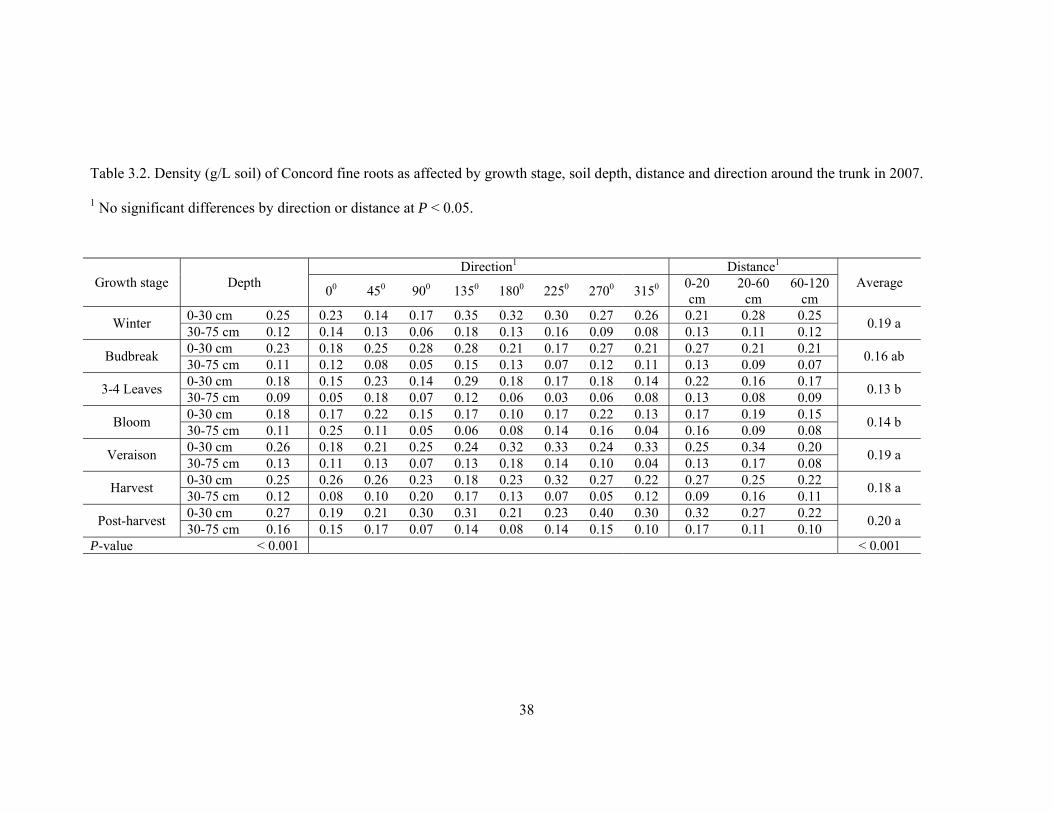
Table 3.2. Density (g/L soil) of Concord fine roots as affected by growth stage, soil depth, distance and direction around the trunk in 2007.
1 No significant differences by direction or distance at P < 0.05.
Direction1 Distance1
Growth stage Depth 00 450 900 1350 1800 2250 2700 3150 0-20 cm
20-60 cm
60-120 cm
Average
0-30 cm 0.25 0.23 0.14 0.17 0.35 0.32 0.30 0.27 0.26 0.21 0.28 0.25 Winter 30-75 cm 0.12 0.14 0.13 0.06 0.18 0.13 0.16 0.09 0.08 0.13 0.11 0.12 0.19 a
0-30 cm 0.23 0.18 0.25 0.28 0.28 0.21 0.17 0.27 0.21 0.27 0.21 0.21 Budbreak 30-75 cm 0.11 0.12 0.08 0.05 0.15 0.13 0.07 0.12 0.11 0.13 0.09 0.07 0.16 ab
0-30 cm 0.18 0.15 0.23 0.14 0.29 0.18 0.17 0.18 0.14 0.22 0.16 0.17 3-4 Leaves 30-75 cm 0.09 0.05 0.18 0.07 0.12 0.06 0.03 0.06 0.08 0.13 0.08 0.09 0.13 b
0-30 cm 0.18 0.17 0.22 0.15 0.17 0.10 0.17 0.22 0.13 0.17 0.19 0.15 Bloom 30-75 cm 0.11 0.25 0.11 0.05 0.06 0.08 0.14 0.16 0.04 0.16 0.09 0.08 0.14 b
0-30 cm 0.26 0.18 0.21 0.25 0.24 0.32 0.33 0.24 0.33 0.25 0.34 0.20 Veraison 30-75 cm 0.13 0.11 0.13 0.07 0.13 0.18 0.14 0.10 0.04 0.13 0.17 0.08 0.19 a
0-30 cm 0.25 0.26 0.26 0.23 0.18 0.23 0.32 0.27 0.22 0.27 0.25 0.22 Harvest 30-75 cm 0.12 0.08 0.10 0.20 0.17 0.13 0.07 0.05 0.12 0.09 0.16 0.11 0.18 a
0-30 cm 0.27 0.19 0.21 0.30 0.31 0.21 0.23 0.40 0.30 0.32 0.27 0.22 Post-harvest 30-75 cm 0.16 0.15 0.17 0.07 0.14 0.08 0.14 0.15 0.10 0.17 0.11 0.10 0.20 a
P-value < 0.001 < 0.001
39
Table 3.3. Density (g/L soil) and length density (m/m3) of Concord grape coarse roots at
different growth stages in 2006 and 2007. The coefficient is for correlations between root
density and length density.
2006 2007 Growth stage
Density (g/L soil)
Length density (m/m3)
Density (g/L soil)
Length density (m/m3)
Winter 0.15 b 1.82 b 0.14 a 2.07 Budbreak 0.19 a 2.29 a 0.15 a 2.08 3-4 Leaves 0.13 b 1.76 b 0.11 b 1.64 Bloom 0.13 b 1.77 b 0.12 ab 1.71 Veraison 0.13 b 1.87 b 0.14 a 1.80 Harvest 0.11 b 1.55 b 0.13 ab 1.65 Post-harvest 0.14 b 1.76 b 0.14 a 1.77 P-value 0.06 0.03 0.34 0.89 Correlation Coefficient 0.726 0.788
40
Figure 3.1. Radial pattern of soil core sampling used in the study.
41
Figure 3.2. Concord horizontal root distribution in different growth stages: a) budbreak in
2006 and b) post-harvest in 2007. Each grid equal to 0.04 square meters.
a)
b)
42
Figure 3.3. Distribution of Concord grape fine roots in surface and subsurface soil depth collected
at key growth stages in 2006. Analysis performed by using Inverse Distance Weighting (IDW)
technique.
43
Figure 3.4. Distribution of Concord grape fine roots in surface and subsurface soil depth collected
at key growth stages in 2007. Analysis performed by using Inverse Distance Weighting (IDW)
technique.
44
Figure 3.5. Density (g/L soil) of Concord grape fine roots collected by a) soil core and b)
destructive harvest methods at different key growth stages in 2006 and 2007.
45
Figure 3.6. Relationship between length density (m/m3) and density (g/L soil) of Concord
grape coarse roots in a) 2006 and b) 2007. P = 0.05
a)
Linear Regression
0.10 0.15 0.20Root_density2006
1.50
1.75
2.00
2.25
2.50
Roo
t_le
ngth
_den
sity
2006
Root_length_density2006 = 0.89 + 6.73 * Root_density2006R-Square = 0.53
b)
Linear Regression
0.12 0.14 0.16 0.18Root_density2007
1.50
1.75
2.00
2.25
2.50
Roo
t_le
ngth
_den
sity
2007
Root_length_density2007 = 0.20 + 12.08 * Root_density2007R-Square = 0.62
46
CHAPTER FOUR
MINERAL NUTRIENT PARTITIONING AND UPTAKE IN CONCORD GRAPE
INTRODUCTION
Concord grape (Vitis labruscana Bailey) is a cold climate juice grape bred in the
New England region in predominantly acid soils derived from granite rocks. Current
Concord production has been shifted to Washington State, where the predominantly
calcareous or high pH soils could limit the availability of micronutrients, including Fe,
Mn, Cu and Zn, since they tend to precipitate in soil solution in a carbonate-dominated
environment (Epstein and Bloom, 2005). The goal of the Concord production is to
produce the largest crop of mature fruit while maintaining vine performance. Balance of
nutrients should be a high priority for vineyard management to accomplish this goal
because there is a direct impact on how well the plants grow and juice quality.
Most studies report that grapevines take up the most N between bloom and
veraison (Araujo and Williams, 1988; Lohnertz, 1991; Williams and Biscay, 1991;
Mullins et al., 1992; Hanson and Howell, 1995; Bates et al., 2002). However, Conradie
(1980, 1981, 1986) reported substantial N uptake after harvest in potted Chenin Blanc
grown in the South Africa. He reported that N uptake during the postharvest period
comprised 27% and 37% of the total annual N uptake (Conradie, 1980, 1986) and
provided 60% of the stored N for the next season (Conradie, 1992).
Potassium uptake in whole vines was examined in several studies (Conradie, 1981;
Williams and Biscay, 1991; Schreiner et al., 2006). These studies showed that the bulk of
K uptake occurred between bloom and veraison. Of the three studies, only Conradie
(1981) in South Africa and Schreiner et al. (2006) in Oregon examined P, Ca and Mg
uptake in their whole vine studies. Their results agreed that the time of maximum Ca and
47
Mg uptake was between bloom and veraison. Schreiner et al. (2006) also reported that
uptake for most macro elements were very closely related to canopy demand, whereas
concentrations of micronutrients Fe, Mn, B, Zn, and Cu in whole vine varied highly from
vine to vine.
Different nutrients have different mobilities in phloem and considerable
variability in nutrient mobility exists among genotypes, nutritional status of plants and
environmental influences (Welch, 1986; Marschner, 2002). N, P, K, Mg, S, Cl, Na can be
classified as having high phloem mobility whereas Ca and B are known to be immobile in
plant phloem. Heavy metals like Fe, Mn, Zn and Cu are immobile in phloem due to
precipitation as oxides or hydroxides, or as carbonates when phloem sap is slightly
alkaline (Epstein and Bloom, 2005). Phloem transport is important in nutrient cycling
since uptake of phloem-mobile nutrients is driven by the nutrient requirement of plant
organs. Nutrients with low mobility in the phloem can be transported through the xylem,
where solute flow is driven by root pressure and water potential gradient.
Petiole analysis at bloom time is a useful tool that commercial grape growers use
to determine nutrient status of a vine during the growing season for fertilizer
management; however, wide year-to-year fluctuation has been reported for some
nutrients, such as NO3- and K (Christensen, 1984). Petiole nutrient results may not always
reflect the nutrient status in other parts of the vine. Davenport et al. (2003) studied
Concord grape response to variable rate fertilizer application by using soil and tissue
samples to evaluate crop nutrient status. The research found that leaf blade nutrient
concentration was more closely related to yield than petiole.
Grapevines have the capacity to store and re-allocate potentially large quantities
of carbon and mineral nutrient reserves (Roubelakis-Angelakis and Kliewer, 1992), and
there is a strong relationship between canopy demand and nutrient uptake (Schreiner et
48
al., 2006). Size and seasonal duration of vegetative, reproductive and storage sinks might
vary with vine age (Borchert, 1976), but most of the studies on the partitioning of nutrient
have been conducted in highly fertilized young vines (Conradie, 1980, 1986, 1991; Bates
et al., 2002), making it is impractical to predict nutrient requirements by mature vines.
More quantitative information in mature grapevines is needed to produce a balance
between vegetative and reproductive growth to ensure nutrient requirements are met for
optimal production. This study investigates the uptake and redistribution of mineral
nutrients in whole Concord grapes grown in a calcareous soil in Washington to
understand nutrient movement between various plant tissues and plant nutrient uptake on
growth and fruiting of grapevines. The objectives of this research were to (i) investigate
seasonal patterns of macronutrients and micronutrient uptake and redistribution in
Concord grapes, and (ii) identify the choice of tissue type (petiole or leaf blade) and the
best time to sample grapevines for routine nutritional evaluation.
MATERIALS AND METHODS
The study was conducted in a 42 year-old own-rooted Concord single-curtain
vineyard (lat 460 15’ 59” N, long 1190 44’ 4” W) at the Irrigated Agriculture Research and
Extension Center (IAREC) in Prosser, WA. The site is furrow irrigated and has been
managed with uniform fertilization, water and pest management practices. The vineyard
soil is Warden fine sandy loam (coarse-silty, mixed, superactive, mesic Xeric
Haplocambid).
In 2006 and 2007 at winter pruning, bud break, 3-4 leaves, bloom, veraison,
harvest, and post-harvest, four vines of uniform size were sampled at each growth stage
and then destructively harvested at the comparable dimensions (2.4 x 2.7 x 1 m) of the
49
soil volume. Each vine was separated into trunk and cordon, coarse roots, fine roots,
canes, shoot, leaf blades, petioles, shoot tips, and clusters.
Plant organs and tissues were dried, weighed, ground and analyzed for nutrient
elements. Total N and C were analyzed using dry combustion (Yeomans and Bremner,
1991) with a LECO CNS 2000 (St. Joseph, MI). Analysis for P, K, Ca, Mg, Na, Cu, Fe,
Mn, Zn and B was done by a commercial lab (Brookside Laboratories, Inc, OH) using
ICP (Soltanpour et al., 1996). The samples were digested with nitric acid and hydrogen
peroxide in a CEM microwave and analyzed on a Thermo Jarrell Ash 1100 ICP (Franklin,
MA). Surface and subsurface soil samples were collected at each harvest point and
analyzed to determine the availabilities of each element listed above using standard soil
tests for Washington. Modeling nutrient movement throughout various plant tissue
compartments and whole plant nutrient uptake were accomplished by calculating the
content of each mineral element within each tissue (dry mass x concentration) at each
destructive harvest.
RESULTS AND DISCUSSION
Dry matter and carbon
Dry weights of the whole vines ranged from 4,229 to 9,068 grams (Fig. 4.1). The
highest biomass of the whole plants occurred at harvest, which was approximately double
of that in winter, budbreak, 3-4 leaves, and bloom. Carbon concentration appeared to be
significantly different among petioles (41-42% of dry weight), clusters (44-46%), and the
other plant organs (46-48%; Fig. 4.2). This reflects the fact that the bulk of dry weight is
cell wall, which consists mainly of cellulose, a carbohydrate polymer. Due to small
variation of carbon concentrations in plant organs compared to other nutrients, seasonal
pattern of carbon content (Fig. 4.2) was nearly analogous to the seasonal pattern of plant
50
dry weight. There was a significant decrease in total plant dry weight from budbreak
(5,353 grams) to the 3-4 leaf stage (4,229 grams). The loss occurred mostly in trunk,
cordons and coarse roots. This is probably because reserve C in the woody tissues was
utilized to support the new growth of grapevines when the photosynthesis is still limited.
Nutrient uptake and partitioning
N, P and K
The total contents of N, P and K remained constant at the beginning of the season
and a large drop in these nutrient contents in woody tissues occurred when the vines
developed 3-4 leaves, suggesting that the new growth of grapevines depends on reserve
nutrients in permanent structure (Fig. 4.2). Nitrogen concentrations in shoot tips
decreased steadily after 3-4 leaves until the end of the season, whereas P and K contents
showed a strong decrease at bloom and continued the decrease in later growth stages at a
much slower rate. Such a dilution effect of N, P and K concentration in shoot tips might
result from rapid leaf expansion and translocation of nutrients from shoot tips to leaf
blades and clusters.
The whole vine N content gradually increased from 3-4 leaves to veraison before
rapidly increased from veraison to harvest, while P and K contents showed a rapid
increase from 3-4 leaves to harvest. At veraison, clusters contained about 40% of their
total N demand and about 65% of their total P and K demand (Fig. 4.2). Nitrogen
concentration in clusters rapidly decreased after bloom while P concentration slightly
decreases and K concentration remained unchanged until the end of the season. After
reaching the maximum in leaf blades at bloom, N concentration declined more slowly
than P and K. The slow decrease in N concentration in shoot tips and leaf blades
51
compared with P and K concentration reveals that clusters were a strong sink for P and K
whereas leaves and clusters are both important N sinks.
Potassium supply seems to have a dominant influence on fruit production whereas
N supply dominated leaf development. Total N content per vine was significantly higher
than K at every growth stage, except at harvest where total content of N and K were
nearly equal at 55.1 g/vine and 64.6 g/vine, respectively (Table 4.1). This resulted from a
high concentration of K (1.42 %) in the clusters, which was approximately two and a half
times that of N (0.60 %; Fig 4.2).
Remobilization of N, P and K back to the woody tissues was observed after
veraison. After reaching the lowest content in the trunk, cordon and coarse roots at
veraison, woody tissue N, P and K content increased again until the end of season (Fig
4.2). In addition, there was a large drop in N, P and K concentrations in leaf blades and
petioles post-harvest, indicating their remobilization back into the woody tissues.
Nitrogen, P and K content in trunk, cordons and coarse roots post-harvest were lower than
at the beginning of season. This suggests that movement of nutrient from annual tissues
back to woody tissues continued after the post-harvest sample collection until the
grapevines entered dormancy. The finding is consistent with Lohnertz (1991), who found
that accumulation of N in permanent structures occurred from veraison to harvest,
Alexander (1958), who found translocation of N back from leaves to woody tissues, and
Schreiner et al. (2006), who found N losses between harvest and leaf fall. The result,
however, contradicts Conradie (1980, 1981, 1986), who found substantial uptake of N, P
and K at postharvest in young vines in South Africa.
Throughout the growing season, average total uptake per plant of N, P and K were
26.9 g, 6.3 g, and 41.8 g, respectively (Table 4.2). These 42 years old Concord grape took
up twice as much N than 3 years old Concord grapes studies by Bates et al. (2002), who
52
reported 13 g N uptake during the growing season. The mature Concord grapevines
appeared to have considerably higher N, P and K uptake when compared with 8 g N, 1.5
g P, and 19 g K uptake from budbreak through leaf fall in 23 years old Pinot Noir vines
(Schreiner et al., 2006) and 18 g N and 25 g K uptake in 20 years old Cabernet Sauvignon
vines during the same time frame (Williams and Biscay, 1991). Hence, the differences in
vine age, size, and species (vinifera vs labruscana) seem to have major impacts on
nutrient uptake since these 42 years old Concord grapevines were about 3 times larger
than the juvenile Concords reported by Bates et al. (2002) and at least 2 times larger in
vine size and 3 times larger in crop level compared with the 20 year old Cabernet
Sauvignon (Williams and Biscay, 1991).
Differences in timing of nutrient uptake between studies were observed.
Approximately 95% of the N uptake in mature Concord grape occurred between bloom
and harvest (Table 4.2), which differs from the other reported findings. Conradie (2005)
found remarkably consistent N uptake (10-35%) by 2 years old Chenin Blanc vines
occurred in each growth stage throughout the growing season. Schreiner et al. (2006)
found 87% N uptake by 23 years old Pinot Noir occurred between budbreak to veraison,
Williams and Biscay (1991) found 86% N uptake by 18 years old Cabernet Sauvignon
occurred between bloom and veraison, and Hanson and Howell (1995) found 60% N
uptake by 10 years old Concord grapevines occurred between bloom and veraison. On the
other hand, the highest uptake of P and K occurred between bloom and veraison, which
agrees with previous studies (Conradie, 1981; Williams and Biscay, 1991; Schreiner et
al., 2006).
Others have found that peak N uptake occurred before veraison but in this study
significant N uptake occurred both before and after veraison. The differences in timing of
majority N uptake are probably because with higher proportion of vine mass in woody
53
tissues, the mature vines can rely more on nutrients reserves during the early part of the
season. In addition, bigger canopy and higher crop yield of Concord grapes (typically less
than 8 Mg/ha for wine grape and over 20 Mg/ha for Concord) might intensify the
grapevine mechanism to have prolonged N uptake period during active vine growth.
Heavy N uptake between veraison and harvest resulted from the newly absorbed N that
was not only partitioned into leaves and clusters but also restored to woody tissues. To
this end, N appeared to be mainly partitioned among woody tissues (33%), leaves and
shoot tips (27%) and clusters (34%) at harvest (Fig. 4.2).
It can be implied from the path of nutrient movement that fertilizers, if needed,
should be applied before bloom, but not before bud break since the grape vine has no
need at this stage and excessive rainfall may cause unwanted leaching of soluble
nutrients. Split-application of fertilizers could enhance efficiency of nutrient use in
growth and production. In addition, fertilization is not required at postharvest for this crop
in cool climate regions, as uptake does not occur after harvest.
Mg and Ca
Throughout the growing season, average total uptake per plant of Ca and Mg were
31.3 g and 5.7 g, respectively (Table 4.2). Although Mg is classified as a phloem mobile
nutrient, in Concord grape the accumulation pattern of Mg almost paralleled Ca. After
highest uptake occurred from bloom to veraison (Table 4.2), the whole vine Ca and Mg
contents still progressively increased until reaching the highest content at harvest. In
particular, Ca and Mg concentrations in the cluster decreased after bloom while Ca
concentration in leaf blades, petioles, and shoot tips increased from bloom to post-
harvest. Magnesium increased only in petiole and remained constant in leaf blades and
shoot tips. Calcium and Mg concentrations in leaf blades, shoot tips and petioles did not
54
decline after harvest as occurred with N, P and K. This indicates that neither Mg nor Ca
migrated back from leaves into woody tissues. Although the trends of nutrient uptake and
accumulation are alike, major changes of Ca or Mg content occurred in different vine
tissues. Apart from the greatest quantity found in trunk and cordon, the major change of
Mg was located in leaves and clusters whereas for Ca major changes occurred in the
coarse roots. Mg content in trunk, cordons and coarse roots at post-harvest was lower than
at the beginning of season while the change in Ca content was not significant. This is
probably because Mg remobilized back to woody tissues after harvest until the grapevines
entered dormancy while this movement did not occur in Ca due to its very low phloem
mobility.
This mature Concord grapevine had a similar Mg uptake, but three times higher
Ca uptake, than the 23 years old Pinot Noir vines reported by Schreiner et al. (2006), who
reported approximately 10 g Ca and 4.5 g Mg uptake per vine during the growing season.
Likely reasons for this considerable difference in the amount of Ca uptake is not only the
age of the Concord grapevines but also higher Ca available in soil since the Concord
grapevines were grown in fine sandy loam, pH 7.8-8.4, with average 309 meq.kg-1 Ca
whereas the Pinot Noir vines were grown in silty clay loam, pH 5.3-5.6, with average
28.2 meq.kg-1 Ca.
It is not always the case that N is always the most abundant mineral nutrient in the
plant. These 42 years old grapevines were found to have a higher total Ca content than N
content throughout growing season (Table 4.1). Woody tissues such as trunk, cordons,
and coarse roots had higher content of Ca than N at every growth stage, whereas annual
tissues such as shoot tips, leaf blades, and clusters showed higher content of N than Ca at
bloom. However, N content in the annual tissues were very close to that of Ca from
veraison to harvest, and were only half of Ca at post-harvest since N clearly migrated
55
back to the woody tissues before leaf fall. The amount of N and Ca in woody tissues (13 g
N and 20 g Ca) and leaf blade (10 g N and 11 g Ca) at veraison in this study was
consistent with the finding of Schreiner et al. (2006), who reported approximately 14 g N
and 19 g Ca in woody tissues and approximately 10 g N and 8 Ca in leaf blades of Pinot
Noir vines at veraison.
The reason for high Ca accumulation over time in the plant is that higher plants
appear to regulate differences between the natural abundance of Ca and the very low Ca
requirement by controlling the distribution of Ca within the cell (Marschner, 1995).
Calcium oxalate (CaOx) crystal deposition can occur within the vacuoles of cells (Kinzel,
1989) or associated with the cell wall (Demarty et al., 1984), which is the main
component of plant dry weight. In other words, the annual increase in permanent tissue
biomass resulted in increased vine Ca content.
Micronutrients
From one year to the next, seasonal patterns of micronutrient concentrations
varied considerably as to which organ and growth stage they attained the highest
concentration. Leaf blades, shoot tips and petioles showed highest concentration of B at
bloom and showed highest concentration of Mn at harvest, whereas Fe, Cu and Zn
showed highest concentration in fine roots where values fluctuated over time each year
(Fig. 4.3). The result is consistent in general with the finding of Schreiner et al. (2006)
who reported that micronutrient concentrations in various organs of the whole vine varied
highly over time.
Considering the total content of micronutrients in the whole vine (Fig. 4.4), the
trend of seasonal changes of B and Mn content in 2006 were similar to those in 2007.
Apparently, the highest uptake of B (90%) occurred from bloom to veraison whereas the
56
highest uptake of Mn (95 %) occurred from bloom to harvest (Table 4.2). In both years at
3-4 leaves, a large drop of B content occurred in coarse roots whereas a slight decrease
occurred in the trunk and cordons, suggesting that reserve B for the new growth of
grapevines was translocated from coarse roots more than from the trunk and cordons.
Conversely, Mn content in the trunk, cordons and coarse roots continuously decreased
from the beginning of season until reaching the lowest at veraison, and increased again in
the next growth stage. This reveals that Mn was remobilized from permanent structures to
support the new growth of grapevine annual tissues such as leaves. Movement of B and
Mn between woody tissues and annual tissues at the beginning of the season was
consistent with what happened at the end of season when Mn was restored to the trunk,
cordons and coarse roots at harvest while B seems to move only into the coarse roots
post-harvest (Fig. 4.4).
Concentrations of B and Mn in the annual tissues changed with different stages of
vine physiological development. After the highest concentration of B in leaves and
clusters occurred at bloom (Fig. 4.3), the concentration of B in clusters sharply decreased
while that of leaf blades, petioles, and shoot tips slightly decreased in later growth stages.
In contrast, Mn concentrations in leaves and cluster drastically increased from 3-4 leaves
to harvest. Hence, during the active vine growth, Mn seems to have a higher
accumulation rate in leaves than B, whereas a higher proportion of B was translocated to
clusters compared to Mn (Fig. 4.4). However, after harvest concentrations of B and Mn in
leaf blades, petioles and shoot tips remained unchanged until the end of the season,
indicating that neither of them migrated back from leaves into woody tissues. Boron is
recognized as being immobile in the phloem of many plant species, however, these result
showed that B had moderate phloem mobility in Concord grapevines, which agrees with
the other reported findings. Brown and Hu (1998) found that B in fruit, stone fruit, and
57
nut tree crops was highly phloem mobile, Hanson (1991) found that the supply of B
needed for reproductive growth in fruit tree crops was more than that needed for
vegetative growth, and O'Kelley (1957) found that B is required to support carbohydrate
metabolism, sugar translocation, and pollen tube germination.
Fe, Cu, and Zn content appeared to have an obvious year-to-year difference in
seasonal change due to their fluctuating contents in various organs (Fig. 4.4), especially
fine roots that showed their highest concentrations at every growth stage (Fig. 4.3). Total
Fe content in the whole vines was highest at veraison in both years but the Fe content in
2007 appeared to be higher in woody tissues and clusters and lower in leaf blades and
shoot tips when compared to 2006. This resulted from different tissue concentrations
rather than changes in vine biomass. Iron concentrations were highest and most dynamic
in fine roots, leaf blade and shoot tips.
In 2006, both Cu and Zn showed the first peak content at budbreak (Fig. 4.4)
resulting from high concentrations in trunk, cordons and fine roots (Fig. 4.3). Total
content of Cu and Zn was lowest between 3-4 leaves and bloom because of decreased
concentration in trunk and cordons. The second peak content of Cu occurred at harvest,
with a considerable amount of Cu accumulated in clusters whereas that of Zn occurred at
veraison with elevated concentrations in the trunk and cordons. Seasonal change of Cu
and Zn content in 2007 showed only one peak at harvest. The amount of Cu and Zn in the
trunk and cordon at each growth stage was more consistent than in 2006, and
accumulated Cu and Zn in clusters became pronounced by harvest. In 2007, highest
uptake of Cu and Zn likely occurred from veraison to harvest, which were approximately
20 mg and 30 mg per vine, respectively (Fig. 4.4).
Different nutrients appeared to have different tissues where the majority of
changes in content occurred. Almost half of B, Fe, Mn, and Cu contents were in leaf
58
blades and clusters from veraison to harvest, whereas up to 77% of Zn content was
located in the trunk and cordon, and about 15% of Fe and Cu were found in fine roots
throughout the growing season. While the changes in Fe, Mn and Zn concentrations in
various parts were similar between years, higher concentrations were found in the clusters
in 2007 as compared to 2006. All micronutrients except Cu that showed dissimilar results
between years, seeming to have lower contents in trunk, cordons and coarse roots at post-
harvest than what was measured at winter. This suggests that their remobilization back to
woody tissues might occur after harvest until the grapevines enter dormancy.
Difference between canopy and root development
Apart from a very small amount of young white fine roots found during the
growing season between 3-4 leaves and veraison, there was no other clear evidence of a
change in fine root biomass to confirm that a fall flush of root growth is common.
However, a significant decrease in fine root biomass was found after harvest, which
implies that roots typically do not grow during the dormant season. Hence, root growth,
as well as root nutrient acquisition and competency in the study, was inferred from
nutrient contents in fine roots and coarse roots, according to Volder et al. (2005), who
found that the decline in both N uptake and root respiration corresponded with a strong
decline in root N concentration.
Highest contents of N, P, and K in shoot tips occurred from bloom to veraison,
and those in shoots, leaf blades, petioles and clusters occurred from veraison to harvest
(Fig. 4.5). Nitrogen, P and K contents in coarse roots were lowest from veraison to
harvest. In fine roots, N and K contents were very similar from winter to bloom and
sharply declined at veraison and later growth stages, whereas P content showed non-
significant difference throughout the season. Hence, the nutrient decline in roots suggests
59
nutrient translocation out of the roots and competition for nutrients between roots
developing canopy and fruit production.
Similar activities were found in other nutrients during the active vine growth.
Highest contents of Ca and Mg in shoots, shoot tips and leaf blades occurred from
veraison to post-harvest, which corresponds to the period of lowest contents in coarse and
fine roots. On the other hand, B and Mn content in coarse and fine roots significantly
decreased at the 3-4 leaf stage and gradually increased at later growth stages, while B and
Mn contents in shoot tips sharply increased at 3-4 leaves and reached the highest at
veraison, while shoots, leaf blades and cluster reached the highest B and Mn content at
harvest.
Total contents of nutrients and their correlations
Total content of all nutrients tended to increase from winter to budbreak and again
from 3-4 leaves to veraison or harvest (Table 4.1), which implies a high nutrient
requirement to support growth at budburst and production during fruit ripening.
Strong correlations were found between total content of the individual nutrients,
except for Fe and Zn where the R2 values were < 0.50 (Table 4.3). This emphasizes the
seasonal pattern of the total content in the whole vine that most nutrients shared: the total
nutrient contents remained constant at the beginning of the season indicating the
importance of stored nutrient reserves in permanent structure, the total nutrient content
significantly increased after bloom, indicating nutrient uptake from the soil commenced; a
progressive increase until reaching a peak at harvest, followed by a significant decrease
post-harvest due to nutrient losses through fruit harvested and preparation for dormancy.
In contrast, the lack of strong correlations between Fe and the other nutrients as well as
60
Zn and the other nutrients reflect the variation in total Fe and Zn content in the whole
vines throughout the growing season.
Leaf blade and petiole analysis
Concentration of N, P, K, B, Cu and Zn in leaf blades and petiole were highest at
bloom and sharply reduced by veraison, then slowly decreased until the end of season
(Table 4.4). Such a dilution effect of nutrient concentration in leaf blades might result
from rapid leaf expansion and translocation of nutrients from leaves to clusters. In
contrast, concentrations of Ca and Mn in leaf blades and petioles were highest post-
harvest, probably because with low mobilities in plant phloem they became immobile
once deposited in individual leaves and continuously increased in concentration
throughout the season.
Relationships between leaf blade and petiole concentrations appeared to be strong
for N, K, Ca, Mn and Cu, and intermediate for P and B (Table 4.5). Weak relationship
found in correlation between leaf blades and petioles of Fe (R2 = 0.043), Mg (R2 = 0.127)
and Zn (R2 = 0.030) suggests antagonistic phenomena, previously demonstrated by Smith
and Cheng (2006) who reported higher blade than petiole Fe concentration, and Atalay
(1978) and Christensen (2005) who reported higher petiole than blade Zn concentrations
from bloom to veraison, whereas higher petiole than blade Mg concentration are not
reported else where.
Leaf blades showed higher concentrations of N, Ca, Mn, Cu and Fe than petioles,
whereas those of K, P, Mg, B and Zn were higher in petioles than leaf blades (Table 4.4).
This is probably because analysis of petioles indicates the current movement of nutrient
toward the leaf blade and therefore was sensitive to the status of mobile nutrients such as
K, P and Mg. In addition, when compared with petiole, there was less fluctuation of P,
61
Mg, and Zn concentrations in the blade throughout the growing season. Thus, blades
seem to better indicate overall status of nutrients, including mobile nutrients. Hence,
when consider a convenient and economical way for sampling only one plant part for
nutrient analysis, the whole leaf seems to be the best to represent nutrient status.
It would be most accurate to sample leaves at both bloom and veraison to evaluate
the nutrient status. Leaf analysis at bloom reflects nutrient remobilized from storage
reserves which allow fertilizer decision to be made within the current season and to
correct nutritional problems for the current crop. Leaf analysis at veraison reflects
nutrient supply for the most of season in which change of the mineral nutrients compared
with bloom is useful for estimating fertilizer required for split application and for
planning the next season’s fertilization. In this regard, good understanding of vine
physiological development is important for leaf sample timing. Leaf samples taken
between late bloom and early veraison may lead to data variation that is not because of
excessive nutrients or nutrient deficiencies but because of rapid nutrient change in leaf
tissues and substantial nutrient uptake from the soil.
Soil nutrients
Nutrient availabilities in soil did not show clear seasonal trend, however, apart
from nitrate which is very soluble, significant differences were found between availability
of all nutrients at surface and subsurface soils (Table 4.6). Most nutrient concentrations in
surface soil were higher than subsurface soil, except Ca and Mg. In this regard, highly
accumulated Ca in permanent structure of the Concord grape reflects the high CaCO3 in
this vineyard soil (Warden fine sandy loam). The reason why high contents of Ca and Mg
found in subsurface soil is probably due to calcification process and weathering of basalt
contained in the vineyard soil. In addition, difference between surface and subsurface soil
62
pH might resulted in greatly varies of nutrient availability around surface area of the root
system. This could be a reason for high fluctuations of Fe Cu and Zn contents in fine
roots.
CONCLUSION
Dry weights of the whole vines ranged from 4,229 to 9,068 grams. The highest
biomass of the whole plants occurred at harvest, which was approximately double of that
in winter, budbreak, 3-4 leaves, and bloom. These 42 years old grapevines were found to
have Ca as the most abundant mineral nutrient, followed by N and K. Between veraison
and harvest, different tissues in which the majority of changes in Ca, N and K contents
became obvious. Half of the Ca was in woody tissues, up to 65% of N content was in
annual tissues and up to 70% of K was in the clusters. In this regard, highly accumulated
Ca in permanent structure of the Concord grape reflects the high CaCO3 in the vineyard
soils, and resulted in the whole vine highest content of Ca throughout growing season.
On the other hand, during the growing season, major changes of P content
occurred in cluster whereas the major change of Mg occurred in leaves and clusters. For
micronutrients, almost half of the B, Fe, Mn, and Cu contents were located in leaf blades
and clusters from veraison to harvest, whereas up to 77% Zn was located in trunk and
cordon, and about 15% of Fe and Cu were found in fine roots throughout the growing
season.
Seasonal dynamics of nutrient contents, except those of Fe, Cu and Zn which
highly fluctuated between years, shared a common pattern. Translocation of nutrients
from woody tissues to actively growing organs was found at the beginning of the season.
Majority uptake of N, Ca and Mn from soil occurred from bloom to harvest while those
of P, K, Mg and B occurred from bloom to veraison. Restoration of N, P, K, Ca, Mg, B
63
and Mn back to woody tissues occurred after veraison until before leaf senescence with
no more nutrient uptake, plus remobilization of N, P and K from leaves back into the
woody tissues was observed before leaf senescence.
Likely reasons for the majority N uptake occurring at veraison and continuing
through harvest is not only high proportion of woody tissues that the mature vines can
rely on for nutrients reserves at the early season, but also big canopy and high crop level.
In addition, the long period of fruit ripening and short post-harvest period in this cool
climate seem to intensify grapevine mechanism of having both a prolonged uptake period
and rapid nutrient remobilization back to woody tissues during active vine growth. In this
regard, the whole leaf seems to be the best tissue to represent vine’s nutrient status. It
would be most accurate when leaf samples are taken at both bloom and veraison because
leaf analysis at bloom reflects nutrient remobilized from storage reserves which facilitate
fertilizer decision for the current season whereas veraison reflects nutrient supply for the
most of season and useful for estimating fertilizer, if required for split application, and for
planning the next season’s fertilization.
64
LITERATURE CITED
Alexander, D.Mc.E. 1958. Seasonal fluctuation in the nitrogen content of the Sultana
vine. Aust. J.Agric. Res. 8: 162-178.
Araujo, F.J., and L.E. Williams. 1988. Dry matter and nitrogen partitioning and root
growth of young field-grown Thomson Seedless grapevines. Vitis 27: 21-32.
Atalay, I.Z. 1978. The petiole and leaf blade relationships for the determination of
phosphorus and zinc status of vineyards. Vitis 17: 147-51.
Bates, T.R., R.M., Dunst, and P. Joy. 2002. Seasonnal dry matter, starch and nutrient
distribution in Concord grapevine roots. HortScience 37: 313-316.
Brown, P.H., and H. Hu. 1998. Phloem Boron mobility in diverse plant species. Bot. Acta
111: 331-335.
Christensen, L.P. 1984. Nutrient level comparisons of leaf petioles and blades in twenty-
six grape cultivars over three years (1979 through 1981). AM. J. Enol. Vitic. 35
(3): 124-133.
Christensen, L.P. 2005. Foliar fertilization in vine mineral nutrient management program.
p. 83-90. In P. Christensen and D.R. Smart (eds.) Proc. Symp. on Soil Environment
and Vine mineral Nutrition, Sandiago, CA. 29-30 June 2004. Am. Soc. Enol. And
Vitic., Davis, CA.
Conradie, W.J. 1980. Seasonal uptake of nutrients by Chenin blanc in sand culture: I.
Nitrogen. S. Afr. J. Enol. Vitic. 1:59-65.
Conradie, W. J. 1981. Seasonal Uptake of Nutrients by Chenin Blanc in Sand Culture: II.
Phosphorus, Potassium, Calcium and Magnesium. S. Afr. J. Enol. Vitic. 2(1): 7-13.
Conradie, W.J. 1986. Utilization of nitrogen by the grape-vine as affected by time of
application and soil type. S. Afr. J. Enol. Vitic. 40: 91-98.
65
Conradie, W.J. 1992. Partitioning of nitrogen by the grapevine during autumn and the
utilization of nitrogen reserves during the following growing season. S. Afr. J. Enol.
Vitic. 13: 45-51.
Conradie, W.J. 2005. Translocation and storage of nitrogen by grapevines as affected by
time of application. p. 32-41. In P. Christensen and D.R. Smart (eds.) Proc. Symp. on
Soil Environment and Vine mineral Nutrition, Sandiago, CA. 29-30 June 2004. Am.
Soc. Enol. And Vitic., Davis, CA.
Davenport, J. R., and R. G. Steven. 2006. High soil moisture and low soil temperature are
associated with chlorosis occurrence in Concord grape. HortScience 41: 418-422.
Demarty, M., C. Morvan, and M. Thellier. 1984. Calcium and the cell wal. Plant Cell
Environ. 7: 441-448.
Epstein, E. and A. J. Bloom. 2005. Mineral Nutrition of Plants: Principles and
Perspectives, 2nd ed. Sinauer, Sunderland, Massachusetts.
Hanson, E.J. 1991. Movement of boron out of tree fruit leaves. Hort Sci. 26: 271-273
Hanson, E.J., and G.S. Howell. 1995. Nitrogen accumulation and fertilizer use efficiency
by grapevines in short-season growing areas. Hort Sci. 30: 504-507.
Kinzel, H. 1989. Calcium in the vacuoles and cell walls of plant tissue. Flora 182: 99–125
Lohnertz, O. 1991. Soil Nitrogen and the Uptake of Nitrogen in Grapevines. p. 1-11. In
J.M. Rantz, (ed.) Proc. Int. Symp. on Nitrogen in Grapes and Wine, Seattle, WA.
18-19 June 1991. Am. Soc. Enol. And Vitic., Davis, CA.
Marschner, H. 2002. Mineral nutrition of higher plants, 2nd ed. Academic Press, London,
UK.
Mullins, M.G., A. Bouquet, and L.E. Williams. 1992. Biology of the grapevine.
Cambridge Univ. Press, Cambridge, UK.
66
O'Kelley, J.C. 1957. Boron effects on growth, oxygen uptake, and sugar absorption by
germinating pollen. Am. J. Bot. 44: 239-44.
Roubelakis-Angelakis, K.A., and W.M. Kliewer. 1992. Nitrogen metabolism in
grapevine. Hortic. Rev. 14: 407-452.
Schreiner, R.P., C.F. Scagel, and J. Baham. 2006. Nutrient uptake and distribution in a
mature ‘Pinot Noir’ vineyard. HortScience 41(2): 336-345.
Smith, B. R. and L.L. Cheng. 2006. Fe-EDDHA alleviates chlorosis in Concord
grapevines grown at high pH. HortScience 41: 1498-1501.
Soltanpour, P.N., G.W. Johnson, S.M. Workman, J.B. Jones, Jr., and R.O. Miller. 1996.
Inductively coupled plasma emission spectrometry and inductively coupled plasma–
mass spectrometry. p. 91–139. In D.L. Sparks et al. (eds.) Methods of soil analysis.
Part 3. SSSA Book Ser. 5. SSSA, Madison, WI.
Volder, A., D.R. Smart, A.J. Bloom, and D.M. Eissenstat. 2005. Rapid decline in nitrate
uptake and respiration with age in fine lateral roots of grape: implications for root
efficiency and competitive effectiveness. New Phytologist 165: 493-502.
Welch, R. M. 1986. Effects of nutrient deficiencies on seed production and quality. Adv
Plant Nutr 2: 205-247.
Williams, L.E, and P.J. Biscay. 1991. Partitioning of dry weight, nitrogen, and potassium
in Cabernet Sauvignon grapevines from anthesis until harvest. Am. J. Enol. Vitic.
42: 113-117.
Yeomans, J.C., and J.M. Bremner. 1991. Carbon and nitrogen analysis of soils by
automated combustion techniques. Comm. Soil Sci. Plant Anal. 22: 843-850.
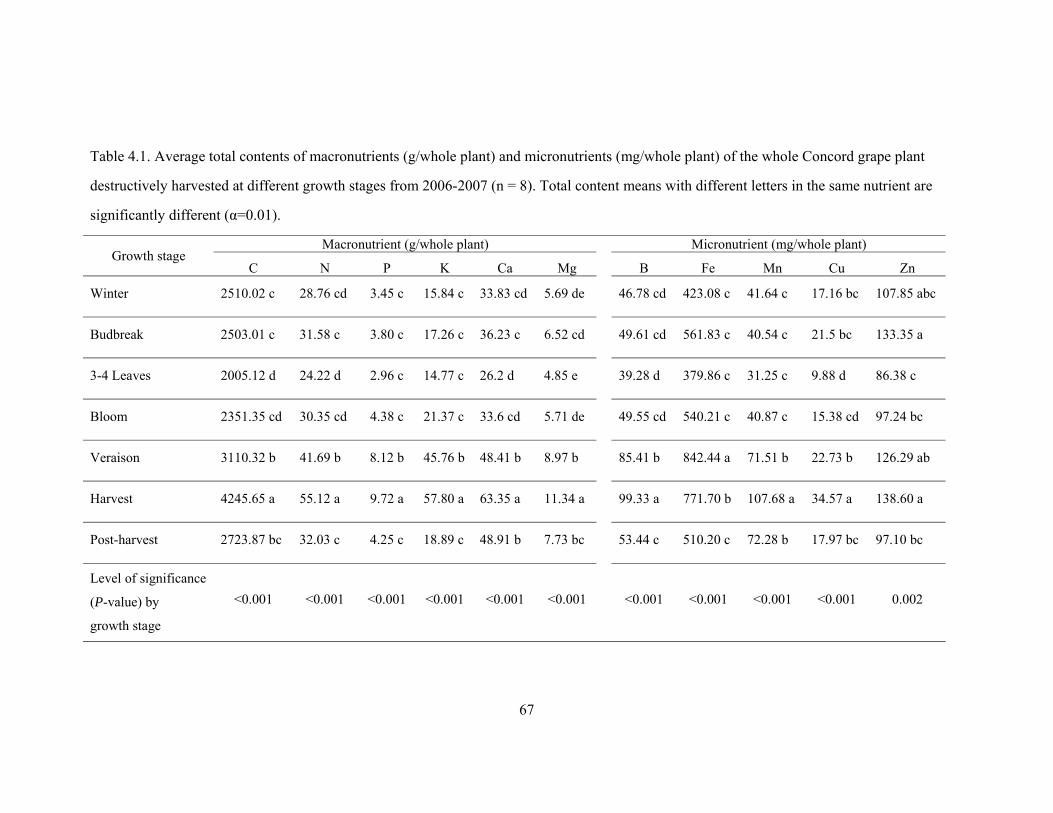
67
Table 4.1. Average total contents of macronutrients (g/whole plant) and micronutrients (mg/whole plant) of the whole Concord grape plant
destructively harvested at different growth stages from 2006-2007 (n = 8). Total content means with different letters in the same nutrient are
significantly different (α=0.01).
Macronutrient (g/whole plant) Micronutrient (mg/whole plant) Growth stage
C N P K Ca Mg B Fe Mn Cu Zn
Winter 2510.02 c 28.76 cd 3.45 c 15.84 c 33.83 cd 5.69 de 46.78 cd 423.08 c 41.64 c 17.16 bc 107.85 abc
Budbreak 2503.01 c 31.58 c 3.80 c 17.26 c 36.23 c 6.52 cd 49.61 cd 561.83 c 40.54 c 21.5 bc 133.35 a
3-4 Leaves 2005.12 d 24.22 d 2.96 c 14.77 c 26.2 d 4.85 e 39.28 d 379.86 c 31.25 c 9.88 d 86.38 c
Bloom 2351.35 cd 30.35 cd 4.38 c 21.37 c 33.6 cd 5.71 de 49.55 cd 540.21 c 40.87 c 15.38 cd 97.24 bc
Veraison 3110.32 b 41.69 b 8.12 b 45.76 b 48.41 b 8.97 b 85.41 b 842.44 a 71.51 b 22.73 b 126.29 ab
Harvest 4245.65 a 55.12 a 9.72 a 57.80 a 63.35 a 11.34 a 99.33 a 771.70 b 107.68 a 34.57 a 138.60 a
Post-harvest 2723.87 bc 32.03 c 4.25 c 18.89 c 48.91 b 7.73 bc 53.44 c 510.20 c 72.28 b 17.97 bc 97.10 bc
Level of significance
(P-value) by
growth stage
<0.001 <0.001 <0.001 <0.001 <0.001 <0.001
<0.001 <0.001 <0.001 <0.001 0.002
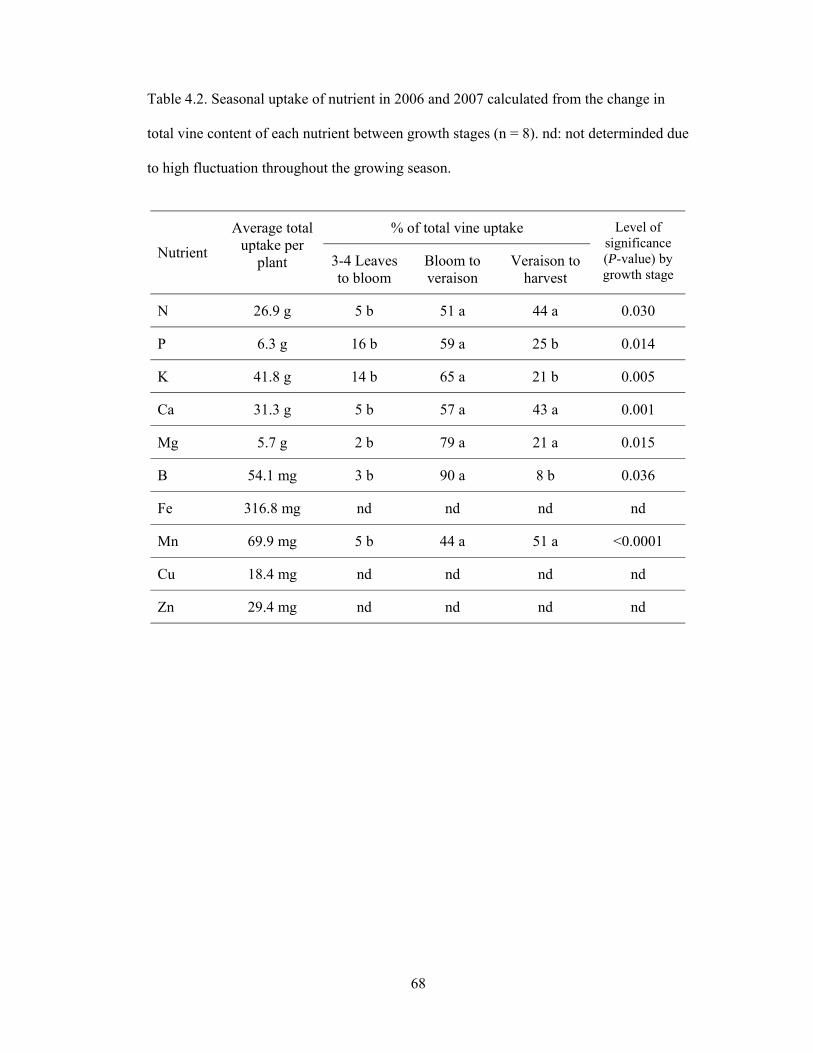
68
Table 4.2. Seasonal uptake of nutrient in 2006 and 2007 calculated from the change in
total vine content of each nutrient between growth stages (n = 8). nd: not determinded due
to high fluctuation throughout the growing season.
% of total vine uptake
Nutrient
Average total uptake per
plant 3-4 Leaves to bloom
Bloom to veraison
Veraison to harvest
Level of significance (P-value) by growth stage
N 26.9 g 5 b 51 a 44 a 0.030
P 6.3 g 16 b 59 a 25 b 0.014
K 41.8 g 14 b 65 a 21 b 0.005
Ca 31.3 g 5 b 57 a 43 a 0.001
Mg 5.7 g 2 b 79 a 21 a 0.015
B 54.1 mg 3 b 90 a 8 b 0.036
Fe 316.8 mg nd nd nd nd
Mn 69.9 mg 5 b 44 a 51 a <0.0001
Cu 18.4 mg nd nd nd nd
Zn 29.4 mg nd nd nd nd
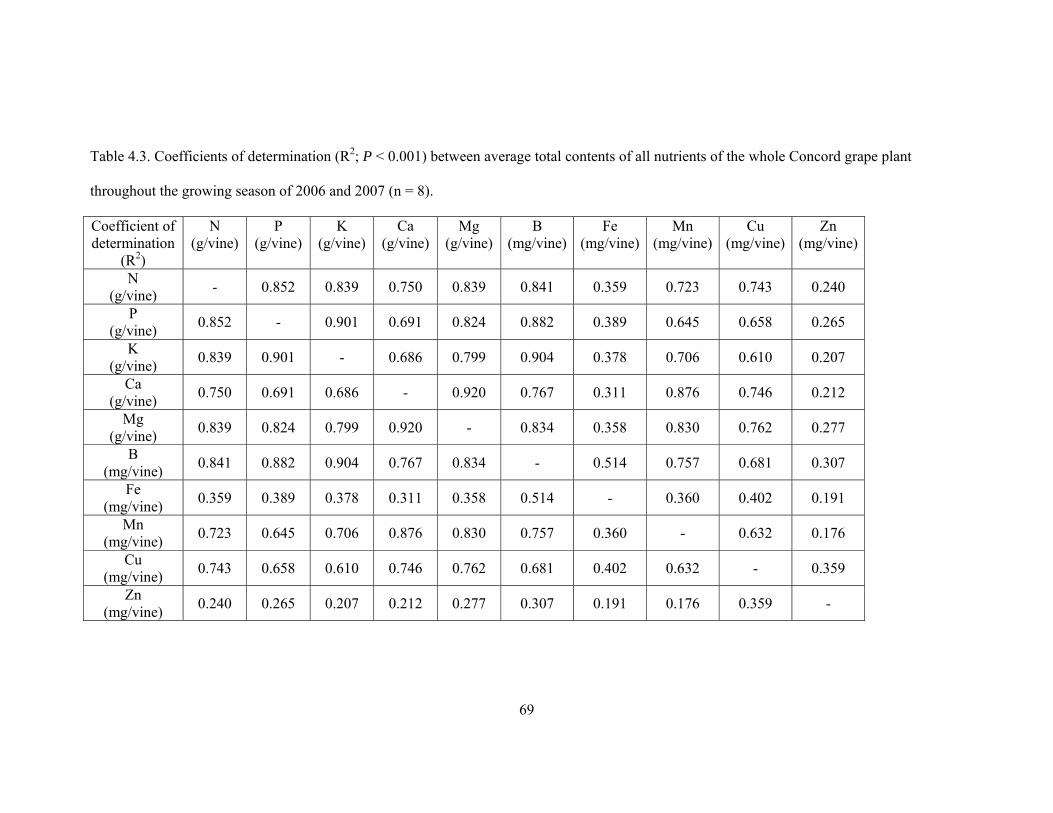
69
Table 4.3. Coefficients of determination (R2; P < 0.001) between average total contents of all nutrients of the whole Concord grape plant
throughout the growing season of 2006 and 2007 (n = 8).
Coefficient of determination
(R2)
N (g/vine)
P (g/vine)
K (g/vine)
Ca (g/vine)
Mg (g/vine)
B (mg/vine)
Fe (mg/vine)
Mn (mg/vine)
Cu (mg/vine)
Zn (mg/vine)
N (g/vine) - 0.852 0.839 0.750 0.839 0.841 0.359 0.723 0.743 0.240
P (g/vine) 0.852 - 0.901 0.691 0.824 0.882 0.389 0.645 0.658 0.265
K (g/vine) 0.839 0.901 - 0.686 0.799 0.904 0.378 0.706 0.610 0.207
Ca (g/vine) 0.750 0.691 0.686 - 0.920 0.767 0.311 0.876 0.746 0.212
Mg (g/vine) 0.839 0.824 0.799 0.920 - 0.834 0.358 0.830 0.762 0.277
B (mg/vine) 0.841 0.882 0.904 0.767 0.834 - 0.514 0.757 0.681 0.307
Fe (mg/vine) 0.359 0.389 0.378 0.311 0.358 0.514 - 0.360 0.402 0.191
Mn (mg/vine) 0.723 0.645 0.706 0.876 0.830 0.757 0.360 - 0.632 0.176
Cu (mg/vine) 0.743 0.658 0.610 0.746 0.762 0.681 0.402 0.632 - 0.359
Zn (mg/vine) 0.240 0.265 0.207 0.212 0.277 0.307 0.191 0.176 0.359 -
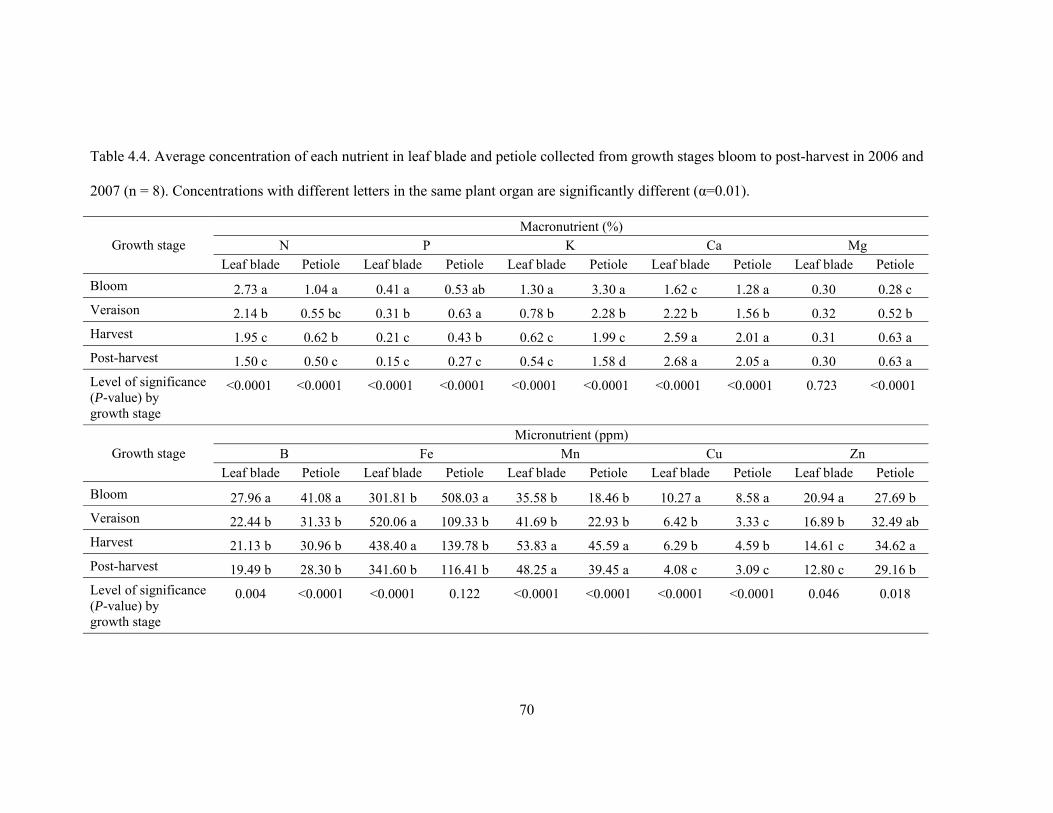
70
Table 4.4. Average concentration of each nutrient in leaf blade and petiole collected from growth stages bloom to post-harvest in 2006 and
2007 (n = 8). Concentrations with different letters in the same plant organ are significantly different (α=0.01).
Macronutrient (%) N P K Ca Mg Growth stage
Leaf blade Petiole Leaf blade Petiole Leaf blade Petiole Leaf blade Petiole Leaf blade Petiole Bloom 2.73 a 1.04 a 0.41 a 0.53 ab 1.30 a 3.30 a 1.62 c 1.28 a 0.30 0.28 c Veraison 2.14 b 0.55 bc 0.31 b 0.63 a 0.78 b 2.28 b 2.22 b 1.56 b 0.32 0.52 b Harvest 1.95 c 0.62 b 0.21 c 0.43 b 0.62 c 1.99 c 2.59 a 2.01 a 0.31 0.63 a Post-harvest 1.50 c 0.50 c 0.15 c 0.27 c 0.54 c 1.58 d 2.68 a 2.05 a 0.30 0.63 a Level of significance (P-value) by growth stage
<0.0001 <0.0001 <0.0001 <0.0001 <0.0001 <0.0001 <0.0001 <0.0001 0.723 <0.0001
Micronutrient (ppm) B Fe Mn Cu Zn Growth stage
Leaf blade Petiole Leaf blade Petiole Leaf blade Petiole Leaf blade Petiole Leaf blade Petiole Bloom 27.96 a 41.08 a 301.81 b 508.03 a 35.58 b 18.46 b 10.27 a 8.58 a 20.94 a 27.69 b Veraison 22.44 b 31.33 b 520.06 a 109.33 b 41.69 b 22.93 b 6.42 b 3.33 c 16.89 b 32.49 ab Harvest 21.13 b 30.96 b 438.40 a 139.78 b 53.83 a 45.59 a 6.29 b 4.59 b 14.61 c 34.62 a Post-harvest 19.49 b 28.30 b 341.60 b 116.41 b 48.25 a 39.45 a 4.08 c 3.09 c 12.80 c 29.16 b Level of significance (P-value) by growth stage
0.004 <0.0001 <0.0001 0.122 <0.0001 <0.0001 <0.0001 <0.0001 0.046 0.018
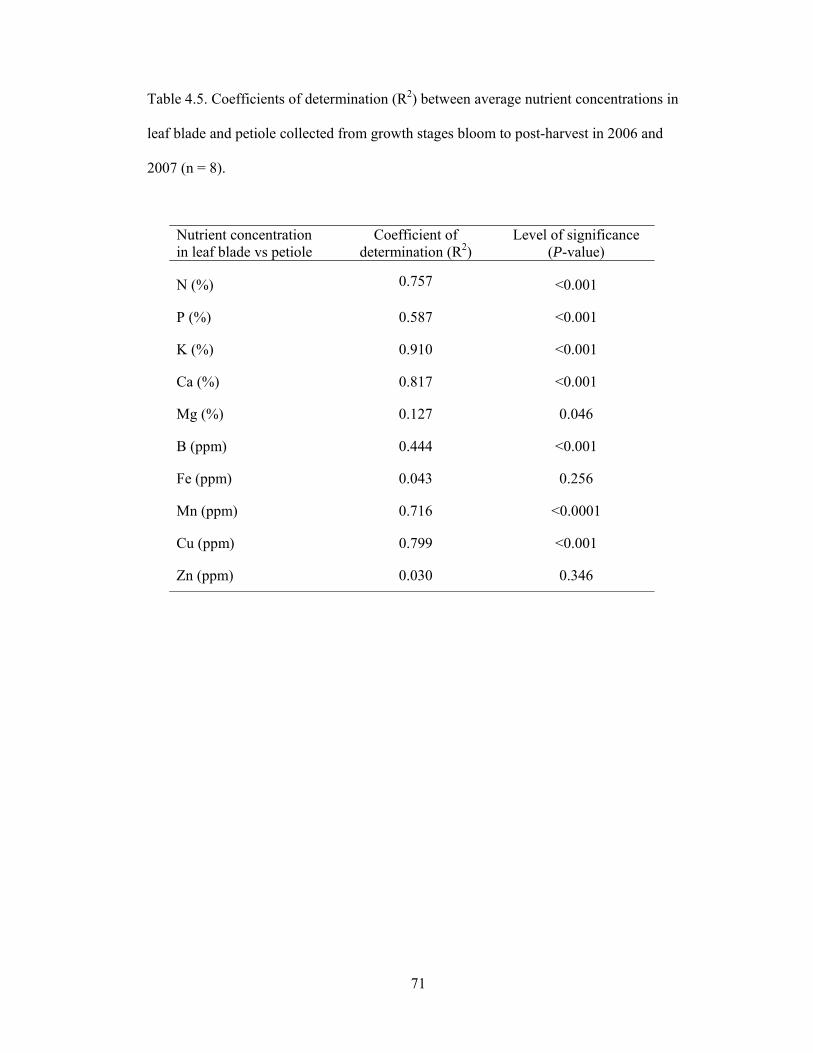
71
Table 4.5. Coefficients of determination (R2) between average nutrient concentrations in
leaf blade and petiole collected from growth stages bloom to post-harvest in 2006 and
2007 (n = 8).
Nutrient concentration in leaf blade vs petiole
Coefficient of determination (R2)
Level of significance (P-value)
N (%) 0.757 <0.001
P (%) 0.587 <0.001
K (%) 0.910 <0.001
Ca (%) 0.817 <0.001
Mg (%) 0.127 0.046
B (ppm) 0.444 <0.001
Fe (ppm) 0.043 0.256
Mn (ppm) 0.716 <0.0001
Cu (ppm) 0.799 <0.001
Zn (ppm) 0.030 0.346
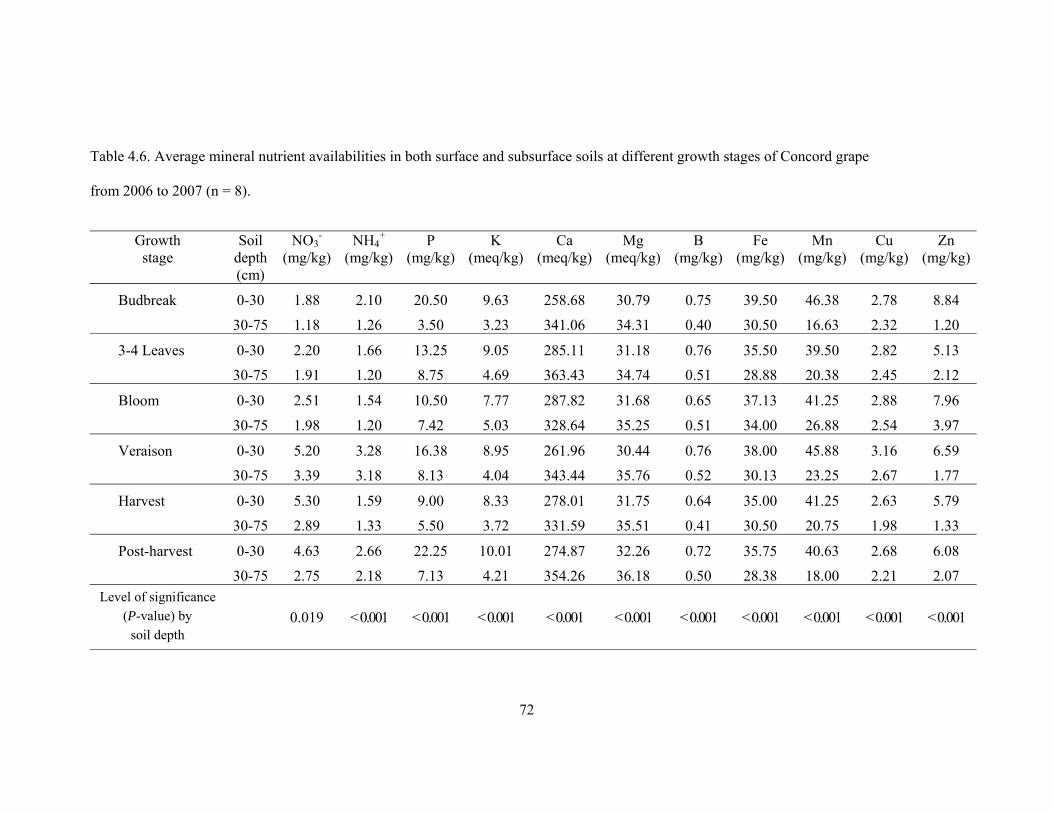
72
Table 4.6. Average mineral nutrient availabilities in both surface and subsurface soils at different growth stages of Concord grape
from 2006 to 2007 (n = 8).
Growth Soil NO3
- NH4+ P K Ca Mg B Fe Mn Cu Zn
stage depth (mg/kg) (mg/kg) (mg/kg) (meq/kg) (meq/kg) (meq/kg) (mg/kg) (mg/kg) (mg/kg) (mg/kg) (mg/kg) (cm)
Budbreak 0-30 1.88 2.10 20.50 9.63 258.68 30.79 0.75 39.50 46.38 2.78 8.84
30-75 1.18 1.26 3.50 3.23 341.06 34.31 0.40 30.50 16.63 2.32 1.20
3-4 Leaves 0-30 2.20 1.66 13.25 9.05 285.11 31.18 0.76 35.50 39.50 2.82 5.13
30-75 1.91 1.20 8.75 4.69 363.43 34.74 0.51 28.88 20.38 2.45 2.12
Bloom 0-30 2.51 1.54 10.50 7.77 287.82 31.68 0.65 37.13 41.25 2.88 7.96
30-75 1.98 1.20 7.42 5.03 328.64 35.25 0.51 34.00 26.88 2.54 3.97
Veraison 0-30 5.20 3.28 16.38 8.95 261.96 30.44 0.76 38.00 45.88 3.16 6.59
30-75 3.39 3.18 8.13 4.04 343.44 35.76 0.52 30.13 23.25 2.67 1.77
Harvest 0-30 5.30 1.59 9.00 8.33 278.01 31.75 0.64 35.00 41.25 2.63 5.79
30-75 2.89 1.33 5.50 3.72 331.59 35.51 0.41 30.50 20.75 1.98 1.33
Post-harvest 0-30 4.63 2.66 22.25 10.01 274.87 32.26 0.72 35.75 40.63 2.68 6.08
30-75 2.75 2.18 7.13 4.21 354.26 36.18 0.50 28.38 18.00 2.21 2.07 Level of significance
(P-value) by soil depth
0.019 < 0.001 < 0.001 < 0.001 < 0.001 < 0.001 < 0.001 < 0.001 < 0.001 < 0.001 < 0.001
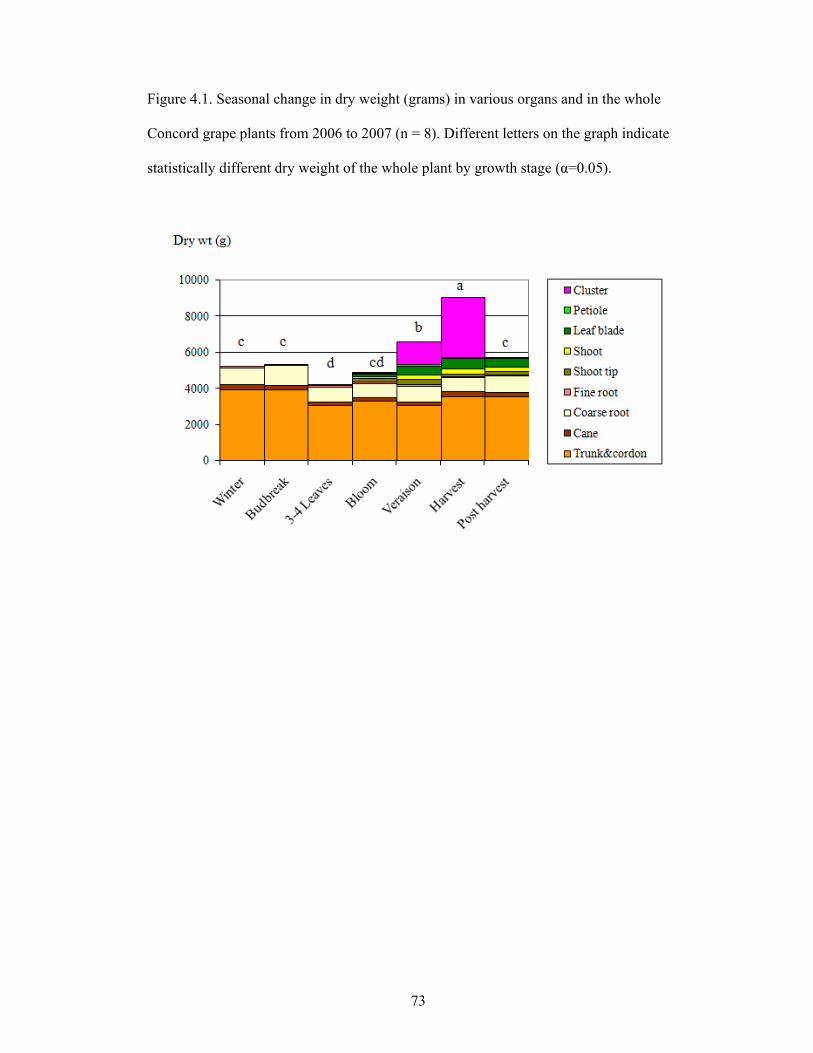
73
Figure 4.1. Seasonal change in dry weight (grams) in various organs and in the whole
Concord grape plants from 2006 to 2007 (n = 8). Different letters on the graph indicate
statistically different dry weight of the whole plant by growth stage (α=0.05).
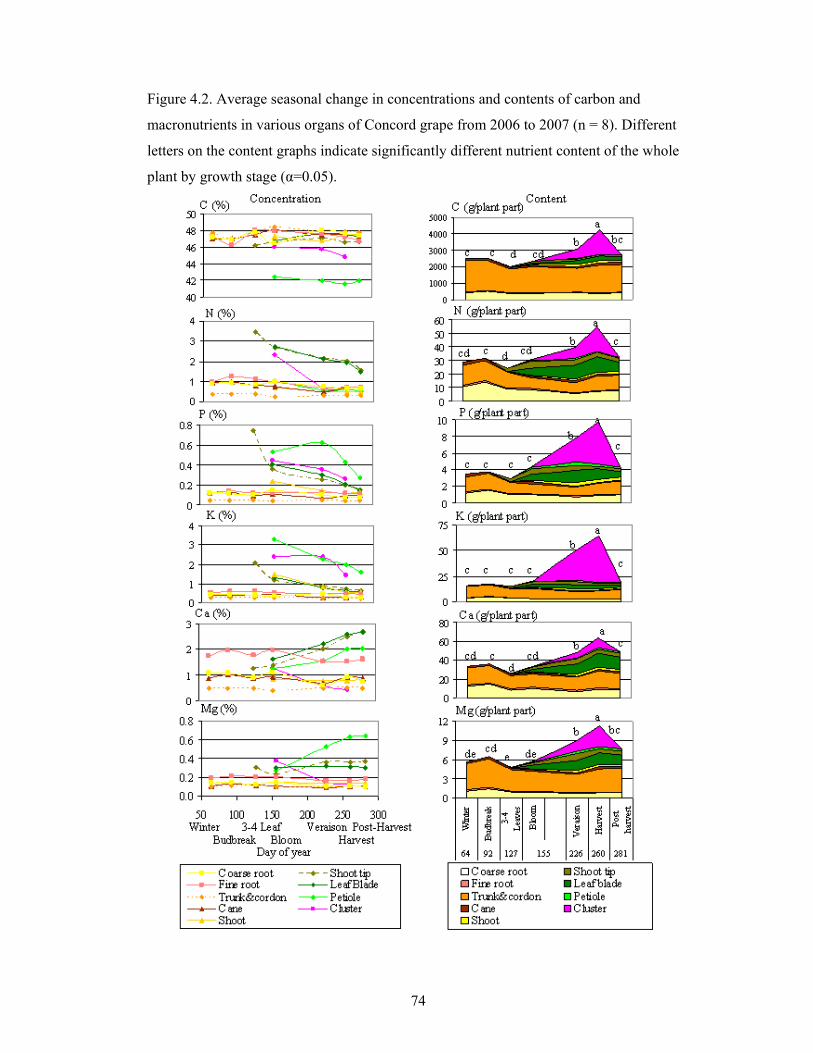
74
Figure 4.2. Average seasonal change in concentrations and contents of carbon and
macronutrients in various organs of Concord grape from 2006 to 2007 (n = 8). Different
letters on the content graphs indicate significantly different nutrient content of the whole
plant by growth stage (α=0.05).
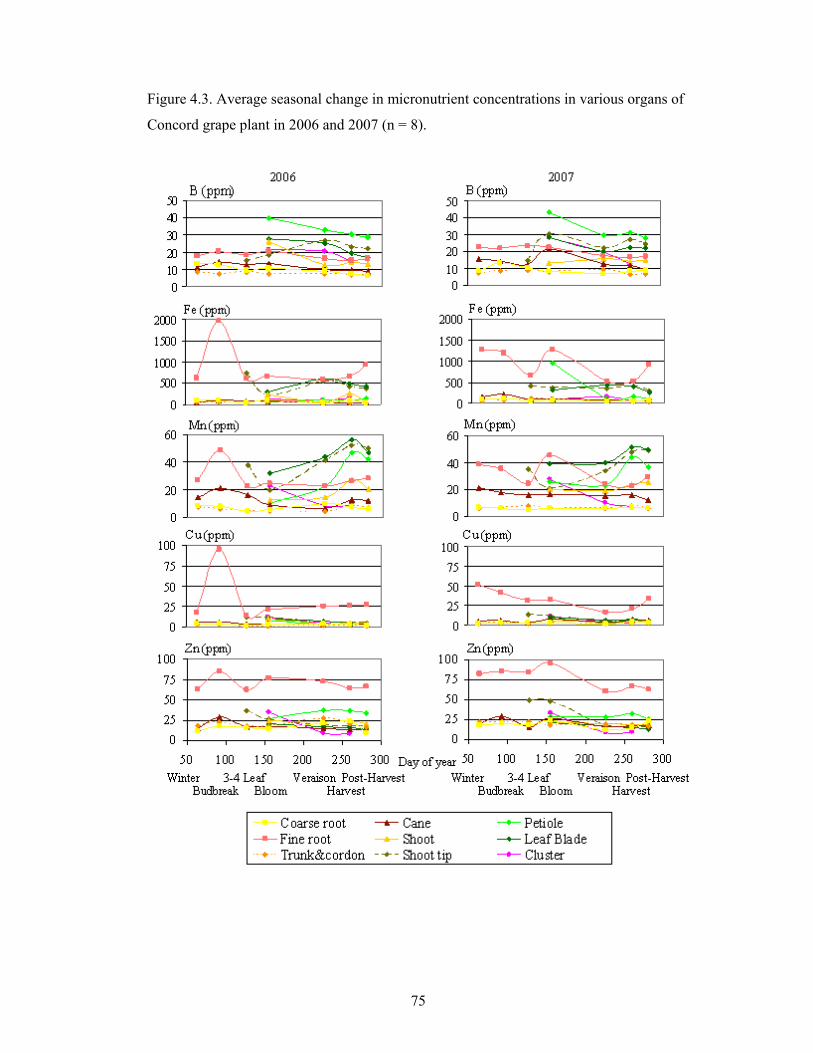
75
Figure 4.3. Average seasonal change in micronutrient concentrations in various organs of
Concord grape plant in 2006 and 2007 (n = 8).

76
Figure 4.4. Average seasonal change in micronutrient contents in various organs and the
whole Concord grape plant in 2006 and 2007 (n = 8). Different letters on each graph
indicate significantly different content of the whole plant by growth stage (α=0.05).
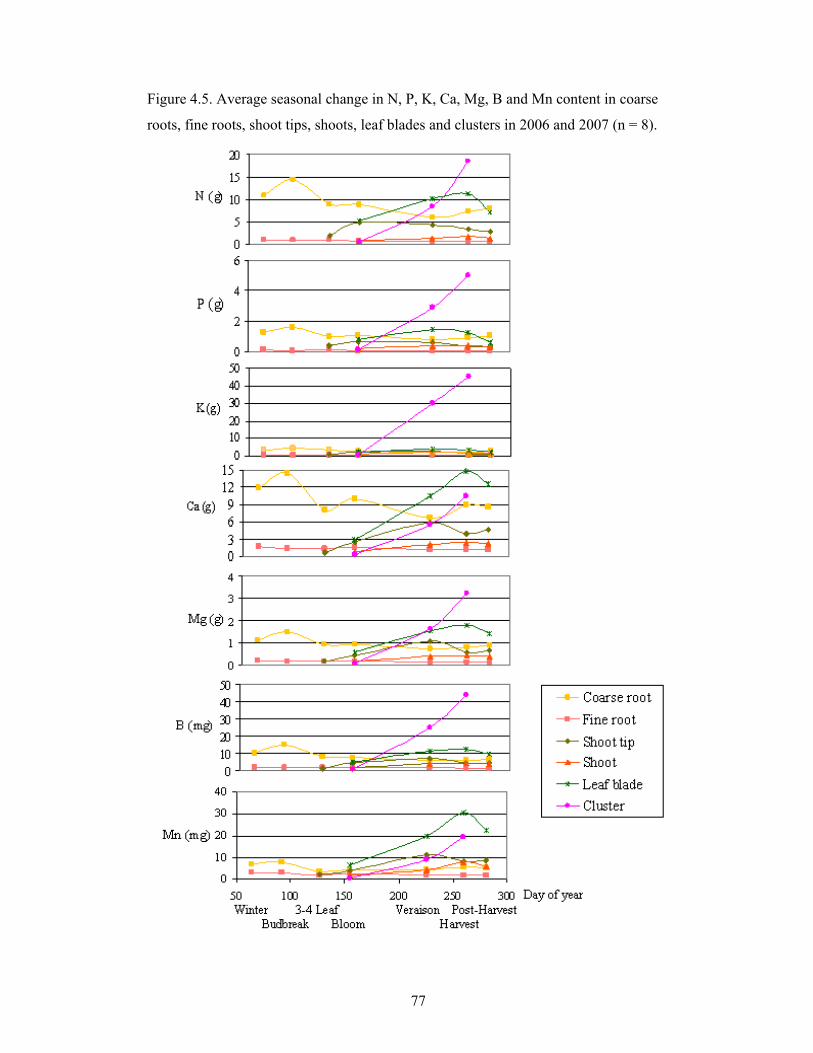
77
Figure 4.5. Average seasonal change in N, P, K, Ca, Mg, B and Mn content in coarse
roots, fine roots, shoot tips, shoots, leaf blades and clusters in 2006 and 2007 (n = 8).
78
CHAPTER FIVE
SUMMARY AND CONCLUSIONS
The objectives of this research were to (i) develop methodology for root and tissue
sampling to monitor the nutrient status of Concord grapes, (ii) investigate seasonal
distribution pattern of Concord grape fine roots, (iii) investigate seasonal pattern of
macronutrients and micronutrient uptake and redistribution in Concord grapes, and (iv)
identify the choice of tissue type (petiole or leaf blade) and the best time to sample
grapevines for routine nutritional evaluation. The research was conducted on a 42 year-
old own-rooted Concord vineyard. The site is furrow irrigated fine sandy loam and has
been managed with uniform fertilization, water and pest management practices.
To develop methodology for root sampling, in 2005 at 6500 C degree days two
different sample interval spacings (20, 60, 120 cm and 50, 100, 150 cm in a radial pattern
around the vine trunk) were compared on three vines to determine the extent that
represented the highest density of fine roots. The result showed that density of fine roots
was higher when sample spacing was closer to the vine trunk, therefore, fine root
sampling pattern at 20, 60, and 120 cm from trunk was chosen for the study in 2006 and
2007. Each soil core in subsequent collections were washed and weighed individually to
better illustrate root distribution patterns.
To develop methodology for tissue sampling, in 2006 four vines of uniform size
were destructively harvested at seven key growth stages: winter pruning, bud break, 3-4
leaves, bloom, veraison, harvest, and post-harvest. Separated plant tissues were dried,
weighed, ground and analyzed for C, N, P, K, Ca, Mg, Cu, Fe, Mn, Zn and B. The result
showed similar nutrient concentrations between fruiting shoots and vegetative shoots as
well as between trunk and cordon throughout the growing season, suggesting that the
79
most efficient way to classify the whole plant tissues for 2007 was to scale down from 14
to 9 tissue types including woody tissues, canes, coarse roots, fine roots, shoots, leaf
blades, petioles, shoot tips and clusters.
Nutrient uptake and redistribution in the whole vines was determined based on dry
weight and nutrient analysis of four vines each destructively harvested at the seven key
growth stages in 2006 and 2007, as well as soil samples collected at each harvest point.
Modeling nutrient movement throughout various plant tissue compartments and whole
plant nutrient uptake were accomplished by calculating the content of each mineral
element within each tissue (dry mass x concentration) at each growth stage.
The whole vines had dry weights ranging from 4,229 to 9,068 grams. The highest
biomass of the whole plants occurred at harvest, which was approximately double of that
in winter, budbreak, 3-4 leaves, and bloom. Grapevine roots were not uniformly
distributed throughout plant growth stages and the soil profile. Root density appeared to
be concentrated in the top 30 cm of soil within 120 cm away from the trunk and the root
density was sharply reduced in the subsurface soil and with distance away from the vine
trunk. Fine root distribution of Concord grape was strongly influenced by growth stage
and soil depth but was not affected by distance from or direction around the trunk.
Distribution of Concord fine roots and coarse roots varied slightly from one year to the
next. Apart from very small amount of young white fine roots found between 3-4 leaves
and veraison, there was no other clear evidence to confirm that fall flush of root occurred.
These 42 years old grapevines were found to have Ca as the most abundant
mineral nutrient, followed with N and K. Between veraison and harvest, different tissues
were identified for where the majority of Ca, N and K were loaded: half of Ca was in
woody tissues, up to 65% of N content was in annual tissues and up to 70% of K was in
the clusters. In this regard, highly accumulated Ca in permanent structure of the Concord
80
grape reflects the high CaCO3 in the vineyard soils, and resulted in the whole vine highest
content of Ca throughout growing season.
On the other hand, 50% of P content was located in clusters between veraison and
harvest indicates that the clusters were a strong sink for P and it is important to ensure
that the grapevines grown in calcareous soils have it enough for fruit production since the
availability of P might be limited in high soil pH. During the same time frame, almost half
of Mg, B, Fe, Mn, and Cu contents were located in leaf blades and clusters from veraison
to harvest, whereas up to 77% Zn was located in trunk and cordon, and about 15% of Fe
and Cu were found in fine roots throughout the growing season.
Seasonal dynamics of nutrient contents, except those of Fe, Cu and Zn which
highly fluctuated from year to year, shared a practical pattern: Translocation of nutrients
from woody tissues to actively growing organs was found at the beginning of the season.
The majority uptake of N, Ca and Mn from soil occurred from bloom to harvest while P,
K, Mg and B uptake occurred from bloom to veraison. Mobilization of N, P, K, Ca, Mg,
B and Mn back to woody tissues occurred after veraison until before leaf senescence with
no more nutrient uptake, plus remobilization of N, P and K from leaves back into the
woody tissues was observed before leaf senescence.
Likely reasons for the majority N uptake occurring at veraison and continuing
through harvest is not only high proportion of woody tissues that the mature vines can
rely on for nutrients reserves at the early season, but also the big canopy and high crop
level of Concord grapes. In addition, long period of fruit ripening and short period of
post-harvest in this cool climate region seemed to intensify grapevine mechanism to have
both prolonged the uptake period and early nutrient remobilization during active vine
growth. Hence, it can be implied from the path of nutrient movement that fertilizers, if
needed, should be applied before bloom, but not before bud break since the grape vine
81
has no need at this stage and excessive rainfall may cause unwanted leaching of soluble
nutrients. Split-application of fertilizers could enhance efficiency of nutrient use in
growth and production. In addition, fertilization is not required postharvest for this crop
in cool climate regions, as uptake does not occur after harvest.
Leaf blades showed higher concentrations of N, Ca, Mn, Cu and Fe than petioles,
whereas those of K, P, Mg, B and Zn were higher in petioles than leaf blades. This likely
reflects that petiole tissue indicates the current movement of nutrient toward the leaf
blade and therefore is sensitive to the status of mobile nutrients such as K, P and Mg. In
addition, when compared with petiole, there was less fluctuation of P, Mg, and Zn
concentrations in the blade throughout the growing season. Thus, leaf blade analysis at
bloom seems to be the best to represent vine’s nutrient status for fertilizer
recommendation since substantial nutrient uptake from the soil occurred after bloom and
leaf blades indicate overall status of nutrients, including mobile nutrients.
In this study, high pH of the soil has played a role in highly accumulated Ca in
permanent structure of these mature Concord grapes without occurrence of any nutrient
deficiency symptom. However, the result showed high fluctuation of Fe, Cu and Zn
contents in various vine organs, especially fine roots. In addition to variation of nutrient
levels within the root zone relate to the difference between surface and subsurface soil
pH, a likely reason for this is that parts of the nutrients were not in the active form that
available for plant assimilation and therefore did not reflect the actual nutrient status of
the vines. Research involving the relationship between various forms of mineral nutrient
and vine nutrient status, as well as pH adjustment in calcareous vineyard soils and effects
of increased apoplast pH on nutrient availability in grapevines, may yield more concrete
information regarding nutrient partitioning and nutrition balances in Concord grape.