update on nts demand forecast - office of gas and ... · pdf fileupdate on nts demand forecast...
TRANSCRIPT
1
Update on NTS Demand ForecastDSWG – 23 April 2007
Peter Zeng
Network OperationsNational Grid
2
Agenda
IntroductionDemand Forecast - OverviewNew Forecasting Process IntroducedForecast PerformanceDiscussions on Provision of Additional Information to the MarketConclusions

3
Introduction
At DSWG in August 2006,we presented an overview of NG demand forecasting processkey information used in the forecasta description of models used
Objective of this presentationUpdate on the new process introducedDemand forecast performanceDiscussion on provision of additional background information to help market understand our forecasts
Forecast methodology statementDemand side response

4
NTS Demand Forecast Process
iGMS
Forecaster
Input data Forecasts
Shippers
MIS
CONTROL ROOM
Forecasts Published on Gemini, Information
Exchange, SIS and ANS.
DNsWeather
NTS Directs
5
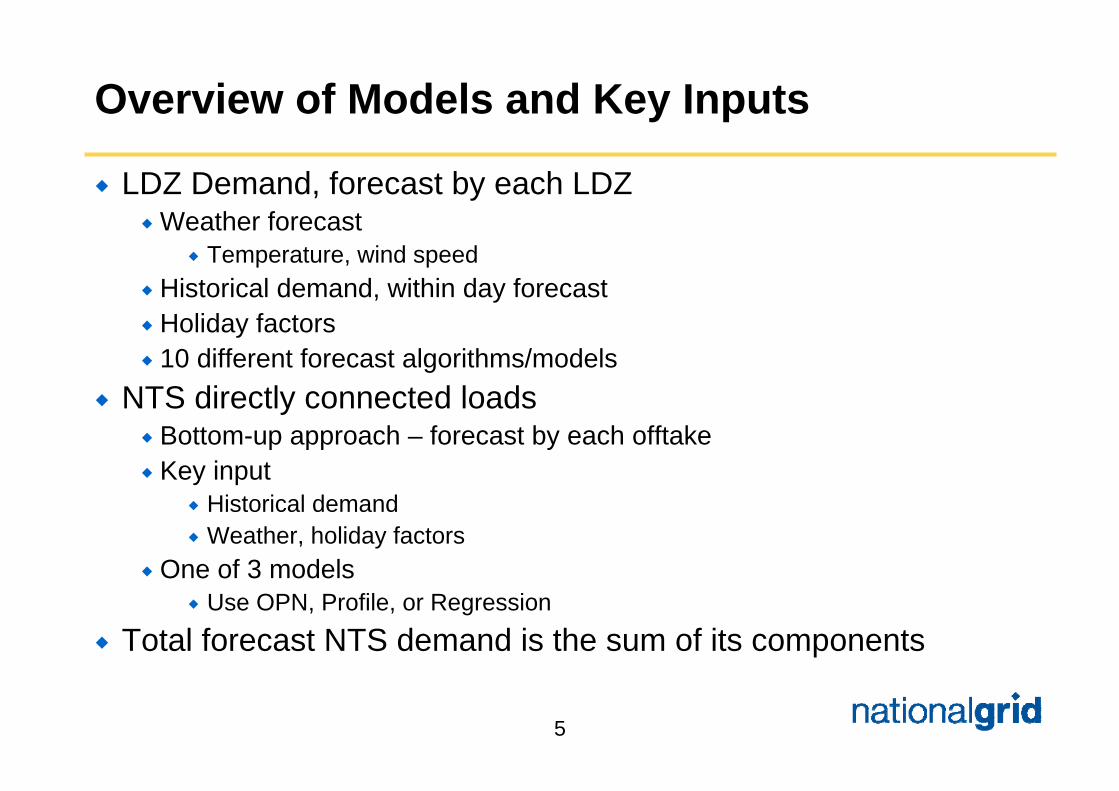
Overview of Models and Key Inputs
LDZ Demand, forecast by each LDZWeather forecast
Temperature, wind speedHistorical demand, within day forecastHoliday factors10 different forecast algorithms/models
NTS directly connected loadsBottom-up approach – forecast by each offtakeKey input
Historical demandWeather, holiday factors
One of 3 modelsUse OPN, Profile, or Regression
Total forecast NTS demand is the sum of its components

6
New Forecasting Processes Introduced From October 2006
On 1 October 2006, a demand forecast incentive was placed on NGG to produce as accurate a forecast as possible for UNC D-1 14:00 NTS demandDue to short time scales and long lead time in model development, it was not possible for us to introduce new models for this winterWe invested in and introduced new forecasting processes
Enhanced forecasting support functionControl room trainingRisk management frameworkProvision of additional information to Control RoomDetailed performance monitoring
Development and implementation of UNC Mod 100/123Identified a program of model development and enhancements

7
Revised Forecasting Process
ObjectiveEnhancement to the existing modelsFeed back emerging trend into the forecastManage “tight” days/periodDevelop and promote best practice
Weather Trend between model output and change in weather forecastInformation not in models, e.g cloud cover, precipitation
PricesNot used by modelsGas prices in the UK and Zeebrugge
Impact on IUK flows, especially whether it would flip overSpark spread, dark spread
Power station demandStorage injection
Weekend/week day effects, holidays, Christmas/new year, shoulder monthsManage cold snaps
8
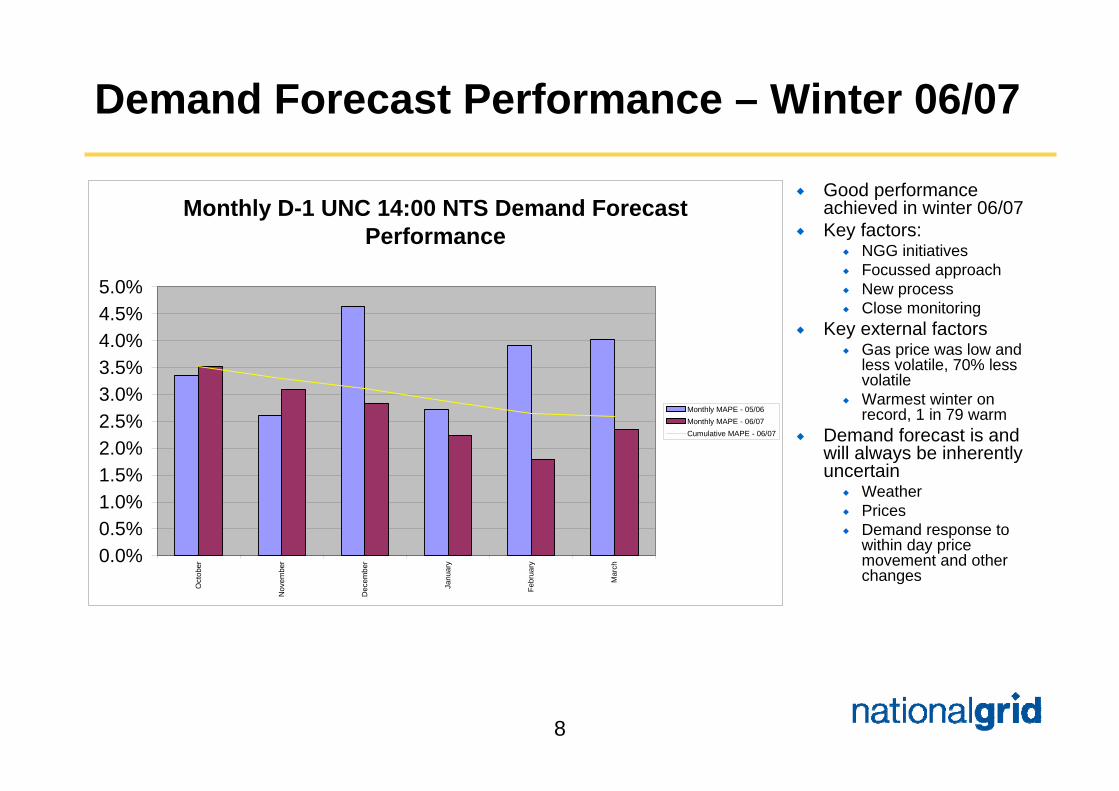
Demand Forecast Performance – Winter 06/07
Good performance achieved in winter 06/07Key factors:
NGG initiativesFocussed approachNew processClose monitoring
Key external factorsGas price was low and less volatile, 70% less volatileWarmest winter on record, 1 in 79 warm
Demand forecast is and will always be inherently uncertain
Weather PricesDemand response to within day price movement and other changes
Monthly D-1 UNC 14:00 NTS Demand Forecast Performance
0.0%0.5%1.0%1.5%2.0%2.5%3.0%3.5%4.0%4.5%5.0%
Oct
ober
Nov
embe
r
Dec
embe
r
Janu
ary
Febr
uary
Mar
ch
Monthly MAPE - 05/06Monthly MAPE - 06/07Cumulative MAPE - 06/07

9
All Published Demand Forecast Performance –Winter 06/07
Average error across all timescales is about 3%In comparison, the shipper end of day imbalance is 1.5%
NTS Demand Forecast Performance - Winter 06/07
0.00%1.00%
2.00%
3.00%
4.00%
5.00%
6.00%
7.00%D
-7
D-6
D-5
D-4
D-3
D-2
D-1
13:
00hr
s
D-1
16:
00hr
s
D-1
00:
00hr
s
D 1
0:00
hrs
D 1
3:00
hrs
D 1
6:00
hrs
D 2
1:00
hrs
D 0
0:00
hrs

10
Treatment of Demand Side Response In the Forecast
No demand side response is explicitly included in the forecast because
We do not forecast gas pricesThe circular relationship between demand side response and price means that the inclusion of demand side response may result in a lower price which in turn may not trigger the level of estimated responseRelationship between demand side response and prices is complex and difficult, if not impossible, to determine
Any underlying trend in demand changes in response to price movement is implicitly included models in the forecast as models are trained every week

11
Publication of Additional Information Relating to Demand Forecast
NGG publishes a statement on how medium to long term demand forecast is produced on its websiteA similar statement on the methodology used to forecast short term NTS demand could be published including general description of
Forecasting processKey inputsModels used
However it should be recognised that the forecasting process, especially forecast models, is subject to change from time to time as NGG seeks to achieve continuous improvement on demand forecast performance