appendix d - electric energy and demand forecast · appendix d - electric energy and demand...
TRANSCRIPT
APPENDIX D - ELECTRIC ENERGY AND DEMAND FORECAST
• Current Load Forecast Tables: This section contains tables of the base case energy sales and
coincident peak demand forecasts for each year within the planning period, 2016-2035:
− Annual sales of energy and coincident peak demand on a system-wide basis
− Annual sales of energy and coincident peak demand by customer class
− Annual sales of energy and coincident peak demand disaggregated between Commission jurisdictional sales, FERC jurisdictional sales, and sales subject to the jurisdiction of other states
− Annual coincident peak system losses and the allocation of such losses to the transmission and distribution components of the system
− Weather normalization adjustments
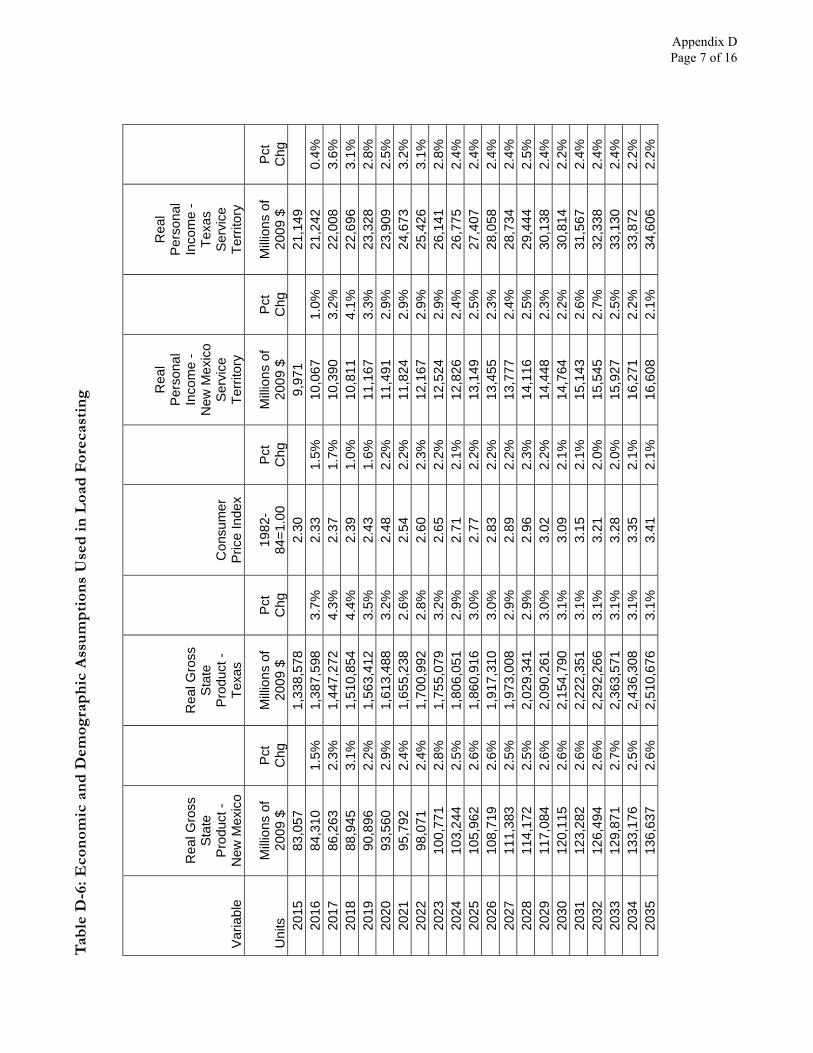
− Assumptions for economic and demographic factors relied on in load forecasting
− Expected capacity and energy impacts of existing and proposed demand-side resources
Appendix D Page 1 of 16
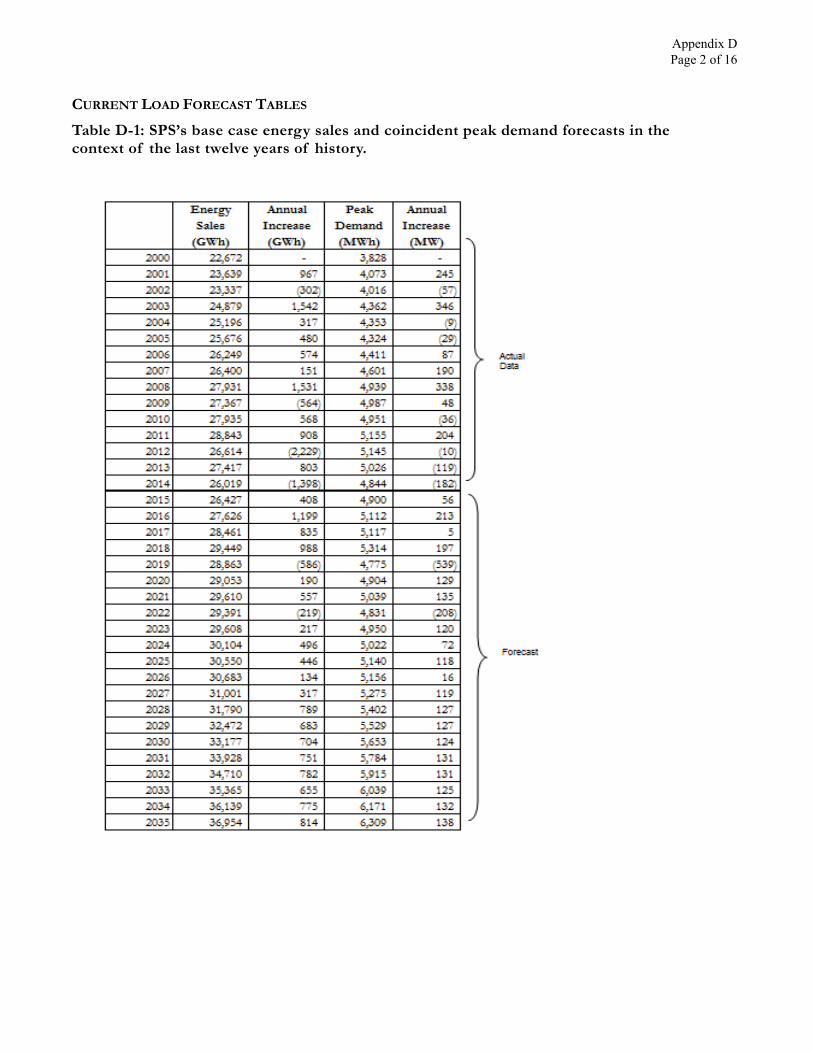
CURRENT LOAD FORECAST TABLES
Table D-1: SPS’s base case energy sales and coincident peak demand forecasts in the context of the last twelve years of history.
Appendix D Page 2 of 16
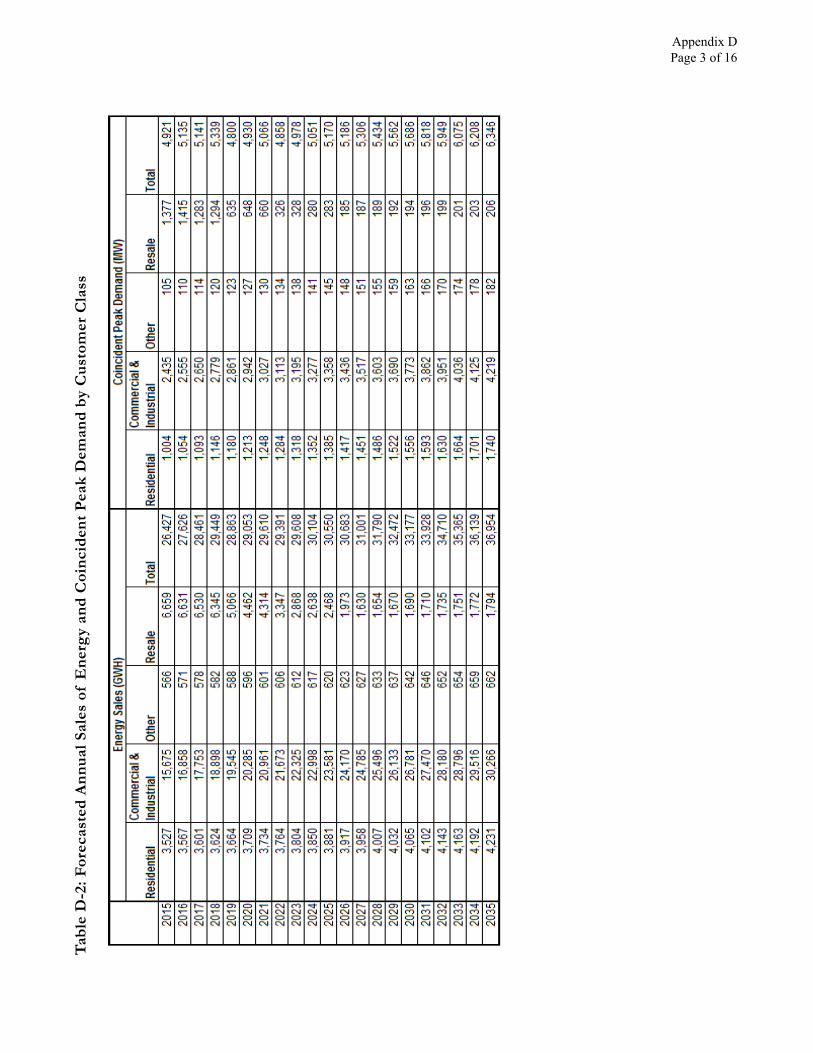
Tabl
e D
-2: F
orec
aste
d A
nnua
l Sal
es o
f E
nerg
y an
d C
oinc
iden
t Pea
k D
eman
d by
Cus
tom
er C
lass
Appendix D Page 3 of 16
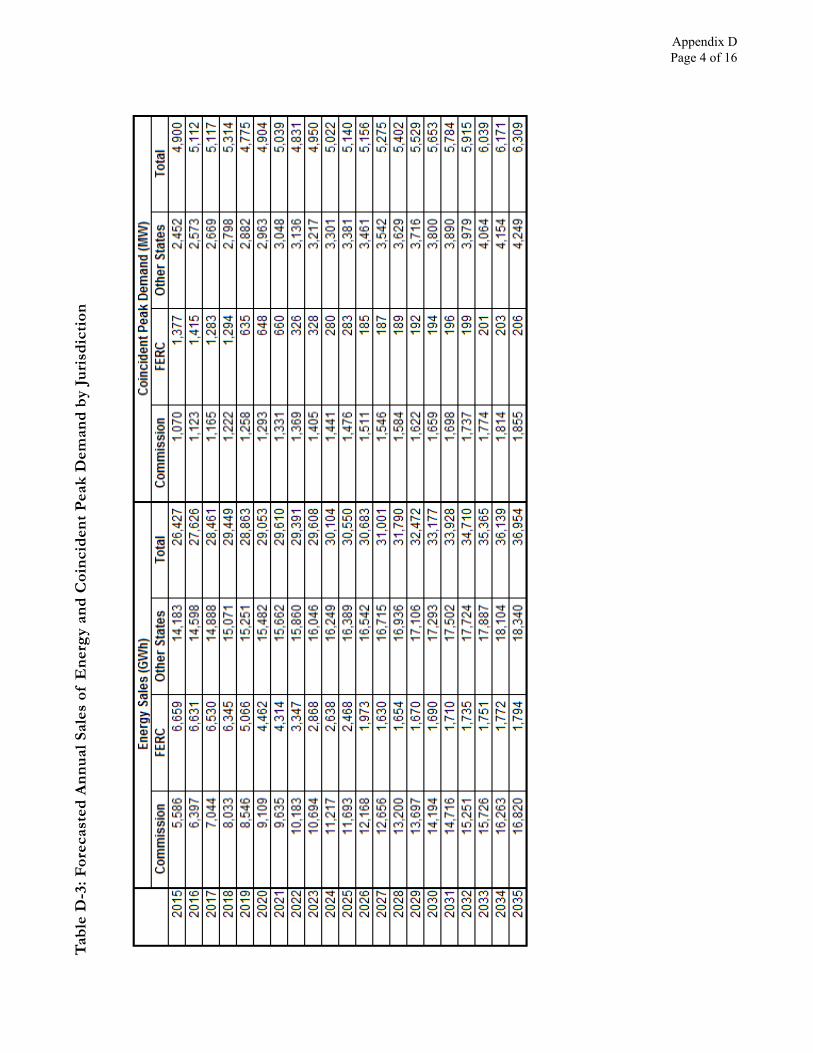
Tabl
e D
-3: F
orec
aste
d A
nnua
l Sal
es o
f E
nerg
y an
d C
oinc
iden
t Pea
k D
eman
d by
Jur
isdi
ctio
n
Appendix D Page 4 of 16
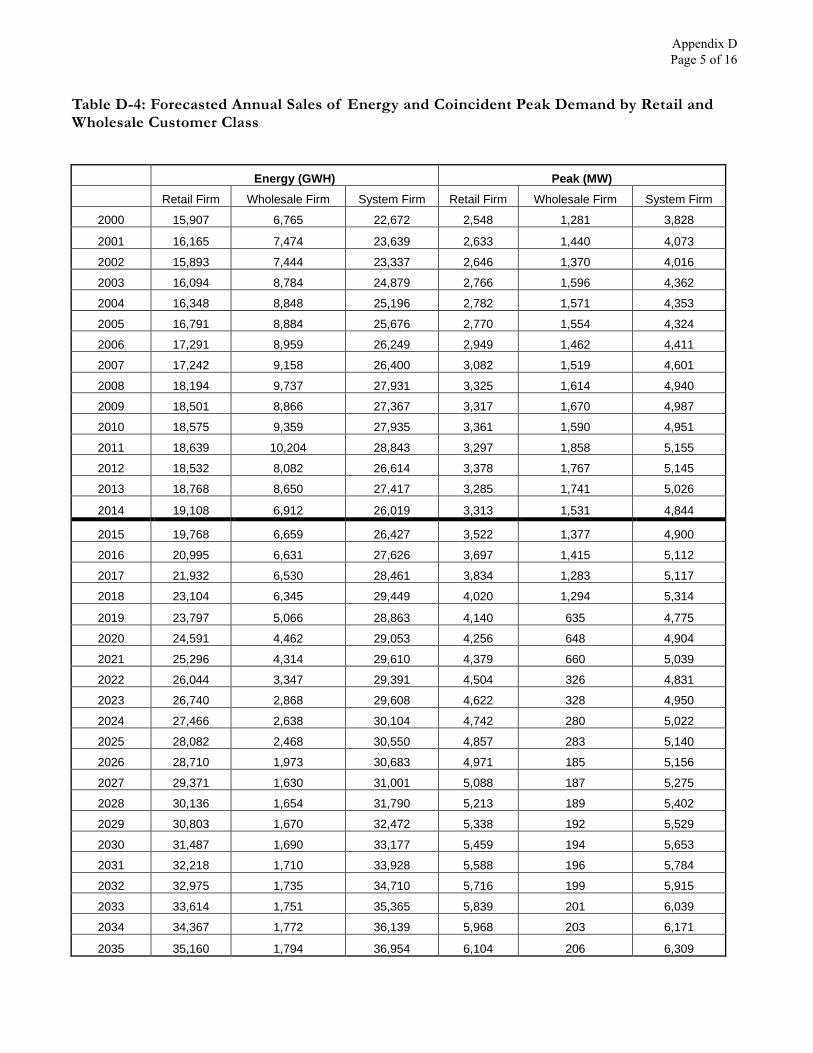
Table D-4: Forecasted Annual Sales of Energy and Coincident Peak Demand by Retail and Wholesale Customer Class
Energy (GWH) Peak (MW) Retail Firm Wholesale Firm System Firm Retail Firm Wholesale Firm System Firm
2000 15,907 6,765 22,672 2,548 1,281 3,828
2001 16,165 7,474 23,639 2,633 1,440 4,073
2002 15,893 7,444 23,337 2,646 1,370 4,016
2003 16,094 8,784 24,879 2,766 1,596 4,362
2004 16,348 8,848 25,196 2,782 1,571 4,353
2005 16,791 8,884 25,676 2,770 1,554 4,324
2006 17,291 8,959 26,249 2,949 1,462 4,411
2007 17,242 9,158 26,400 3,082 1,519 4,601
2008 18,194 9,737 27,931 3,325 1,614 4,940
2009 18,501 8,866 27,367 3,317 1,670 4,987
2010 18,575 9,359 27,935 3,361 1,590 4,951
2011 18,639 10,204 28,843 3,297 1,858 5,155
2012 18,532 8,082 26,614 3,378 1,767 5,145
2013 18,768 8,650 27,417 3,285 1,741 5,026
2014 19,108 6,912 26,019 3,313 1,531 4,844
2015 19,768 6,659 26,427 3,522 1,377 4,900
2016 20,995 6,631 27,626 3,697 1,415 5,112
2017 21,932 6,530 28,461 3,834 1,283 5,117
2018 23,104 6,345 29,449 4,020 1,294 5,314
2019 23,797 5,066 28,863 4,140 635 4,775
2020 24,591 4,462 29,053 4,256 648 4,904
2021 25,296 4,314 29,610 4,379 660 5,039
2022 26,044 3,347 29,391 4,504 326 4,831
2023 26,740 2,868 29,608 4,622 328 4,950
2024 27,466 2,638 30,104 4,742 280 5,022
2025 28,082 2,468 30,550 4,857 283 5,140
2026 28,710 1,973 30,683 4,971 185 5,156
2027 29,371 1,630 31,001 5,088 187 5,275
2028 30,136 1,654 31,790 5,213 189 5,402
2029 30,803 1,670 32,472 5,338 192 5,529
2030 31,487 1,690 33,177 5,459 194 5,653
2031 32,218 1,710 33,928 5,588 196 5,784
2032 32,975 1,735 34,710 5,716 199 5,915
2033 33,614 1,751 35,365 5,839 201 6,039
2034 34,367 1,772 36,139 5,968 203 6,171
2035 35,160 1,794 36,954 6,104 206 6,309
Appendix D Page 5 of 16
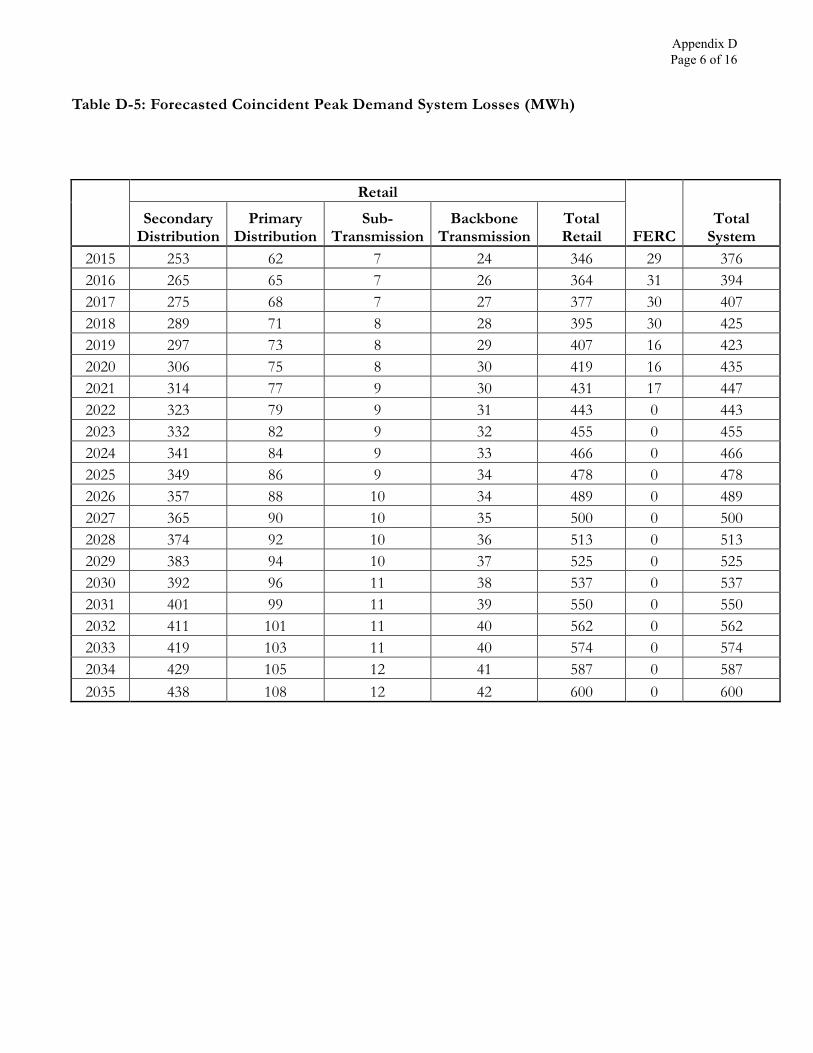
Table D-5: Forecasted Coincident Peak Demand System Losses (MWh)
Retail
FERC Total
System Secondary
Distribution Primary
Distribution Sub-
Transmission Backbone
Transmission Total Retail
2015 253 62 7 24 346 29 376 2016 265 65 7 26 364 31 394 2017 275 68 7 27 377 30 407 2018 289 71 8 28 395 30 425 2019 297 73 8 29 407 16 423 2020 306 75 8 30 419 16 435 2021 314 77 9 30 431 17 447 2022 323 79 9 31 443 0 443 2023 332 82 9 32 455 0 455 2024 341 84 9 33 466 0 466 2025 349 86 9 34 478 0 478 2026 357 88 10 34 489 0 489 2027 365 90 10 35 500 0 500 2028 374 92 10 36 513 0 513 2029 383 94 10 37 525 0 525 2030 392 96 11 38 537 0 537 2031 401 99 11 39 550 0 550 2032 411 101 11 40 562 0 562 2033 419 103 11 40 574 0 574 2034 429 105 12 41 587 0 587 2035 438 108 12 42 600 0 600
Appendix D Page 6 of 16
Tabl
e D
-6: E
cono
mic
and
Dem
ogra
phic
Ass
umpt
ions
Use
d in
Loa
d Fo
reca
stin
g
Varia
ble
Rea
l Gro
ss
Stat
e Pr
oduc
t -
New
Mex
ico
Rea
l Gro
ss
Stat
e Pr
oduc
t -
Texa
s
Con
sum
er
Pric
e In
dex
Rea
l Pe
rson
al
Inco
me
- N
ew M
exic
o Se
rvic
e Te
rrito
ry
Rea
l Pe
rson
al
Inco
me
- Te
xas
Serv
ice
Terri
tory
Uni
ts
Milli
ons
of
2009
$
Pct
Chg
M
illion
s of
20
09 $
Pc
t C
hg
1982
-84
=1.0
0 Pc
t C
hg
Milli
ons
of
2009
$
Pct
Chg
M
illion
s of
20
09 $
Pc
t C
hg
2015
83
,057
1,33
8,57
8
2.30
9,97
1
21,1
49
20
16
84,3
10
1.5%
1,
387,
598
3.7%
2.
33
1.5%
10
,067
1.
0%
21,2
42
0.4%
20
17
86,2
63
2.3%
1,
447,
272
4.3%
2.
37
1.7%
10
,390
3.
2%
22,0
08
3.6%
20
18
88,9
45
3.1%
1,
510,
854
4.4%
2.
39
1.0%
10
,811
4.
1%
22,6
96
3.1%
20
19
90,8
96
2.2%
1,
563,
412
3.5%
2.
43
1.6%
11
,167
3.
3%
23,3
28
2.8%
20
20
93,5
60
2.9%
1,
613,
488
3.2%
2.
48
2.2%
11
,491
2.
9%
23,9
09
2.5%
20
21
95,7
92
2.4%
1,
655,
238
2.6%
2.
54
2.2%
11
,824
2.
9%
24,6
73
3.2%
20
22
98,0
71
2.4%
1,
700,
992
2.8%
2.
60
2.3%
12
,167
2.
9%
25,4
26
3.1%
20
23
100,
771
2.8%
1,
755,
079
3.2%
2.
65
2.2%
12
,524
2.
9%
26,1
41
2.8%
20
24
103,
244
2.5%
1,
806,
051
2.9%
2.
71
2.1%
12
,826
2.
4%
26,7
75
2.4%
20
25
105,
962
2.6%
1,
860,
916
3.0%
2.
77
2.2%
13
,149
2.
5%
27,4
07
2.4%
20
26
108,
719
2.6%
1,
917,
310
3.0%
2.
83
2.2%
13
,455
2.
3%
28,0
58
2.4%
20
27
111,
383
2.5%
1,
973,
008
2.9%
2.
89
2.2%
13
,777
2.
4%
28,7
34
2.4%
20
28
114,
172
2.5%
2,
029,
341
2.9%
2.
96
2.3%
14
,116
2.
5%
29,4
44
2.5%
20
29
117,
084
2.6%
2,
090,
261
3.0%
3.
02
2.2%
14
,448
2.
3%
30,1
38
2.4%
20
30
120,
115
2.6%
2,
154,
790
3.1%
3.
09
2.1%
14
,764
2.
2%
30,8
14
2.2%
20
31
123,
282
2.6%
2,
222,
351
3.1%
3.
15
2.1%
15
,143
2.
6%
31,5
67
2.4%
20
32
126,
494
2.6%
2,
292,
266
3.1%
3.
21
2.0%
15
,545
2.
7%
32,3
38
2.4%
20
33
129,
871
2.7%
2,
363,
571
3.1%
3.
28
2.0%
15
,927
2.
5%
33,1
30
2.4%
20
34
133,
176
2.5%
2,
436,
308
3.1%
3.
35
2.1%
16
,271
2.
2%
33,8
72
2.2%
20
35
136,
637
2.6%
2,
510,
676
3.1%
3.
41
2.1%
16
,608
2.
1%
34,6
06
2.2%
Appendix D Page 7 of 16
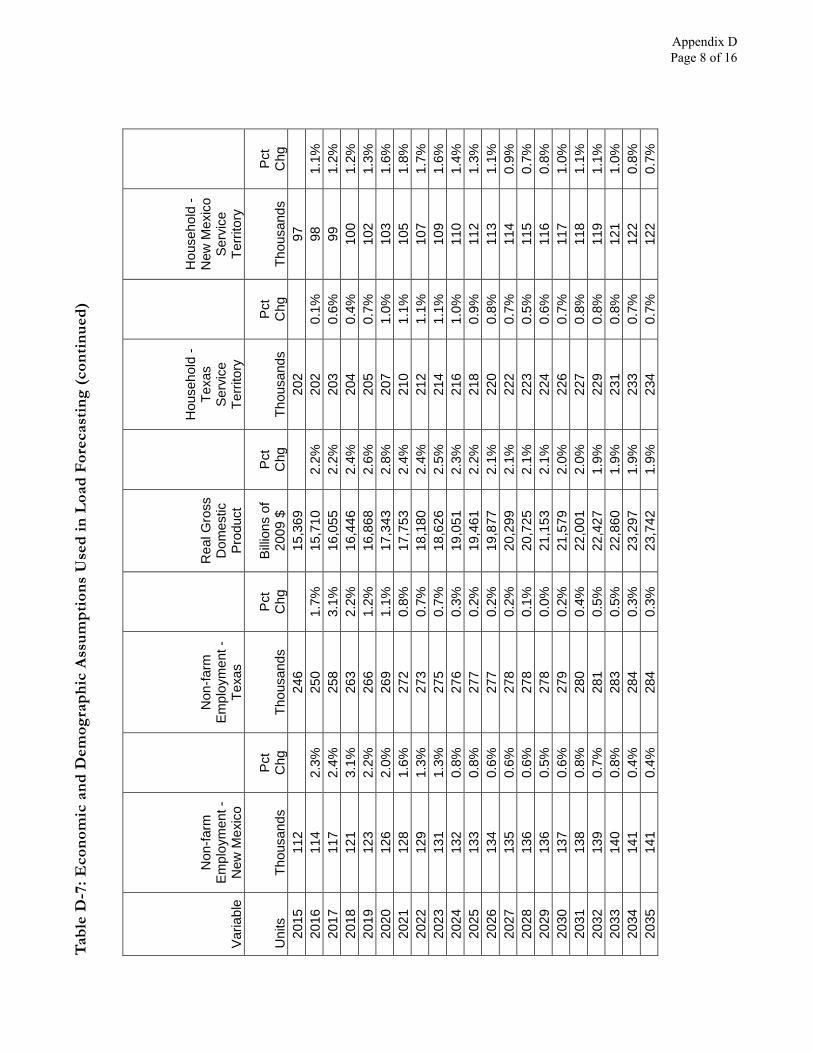
Tabl
e D
-7: E
cono
mic
and
Dem
ogra
phic
Ass
umpt
ions
Use
d in
Loa
d Fo
reca
stin
g (c
ontin
ued)
Varia
ble
Non
-farm
Em
ploy
men
t -
New
Mex
ico
Non
-farm
Em
ploy
men
t -
Texa
s
Rea
l Gro
ss
Dom
estic
Pr
oduc
t
Hou
seho
ld -
Texa
s Se
rvic
e Te
rrito
ry
Hou
seho
ld -
New
Mex
ico
Serv
ice
Terri
tory
Uni
ts
Thou
sand
s Pc
t C
hg
Thou
sand
s Pc
t C
hg
Billio
ns o
f 20
09 $
Pc
t C
hg
Thou
sand
s Pc
t C
hg
Thou
sand
s Pc
t C
hg
2015
11
2
246
15
,369
202
97
2016
11
4 2.
3%
250
1.7%
15
,710
2.
2%
202
0.1%
98
1.
1%
2017
11
7 2.
4%
258
3.1%
16
,055
2.
2%
203
0.6%
99
1.
2%
2018
12
1 3.
1%
263
2.2%
16
,446
2.
4%
204
0.4%
10
0 1.
2%
2019
12
3 2.
2%
266
1.2%
16
,868
2.
6%
205
0.7%
10
2 1.
3%
2020
12
6 2.
0%
269
1.1%
17
,343
2.
8%
207
1.0%
10
3 1.
6%
2021
12
8 1.
6%
272
0.8%
17
,753
2.
4%
210
1.1%
10
5 1.
8%
2022
12
9 1.
3%
273
0.7%
18
,180
2.
4%
212
1.1%
10
7 1.
7%
2023
13
1 1.
3%
275
0.7%
18
,626
2.
5%
214
1.1%
10
9 1.
6%
2024
13
2 0.
8%
276
0.3%
19
,051
2.
3%
216
1.0%
11
0 1.
4%
2025
13
3 0.
8%
277
0.2%
19
,461
2.
2%
218
0.9%
11
2 1.
3%
2026
13
4 0.
6%
277
0.2%
19
,877
2.
1%
220
0.8%
11
3 1.
1%
2027
13
5 0.
6%
278
0.2%
20
,299
2.
1%
222
0.7%
11
4 0.
9%
2028
13
6 0.
6%
278
0.1%
20
,725
2.
1%
223
0.5%
11
5 0.
7%
2029
13
6 0.
5%
278
0.0%
21
,153
2.
1%
224
0.6%
11
6 0.
8%
2030
13
7 0.
6%
279
0.2%
21
,579
2.
0%
226
0.7%
11
7 1.
0%
2031
13
8 0.
8%
280
0.4%
22
,001
2.
0%
227
0.8%
11
8 1.
1%
2032
13
9 0.
7%
281
0.5%
22
,427
1.
9%
229
0.8%
11
9 1.
1%
2033
14
0 0.
8%
283
0.5%
22
,860
1.
9%
231
0.8%
12
1 1.
0%
2034
14
1 0.
4%
284
0.3%
23
,297
1.
9%
233
0.7%
12
2 0.
8%
2035
14
1 0.
4%
284
0.3%
23
,742
1.
9%
234
0.7%
12
2 0.
7%
Appendix D Page 8 of 16
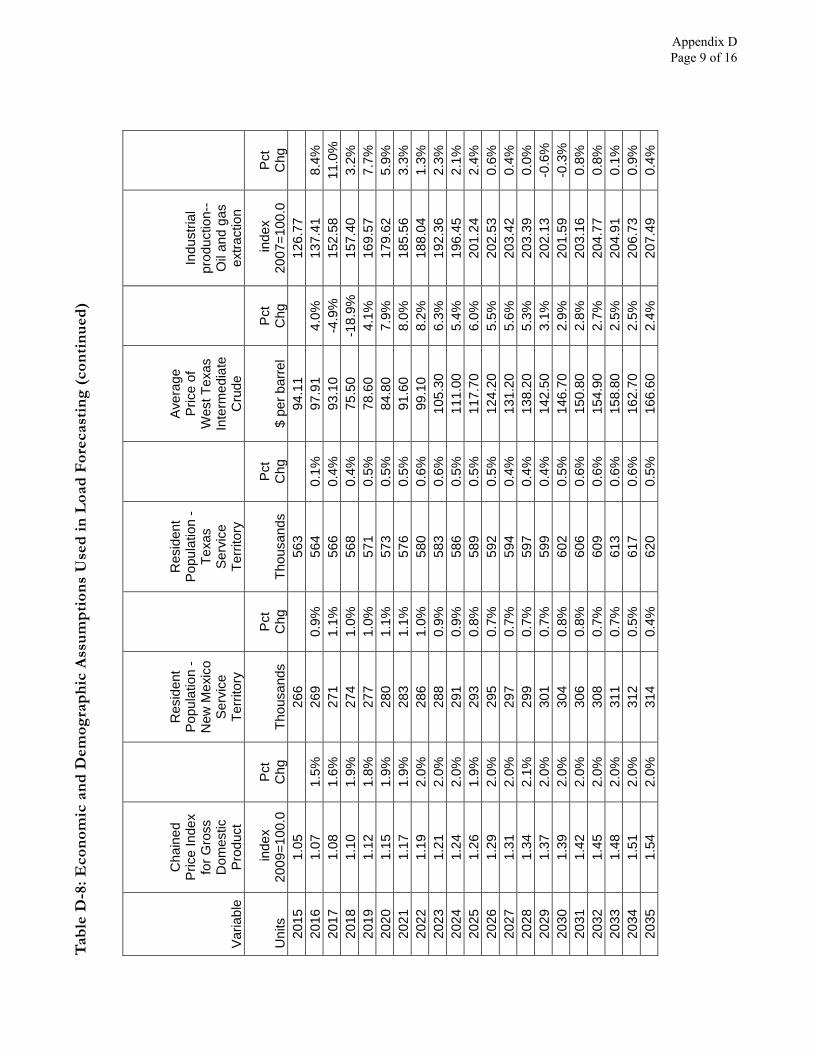
Tabl
e D
-8: E
cono
mic
and
Dem
ogra
phic
Ass
umpt
ions
Use
d in
Loa
d Fo
reca
stin
g (c
ontin
ued)
Varia
ble
Cha
ined
Pr
ice
Inde
x fo
r Gro
ss
Dom
estic
Pr
oduc
t
Res
iden
t Po
pula
tion
- N
ew M
exic
o Se
rvic
e Te
rrito
ry
Res
iden
t Po
pula
tion
- Te
xas
Serv
ice
Terri
tory
Aver
age
Pric
e of
W
est T
exas
In
term
edia
te
Cru
de
Indu
stria
l pr
oduc
tion-
-O
il an
d ga
s ex
tract
ion
Uni
ts
inde
x 20
09=1
00.0
Pc
t C
hg
Thou
sand
s Pc
t C
hg
Thou
sand
s Pc
t C
hg
$ pe
r bar
rel
Pct
Chg
in
dex
2007
=100
.0
Pct
Chg
20
15
1.05
266
56
3
94.1
1
12
6.77
2016
1.
07
1.5%
26
9 0.
9%
564
0.1%
97
.91
4.
0%
137.
41
8.4%
20
17
1.08
1.
6%
271
1.1%
56
6 0.
4%
93.1
0
-4.9
%
152.
58
11.0
%
2018
1.
10
1.9%
27
4 1.
0%
568
0.4%
75
.50
-1
8.9%
15
7.40
3.
2%
2019
1.
12
1.8%
27
7 1.
0%
571
0.5%
78
.60
4.
1%
169.
57
7.7%
20
20
1.15
1.
9%
280
1.1%
57
3 0.
5%
84.8
0
7.9%
17
9.62
5.
9%
2021
1.
17
1.9%
28
3 1.
1%
576
0.5%
91
.60
8.
0%
185.
56
3.3%
20
22
1.19
2.
0%
286
1.0%
58
0 0.
6%
99.1
0
8.2%
18
8.04
1.
3%
2023
1.
21
2.0%
28
8 0.
9%
583
0.6%
10
5.30
6.
3%
192.
36
2.3%
20
24
1.24
2.
0%
291
0.9%
58
6 0.
5%
111.
00
5.4%
19
6.45
2.
1%
2025
1.
26
1.9%
29
3 0.
8%
589
0.5%
11
7.70
6.
0%
201.
24
2.4%
20
26
1.29
2.
0%
295
0.7%
59
2 0.
5%
124.
20
5.5%
20
2.53
0.
6%
2027
1.
31
2.0%
29
7 0.
7%
594
0.4%
13
1.20
5.
6%
203.
42
0.4%
20
28
1.34
2.
1%
299
0.7%
59
7 0.
4%
138.
20
5.3%
20
3.39
0.
0%
2029
1.
37
2.0%
30
1 0.
7%
599
0.4%
14
2.50
3.
1%
202.
13
-0.6
%
2030
1.
39
2.0%
30
4 0.
8%
602
0.5%
14
6.70
2.
9%
201.
59
-0.3
%
2031
1.
42
2.0%
30
6 0.
8%
606
0.6%
15
0.80
2.
8%
203.
16
0.8%
20
32
1.45
2.
0%
308
0.7%
60
9 0.
6%
154.
90
2.7%
20
4.77
0.
8%
2033
1.
48
2.0%
31
1 0.
7%
613
0.6%
15
8.80
2.
5%
204.
91
0.1%
20
34
1.51
2.
0%
312
0.5%
61
7 0.
6%
162.
70
2.5%
20
6.73
0.
9%
2035
1.
54
2.0%
31
4 0.
4%
620
0.5%
16
6.60
2.
4%
207.
49
0.4%
Appendix D Page 9 of 16
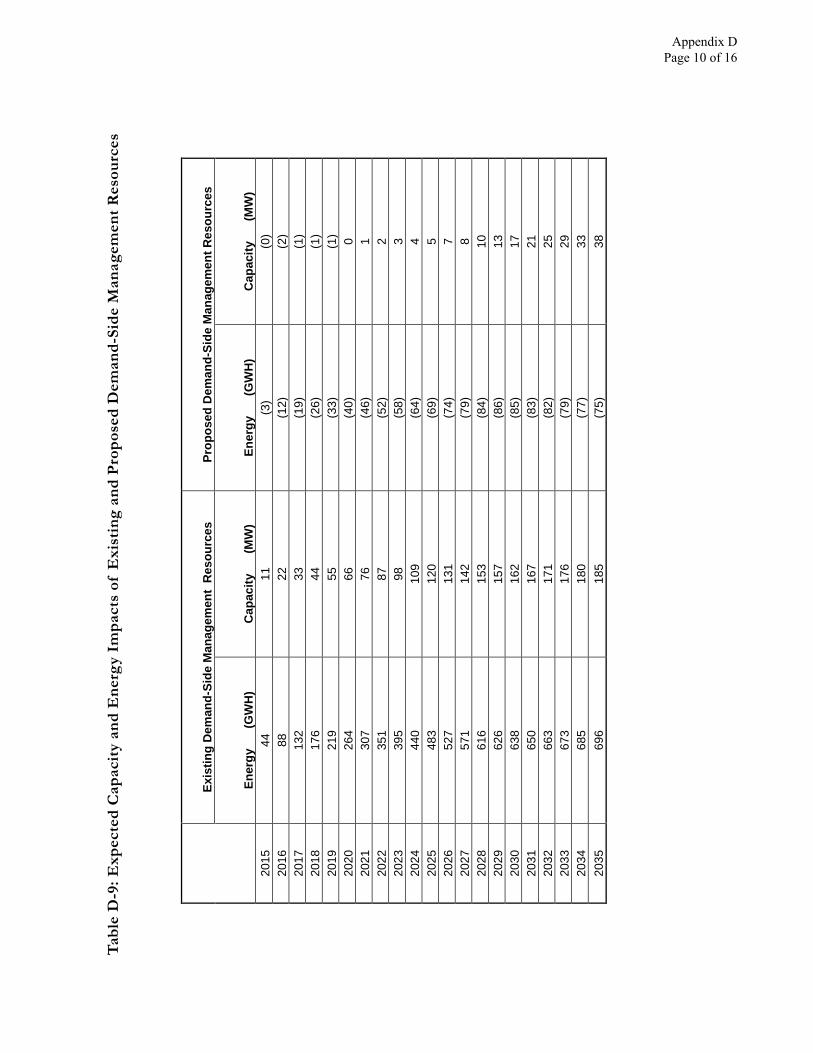
Tabl
e D
-9: E
xpec
ted
Cap
acity
and
Ene
rgy
Impa
cts
of E
xist
ing
and
Prop
osed
Dem
and-
Side
Man
agem
ent R
esou
rces
Exis
ting
Dem
and-
Side
Man
agem
ent
Res
ourc
es
Prop
osed
Dem
and-
Side
Man
agem
ent R
esou
rces
Ener
gy
(G
WH
) C
apac
ity
(M
W)
Ener
gy
(G
WH
) C
apac
ity
(M
W)
2015
44
11
(3
) (0
) 20
16
88
22
(12)
(2
) 20
17
132
33
(1
9)
(1)
2018
17
6
44
(26)
(1
) 20
19
219
55
(3
3)
(1)
2020
26
4
66
(40)
0
20
21
307
76
(4
6)
1
2022
35
1
87
(52)
2
20
23
395
98
(5
8)
3
2024
44
0
109
(6
4)
4
2025
48
3
120
(6
9)
5
2026
52
7
131
(7
4)
7
2027
57
1
142
(7
9)
8
2028
61
6
153
(8
4)
10
2029
62
6
157
(8
6)
13
2030
63
8
162
(8
5)
17
2031
65
0
167
(8
3)
21
2032
66
3
171
(8
2)
25
2033
67
3
176
(7
9)
29
2034
68
5
180
(7
7)
33
2035
69
6
185
(7
5)
38
Appendix D Page 10 of 16
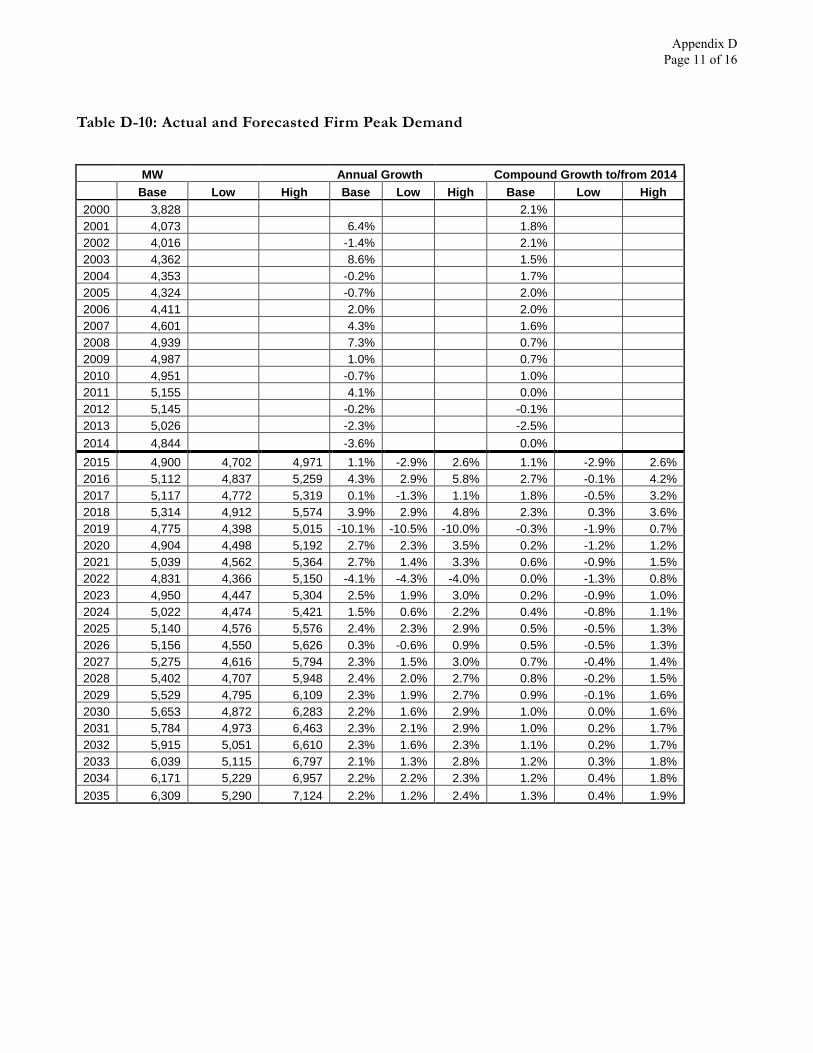
Table D-10: Actual and Forecasted Firm Peak Demand
MW Annual Growth Compound Growth to/from 2014 Base Low High Base Low High Base Low High 2000 3,828 2.1% 2001 4,073 6.4% 1.8% 2002 4,016 -1.4% 2.1% 2003 4,362 8.6% 1.5% 2004 4,353 -0.2% 1.7% 2005 4,324 -0.7% 2.0% 2006 4,411 2.0% 2.0% 2007 4,601 4.3% 1.6% 2008 4,939 7.3% 0.7% 2009 4,987 1.0% 0.7% 2010 4,951 -0.7% 1.0% 2011 5,155 4.1% 0.0% 2012 5,145 -0.2% -0.1% 2013 5,026 -2.3% -2.5% 2014 4,844 -3.6% 0.0% 2015 4,900 4,702 4,971 1.1% -2.9% 2.6% 1.1% -2.9% 2.6% 2016 5,112 4,837 5,259 4.3% 2.9% 5.8% 2.7% -0.1% 4.2% 2017 5,117 4,772 5,319 0.1% -1.3% 1.1% 1.8% -0.5% 3.2% 2018 5,314 4,912 5,574 3.9% 2.9% 4.8% 2.3% 0.3% 3.6% 2019 4,775 4,398 5,015 -10.1% -10.5% -10.0% -0.3% -1.9% 0.7% 2020 4,904 4,498 5,192 2.7% 2.3% 3.5% 0.2% -1.2% 1.2% 2021 5,039 4,562 5,364 2.7% 1.4% 3.3% 0.6% -0.9% 1.5% 2022 4,831 4,366 5,150 -4.1% -4.3% -4.0% 0.0% -1.3% 0.8% 2023 4,950 4,447 5,304 2.5% 1.9% 3.0% 0.2% -0.9% 1.0% 2024 5,022 4,474 5,421 1.5% 0.6% 2.2% 0.4% -0.8% 1.1% 2025 5,140 4,576 5,576 2.4% 2.3% 2.9% 0.5% -0.5% 1.3% 2026 5,156 4,550 5,626 0.3% -0.6% 0.9% 0.5% -0.5% 1.3% 2027 5,275 4,616 5,794 2.3% 1.5% 3.0% 0.7% -0.4% 1.4% 2028 5,402 4,707 5,948 2.4% 2.0% 2.7% 0.8% -0.2% 1.5% 2029 5,529 4,795 6,109 2.3% 1.9% 2.7% 0.9% -0.1% 1.6% 2030 5,653 4,872 6,283 2.2% 1.6% 2.9% 1.0% 0.0% 1.6% 2031 5,784 4,973 6,463 2.3% 2.1% 2.9% 1.0% 0.2% 1.7% 2032 5,915 5,051 6,610 2.3% 1.6% 2.3% 1.1% 0.2% 1.7% 2033 6,039 5,115 6,797 2.1% 1.3% 2.8% 1.2% 0.3% 1.8% 2034 6,171 5,229 6,957 2.2% 2.2% 2.3% 1.2% 0.4% 1.8% 2035 6,309 5,290 7,124 2.2% 1.2% 2.4% 1.3% 0.4% 1.9%
Appendix D Page 11 of 16
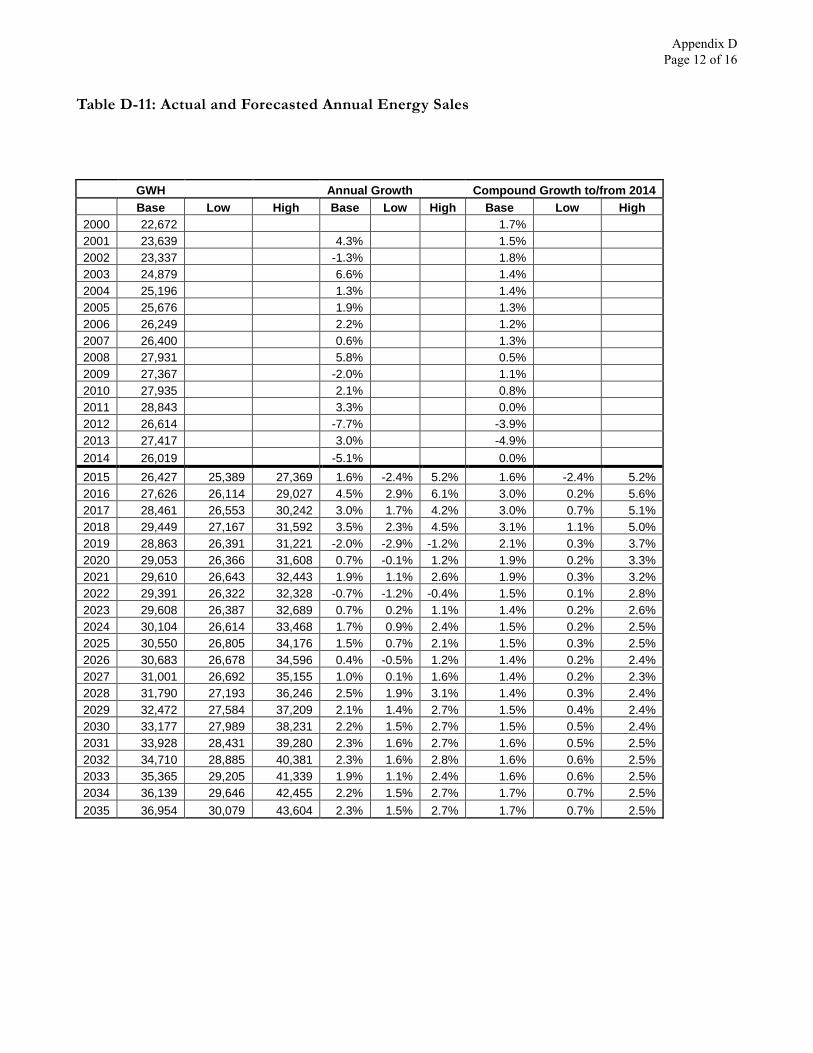
Table D-11: Actual and Forecasted Annual Energy Sales
GWH Annual Growth Compound Growth to/from 2014 Base Low High Base Low High Base Low High
2000 22,672 1.7% 2001 23,639 4.3% 1.5% 2002 23,337 -1.3% 1.8% 2003 24,879 6.6% 1.4% 2004 25,196 1.3% 1.4% 2005 25,676 1.9% 1.3% 2006 26,249 2.2% 1.2% 2007 26,400 0.6% 1.3% 2008 27,931 5.8% 0.5% 2009 27,367 -2.0% 1.1% 2010 27,935 2.1% 0.8% 2011 28,843 3.3% 0.0% 2012 26,614 -7.7% -3.9% 2013 27,417 3.0% -4.9% 2014 26,019 -5.1% 0.0% 2015 26,427 25,389 27,369 1.6% -2.4% 5.2% 1.6% -2.4% 5.2% 2016 27,626 26,114 29,027 4.5% 2.9% 6.1% 3.0% 0.2% 5.6% 2017 28,461 26,553 30,242 3.0% 1.7% 4.2% 3.0% 0.7% 5.1% 2018 29,449 27,167 31,592 3.5% 2.3% 4.5% 3.1% 1.1% 5.0% 2019 28,863 26,391 31,221 -2.0% -2.9% -1.2% 2.1% 0.3% 3.7% 2020 29,053 26,366 31,608 0.7% -0.1% 1.2% 1.9% 0.2% 3.3% 2021 29,610 26,643 32,443 1.9% 1.1% 2.6% 1.9% 0.3% 3.2% 2022 29,391 26,322 32,328 -0.7% -1.2% -0.4% 1.5% 0.1% 2.8% 2023 29,608 26,387 32,689 0.7% 0.2% 1.1% 1.4% 0.2% 2.6% 2024 30,104 26,614 33,468 1.7% 0.9% 2.4% 1.5% 0.2% 2.5% 2025 30,550 26,805 34,176 1.5% 0.7% 2.1% 1.5% 0.3% 2.5% 2026 30,683 26,678 34,596 0.4% -0.5% 1.2% 1.4% 0.2% 2.4% 2027 31,001 26,692 35,155 1.0% 0.1% 1.6% 1.4% 0.2% 2.3% 2028 31,790 27,193 36,246 2.5% 1.9% 3.1% 1.4% 0.3% 2.4% 2029 32,472 27,584 37,209 2.1% 1.4% 2.7% 1.5% 0.4% 2.4% 2030 33,177 27,989 38,231 2.2% 1.5% 2.7% 1.5% 0.5% 2.4% 2031 33,928 28,431 39,280 2.3% 1.6% 2.7% 1.6% 0.5% 2.5% 2032 34,710 28,885 40,381 2.3% 1.6% 2.8% 1.6% 0.6% 2.5% 2033 35,365 29,205 41,339 1.9% 1.1% 2.4% 1.6% 0.6% 2.5% 2034 36,139 29,646 42,455 2.2% 1.5% 2.7% 1.7% 0.7% 2.5% 2035 36,954 30,079 43,604 2.3% 1.5% 2.7% 1.7% 0.7% 2.5%
Appendix D Page 12 of 16
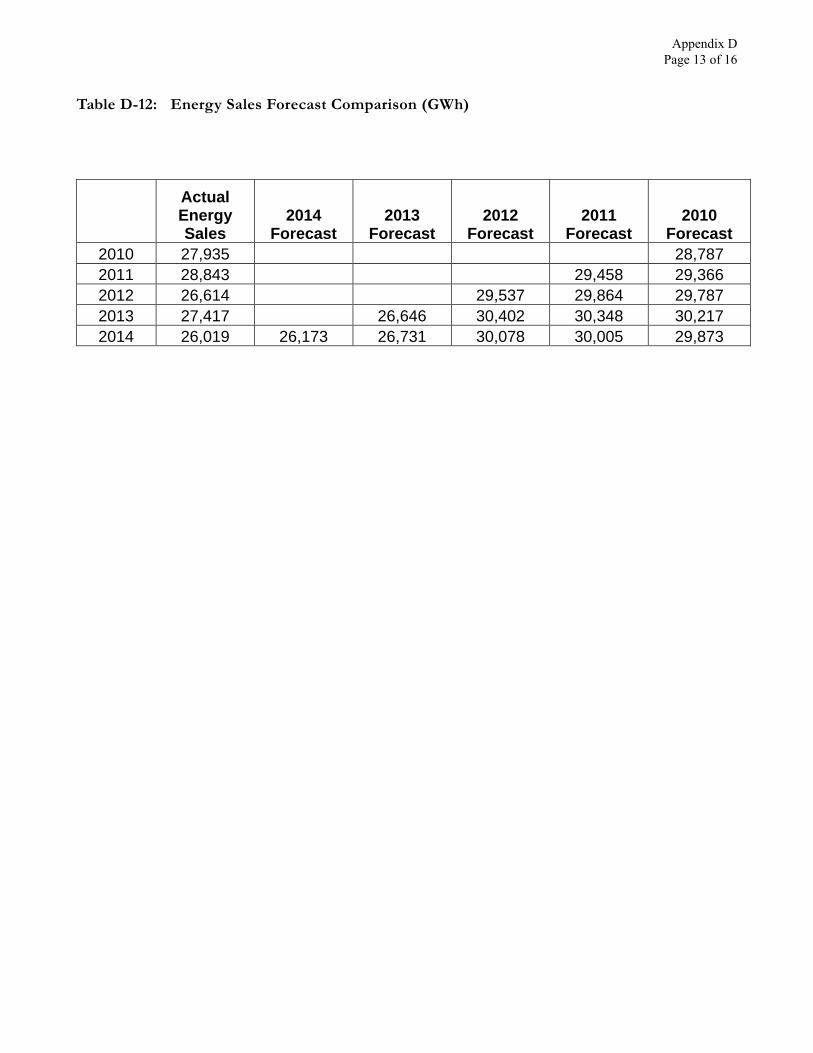
Table D-12: Energy Sales Forecast Comparison (GWh)
Actual Energy Sales
2014 Forecast
2013 Forecast
2012 Forecast
2011 Forecast
2010 Forecast
2010 27,935 28,787 2011 28,843 29,458 29,366 2012 26,614 29,537 29,864 29,787 2013 27,417 26,646 30,402 30,348 30,217 2014 26,019 26,173 26,731 30,078 30,005 29,873
Appendix D Page 13 of 16
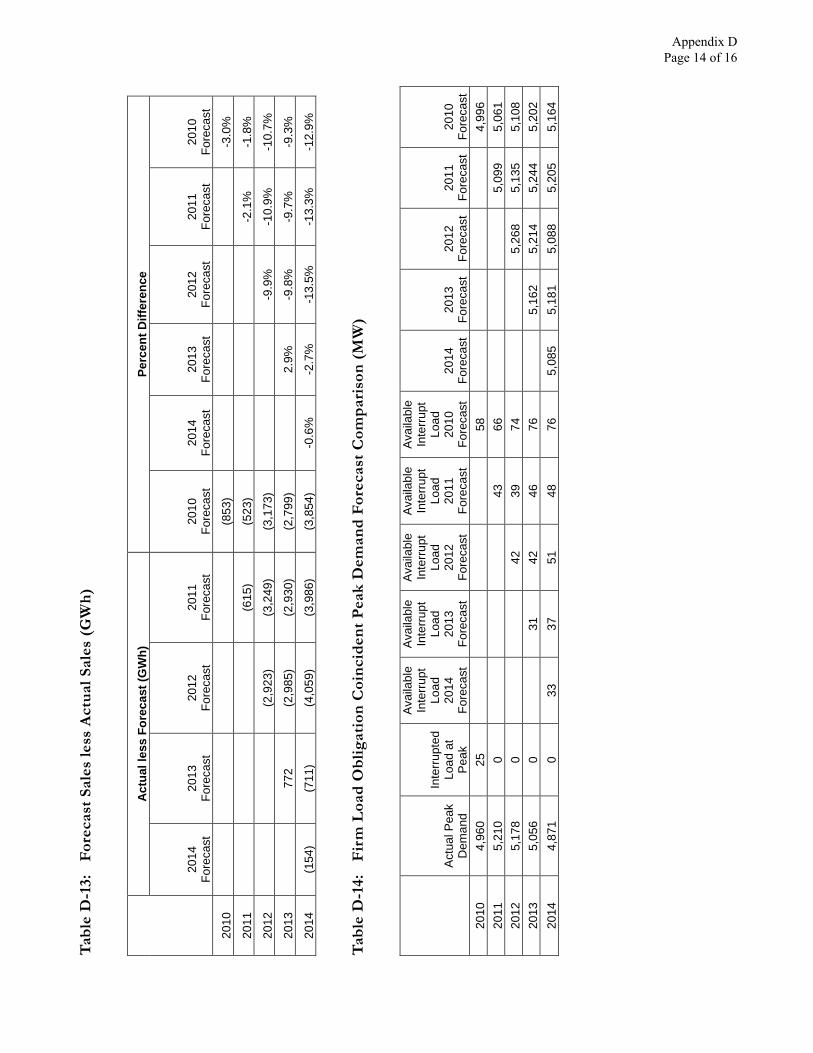
Tabl
e D
-13:
Fo
reca
st S
ales
less
Act
ual S
ales
(G
Wh)
A
ctua
l les
s Fo
reca
st (G
Wh)
Pe
rcen
t Diff
eren
ce
20
14
Fore
cast
20
13
Fore
cast
20
12
Fore
cast
20
11
Fore
cast
20
10
Fore
cast
20
14
Fore
cast
20
13
Fore
cast
20
12
Fore
cast
20
11
Fore
cast
20
10
Fore
cast
2010
(8
53)
-3.0
%
2011
(615
) (5
23)
-2
.1%
-1
.8%
2012
(2
,923
) (3
,249
) (3
,173
)
-9
.9%
-1
0.9%
-1
0.7%
2013
772
(2
,985
) (2
,930
) (2
,799
)
2.9%
-9
.8%
-9
.7%
-9
.3%
2014
(1
54)
(711
) (4
,059
) (3
,986
) (3
,854
) -0
.6%
-2
.7%
-1
3.5%
-1
3.3%
-1
2.9%
Tabl
e D
-14:
Fi
rm L
oad
Obl
igat
ion
Coi
ncid
ent P
eak
Dem
and
Fore
cast
Com
pari
son
(MW
)
A
ctua
l Pea
k D
eman
d
Inte
rrup
ted
Load
at
Pea
k
Ava
ilabl
e In
terr
upt
Load
20
14
Fore
cast
Ava
ilabl
e In
terr
upt
Load
20
13
Fore
cast
Ava
ilabl
e In
terr
upt
Load
20
12
Fore
cast
Ava
ilabl
e In
terr
upt
Load
20
11
Fore
cast
Ava
ilabl
e In
terr
upt
Load
20
10
Fore
cast
20
14
Fore
cast
20
13
Fore
cast
20
12
Fore
cast
20
11
Fore
cast
20
10
Fore
cast
20
10
4,96
0 25
58
4,
996
2011
5,
210
0
43
66
5,
099
5,06
1 20
12
5,17
8 0
42
39
74
5,26
8 5,
135
5,10
8 20
13
5,05
6 0
31
42
46
76
5,16
2 5,
214
5,24
4 5,
202
2014
4,
871
0 33
37
51
48
76
5,
085
5,18
1 5,
088
5,20
5 5,
164
Appendix D Page 14 of 16
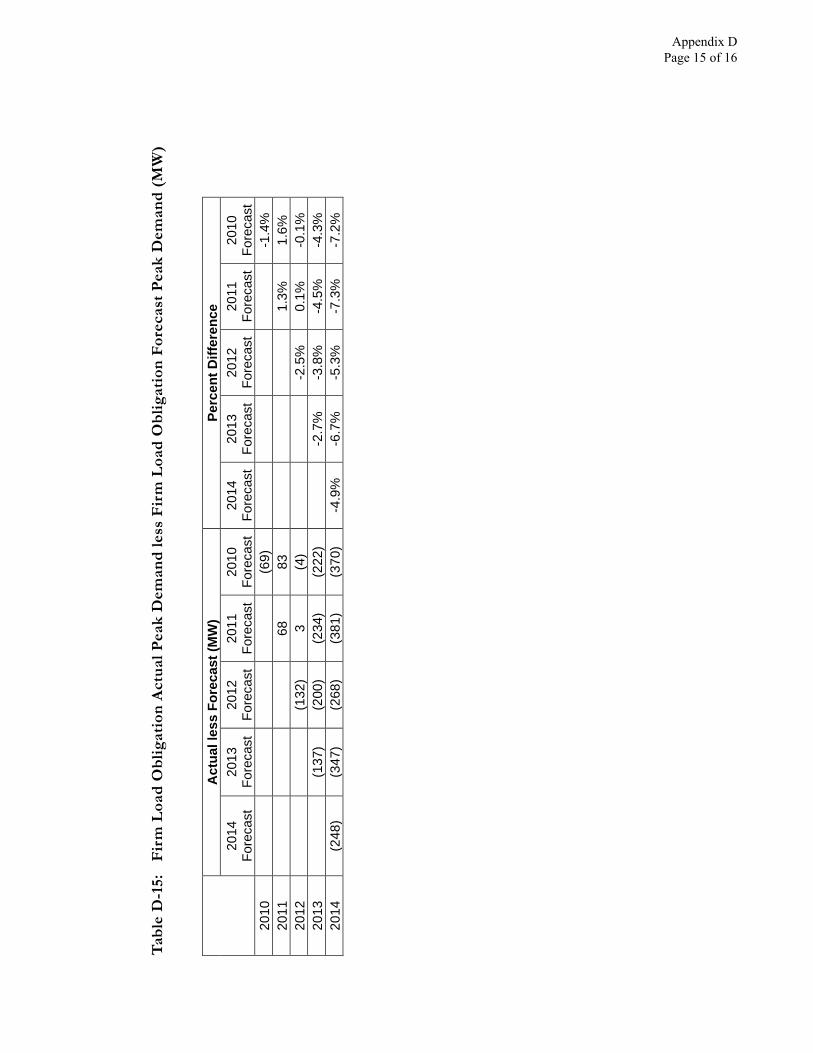
Tabl
e D
-15:
Fi
rm L
oad
Obl
igat
ion
Act
ual P
eak
Dem
and
less
Fir
m L
oad
Obl
igat
ion
Fore
cast
Pea
k D
eman
d (M
W)
Act
ual l
ess
Fore
cast
(MW
) Pe
rcen
t Diff
eren
ce
2014
Fo
reca
st
2013
Fo
reca
st
2012
Fo
reca
st
2011
Fo
reca
st
2010
Fo
reca
st
2014
Fo
reca
st
2013
Fo
reca
st
2012
Fo
reca
st
2011
Fo
reca
st
2010
Fo
reca
st
2010
(6
9)
-1.4
%
2011
68
83
1.
3%
1.6%
20
12
(132
) 3
(4
)
-2
.5%
0.
1%
-0.1
%
2013
(137
) (2
00)
(234
) (2
22)
-2
.7%
-3
.8%
-4
.5%
-4
.3%
20
14
(248
) (3
47)
(268
) (3
81)
(370
) -4
.9%
-6
.7%
-5
.3%
-7
.3%
-7
.2%
Appendix D Page 15 of 16
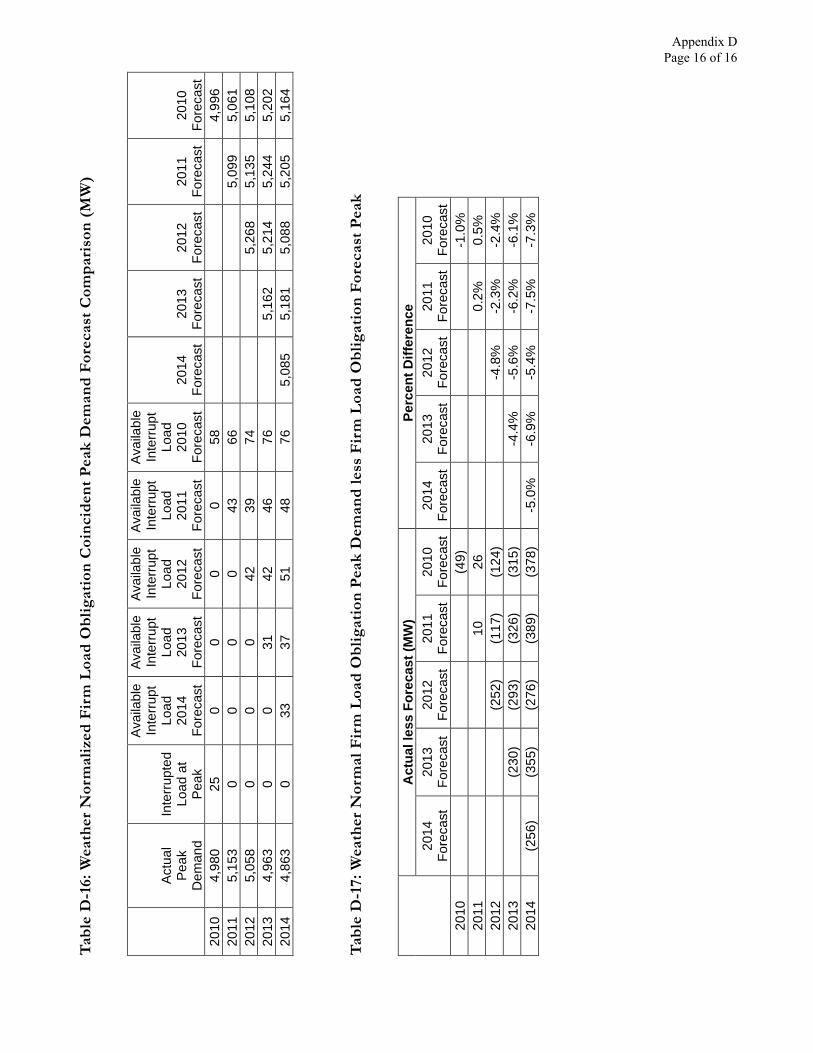
Tabl
e D
-16:
Wea
ther
Nor
mal
ized
Fir
m L
oad
Obl
igat
ion
Coi
ncid
ent P
eak
Dem
and
Fore
cast
Com
pari
son
(MW
)
Actu
al
Peak
D
eman
d
Inte
rrup
ted
Load
at
Peak
Avai
labl
e In
terr
upt
Load
20
14
Fore
cast
Avai
labl
e In
terr
upt
Load
20
13
Fore
cast
Avai
labl
e In
terr
upt
Load
20
12
Fore
cast
Avai
labl
e In
terr
upt
Load
20
11
Fore
cast
Avai
labl
e In
terr
upt
Load
20
10
Fore
cast
20
14
Fore
cast
20
13
Fore
cast
20
12
Fore
cast
20
11
Fore
cast
20
10
Fore
cast
20
10
4,98
0 25
0
0 0
0 58
4,
996
2011
5,
153
0 0
0 0
43
66
5,
099
5,06
1 20
12
5,05
8 0
0 0
42
39
74
5,26
8 5,
135
5,10
8 20
13
4,96
3 0
0 31
42
46
76
5,16
2 5,
214
5,24
4 5,
202
2014
4,
863
0 33
37
51
48
76
5,
085
5,18
1 5,
088
5,20
5 5,
164
Tabl
e D
-17:
Wea
ther
Nor
mal
Fir
m L
oad
Obl
igat
ion
Peak
Dem
and
less
Fir
m L
oad
Obl
igat
ion
Fore
cast
Pea
k
Act
ual l
ess
Fore
cast
(MW
) Pe
rcen
t Diff
eren
ce
2014
Fo
reca
st
2013
Fo
reca
st
2012
Fo
reca
st
2011
Fo
reca
st
2010
Fo
reca
st
2014
Fo
reca
st
2013
Fo
reca
st
2012
Fo
reca
st
2011
Fo
reca
st
2010
Fo
reca
st
2010
(4
9)
-1.0
%
2011
10
26
0.
2%
0.5%
20
12
(252
) (1
17)
(124
)
-4
.8%
-2
.3%
-2
.4%
20
13
(2
30)
(293
) (3
26)
(315
)
-4.4
%
-5.6
%
-6.2
%
-6.1
%
2014
(2
56)
(355
) (2
76)
(389
) (3
78)
-5.0
%
-6.9
%
-5.4
%
-7.5
%
-7.3
%
Appendix D Page 16 of 16