update on claim reserves and capital position · • bermuda, australia, malaysia, shanghai ... in...
TRANSCRIPT
Update on claim reserves and capital position
Eberhard Mueller, CRO / Group Risk Management
17th International Investors' Day
London, 23 October 2014
Claim reserves Capitalisation Appendix
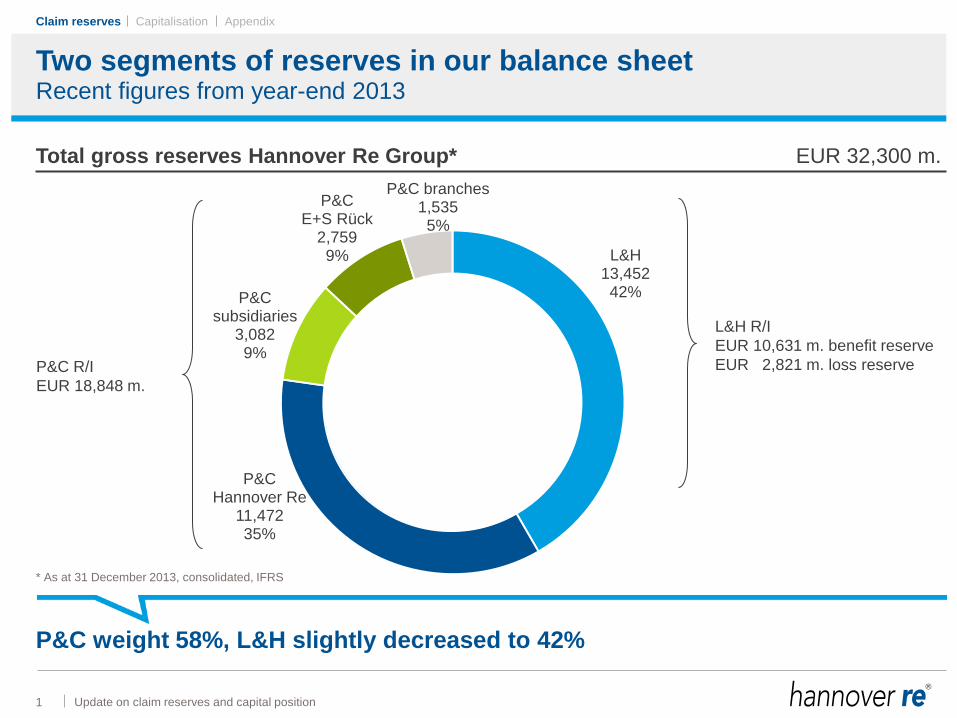
L&H 13,452 42%
P&C Hannover Re
11,472 35%
P&C subsidiaries
3,082 9%
P&C E+S Rück
2,759 9%
P&C branches 1,535 5%
Two segments of reserves in our balance sheet
Total gross reserves Hannover Re Group* EUR 32,300 m.
42%
P&C R/I
EUR 18,848 m.
L&H R/I
EUR 10,631 m. benefit reserve
EUR 2,821 m. loss reserve
Recent figures from year-end 2013
P&C weight 58%, L&H slightly decreased to 42%
* As at 31 December 2013, consolidated, IFRS
Update on claim reserves and capital position 1
Claim reserves

Claim reserves Capitalisation Appendix
Well-diversified gross P&C loss reserves. . .
2
Total gross P&C reserves HR Group* EUR 18,848 m.
Group-wide P&C reserve
study (internal and external)
• Hannover Re/E+S Rück,
Canada, France,
Bahrain / Takaful
− calculations by GRM RES:
EUR 14,939 m. (79%)
• Bermuda, Australia, Malaysia,
Shanghai
− by external appointed actuaries:
EUR 1,332 m. (7%)
• UK(IICH), Ireland, Sweden,
South Africa
− by HR Group own actuaries:
EUR 2,577 m. (14%)
Update on claim reserves and capital position
. . .across entities and countries
* As at 31 December 2013, consolidated, IFRS
USA 4,744 25%
UK/Ireland 4,125 22%
Europe 3,640 19%
Germany 2,973 16%
Rest of World 3,366 18%
Claim reserves
Claim reserves Capitalisation Appendix
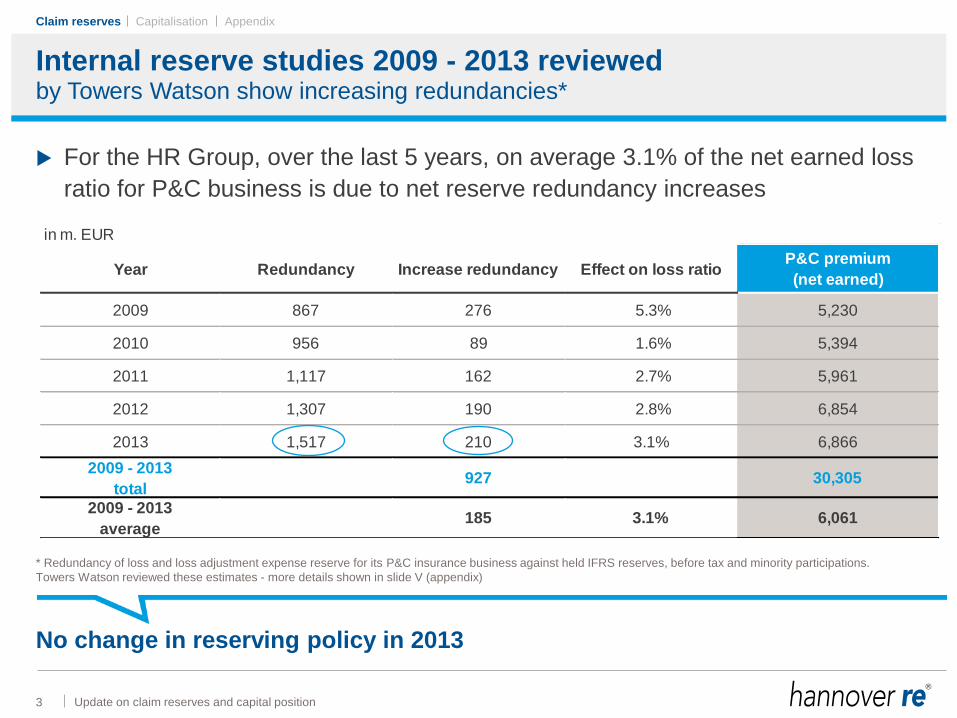
Internal reserve studies 2009 - 2013 reviewed
3
For the HR Group, over the last 5 years, on average 3.1% of the net earned loss
ratio for P&C business is due to net reserve redundancy increases
Update on claim reserves and capital position
in m. EUR
Year Redundancy Increase redundancy Effect on loss ratioP&C premium
(net earned)
2009 867 276 5.3% 5,230
2010 956 89 1.6% 5,394
2011 1,117 162 2.7% 5,961
2012 1,307 190 2.8% 6,854
2013 1,517 210 3.1% 6,866
2009 - 2013
total927 30,305
2009 - 2013
average185 3.1% 6,061
by Towers Watson show increasing redundancies*
* Redundancy of loss and loss adjustment expense reserve for its P&C insurance business against held IFRS reserves, before tax and minority participations.
Towers Watson reviewed these estimates - more details shown in slide V (appendix)
No change in reserving policy in 2013
Claim reserves

Claim reserves Capitalisation Appendix
Reported loss triangles for HR/E+S*. . .
4 Update on claim reserves and capital position
in m. EUR
No. Line of business Total reserves
U/Y 1979 - 2001
U/Y 1979 - 2001
in % of HR Group
Total reserves
U/Y 2002 - 2013
U/Y 2002 - 2013
in % of HR Group
1 General liability non-prop. 507.2 2.7% 3,822.2 20.3%
2 Motor non-prop. 448.1 2.4% 1,713.5 9.1%
3 General liability prop. 196.5 1.0% 1,662.0 8.8%
4 Motor prop. 153.8 0.8% 717.0 3.8%
5 Property prop. 26.2 0.1% 998.9 5.3%
6 Property non-prop. 12.9 0.1% 977.7 5.2%
7 Marine 39.0 0.2% 917.9 4.9%
8 Aviation 208.2 1.1% 676.5 3.6%
9 Credit/surety 37.6 0.2% 830.4 4.4%
All lines of business 1,629.4 8.6% 12,315.9 65.3%
Reconciliation to our balance sheet
. . .represent about 3/4 of our gross carried reserves
* As at 31 December 2013, consolidated, IFRS figures
Claim reserves

Claim reserves Capitalisation Appendix
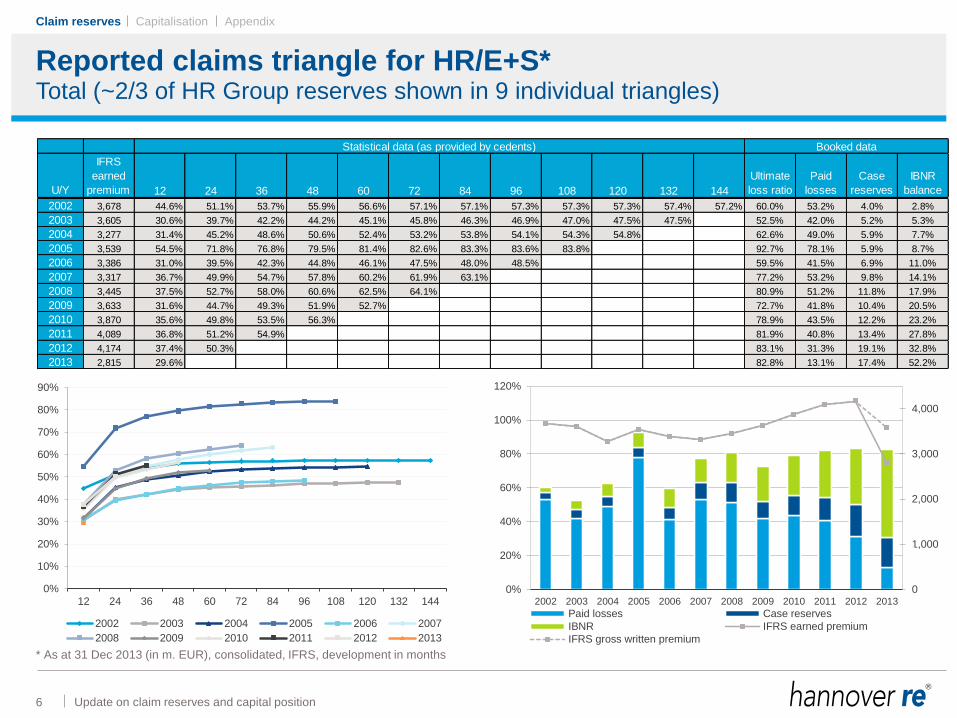
Statistical gross reported loss triangles based on cedents' original advices
(paid and case reserve information)
Converted to EUR with exchange rates as at 31 December 2013
Figures in triangles do not include business written in branch offices and
subsidiaries
Data on underwriting-year basis
Data are combined triangles for companies HR and E+S Rück
Data description and information Understanding the data is crucial for interpretation, analysis and results!
Update on claim reserves and capital position 5
Claim reserves
Claim reserves Capitalisation Appendix
0%
10%
20%
30%
40%
50%
60%
70%
80%
90%
12 24 36 48 60 72 84 96 108 120 132 144
2002 2003 2004 2005 2006 2007
2008 2009 2010 2011 2012 2013
U/Y
IFRS
earned
premium 12 24 36 48 60 72 84 96 108 120 132 144
Ultimate
loss ratio
Paid
losses
Case
reserves
IBNR
balance
2002 3,678 44.6% 51.1% 53.7% 55.9% 56.6% 57.1% 57.1% 57.3% 57.3% 57.3% 57.4% 57.2% 60.0% 53.2% 4.0% 2.8%
2003 3,605 30.6% 39.7% 42.2% 44.2% 45.1% 45.8% 46.3% 46.9% 47.0% 47.5% 47.5% 52.5% 42.0% 5.2% 5.3%
2004 3,277 31.4% 45.2% 48.6% 50.6% 52.4% 53.2% 53.8% 54.1% 54.3% 54.8% 62.6% 49.0% 5.9% 7.7%
2005 3,539 54.5% 71.8% 76.8% 79.5% 81.4% 82.6% 83.3% 83.6% 83.8% 92.7% 78.1% 5.9% 8.7%
2006 3,386 31.0% 39.5% 42.3% 44.8% 46.1% 47.5% 48.0% 48.5% 59.5% 41.5% 6.9% 11.0%
2007 3,317 36.7% 49.9% 54.7% 57.8% 60.2% 61.9% 63.1% 77.2% 53.2% 9.8% 14.1%
2008 3,445 37.5% 52.7% 58.0% 60.6% 62.5% 64.1% 80.9% 51.2% 11.8% 17.9%
2009 3,633 31.6% 44.7% 49.3% 51.9% 52.7% 72.7% 41.8% 10.4% 20.5%
2010 3,870 35.6% 49.8% 53.5% 56.3% 78.9% 43.5% 12.2% 23.2%
2011 4,089 36.8% 51.2% 54.9% 81.9% 40.8% 13.4% 27.8%
2012 4,174 37.4% 50.3% 83.1% 31.3% 19.1% 32.8%
2013 2,815 29.6% 82.8% 13.1% 17.4% 52.2%
Statistical data (as provided by cedents) Booked data
0
1,000
2,000
3,000
4,000
0%
20%
40%
60%
80%
100%
120%
2002 2003 2004 2005 2006 2007 2008 2009 2010 2011 2012 2013
Paid losses Case reserves
IBNR IFRS earned premium
IFRS gross written premium
Reported claims triangle for HR/E+S* Total (~2/3 of HR Group reserves shown in 9 individual triangles)
Update on claim reserves and capital position 6
* As at 31 Dec 2013 (in m. EUR), consolidated, IFRS, development in months
Claim reserves
Claim reserves Capitalisation Appendix
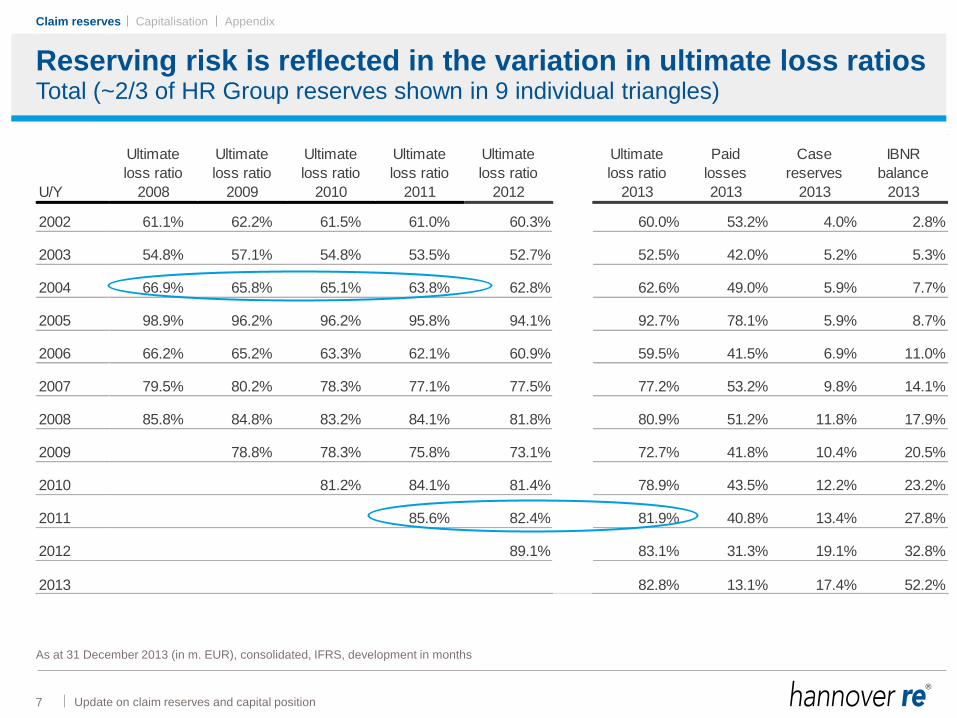
Reserving risk is reflected in the variation in ultimate loss ratios Total (~2/3 of HR Group reserves shown in 9 individual triangles)
Update on claim reserves and capital position 7
As at 31 December 2013 (in m. EUR), consolidated, IFRS, development in months
U/Y
Ultimate
loss ratio
2008
Ultimate
loss ratio
2009
Ultimate
loss ratio
2010
Ultimate
loss ratio
2011
Ultimate
loss ratio
2012
Ultimate
loss ratio
2013
Paid
losses
2013
Case
reserves
2013
IBNR
balance
2013
2002 61.1% 62.2% 61.5% 61.0% 60.3% 60.0% 53.2% 4.0% 2.8%
2003 54.8% 57.1% 54.8% 53.5% 52.7% 52.5% 42.0% 5.2% 5.3%
2004 66.9% 65.8% 65.1% 63.8% 62.8% 62.6% 49.0% 5.9% 7.7%
2005 98.9% 96.2% 96.2% 95.8% 94.1% 92.7% 78.1% 5.9% 8.7%
2006 66.2% 65.2% 63.3% 62.1% 60.9% 59.5% 41.5% 6.9% 11.0%
2007 79.5% 80.2% 78.3% 77.1% 77.5% 77.2% 53.2% 9.8% 14.1%
2008 85.8% 84.8% 83.2% 84.1% 81.8% 80.9% 51.2% 11.8% 17.9%
2009 78.8% 78.3% 75.8% 73.1% 72.7% 41.8% 10.4% 20.5%
2010 81.2% 84.1% 81.4% 78.9% 43.5% 12.2% 23.2%
2011 85.6% 82.4% 81.9% 40.8% 13.4% 27.8%
2012 89.1% 83.1% 31.3% 19.1% 32.8%
2013 82.8% 13.1% 17.4% 52.2%
Claim reserves
Claim reserves Capitalisation Appendix
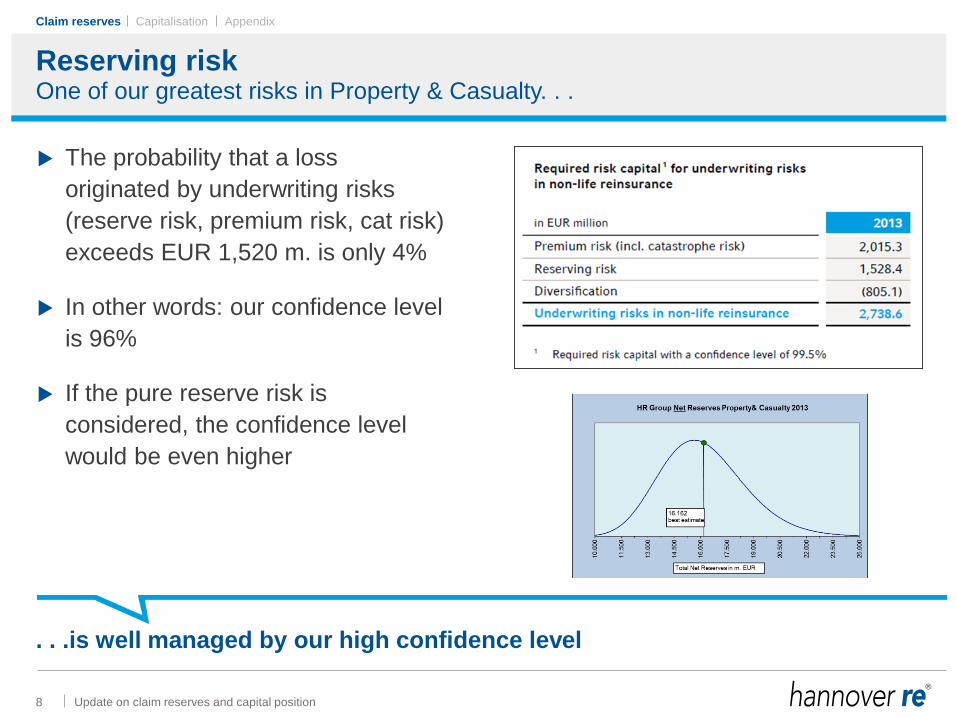
Reserving risk One of our greatest risks in Property & Casualty. . .
Update on claim reserves and capital position 8
The probability that a loss
originated by underwriting risks
(reserve risk, premium risk, cat risk)
exceeds EUR 1,520 m. is only 4%
In other words: our confidence level
is 96%
If the pure reserve risk is
considered, the confidence level
would be even higher
. . .is well managed by our high confidence level
Claim reserves

Capitalisation
Claim reserves Capitalisation Appendix
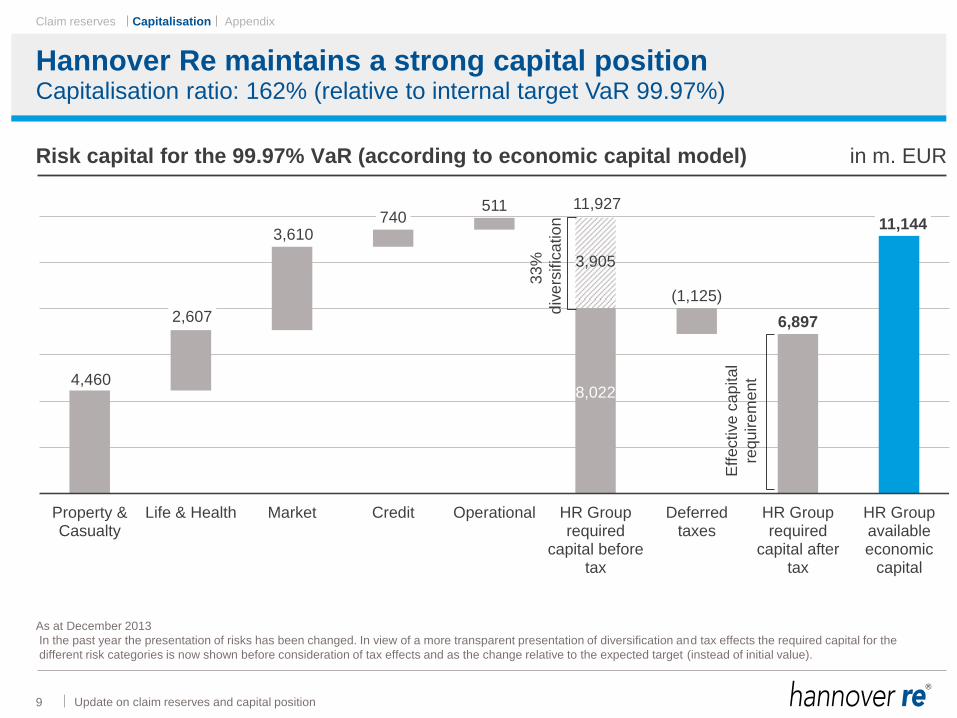
Hannover Re maintains a strong capital position
9 Update on claim reserves and capital position
Risk capital for the 99.97% VaR (according to economic capital model) in m. EUR
Capitalisation ratio: 162% (relative to internal target VaR 99.97%)
8,022
11,144
6,897
4,460
2,607
3,610 740
511
3,905
(1,125)
Property &Casualty
Life & Health Market Credit Operational HR Grouprequired
capital beforetax
Deferredtaxes
HR Grouprequired
capital aftertax
HR Groupavailableeconomic
capital
As at December 2013
In the past year the presentation of risks has been changed. In view of a more transparent presentation of diversification and tax effects the required capital for the
different risk categories is now shown before consideration of tax effects and as the change relative to the expected target (instead of initial value).
11,927
33
%
div
ers
ific
atio
n
Eff
ective
ca
pita
l
requ
ire
me
nt
Capitalisation
Claim reserves Capitalisation Appendix
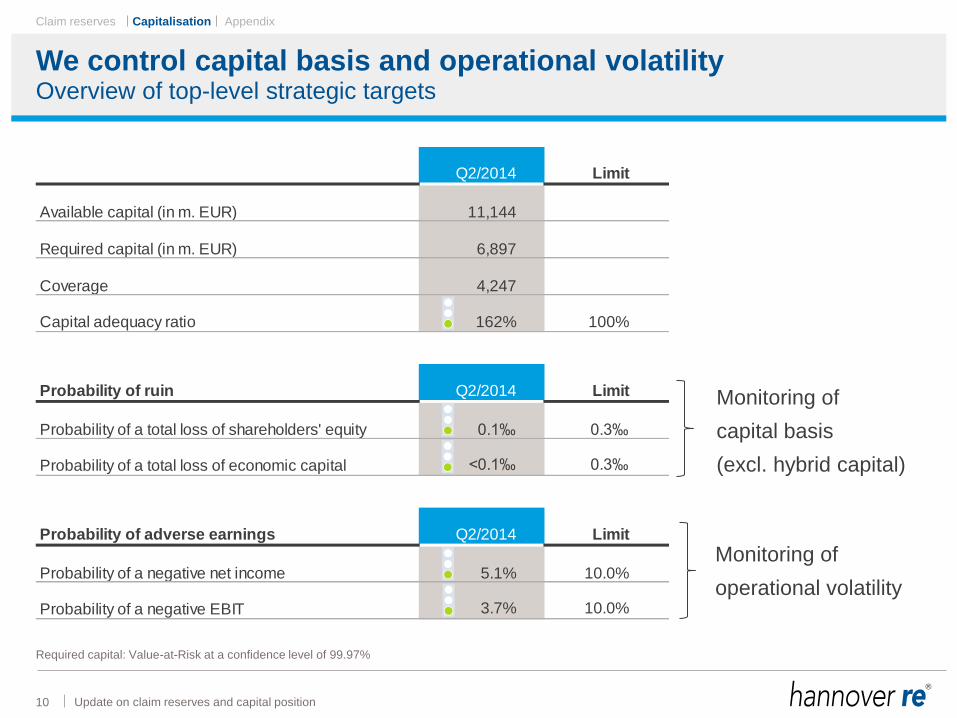
Q2/2014 Limit
Available capital (in m. EUR) 11,144
Required capital (in m. EUR) 6,897
Coverage 4,247
Capital adequacy ratio 162% 100%
Probability of ruin Q2/2014 Limit
Probability of a total loss of shareholders' equity 0.1‰ 0.3‰
Probability of a total loss of economic capital <0.1‰ 0.3‰
Probability of adverse earnings Q2/2014 Limit
Probability of a negative net income 5.1% 10.0%
Probability of a negative EBIT 3.7% 10.0%
We control capital basis and operational volatility
10 Update on claim reserves and capital position
Overview of top-level strategic targets
Required capital: Value-at-Risk at a confidence level of 99.97%
Monitoring of
operational volatility
Monitoring of
capital basis
(excl. hybrid capital)
Capitalisation

Claim reserves Capitalisation Appendix
Holding of undiversified capital due to rating targets
11
Notional Solvency II(VaR 99.5%, internal model)
Rating capital(Max of target ratings)
Internal model(VaR 99.97%)
Available capital(Internal model)
Update on claim reserves and capital position
Risk capital in m. EUR
Solvency II will not be a driving capital factor
All figures as at December 2013
6,897
Diversification
Effective
capital
requirement
3,375
11,144
Capitalisation

Claim reserves Capitalisation Appendix
Hannover Re is well capitalised
12 Update on claim reserves and capital position
Available capital significantly exceeds required capital
2009 2010 2011 2012 2013
Solvency margin 60.4% 69.5% 68.3% 72.9% 71.7%
Solvency margin 99.97% VaR 158.6% 154.9% 159.7% 170.0% 161.6%
Solvency margin 99.5% VaR - 336.1% 302.5% 335.2% 330.2%
Debt/equity ratio 32.1% 36.5% 30.9% 33.3% 34.3%
Interest coverage 14.9x 13.8x 8.5x 13.3x 9.7x
Reserve/premium ratio 270.1% 275.1% 292.7% 268.4% 270.6%
1)
2)
3)
4)
1) (Shareholders’ equity + non-controlling interests + hybrid)/Net premium earned
2) According to our internal model
3) Debt/(Stockholders' equity + non-controlling interests)
4) EBIT/Interest on hybrid capital
5) Net reserves/net premium earned (group)
5)
2)
Capitalisation

Claim reserves Capitalisation Appendix
Update on claim reserves and capital position
Risk factor and dependency model calibration is based on
• Hannover Re's internal loss data base and expert assessments
• Publically available and private market data
The capital model covers the business operations of the Hannover Re Group,
i.e. including all its subsidiaries
Main applications of the model, such as capital cost allocation and strategic asset
allocation, cover the whole insurance group
Internal model is basis for capital monitoring and allocation Risk map overview
13
Property & Casualty
underwriting risks
Life & Health
underwriting risksMarket risk Credit risk Operational risks
Premium Longevity & Mortality Equity Cedant default People
Catastrophe Morbidity & Disability Interest rate Retrocession default Systems
Reserve Lapse Real estateDefault of other
counterpartiesProcesses
Catastrophe Foreign exchange External events
Spread
Capitalisation

Claim reserves Capitalisation Appendix
+ 3.9% ⇒ 7.7% 2,093 X 10.1% / 5,600 ⇒ 3.8%
⇒
Capital allocation depends on risk profile
14 Update on claim reserves and capital position
. . . for our underwriters and our investment decisions?
P&C
reinsurance 5,115 X 10.1% / 7,300 ⇒ 7.1% + 3.7% ⇒ 10.8%
L&H
reinsurance
Investment
management 2,093 X 10.1% / 33,000 ⇒ 0.64% + 0.12% ⇒ 0.76%
AuM
55.0%
22.5%
22.5%
As at September 2013; risk capital, NPE: figures in m. EUR
* E.g. expenses for the company as a whole
MRC Risk
capital X NPE
Capital margin above risk-free
(pre-tax) / +
Admin. and other expenses*
⇒
Total margin above risk-free
(pre-tax)
Capitalisation

Claim reserves Capitalisation Appendix
Significant capital growth in 2013
15
P&C: positive result with further reserve strengthening
L&H: new business delivers positive capital contribution
Additional reserves built up for assets under management
Update on claim reserves and capital position
Reconciliation (economic capital / shareholders' equity) in m. EUR 2013 2012
Shareholders' equity 6,530.0 6,714.1
Value adjustments for Property & Casualty reinsurance 1,627.8 775.2
Value adjustments for Life & Health reinsurance 1,116.5 930.5
Value adjustments for assets under own management 357.6 599.0
Value adjustments due to tax effects and other (725.8) (558.1)
Economic equity 8,906.1 8,460.7
Hybrid capital 2,237.8 2,233.0
Available economic capital 11,143.9 10,693.7
Reconciliation (economic capital/shareholders' equity)
Capitalisation
Claim reserves Capitalisation Appendix
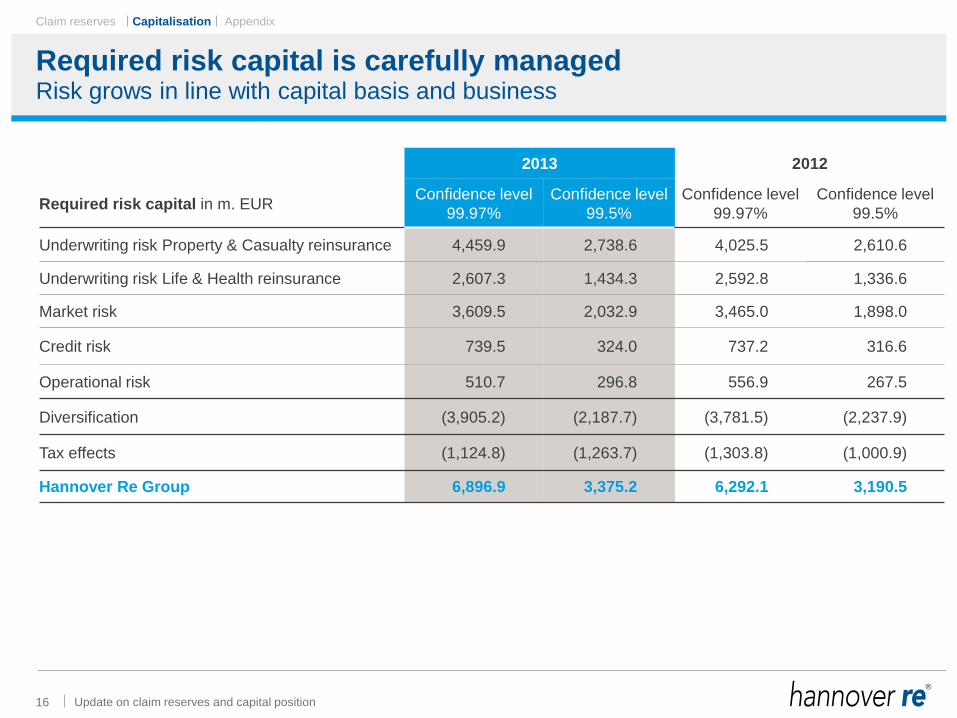
Required risk capital is carefully managed
16 Update on claim reserves and capital position
2013 2012
Required risk capital in m. EUR Confidence level
99.97%
Confidence level
99.5%
Confidence level
99.97%
Confidence level
99.5%
Underwriting risk Property & Casualty reinsurance 4,459.9 2,738.6 4,025.5 2,610.6
Underwriting risk Life & Health reinsurance 2,607.3 1,434.3 2,592.8 1,336.6
Market risk 3,609.5 2,032.9 3,465.0 1,898.0
Credit risk 739.5 324.0 737.2 316.6
Operational risk 510.7 296.8 556.9 267.5
Diversification (3,905.2) (2,187.7) (3,781.5) (2,237.9)
Tax effects (1,124.8) (1,263.7) (1,303.8) (1,000.9)
Hannover Re Group 6,896.9 3,375.2 6,292.1 3,190.5
Risk grows in line with capital basis and business
Capitalisation

Claim reserves Capitalisation Appendix
Capital allocation provides steering effect towards diversification
17 Update on claim reserves and capital position
Diversification effect within the P&C reinsurance business group
Risk capital* per line of business for the 99.5% VaR in m. EUR 2013
North America 734.9
Germany 458.3
Marine 289.7
Aviation 269.6
Credit, surety & political risks 789.1
Structured reinsurance products & ILS 146.2
UK, London market & direct business 375.9
Worldwide treaty 508.2
Global cat. XL 562.6
Facultative business 636.6
Diversification (2,032.5)
Total Property & Casualty 2,738.6
. . .on this segment level and on individual risk / treaty basis
* The presentation of risks has been changed analogue to the presentation of the different risk categories. In view of a more transparent presentation of diversification
effects the required capital is now shown as the change relative to the expected target (instead of initial value).
Capitalisation
Claim reserves Capitalisation Appendix
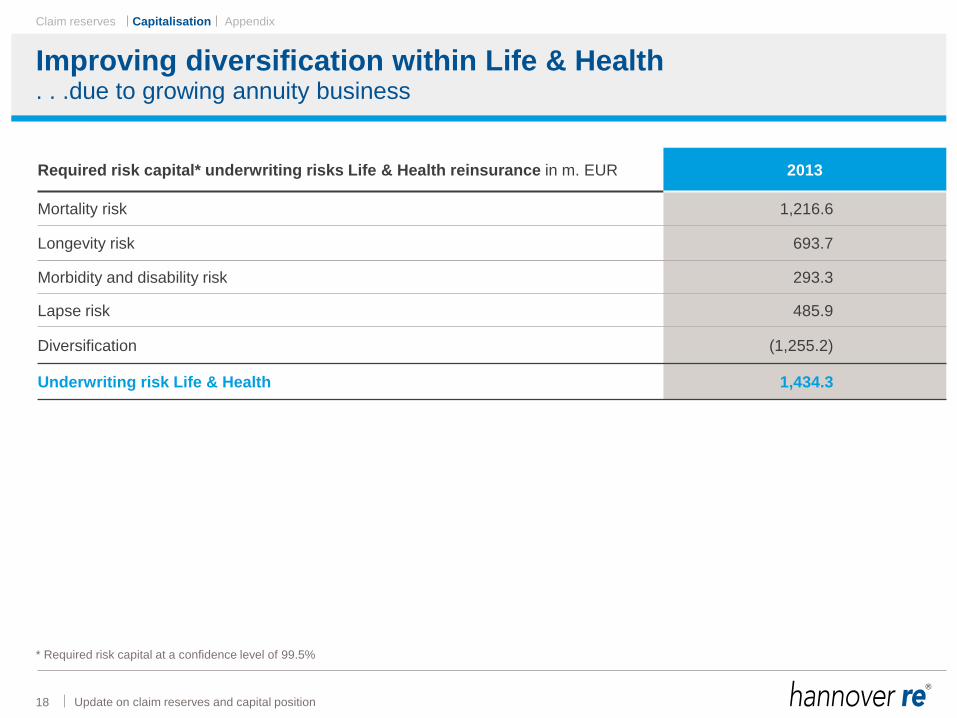
Improving diversification within Life & Health
18 Update on claim reserves and capital position
Required risk capital* underwriting risks Life & Health reinsurance in m. EUR 2013
Mortality risk 1,216.6
Longevity risk 693.7
Morbidity and disability risk 293.3
Lapse risk 485.9
Diversification (1,255.2)
Underwriting risk Life & Health 1,434.3
. . .due to growing annuity business
* Required risk capital at a confidence level of 99.5%
Capitalisation
Claim reserves Capitalisation Appendix
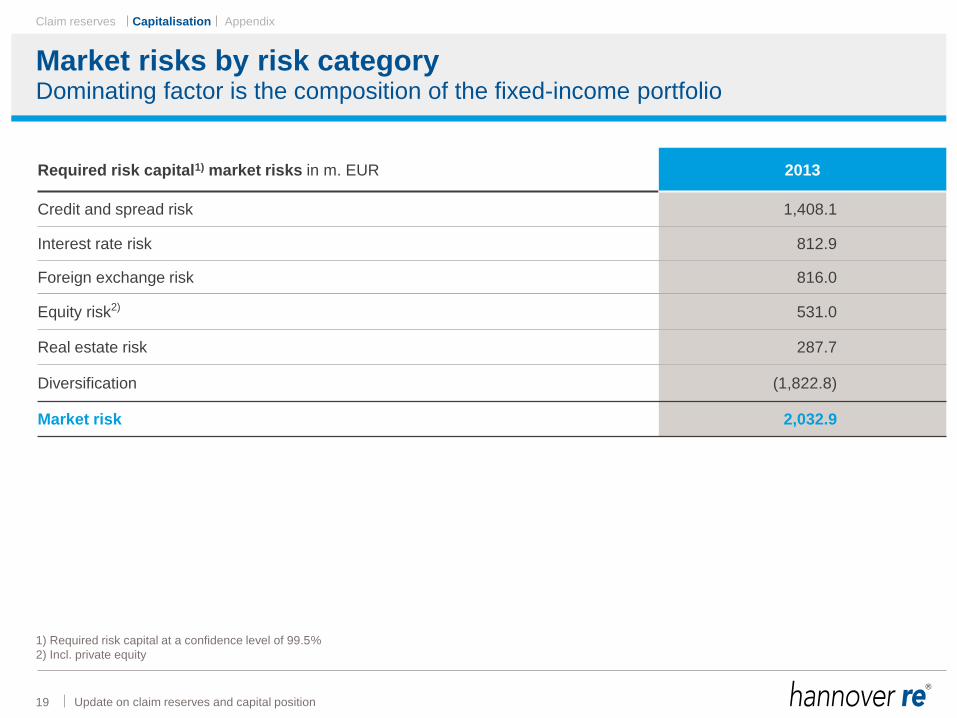
Market risks by risk category
19 Update on claim reserves and capital position
Required risk capital1) market risks in m. EUR 2013
Credit and spread risk 1,408.1
Interest rate risk 812.9
Foreign exchange risk 816.0
Equity risk2) 531.0
Real estate risk 287.7
Diversification (1,822.8)
Market risk 2,032.9
Dominating factor is the composition of the fixed-income portfolio
1) Required risk capital at a confidence level of 99.5%
2) Incl. private equity
Capitalisation

Appendix

Claim reserves Capitalisation Appendix
About 45% related to general liability
General liability 6,335
Other 5,242
Motor liability 2,655
37%
Update on claim reserves and capital position
Gross P&C reinsurance loss reserves* EUR 14,231 m.
Driven by premium volume in recent U/Y
* HR and E+S as at 31 December 2013, consolidated, IFRS figures
19%
44%
I
Appendix
Claim reserves Capitalisation Appendix
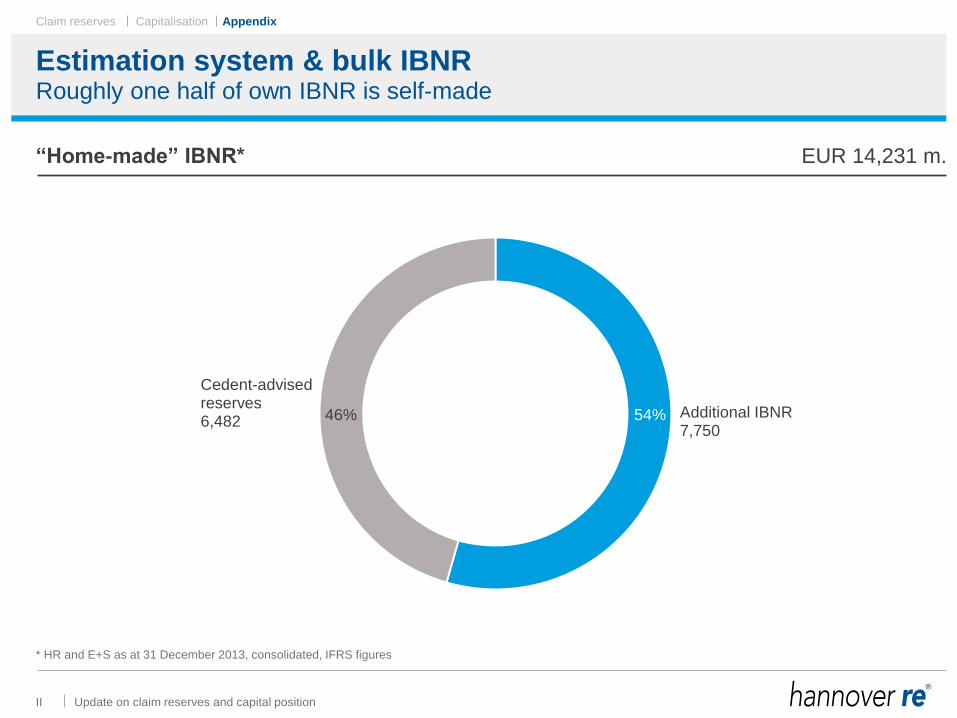
Estimation system & bulk IBNR
Additional IBNR 7,750
Cedent-advised reserves 6,482 46%
Update on claim reserves and capital position
“Home-made” IBNR* EUR 14,231 m.
Roughly one half of own IBNR is self-made
* HR and E+S as at 31 December 2013, consolidated, IFRS figures
54%
II
Appendix

Claim reserves Capitalisation Appendix
51
59 60
85
65 61
63
71
47 52 49 72 49 35 33 35
63
53 54
61
1992 1993 1994 1995 1996 1997 1998 1999 2000 2001 2002 2003 2004 2005
ULR (as 12/2013) + realised + projected part to complete 12th-year paid ratio ULR ("as if": 65% - 56% + + )
Ultimate Loss Ratios (ULR) in %
44 45
52
65%
average ULR
56%
average paid ratio
65%
average ULR 57%
average ULR "as-if"
54
On average still ~7%pts higher ULRs than mature years suggest
Update on claim reserves and capital position
US/Bermuda liability non-proportional: looks promising
III
Appendix

Claim reserves Capitalisation Appendix
2013 A&E reserves are prudent best estimates and exceed the corresponding
internal reserve study estimates reviewed by Towers Watson*
• IBNR factor of 5.9 reduced from 6.6 at previous year-end
• Paid Survival ratio increased to 32.1 years from 29.1 years at previous year-end
Individual aspects Special A&E reserves
Update on claim reserves and capital position IV
Financial
yearCase reserves
HR additional
reserves for A&E
(in TEUR)
Total reserve for A&E
(in TEUR)
3-year-average paid
(in TEUR)Survival
ratio
IBNR factor = add.
reserves/case
reserves
2007 26,532 119,192 145,724 5,555 26.2 4.5
2008 22,988 127,164 150,152 6,008 25.0 5.5
2009 26,216 171,363 197,579 8,130 24.3 6.5
2010 29,099 182,489 211,588 9,270 22.8 6.3
2011 28,422 193,957 222,379 8,574 25.9 6.8
2012 27,808 182,240 210,049 7,210 29.1 6.6
2013 28,839 170,805 199,643 6,224 32.1 5.9
* More details of Towers Watson´s review are shown in slide V (Appendix)
Appendix
Claim reserves Capitalisation Appendix
Details on reserve review by Towers Watson
Update on claim reserves and capital position V
The scope of Towers Watson’s work was to review certain parts of the held loss and loss adjustment expense reserve, net of outwards reinsurance, from Hannover Rück SE’s
consolidated financial statements in accordance with IFRS as at each 31 December from 2009 to 2013, and the implicit redundancy margin, for the non-life business of Hannover Rück
SE. Towers Watson concludes that the reviewed loss and loss adjustment expense reserve, net of reinsurance, less the redundancy margin is reasonable in that it falls within Towers
Watson’s range of reasonable estimates.
• Life reinsurance and health reinsurance business are excluded from the scope of this review.
• Towers Watson’s review of non-life reserves as at 31 December 2013 covered 99.1% / 99.1% of the gross / net held non-life reserves of €18.8 billion and € 17.7 billion respectively.
Together with life reserves of gross €2.8 billion and net €2.6 billion, the total balance sheet reserves amount to €21.7 billion gross and €20.3 billion net.
• The results shown in this presentation are based on a series of assumptions as to the future. It should be recognised that actual future claim experience is likely to deviate, perhaps
materially, from Towers Watson’s estimates. This is because the ultimate liability for claims will be affected by future external events; for example, the likelihood of claimants bringing
suit, the size of judicial awards, changes in standards of liability, and the attitudes of claimants towards the settlement of their claims.
• The results shown in Towers Watson’s reports are not intended to represent an opinion of market value and should not be interpreted in that manner. The reports do not purport to
encompass all of the many factors that may bear upon a market value.
• Towers Watson’s analysis was carried out based on data as at evaluation dates for each 31 December from 2009 to 2013. Towers Watson’s analysis may not reflect development or
information that became available after the valuation dates and Towers Watson’s results, opinions and conclusions presented herein may be rendered inaccurate by developments
after the valuation dates.
• As is typical for reinsurance companies, the claims reporting can be delayed due to late notifications by some cedants. This increases the uncertainty in the estimates.
• Hannover Rück SE has asbestos, environmental and other health hazard (APH) exposures which are subject to greater uncertainty than other general liability exposures. Towers
Watson’s analysis of the APH exposures assumes that the reporting and handling of APH claims is consistent with industry benchmarks. However, there is wide variation in
estimates based on these benchmarks. Thus, although Hannover Rück SE’s held reserves show some redundancy compared to the indications, the actual losses could prove to be
significantly different to both the held and indicated amounts.
• Towers Watson has not anticipated any extraordinary changes to the legal, social, inflationary or economic environment, or to the interpretation of policy language, that might affect
the cost, frequency, or future reporting of claims. In addition, Towers Watson’s estimates make no provision for potential future claims arising from causes not substantially
recognised in the historical data (such as new types of mass torts or latent injuries, terrorist acts), except in so far as claims of these types are included incidentally in the reported
claims and are implicitly developed.
• In accordance with its scope Towers Watson’s estimates are on the basis that all of Hannover Rück SE’s reinsurance protection will be valid and collectable. Further liability may
exist for any reinsurance that proves to be irrecoverable.
• Towers Watson’s estimates are in Euros based on the exchange rates provided by Hannover Rück SE as at each 31 December evaluation date. However, a substantial proportion of
the liabilities is denominated in foreign currencies. To the extent that the assets backing the reserves are not held in matching currencies, future changes in exchange rates may lead
to significant exchange gains or losses.
• Towers Watson has not attempted to determine the quality of Hannover Rück SE’s current asset portfolio, nor has Towers Watson reviewed the adequacy of the balance sheet
provisions except as otherwise disclosed herein.
In its review, Towers Watson has relied on audited and unaudited data and financial information supplied by Hannover Rück SE and its subsidiaries, including information provided
orally . Towers Watson relied on the accuracy and completeness of this information without independent verification.
Except for any agreed responsibilities Towers Watson may have to Hannover Rück SE, Towers Watson does not assume any responsibility and will not accept any liability to any person
for any damages suffered by such person arising out of this commentary or references to Towers Watson in this document.
Appendix

Claim reserves Capitalisation Appendix
Disclaimer
This presentation does not address the investment objectives or financial situation of any particular person or
legal entity. Investors should seek independent professional advice and perform their own analysis regarding
the appropriateness of investing in any of our securities.
While Hannover Re has endeavoured to include in this presentation information it believes to be reliable,
complete and up-to-date, the company does not make any representation or warranty, express or implied, as
to the accuracy, completeness or updated status of such information.
Some of the statements in this presentation may be forward-looking statements or statements of future
expectations based on currently available information. Such statements naturally are subject to risks and
uncertainties. Factors such as the development of general economic conditions, future market conditions,
unusual catastrophic loss events, changes in the capital markets and other circumstances may cause the
actual events or results to be materially different from those anticipated by such statements.
This presentation serves information purposes only and does not constitute or form part of an offer or
solicitation to acquire, subscribe to or dispose of, any of the securities of Hannover Re.
© Hannover Rück SE. All rights reserved.
Hannover Re is the registered service mark of Hannover Rück SE.