unwanted link layer traffic in large ieee 802.11 wireless...
TRANSCRIPT

Unwanted Link Layer Traffic in Large IEEE 802.11Wireless Networks
Ramya Raghavendra†, Elizabeth M. Belding†, Konstantina Papagiannaki‡,Kevin C. Almeroth†
†Department of Computer Science, University of California, Santa Barbara‡Intel Research, Pittsburgh
{ramya, ebelding, almeroth}@cs.ucsb.edu, [email protected]
✦
Abstract —Wireless networks have evolved into an important technologyfor connecting users to the Internet. As the utility of wireless technologygrows, wireless networks are being deployed in more widely varyingconditions. The monitoring of wireless networks continues to reveal keyimplementation deficiencies that need to be corrected in order to improveprotocol operation and end-to-end network performance. In wireless net-works, where the medium is shared, unwanted traffic can pose significantoverhead and lead to suboptimal network performance. Much of the pre-vious analyses of unwanted traffic in wireless networks have focused onmalicious traffic. However, another major contributor of unwanted traffic isincorrect link layer behavior. Using data we collected from the 67
th InternetEngineering Task Force (IETF) meeting held in November 2006, we showthat a significant portion of link layer traffic stems from mechanisms thatinitiate, maintain, and change client-AP associations. We further showthat under conditions of high medium utilization and packet loss rate,handoffs are initiated incorrectly. We analyze the traffic to understandwhen handoffs occur and whether the handoffs were beneficial or shouldhave been avoided.
1 INTRODUCTION
IEEE 802.11-based WLANs have experienced rapid growth inrecent years as the chief means of providing Internet con-nectivity to users. Large WLAN deployments are popular inlocations such as conferences, university campuses, hotels,and airports. A 2006 survey1 shows a significant increasein mobile application deployment in North American enter-prises (as compared to 2004) wherein 63% already use in-house WLANs and 58% plan to increase their WLAN invest-ment. These networks are characterized by a large numberof access points (APs) that are densely deployed to supportnetwork usage by many simultaneous users. Dense AP de-ployment helps ensure that the overall user demand is metand network coverage is provided, especially if users are mo-bile.
One of the limitations of IEEE 802.11 WLANs is the limitednumber of orthogonal channels, three in the case of 802.11b/gand 12 in the case of 802.11a. Because there is a limited numberof orthogonal channels, it is commonly the case that a largeWLAN deployment has several APs within range of each other,
1. http://www.forrester.com/Research/Document/Excerpt/-0,7211 ,40720,00.html
and often multiple of these APs are configured to transmit onthe same channel. Large WLAN deployments are hence likely tosuffer from high interference and high loads. This is particularlytrue when WLANs need to support flash crowds, which aredefined as sudden surges in the number of users attempting toconnect to and access the WLAN [1]. Increased interferenceand load gives rise to several problems such as intermittentconnectivity, low throughput and high losses, resulting inanunreliable network and sometimes a complete breakdown.
To investigate the prevalence of the aforementioned prob-lems in WLANs, we collected traces from the67th InternetEngineering Task Force (IETF) meeting held in San Diego inNovember 2006. The network consisted of over 100 APs onboth 802.11a and 802.11g networks, and was used by morethan 1200 users over a span of five days. We collected both the802.11a and 802.11g traces for four of the five days, resultingin, to the best of our knowledge, the most comprehensive traceof a large conference WLAN to date. Our analysis of the tracesshows that the network suffered from high interference and lossrates. There was significant overhead on the clients and APsto transmit a single frame of useful data. Repeated associationand reassociation attempts, due to lost connections, aggravatedthe problem. The result was that clients could only maintaina short association period with an AP, leading to both sub-optimal network performance and deterioration in applicationperformance.
Unwanted traffichas been used to refer cumulatively to thosetraffic components originated directly or indirectly either bymalicious or “non productive ” activities [2]. Much of theprevious analysis of unwanted traffic in wireless networks hasfocused on malicious traffic. However, another major contributorof unwanted traffic are the applications that aggressively attemptto maintain connectivity and high quality client service, leadingto undesirable traffic on the link layer. Through the analysisof the IETF traces, our goal is to understand the causes forhigh overhead and short association times of clients. We observethat a significant portion of the network overhead stems frommechanisms that initiate, maintain, and change client-AP con-nectivity. We show that much of this traffic is unnecessary, andactually compounds the problem of maintaining client-to-AP

associations. We identify two such mechanisms that contributeto unwanted traffic on the wireless network:
• Keepalive traffic that is used to maintain client-AP associ-ations in the absence of data traffic.
• The probing mechanism used by clients to frequentlycollect neighbor information.
Unwanted traffic is detrimental to the performance of largewireless networks such as that deployed during the IETF asit leads to missed transmission opportunities and inefficientmedium utilization. As a result, clients erroneously conclude thatthey have lost their connections to their APs, and hence initiatehandoffs. As congestion increases, the rate of handoffs increases,even in the absence of mobility. We show that a majority ofthese handoffs are unnecessary and at times negatively impactthroughput, wherein the clients’ throughput suffered immedi-ately following a handoff.
Analysis of such unwanted traffic is very important to under-stand and improve the performance of congested networks. Webelieve that the problems identified in this trace are not uniqueto the IETF network. These problems can occur in any wirelessnetwork, particularly large networks that are deployed to supportmany simultaneous users. Recent studies have identified keyimplementation deficiencies in frame retransmissions, framesizes and rate adaptation in congested networks [3], [4], [5].
Our study continues to identify key deficiencies in the 802.11protocol and its implementations in adapting to conditionsofhigh usage and congestion. These insights will be useful in de-signing systems and protocols that are more adaptive to networkconditions. We believe that through protocol improvement andbetter implementations, the ability of large scale networks tohandle high loads can be significantly enhanced.
In an earlier work, we analyzed the handoff behavior of clientsin congested environments [6]. We showed that clients performhandoffs at a high rate in a congested network, some of whichlead to a throughput deterioration. In this paper, we make thefollowing contributions:
• We show that client overhead increases with the increasein network density.
• We analyze the two types of overhead mechanisms that areprominent in a congested network - probes and keepalivepackets.
• We show that the handoff rates increase with an increasein network utilization, even in the absence of mobility.
• We perform handoff analysis for different card vendors, andshow that the behavior of cards across vendors is relativelyconsistent.
The remainder of this paper is organized as follows. Section2presents the related work and motivates the study of unwantedtraffic and client associations. An overview of 802.11 frametypes and the handoff process is described in Section 3. InSection 4, we provide details on the IETF network, monitoringmethodology and the network usage characteristics. Section 5discusses our findings on the unwanted traffic in the IETFnetwork. We report our analysis on handoff behavior observedin section 6. Finally, we conclude our work in Section 7.
2 RELATED WORK
Over the last few years, several studies have examined wirelessnetwork traces to understand the usage and performance ofthese networks. Starting with studies that focus on analysisof wireless network usage in campuses [7], [8], metropolitan-area networks [9] and mobility models [10], research has pro-gressed to analyze the performance of these networks, includingapplication workloads and session durations [11], [12]. Thesestudies were based on the analysis of wired distribution networktraffic and polled SNMP management data. As a result, thesestudies focus onhownetworks were used and how they performbut do not provide insights intowhy the networks operated orapplications performed in a particular way.
To address this gap, recent studies have analyzed traces cap-tured from the wireless side of the network using monitors. Yeoet al. were one of the first to capture link layer information andanalyze the performance of a campus network [13]. This workidentifies the challenges of wireless monitoring and explores thefeasibility of merging traces from multiple sniffers usingbeaconframes.
Jardoshet al. monitored the IETF conference and analyzedlink layer traces to understand congestion in wireless net-works [3], [5]. Their work identifies some key deficiencies ofthe 802.11 protocol in congested environments with respecttorate adaptation, frame sizes and the RTS-CTS mechanism.
Rodrig et al. collected link layer traces from the SIGCOMMconference and analyzed the causes for high retransmissionratesin the network [4]. Their work identifies that both contention andwireless transmission errors are the cause for retransmissions,and retransmissions due to contention affect rate adaptation inan incorrect way. Congestion-aware rate adaptation policies thattake medium utilization into account have shown up to a 300%increase in throughput in congested environments, compared toother well known adaptation schemes [14].
While much of the previous work focused on the effectof congestion on retransmissions and rate adaptation, noneofthe studies focused on unwanted traffic on the wireless side.Prior studies in unwanted traffic have focused on malicioustraffic in WLANs [2], [15]. However, unwanted traffic canresult from protocol operations, and an inability of the protocolimplementations to adapt to the environment. We show thatsuch traffic can result in significant overhead and performancedeterioration in the network.
A number of studies have evaluated the performance of802.11 handoff mechanisms. Mishraet al. performed an em-pirical analysis of handoffs using cards from several ven-dors and identified that the probe mechanism is the maincause of handoff latency [16], and that this latency is sig-nificant enough to reduce application performance. Severalimprovements have been suggested to perform faster hand-offs [17], [18], [19]. Recent studies have also shown thatthe current AP selection and triggering mechanisms are sub-optimal. Mhatreet al. showed that the use of long term iav-eraged signal strength instead of instantaneous signal strengthmeasurements results in better handoff decisions [20]. Po-tential bandwidth available after the handoff [21] and thequality of the AP’s connection to the Internet [22] have
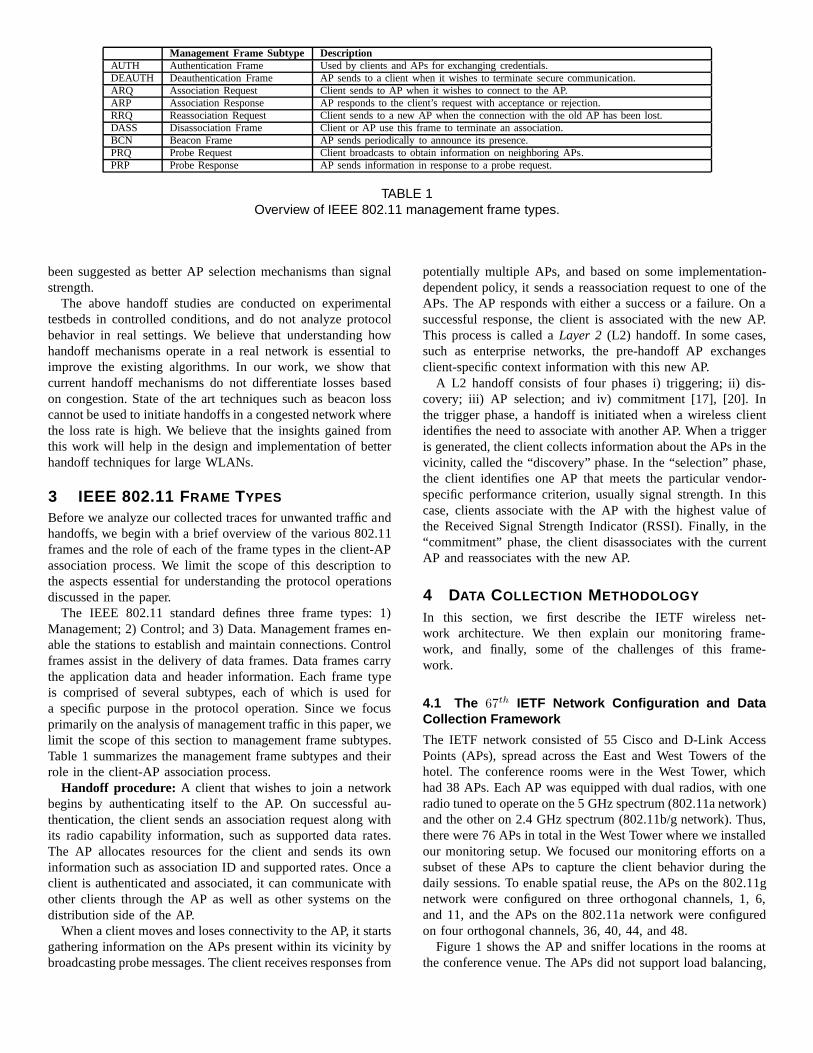
Management Frame Subtype DescriptionAUTH Authentication Frame Used by clients and APs for exchanging credentials.DEAUTH Deauthentication Frame AP sends to a client when it wishes to terminate secure communication.ARQ Association Request Client sends to AP when it wishes to connect to the AP.ARP Association Response AP responds to the client’s request with acceptance or rejection.RRQ Reassociation Request Client sends to a new AP when the connection with the old AP hasbeen lost.DASS Disassociation Frame Client or AP use this frame to terminate an association.BCN Beacon Frame AP sends periodically to announce its presence.PRQ Probe Request Client broadcasts to obtain information on neighboring APs.PRP Probe Response AP sends information in response to a probe request.
TABLE 1Overview of IEEE 802.11 management frame types.
been suggested as better AP selection mechanisms than signalstrength.
The above handoff studies are conducted on experimentaltestbeds in controlled conditions, and do not analyze protocolbehavior in real settings. We believe that understanding howhandoff mechanisms operate in a real network is essential toimprove the existing algorithms. In our work, we show thatcurrent handoff mechanisms do not differentiate losses basedon congestion. State of the art techniques such as beacon losscannot be used to initiate handoffs in a congested network wherethe loss rate is high. We believe that the insights gained fromthis work will help in the design and implementation of betterhandoff techniques for large WLANs.
3 IEEE 802.11 FRAME TYPES
Before we analyze our collected traces for unwanted traffic andhandoffs, we begin with a brief overview of the various 802.11frames and the role of each of the frame types in the client-APassociation process. We limit the scope of this descriptiontothe aspects essential for understanding the protocol operationsdiscussed in the paper.
The IEEE 802.11 standard defines three frame types: 1)Management; 2) Control; and 3) Data. Management frames en-able the stations to establish and maintain connections. Controlframes assist in the delivery of data frames. Data frames carrythe application data and header information. Each frame typeis comprised of several subtypes, each of which is used fora specific purpose in the protocol operation. Since we focusprimarily on the analysis of management traffic in this paper, welimit the scope of this section to management frame subtypes.Table 1 summarizes the management frame subtypes and theirrole in the client-AP association process.
Handoff procedure: A client that wishes to join a networkbegins by authenticating itself to the AP. On successful au-thentication, the client sends an association request along withits radio capability information, such as supported data rates.The AP allocates resources for the client and sends its owninformation such as association ID and supported rates. Once aclient is authenticated and associated, it can communicatewithother clients through the AP as well as other systems on thedistribution side of the AP.
When a client moves and loses connectivity to the AP, it startsgathering information on the APs present within its vicinity bybroadcasting probe messages. The client receives responses from
potentially multiple APs, and based on some implementation-dependent policy, it sends a reassociation request to one oftheAPs. The AP responds with either a success or a failure. On asuccessful response, the client is associated with the new AP.This process is called aLayer 2 (L2) handoff. In some cases,such as enterprise networks, the pre-handoff AP exchangesclient-specific context information with this new AP.
A L2 handoff consists of four phases i) triggering; ii) dis-covery; iii) AP selection; and iv) commitment [17], [20]. Inthe trigger phase, a handoff is initiated when a wireless clientidentifies the need to associate with another AP. When a triggeris generated, the client collects information about the APsin thevicinity, called the “discovery” phase. In the “selection”phase,the client identifies one AP that meets the particular vendor-specific performance criterion, usually signal strength. In thiscase, clients associate with the AP with the highest value ofthe Received Signal Strength Indicator (RSSI). Finally, inthe“commitment” phase, the client disassociates with the currentAP and reassociates with the new AP.
4 DATA COLLECTION METHODOLOGY
In this section, we first describe the IETF wireless net-work architecture. We then explain our monitoring frame-work, and finally, some of the challenges of this frame-work.
4.1 The 67th IETF Network Configuration and DataCollection Framework
The IETF network consisted of 55 Cisco and D-Link AccessPoints (APs), spread across the East and West Towers of thehotel. The conference rooms were in the West Tower, whichhad 38 APs. Each AP was equipped with dual radios, with oneradio tuned to operate on the 5 GHz spectrum (802.11a network)and the other on 2.4 GHz spectrum (802.11b/g network). Thus,there were 76 APs in total in the West Tower where we installedour monitoring setup. We focused our monitoring efforts on asubset of these APs to capture the client behavior during thedaily sessions. To enable spatial reuse, the APs on the 802.11gnetwork were configured on three orthogonal channels, 1, 6,and 11, and the APs on the 802.11a network were configuredon four orthogonal channels, 36, 40, 44, and 48.
Figure 1 shows the AP and sniffer locations in the rooms atthe conference venue. The APs did not support load balancing,

Fig. 1. IETF floor plan with AP and sniffer locations. Onlythe APs located in the conference rooms are depicted.
transmission power control or dynamic channel assignment.Weused thevicinity sniffingtechnique to collect data from the MAClayer [13], [5]. This is a technique in which a set of wirelessdevices, known assniffers, are deployed to passively monitorthe packets in the wireless medium. A total of 12 sniffers weredeployed in the conference rooms at various locations, whichwere chosen based on the number of users in the rooms. Theselocations used during the week are indicated in Figure 1. Thesniffers were placed directly underneath the AP to maximisethe likelihood of capture of all the packets received by and sentfrom the APs.
The sniffers were IBM R32 and T40 ThinkPad laptops withlinux 2.6 kernel. Each sniffer was equipped with an Atheroschipset 802.11a/b/g PCMCIA card. The radios were configuredin “monitor mode” to capture all packets. In this mode, we areable to capture all MAC layer frames including the control andmanagement frames. In addition, the prism header information,which contains send rate, received signal strength, and noiselevel was also recorded for each packet. We captured the first250 bytes of the packet to record header information only.Packets were captured using thetetherealutility.
Meetings were held in two separate sessions, the day andthe late evening sessions, the latter of which is also calledtheplenary. We monitored the network during both the day andplenary sessions using different sniffer configurationsi describedas follows.
Day session: The day sessions were held between 09:00 hrsand 17:30 hrs from November 6-10, 2006. Each day session wasdivided into six to eight parallel tracks, each of which was heldin one of the conference rooms. During the day sessions, we
collected usage statistics in the beginning of the day and rankedthe APs based on the number of users associated with each. Weconfigured the sniffers to monitor the top 12 ranked APs forthe entire day. Some of the sniffers were thus configured on the802.11g network, and the rest on 802.11a network, dependingon the usage.
Plenary session: The evening sessions were held on Novem-ber 9th (Plenary I) and10th (Plenary II) between 17:00 hrsand 19:30 hrs (on these days, the day sessions ended at 16:00hrs). During the plenary sessions, the partitions between theGrande BallroomA and B were removed, so that the entireroom could used. Sniffers were placed in this room at thelocations shown in Figure 1 underneath the eight APs. Duringplenary I, we configured eight sniffers on the 802.11a network(one underneath each AP), and four on the 802.11g network,placed below the four APs located at the entrance of the GrandeBallroom. During plenary II, we similarly placed the sniffers;however, in this case the eight sniffers monitored the APs onthe 802.11g network and four monitored the 802.11a network.
Challenges: While the vicinity sniffing technique facili-tates capture of data, control, and management frames on thewireless side of the network, there are multiple challenges,as indicated in previous work [5], [23]. One of the criticalchallenges of this technique is unrecorded frames, and how toreconstruct missing frames using data from multiple sniffers.This problem has been addressed in the work by Mahajanet al. [23]. A challenge in our setup was to determine howreliably the sniffer detected packets that the AP received.Ifthe receive sensitivity of the radio in the AP was higherthan the receive sensitivity of the sniffer’s radio, the snifferwould not record every packet that the AP successfully re-ceived.
For accuracy of analysis, we need to determine the reliabilityof the sniffer in capturing all the packets on the wirelessmedium. To this end, we compute thesniffing fidelity, definedas the ratio of frames received by the AP to frames undetectedby the sniffer. We use the strict frame sequencing defined bythe 802.11 protocol to compute the sniffer reliability. That is,for every response logged by the sniffer, there should have beena corresponding request from the client. The sniffer was placeddirectly below the AP and so we can safely assume that it shouldhave received the vast majority responses from the AP.
For every message received from the AP, we need to makesure that a corresponding message was received from the client.To do this, we first need to determine which of the request-response frames can be used for the computation of sniffingfidelity. We cannot use the RTS-CTS pair since the 802.11gmechanism uses CTS-to-self packets to silence 02.11b neigh-bors. Probe request-response messages also cannot be used sinceprobe requests are broadcast and all APs that receive a requesttransmit a reply. Fortunately, the association (ARQ, ARP) andreassociation (RRQ, RRP) request and response frames arriveatomically and can be used in our computation. Similarly, theDATA-ACK arrival atomicity can be leveraged. The drawbackof this technique is that it does not account for missing frameswhen both the request and response are unrecorded. However,since the sniffers were placed directly beneath the APs, the

Fig. 2. Airtime utilization of Channels 1, 6 and 11 over onesecond intervals.
probability of missing a response is low and we obtain a closeestimate.
Sniffing fidelity is computed as the ratio of the number ofresponse frames to the number of request frames recorded bythe sniffer, given by:
Sniffing fidelity =NARQ + NRRQ + NACK
NARP + NRRP + NDATA
(1)
The average sniffing fidelity of the eight sniffers duringthe plenary session varied between 0.9 and 0.96. This impliessniffers captured at least 90% of the frames and as many as 96%.While we believe that the results obtained from the analysisofthe trace will not be significantly altered if the missing frameswere also present in the analysis, better techniques are requiredto determine accurate sniffer locations during the trace collectionfor maximum fidelity. Investigation of such techniques is anarealeft for future work.
4.2 Data Set Analysis
Over 140 gigabytes of uncompressed wireless network traceswere collected during the week. With a goal of analyzingnetwork behavior under conditions of high load and networkactivity, we focus on the 802.11g network during the plenaryIIsession. There were three times as many users on the 802.11gnetwork as there were on the 802.11a network, and hence, theeffects of high network usage were more pronounced.
Previous studies have collected data at a single vantage pointand analyzed the client’s performance in terms of throughout,rate adaptation and retransmissions. While some initial efforts2
exist to analyze handoff behavior in wireless networks, to thebest of our knowledge this is the first attempt to capture wirelessdata from the entire network’s perspective and perform handoffanalysis for a network of this scale.
We perform preliminary analysis on the captured data to com-pute the network usage statistics. We characterize the networkscale in terms of utilization, number of APs and clients. We thencharacterize the performance in terms of loss rates.
Network utilization: Figure 2 shows the airtime utilizationon all three channels of the 802.11g network. We computeairtime utilization at each second as the sum of the time spent
2. http://www1.cs.columbia.edu/andreaf/new/ietf.html
transmitting all data, management, and control frames recordedby the sniffer, and the total number of delay components, suchas the Distributed Inter-Frame Spacing (DIFS) and Short Inter-Frame Spacing (SIFS) intervals. The APs supported both longand short preambles. We have used the transmission time forthe long preamble, namely 192µs, in our computation. Eachpoint on the graph is an average over a 20 second interval. Weobserve that the utilization level increases at around 17:00 hrs,when the plenary begins. The network continues to be heavilyutilized throughout the plenary.
Number of access points: Since the network at the IETF wasdensely deployed, we expect multiple APs on each channel tobe within the range of each of the sniffers. In Figure 3(a), thex-axis shows the number of APs within the sniffers’ range, andthe y-axis shows the percentage of time the sniffers detectedthat number of APs. The figure shows that the sniffers hadbetween one and eleven APs in range. We observe that about90% of the time, between four and eight APs on the samechannel were within range of the sniffers. The beacon framesthat are periodically broadcast by the APs are used to computethe number of APs in range for that interval. The cumulativepercentage is computed for all the sniffers over the entire lengthof the plenary.
Number of users: Figure 3(b) shows the instantaneousnumber of clients detected per second, summed over all chan-nels, throughout the plenary session. The vertical lines mark theduration of the plenary. A client who transmitted at least onedata frame during a one second interval is said to be present inthat interval. For visual clarity, the average value for 20 secondsis represented in the figure. A maximum of 300 users weredetected to be simultaneously present on the network, and thenumber of users continues to be high, over 150, throughout thesession.
Loss: We compute loss rate as the number of MAC layerframes marked as retransmissions. Figure 3(c) shows the instan-taneous packet loss rate in the network for every one secondinterval during the plenary. The vertical lines mark the durationof the plenary session. Again, the points in the figure are anaverage of 20 seconds. The packet loss rate is computed as theratio of the number of retransmitted frames to the total numberof data frames logged by the sniffer. Retransmitted frames aredata frames with theretry bit set. We observe that the lossrate increases to over 20% as the plenary session begins, andcontinues to be high throughout the session, with a maximumloss of about 35%. Clearly, the network suffered high loss ratesthroughout the session.
The graphs indicate that, during the plenary session, thenetwork was heavily utilized and had a dense deployment ofAPs. At the same time, the network suffered from a high lossrate. In comparison with previous studies of large scale wirelessnetworks, our traces are extensive in that they cover the entireset of APs throughout the session. The high utilization and lossrates motivate us to evaluate the wireless protocol behavior toinvestigate the cause for these high loss rates.
5 TRAFFIC ANALYSIS
The 802.11 DCF protocol uses Carrier Sense Medium Accesswith Collision Avoidance (CSMA/CA) to manage and reduce

(a) Number of APs within range ofthe sniffers.
16:15 17:30 18:15 18:30 19:150
10
20
30
40
50
60
70
Time of day
Num
ber
of u
sers
(b) Total number of clients on allchannels, averaged over 20 secondintervals.
16:15 17:15 18:15 19:15
10
20
30
40
Time of day
Pac
ket l
oss
rate
(%
)
(c) Packet loss rate.
Fig. 3. Usage statistics of the IETF wireless network during Plenary II.
2 3 4 5 6 7 8 9 10 110
0.1
0.2
0.3
0.4
0.5
0.6
Number of APs
Thr
ough
put (
Mbp
s)
(a) Per-client throughput.
1 2 3 4 5 6 7 8 90
0.2
0.4
0.6
Number of APs
Thr
ough
put (
Mbp
s)
(b) Aggregate data and control throughput.
Fig. 4. Per-client and aggregate throughput.
contention. According to the algorithm, a node that wants totransmit a frame is required to perform carrier sensing to checkwhether the medium is busy. If the medium is not busy, thenode transmits the packet. If the channel is busy, then the nodebacks off for a specific interval known as thebackoff interval.For every slot time that the channel is not busy, the BO isdecremented. The node transmits the packet when the backofftimer reaches zero. If this transmission results in a collision,maximum length of backoff interval doubles.
This algorithm requires that a node must contend for everypacket that it needs to transmit. In a network where there area large number of nodes, several nodes will be within eachother’s carrier sense range. In a highly utilized network, thesenodes will have a large number of frames that they need tosend. When nodes within carrier sense range repeatedly contendfor the medium, the nodes spend a significant amount of timein backoff, instead of packet transmission. Consequently,themedium is not utilized efficiently even though the contention ishigh.
In a large network such as the IETF, we expect the aforemen-tioned problem to be prevalent. To avoid unnecessary backoffand utilize the medium efficiently, it becomes critical thatwe avoid transmitting any unwanted frames on the wirelessmedium. Our goal is to analyze the traffic to identifyunwantedtraffic on the wireless side, recognize the protocol componentsthat generate this traffic and suggest ways to mitigate theunwanted traffic. In doing this, we reduce the overhead ofunnecessary medium contentions and backoff. The transmissionopportunities available to nodes to transmit useful data framesis thus significantly increased. In the context of our work,
Fig. 5. Breakdown of management traffic as apercentage of total traffic.
unwanted traffic is defined as traffic that is unnecessarily senton the medium, due to a deficiency in the protocol or itsimplementation. In the remainder of this section, we analyzethe amount of overhead and identify protocol components thatgenerate unnecessary traffic.
We begin with an analysis of user and network throughput.Per-user throughput and aggregate network throughput are com-puted based on the instantaneous number of users recorded inour data sets. To compute these metrics for a particular one-second interval, we consider all users who contributed at leastone data frame during that interval. Figure 4(a) shows the per-user throughput versus the number of APs within range duringthe same one second interval. The initial increase in throughputas the number of APs increased can be understood as the timewhen clients obtained benefits of multiple APs in the vicinity,in terms of selecting the AP with the best signal strength. As

(a) Frame overhead per client. (b) Frame overhead per AP.
Fig. 6. Frame overhead.
the number of APs in the vicinity increases beyond four, thethroughout begins to deteriorate. This decrease is due to theincreased interference that results from dense AP deployment.The throughput interestingly peaks when there are four APs inthe vicinity, which can be understood as follows. When thereare three APs in range of each other, they will be assignedto orthogonal frequencies. Contention arises as more APs arewithin range, resulting in more than one AP operating on thesame channel.
Figure 4(b) shows the aggregate network control and datathroughput computed for every one second interval, plot-ted against the number of APs within range during thesame one second interval. Again, when the number ofAPs is greater than four, we observe that the aggregatethroughput decreased. However, the rate at which the datathroughput decreased is much greater than that of the con-trol throughput. Here, the term control throughput is usedto refer to throughput of all non-data frames, i.e., con-trol frames and management frames. The decrease in ag-gregate throughput is the consequence of increased interfer-ence and contention. The higher percentage of control traf-fic is a result of an increase in the number of overheadframes caused by the presence of multiple APs in the vicin-ity.
To understand the cause of this overhead, we first needto categorize the traffic based on the different frame typesand subtypes. An overview of the management frame types isgiven in Section 3. In this paper, we focus on the unwantedmanagement and data traffic subtypes, and not the control traffic.The control frame subtypes found in the traces are Request-To-Send (RTS), Clear-To-Send (CTS), and Acknowledgment(ACK). ACKs are necessary to acknowledge the successfulreception of data packets. Only about 15% of the users usedthe RTS-CTS mechanism, and the percentage contribution ofthese frames to the overhead was not significant. Hence, wefocus our analysis on the management and data frames.
A high percentage of the total frames, nearly 40%, weremanagement frames. This high percentage of management traffichas also been reported in previous studies [4]. Figure 5 showsthe percentages of each management frame subtype as recordedby the sniffers, averaged over all three channels. Thex-axis inthe graph represents each of the management frame subtypes
explained in Table 1 and they-axis shows the percentage offrames of each subtype.
To understand the effect of this overhead on the clientsand APs, we calculate a metric calledframe overhead. Frameoverhead is computed as the ratio of number of managementframes to the number of data frames transmitted in every onesecond interval. For a client, the overhead consists of probe,association and reassociation requests. For an AP, the overheadframes are the corresponding response frames. This metric isuseful as it gives a sense of how many overhead frames a stationtransmits before obtaining the opportunity to transmit a dataframe. Each time a node transmits an overhead frame, it impliesa missed transmission opportunity for a data frame.
The frame overhead for each client is shown in Figure 6(a)and for each AP is shown in Figure 6(b). Each value onthe x-axis represents a single station (client or AP). They-axis shows frame overhead for each of the three frametypes. The clients and APs are arranged in ascending orderof frame overhead for the purpose of clarity. As we can see,the frame overhead for a majority of the clients is greater thanone. This implies that a majority of stations must transmitmultiple overhead frames before transmitting a single dataframe.
In the following sections, we investigate the causes of suchhigh overhead. We show that this overhead is an artifact of anetwork that is dense and heavily utilized, and much of thisoverhead is unwanted and degrades the network performance.We then explore ways in which this overhead can be reducedand study the gains of reducing the unwanted traffic. In ourtraces, we identified two major contributors to unwanted trafficframes. First is a data frame subtype, the null data framewhich we discuss in Section 5.1. In Section 5.2, we analyzeprobes, which are another type of unwanted traffic. We in-vestigate the causes for the high volume of probe traffic andthe effects of dense AP deployments on the amount of probeoverhead.
5.1 Keepalive Traffic
We analyze the effect of packets transmitted by client cardsto maintain connectivity with the access point. We call thesepacketskeepalive traffic. In our traces, we observed a largenumber of null data frames transmitted by the clients to the

Fig. 7. CDF of interarrival times of the keepalive packets.
Bytes Airtime Frames8% 9% 12%
TABLE 2Volume of keepalive traffic as a percentage of the entire
trace.
access point that were then ACKed by the AP. A null frame is adata frame subtype with zero bytes of data. Further analysisofthe traces and open source client implementations (such as Intel)showed that this was part of the AP book-keeping mechanism.
APs maintain an entry for each client in order to store theclient’s connectivity information. This overhead increases asthe number of clients grows. In an effort to minimize thisbook-keeping overhead, the APs maintain state informationonlyfor those clients that are actively sending data packets, anddisassociate those clients which have not sent any. The amountof time an AP waits before disassociating an inactive clientis implementation dependent. In the absence of data packets,a client transmits null packets, which are essentially keepalivepackets, to avoid disconnection by the AP.
Figure 7 is a cumulative distribution of the frequency at whichclients transmitted keepalive packets. For each client, the intervalbetween two successive null data packets is calculated and thecumulative distribution of all the inter-packet intervalsis plotted.The plot shows the CDF of packet intervals for all the clientsfor the duration of the plenary. Nearly 50% of the keepalivepackets were sent within an interval of 100 ms and 90% of thepackets are sent within 1 second. This high rate of transmissionresults in significant overhead. The impact of this mechanism onthe traffic is summarized in Table 2. We examine three differentmetrics: number of bytes, airtime and number of frames. Eachvalue in the table is expressed as a fraction of the entire traceand averaged over all the channels. As we can see from thetable, the keepalive packets pose a considerable overhead,andintelligent techniques that reduce this overhead in a network thatis heavily utilized are needed.
5.2 Probe Traffic
A client broadcasts probe requests when it needs to obtaininformation on which APs are in range. Any AP that receivesthis request sends a probe response containing informationnecessary for association, such as capability informationand
Fig. 8. Comparison of probe traffic with utilization.
supported data rates. Probe requests are sent when a clientdisconnects or roams from the AP with which it is associated.A client also probes the medium periodically to check whichAPs are in the vicinity, and whether it is still associated withthe AP with the strongest signal.
This aggressive probing is beneficial when clients are mobile.When a client moves and loses connectivity with an AP, theprocess of scanning and performing a handoff to another APcan take hundreds of milliseconds. This delay is large enoughto deteriorate application performance, especially delaysensitiveapplications such as voice. Instead of being reactive to packetloss, clients are proactive in probing the medium and collectingneighbor information.
While aggressive probing of the medium facilitates fasterhandoffs for mobile clients, this behavior in a static, congestednetwork imposes unnecessary overhead and leads to inefficientmedium utilization. Figure 8 shows the number of probe requestsand responses logged by the sniffers per second, averaged over aperiod of 20 seconds. On average, there were 22 probe requestsevery second, and at times, as many as 80 probes per second.To understand the high occurrence of probe frames, we look athow frequently the clients probed the medium.
From Figure 8, we also observe that there are a large numberof probe responses every second, even more than the numberof probe requests. Our reasoning is as follows: since proberequests are broadcast packets, all APs within range of the clienthear the request and send unicast responses to the client. Inthe IETF network, there were multiple APs deployed on eachchannel, resulting in multiple responses per request. As wesawin Figure 3(a), there were at least four access points detected85% of the time. This implies that each probe request is likely toelicit at least four responses 85% of the time. This is significantextra overhead in a network that is already highly utilized.
Figure 9 shows the cumulative distribution of the frequencywith which clients probed the medium. Thex-axis represents theintervals between successive probe requests by any client and they-axis represents the cumulative percentage of probes at each ofthe intervals. The graph plots the cumulative distributionof theinter-probe intervals of all the probe requests for each client inthe plenary that sent at least one data frame. Nearly 60% of allprobe requests occur in intervals smaller than 30 ms, and closeto 80% in intervals smaller than 2 seconds. This indicates that amajority of the clients probe the medium frequently, contributingto the overhead. The clients whose probe intervals are very high,

Fig. 9. CDF of the interval between successive proberequests.
Fig. 10. (a) Scatter plot showing the relationship betweenthe number of clients and probe requests. The correlationcoefficient is 0.73. (b) Scatter plotshowing the relationship between loss rate and probe re-quests. The correlation coefficient is 0.65.
on the order of 100 seconds, are the clients for whom we didnot observe active sessions in the traces. This may indicatetheradios were in sleep mode and he laptop was not in use.
To understand the factors that affect probe traffic, we studythe correlation between the number of probe requests andthe number of users and loss rate. As the number of clientsincreases, we expect a proportional increase in the numberof probe requests. Also, when the congestion in the mediumincreases, the number of retransmissions increases. We expectthis increase to result in the loss of some of the probe request andresponse frames. When response frames are lost due to collision,the client will retransmit a probe request, thereby aggravatingcongestion. Hence we expect a correlation between the loss rateand the number of probe requests. To verify these claims, weplot the number of probe requests per second against the numberof clients and loss rate in F igures 10(a) and 10(b), respectively.Figure 10(a) indicates that, as the number of users increases, thenumber of probe requests increases. In Figure 10(b), the numberof probe requests generally increases with an increase in lossrate.
5.3 Discussion
Management frames, together with keepalive traffic, comprisenearly half the total frames transmitted during our collectionperiod. This extreme overhead is detrimental to network perfor-mance. With nodes frequently contending for the medium and
then backing off, the medium is utilized inefficiently. Withalarge number of transmitted packets, the probability of packetcollision and retransmission is significant. The high frequency ofmedium probing by the nodes is wasteful. We show in Section 6that users were predominantly static in the plenary sessionanddid not need to aggressively search for new APs. The sameargument holds for keepalive messages. While this mechanismreduces storage overhead on the AP by aggressively removingthe disconnected clients, it results in high traffic overhead. Thisbehavior is particularly undesirable in static networks wherethere is a high probability that a user will reconnect to the sameAP. In such a case, having the AP keep a client record activemay be more beneficial than aggressively removing it.
6 HANDOFF ANALYSIS
In Section 5, we studied the breakdown of network trafficand quantitatively analyzed the amount of management andkeepalive traffic. Both these frame types are necessary tomaintain the client-AP associations. Even when clients arenotmoving, neighbor discovery is performed frequently to checkwhether an AP with a higher signal strength is available, thusattempting to improve performance. When a client wishes toassociate with a different AP, a handoff process is initiated. Anoverview of the handoff procedure was provided in Section 3.Handoff trigger is the first stage of handoff wherein a clientidentifies the need to look for another AP. The implementationof this mechanism is left to vendors, however, it is usually areaction to one or more of the following: 1) consecutive missedbeacons3; 2) unacknowledged packets [17]; and 3) beacon frameloss or quality degradation [20]. As a result of frequent probingand implementations that use packet loss information to triggerhandoffs, we expect a high rate of handoffs in a congestednetwork. In this section, we analyze the duration and frequencyof these associations and the handoff behavior of clients.
Channel 1 Channel 6 Channel 11
614 586 627
TABLE 3Number of handoffs during the plenary session.
6.1 Trace Analysis
To explore the handoff behavior observed in our traces, weinvestigate the number and frequency of handoffs and thenature of handoffs between different channels. Most importantly,we investigate whether the handoff resulted in a performanceimprovement for clients.
The number of handoffs on each channel observed duringthe plenary is summarized in Table 3. We observe a total ofnearly 1800 handoffs during the three hours of the plenary,which is unexpected since we visually observed client mobilityto be minimal during the session. To better understand theclient handoff behavior and validate our anecdotal observationof low client mobility, we compute the length and frequency of
3. http://ipw2200.sourceforge.net

client-AP associations. We define two metrics for this compu-tation: prevalenceand persistence. Prevalence and persistenceof Internet routes were previously studied by Paxson [24]. Wedefine these terms in the context of client-AP associations,andcompute these metric values for the IETF traces.
6.2 Prevalence
Adapting the notion of prevalence as defined by Paxson [24],we define prevalence of clients as follows: Given that weobserved a clientc associated with an APA, what is theprobability of observingc associated withA in the future?Prevalence has specific implications on client mobility. Ifa clientis predominantly static, the prevalence of a client-AP associationpair is high, we call this AP thedominantAP. On the other hand,evenly distributed prevalence values indicate that there was nosingle dominant AP, and that the client was mobile. In a wellfunctioning network characterized by clients with low mobility,we expect the majority of the client-AP associations to havehigh prevalence values indicating that clients did not bounceback and forth between APs.
We compute prevalence values at a high granularity of onesecond and a coarse granularity of one minute. We divide thetrace inton intervals. Letns be the total number of one secondintervals in the trace. At each one second interval, we checkwhether a client has sent at least one data packet to the AP. Ifithas, then it is still connected to the AP, else it has either roamedor become inactive. We consider the client to have reconnectedto the AP when we see a data packet from that client again.Let ks be the total number of one second intervals in whichthe client was active. The prevalence of the client on the AP isgiven by
πs = ks/ns (2)
The prevalence values at one second granularity are shown inFigure 11. The prevalence values at this granularity are evenlydistributed, which indicates that at a high granularity, not allclients were highly prevalent on the dominant AP. About 40%of the clients had only a 50% chance of being associated withits dominant AP.
Prevalence at granularity of one minute is calculated similarly.If nm is the total number of one minute intervals in the traces,andkm is the number of intervals in which a client was active,the prevalence is given by
πm = km/nm (3)
From Figure 11, we see that the majority of clients are moreprevalent on the dominant AP on a one minute granularity.Only about 30% of clients had a prevalence of 80% or lesson the dominant AP. The remaining 70% of the clients wereprevalent on the dominant AP over 80% of the time. Theseresults indicate that clients frequently associated with the sameAP, implying that mobility in the network was low. Even thoughmultiple APs on the same channel were within the range of aclient, we observe that a client tends to be prevalent on one AP,the dominant AP. As described in Section 3, most clients usesignal strength to select an AP for association. Consequently,the dominant AP is most likely the AP closest to the client. The
Fig. 11. Client prevalence on an AP, given as the cu-mulative distribution of the probability of a client beingassociated with an AP.
lower prevalence at a higher granularity of time implies oneofthe two things: i) clients were sending data frames infrequently;or ii) clients were bouncing back and forth between APs withinshort intervals. Given the rate at which the keepalive packetswere transmitted, as shown in Figure 7, and the per second clientthroughput, as shown in Figure 4(a), we believe that frequentswitching of clients between APs contributed significantlyto thelower prevalence rates over one second intervals.
6.3 Persistence
We define the persistence of a client as follows: Given thata client is associated with a particular AP, how long beforethe client is likely to have changed its association to anotherAP? Thus, persistence is the length of time a client remainsassociated with an AP. A low persistence value indicates thatthe clients did not remain connected to an AP for a long time.In a well-functioning network characterized by clients with lowmobility, we expect clients to have high persistence values. Thatis, clients stay connected to an AP for long periods while theyare static, and only infrequently change APs during movement.
We calculate the persistence of clients connected to theirdominant AP. The dominant AP for a client is the AP onwhich the client has high prevalence. An association lengthiscalculated as the time elapsed between the first and last dataframe observed from the client, including null data frames.The persistence is computed for a one second time interval;if no data frame has been observed for up to one second, weassume the session has ended. The one second interval forthis computation is based on the observed rate at which nullpackets are transmitted by the clients to keep their sessions alive.From figure 7, we learned that about 98% of the time, a nullpacket is sent within one second. Furthermore, if we observea data frame from a client at seconds1 and do not observea frame in the subsequent seconds2, we make a “best guess”that the disassociation occurred halfway between these twotimeintervals.
Figure 12 shows the cumulative distribution of persistencevalues for the users present during the plenary session. Thefigure captures values for all client-AP pairs observed in thetraces. Thex-axis represents the length of associations inminutes and they-axis represents the cumulative percentage ofassociations. About 40% of the associations were under two
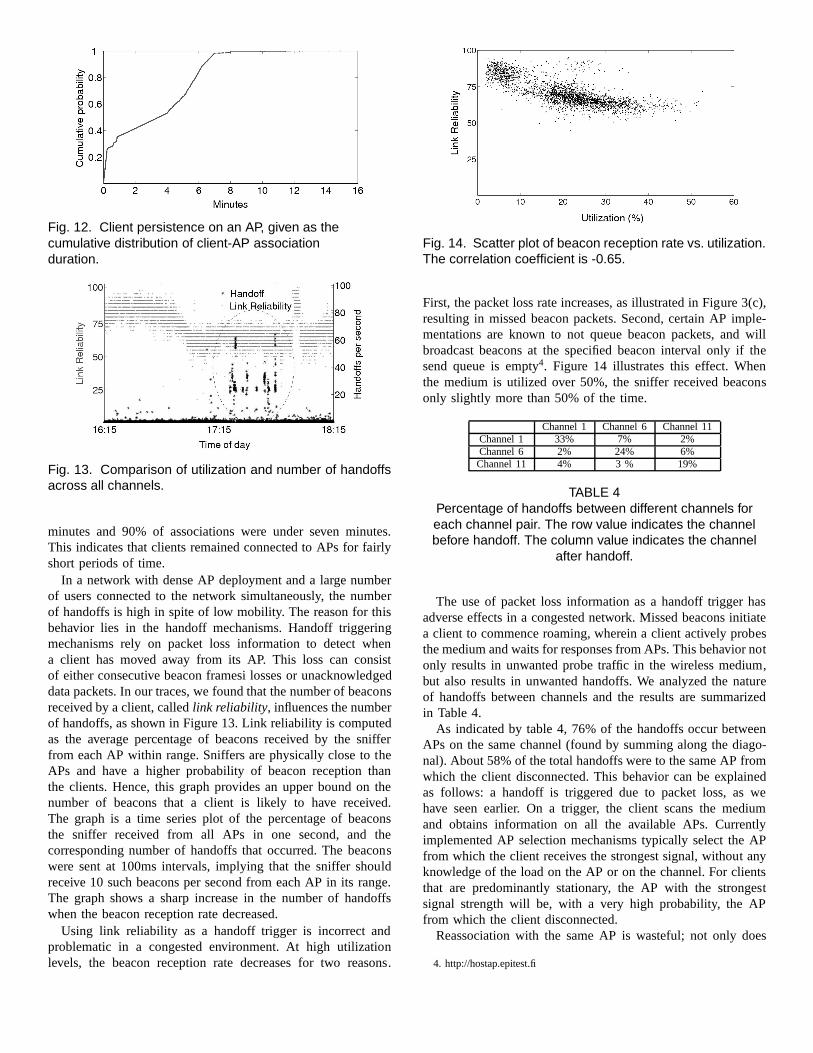
Fig. 12. Client persistence on an AP, given as thecumulative distribution of client-AP associationduration.
Fig. 13. Comparison of utilization and number of handoffsacross all channels.
minutes and 90% of associations were under seven minutes.This indicates that clients remained connected to APs for fairlyshort periods of time.
In a network with dense AP deployment and a large numberof users connected to the network simultaneously, the numberof handoffs is high in spite of low mobility. The reason for thisbehavior lies in the handoff mechanisms. Handoff triggeringmechanisms rely on packet loss information to detect whena client has moved away from its AP. This loss can consistof either consecutive beacon framesi losses or unacknowledgeddata packets. In our traces, we found that the number of beaconsreceived by a client, calledlink reliability, influences the numberof handoffs, as shown in Figure 13. Link reliability is computedas the average percentage of beacons received by the snifferfrom each AP within range. Sniffers are physically close to theAPs and have a higher probability of beacon reception thanthe clients. Hence, this graph provides an upper bound on thenumber of beacons that a client is likely to have received.The graph is a time series plot of the percentage of beaconsthe sniffer received from all APs in one second, and thecorresponding number of handoffs that occurred. The beaconswere sent at 100ms intervals, implying that the sniffer shouldreceive 10 such beacons per second from each AP in its range.The graph shows a sharp increase in the number of handoffswhen the beacon reception rate decreased.
Using link reliability as a handoff trigger is incorrect andproblematic in a congested environment. At high utilizationlevels, the beacon reception rate decreases for two reasons.
Fig. 14. Scatter plot of beacon reception rate vs. utilization.The correlation coefficient is -0.65.
First, the packet loss rate increases, as illustrated in Figure 3(c),resulting in missed beacon packets. Second, certain AP imple-mentations are known to not queue beacon packets, and willbroadcast beacons at the specified beacon interval only if thesend queue is empty4. Figure 14 illustrates this effect. Whenthe medium is utilized over 50%, the sniffer received beaconsonly slightly more than 50% of the time.
Channel 1 Channel 6 Channel 11Channel 1 33% 7% 2%Channel 6 2% 24% 6%Channel 11 4% 3 % 19%
TABLE 4Percentage of handoffs between different channels foreach channel pair. The row value indicates the channelbefore handoff. The column value indicates the channel
after handoff.
The use of packet loss information as a handoff trigger hasadverse effects in a congested network. Missed beacons initiatea client to commence roaming, wherein a client actively probesthe medium and waits for responses from APs. This behavior notonly results in unwanted probe traffic in the wireless medium,but also results in unwanted handoffs. We analyzed the natureof handoffs between channels and the results are summarizedin Table 4.
As indicated by table 4, 76% of the handoffs occur betweenAPs on the same channel (found by summing along the diago-nal). About 58% of the total handoffs were to the same AP fromwhich the client disconnected. This behavior can be explainedas follows: a handoff is triggered due to packet loss, as wehave seen earlier. On a trigger, the client scans the mediumand obtains information on all the available APs. Currentlyimplemented AP selection mechanisms typically select the APfrom which the client receives the strongest signal, without anyknowledge of the load on the AP or on the channel. For clientsthat are predominantly stationary, the AP with the strongestsignal strength will be, with a very high probability, the APfrom which the client disconnected.
Reassociation with the same AP is wasteful; not only does
4. http://hostap.epitest.fi

200 400 600−400
−200
0
200
400
600
HandoffsPer
cent
age
chan
ge in
thro
ughp
ut
Fig. 15. Percentage change in throughout after handoffover a period of 30s. The x-axis represents each handoffevent ordered by throughput improvement.
it result in MAC overhead, but it also causes applicationperformance deterioration. Handoffs to APs on the same channelcan be beneficial only if the new AP is less loaded than the AP towhich the client was previously connected. However, connectingto APs with lower signal strength is likely to result in lowereddata rates. Further, if the network around the client is congested,switching to a different AP on the same channel is not beneficialsince the client continues to see a similar level of congestion.
Switching to an AP on a different channel can be beneficial ifthe new channel is less congested and can offer better throughputto the clients. Since the three channels were utilized uniformlyduring the plenary and loss rates were comparable, as shown inFigure 3, we do not expect users to have obtained significantgains from handoffs.
To determine whether the handoffs were beneficial, we com-pute the percentage change in throughput immediately beforeand after a handoff for each handoff between two differentAPs. To calculate the percentage throughput improvement ofthe client, we consider the throughput obtained by the client30 seconds before and after the handoff and plot the difference.These values are plotted in Figure 15, where the handoffs eventsare ordered in the ascending order of the throughput improve-ment. Thex-axis represents individual handoff events and they-axis represents the percentage improvement in throughputas a result of the handoff. The graph indicates that about50% of the handoffs had a negative impact on the throughput.While 50% handoffs resulted in an increase in throughput,20% of these handoffs resulted in less than a 10% increasein throughput. These results indicate that a significant portionof the handoffs were not beneficial, and may even have beendetrimental. A reduction in unbeneficial handoffs will reduce theamount of management traffic, leading to greater transmissionopportunities for nodes with data packets and an increase inefficient medium utilization.
6.4 Vendor Handoff Analysis
Much of the handoff behavior discussed in the earlier sectionsdepends on the way the handoff mechanism is implemented bythe wireless card vendor. The IEEE 802.11 specification does
Fig. 16. Distribution of cards per vendor.
Fig. 17. Percentage of handoffs per vendor.
not specify the exact implementation of handoff mechanisms,leaving it to the vendor to implement efficient algorithms forhandoff triggers and AP selection. In this section, we investigatethe behavior of different cards to analyze whether the handoffbehavior observed is common among the different vendors orsimply a manifestation of bugs in a single vendor’s implemen-tation.
Over 600 unique cards were present in the plenary session.The breakdown of the cards based on the vendors is shownin Figure 16. Figure 17 shows a breakdown of the percentageof handoffs per vendor. Cards from different vendors exhibitedsimilar handoff behavior, with the exception of Apple cards.Apple cards experienced a low percentage of handoffs duringtheentire plenary. Figure 18 shows the prevalence of clients onthedominant AP, grouped by vendor. The figure shows that differentcards are relatively consistent in reassociation with the same APregardless of vendor; nearly 40% of the cards reconnect to thesame AP within five minutes.
Figure 19 shows the client persistence on the dominant AP.Consistent with earlier results, we see that up to 25% of usersessions were under a second and nearly half of these were underone minute. This behavior is consistent across the different cardvendors, with the exception of Apple. This result shows that,across vendors, there is a need for better handoff triggering andAP selection mechanisms. Since the Apple drivers are not open

Fig. 18. Client prevalence. Black indicates the percentageof clients that reconnect to the same AP within one minute.Grey indicates percentage of clients that reconnect withinfive minutes.
Fig. 19. Session length. Black indicates percentage ofclients whose session lengths were under 1s andgrey indicates the percentage of clients whose sessionlengths were under 1m.
source, we are unable to investigate why Apple cards performbetter than the other vendors.
7 CONCLUSION
The ease of deployment and low cost of infrastructure have ledto the rapid deployment of WLANs to provide network access tousers. Analysis of real world deployments are critical to identifydeficiencies in the 802.11 protocol and its implementations. Tothis effect, we collected data from the67th Internet EngineeringTask Force (IETF) meeting held in November 2006 in SanDiego CA. Through the analysis of this data, we have iden-tified the causes for high overhead in the transmission of dataframes. In particular, we have analyzed the unwanted link layertraffic that stems from mechanisms that initiate, maintain,andchange client-to-AP associations. We further show that clientshave short association times with the APs. This result is aconsequence of the current mechanisms that trigger a handoffunder conditions of high medium utilization and packet lossrate,even in the absence of client mobility. We analyze the traffictounderstand when handoffs occur and whether the handoffs werebeneficial or should have been avoided.
Observations made in this paper suggest that there is a needto design algorithms that are adaptive to network conditionsand usage. In particular, the frequency of keepalive messagesshould be lowered when the clients are stationary and when thenetwork congestion levels are high. Similarly, the periodic probe
requests must be reduced in stationary, congested networks. Ina network that is used heavily, a client may be able to leverageprobe responses transmitted to its neighbors. Thus, a mechanismin which a node passively monitors the probe responses in itsvicinity, and sends a request only when it does not detect anyneighbor responses, will help in reducing the probe traffic.
Finally, handoff mechanisms should be adaptive to conges-tion losses. Use of packet loss information to trigger hand-offs creates in a high rate of handoffs, even in the ab-sence of mobility. In the IETF network, a significant fractionof these handoffs were to the same AP, and thus unneces-sary. Further, many of the handoffs that occurred to otherAPs impacted the clients negatively. Schemes that use signalstrength trends to detect disconnection, and schemes that in-corporate network information such as load or loss rates, areneeded.
REFERENCES
[1] A. P. Jardosh, K. Mittal, K. N. Ramachandran, E. M. Belding, and K. C.Almeroth, “IQU: practical queue-based user association management forwlans,” in Proceedings of MobiCom, Sept. 2006, pp. 158–169.
[2] F. Ricciato, P. Svoboda, E. Hasenleithner, and W. Fleischer, “Unwantedtraffic in 3G networks,”SIGCOMM Computer Communication Review,vol. 36, no. 2, 2006.
[3] A. P. Jardosh, K. N. Ramachandran, K. C. Almeroth, and E. M. Belding-Royer, “Understanding Link-Layer Behavior in Highly Congested IEEE802.11b Wireless Networks,” inProceedings of EWIND, Philadelphia, PA,Aug. 2005, pp. 11–16.
[4] M. Rodrig, C. Reis, R. Mahajan, D. Wetherall, and J. Zahorjan,“Measurement-based characterization of 802.11 in a hotspot setting,” inProceedings of EWIND, Aug. 2005, pp. 5–10.
[5] A. P. Jardosh, K. N. Ramachandran, K. C. Almeroth, and E. M. Belding-Royer, “Understanding congestion in ieee 802.11b wirelessnetworks,” inProceedings of IMC, Berkeley, CA, Oct. 2005.
[6] R. Raghavendra, E. M. Belding, K. Papagiannaki, and K. C.Almeroth,“Understanding Handoffs in Large IEEE 802.11 Wireless Networks,” inProceedings of IMC, San Diego, CA, Oct. 2007.
[7] D. Tang and M. Baker, “Analysis of a local-area wireless network,” inProceedings of the ACM MobiCom, Boston, MA, Aug. 2000, pp. 1–10.
[8] D. Kotz and K. Essien, “Analysis of a campus-wide wireless network,” inProceedings of the ACM MobiCom, Atlanta, GA, Sept. 2002, pp. 107–118.
[9] D. Tang and M. Baker, “Analysis of a metropolitan-area wireless network,”Wireless Networking, vol. 8, no. 2/3, pp. 107–120, 2002.
[10] M. Balazinska and P. Castro, “Characterizing Mobilityand Network Usagein a Corporate Wireless Local-Area Network,” inProceedings of MobiSys,San Francisco, CA, May 2003, pp. 303–316.
[11] A. Balachandran, G. M. Voelker, P. Bahl, and P. V. Rangan, “Character-izing user behavior and network performance in a public wireless LAN,”in Proceedings of the ACM SIGMETRICS Conference, Marina Del Rey,CA, June 2002, pp. 195–205.
[12] T. Henderson, D. Kotz, and I. Abyzov, “The changing usage of a maturecampus-wide wireless network,” inProceedings of the ACM MobiCom,Philadelphia, PA, Sept. 2004, pp. 187–201.
[13] J. Yeo, M. Youssef, and A. Agrawala, “A framework for wireless LANmonitoring and its applications,” inProceedings of WiSe, Philadelphia, PA,Oct. 2004, pp. 70–79.
[14] P. A. K. Acharya, A. Sharma, E. M. Belding, K. C. Almeroth, andK. Papagiannaki, “Congestion-Aware Rate Adaptation in Wireless Net-works: A Measurement-Driven Approach,” inProceedings of SECON, SanFransisco, CA, Oct. 2008.
[15] R. Beyah, S. Kangude, G. Yu, B. Strickland, and J. Copeland, “Rogue ac-cess point detection using temporal traffic characteristics,” in Proceedingsof IEEE Globecom, Nov. 2004.
[16] A. Mishra, M. Shin, and W. A. Arbaugh, “An empirical analysis of theIEEE 802.11 MAC layer handoff process,”ACM SIGCOMM ComputerCommunication Review, vol. 33, no. 2, pp. 93–102, Apr. 2003.
[17] H. Velayos and G. Karlsson, “Techniques to reduce IEEE 802.11b handofftime,” in Proceedings of ICC, Paris, France, June 2004.

[18] H.-S. Kim, S.-H. Park, C.-S. Park, J.-W. Kim, and S.-J. Ko, “SelectiveChannel Scanning for Fast Handoff in Wireless LAN using NeighborGraph,” in Proceedings of ITC-CSCC, Sendai/Matsusima, July 2004, pp.303–316.
[19] I. Ramani and S. Savage, “SyncScan: Practical Fast Handoff for 802.11Infrastructure Network,” inProceedings of IEEE Infocom, Miami, FL, Mar.2005.
[20] V. Mhatre and K. Papagiannaki, “Using smart triggers for improved userperformance in 802.11 wireless networks,” inProceedings of MobiSys,June 2006, pp. 246–259.
[21] S. Vasudevan, K. Papagiannaki, C. Diot, J. Kurose, and D. Towsley,“Improved access point selection,” inProceedings of IMC, Oct. 2005.
[22] A. J. Nicholson, Y. Chawathe, M. Y. Chen, B. D. Noble, andD. Wetherall,“Improved access point selection,” inProceedings of MobiSys, June 2006,pp. 233–245.
[23] R. Mahajan, M. Rodrig, D. Wetherall, and J. Zahorjan, “Analyzing themac-level behavior of wireless networks in the wild,” inProceedings ofSIGCOMM, Sept. 2006, pp. 75–86.
[24] V. Paxson, “End-to-end routing behavior in the internet,” in Proceedingsof SIGCOMM, 1996, pp. 25–38.