unusual pre-oxidized polyacrylonitrile...
TRANSCRIPT
1
UNUSUAL PRE-OXIDIZED POLYACRYLONITRILE FIBRES BEHAVIOUR
AGAINST THEIR ACTIVATION WITH CO2: CARBONIZATION EFFECT
G. Trautwein*, M. Plaza-Recobert, J. Alcañiz-Monge
Dpto. Química Inorgánica, Universidad de Alicante, E-03080 Alicante, Spain
Abstract.
The CF-PAN activation process with CO2 has been analysed. Activation of CF-PAN
with CO2 leads to unusual results both, activation percentage evolution over the time
and generated porosity development. In the explanation has been highlighted the role of
the carbonization step in the CF-PAN activation process. The analysed results point to
the fact that part of the released nitrogen-containing compounds during PANOX fibres
carbonization are deposited on the CF surface, which affects to carbonized PAN fibres,
decreasing actives sites, or acting as inhibitors of the gasification reaction.
* Corresponding Author. Fax: +34 965909419. E-mail address:
Keywords: Polyacrylonitrile Carbon Fibres, Activated Carbon Fibres, Reactivity, CO2
Activation, Microporosity.

2
1. Introduction.
Using carbon fibres (CF) to prepare activated carbon fibres (ACF) becomes
interesting since they show several advantages regarding to conventional activated
carbons (AC) (granular, powder…) due to their higher performances, such as greater
adsorption capacity and higher adsorption/desorption velocities (Donnet et al. 1998, Ryu
1990, Ryu et al. 1993). In this sense, several studies are being carried out on the
preparation of activated carbon fibres or carbon clothes, mainly from rayon (Mcnair et al.
1997, Freeman et al. 1989), and coal tar pitch (Suzuki et al. 1994). In the case of rayon,
mechanical properties of the obtained fibres are low, as well as the yield (around 25 %
regarding to carbonization process). On the other hand, coal tar pitch shows higher yields
(around 70-80 % regarding to carbonization process) (Alcañiz-Monge et al. 1997) that
together with its lower cost, makes it an interesting material from which obtaining carbon
fibres. Some studies have demonstrated that physical activation (based on a controlled
gasification of the carbonaceous material) with CO2 is the most effective method to obtain
a higher microporosity development in the bulk of the coal tar pitch based CF (Alcañiz-
Monge et al. 1994, Alcañiz-Monge et al. 1997).
Regarding to CF based on polyacrylonitrile (PAN), compared to the above
mentioned precursors, their activation has been less studied because that leads to ACF
with lower adsorption capacities (Park et al 2001, Ko et al. 1992, Tavanai et al. 2009).
In spite of this, ACF based on PAN (CF-PAN), due to their structural nitrogen intrinsic
content, are interesting for applications such as gaseous pollutants and volatile organic
compounds adsorbents or basic catalysts (Mochida et al. 2000, Song et al. 2007, Zaini et

3
al. 2010). The best CF-PAN results have been obtained by chemical activation process,
while physical activation, especially with CO2 leads to low porosity values (600 m2/g
ACF-PAN Vs. 1800 m2/g ACF-Pitch)( Park et al. 2001, Ko et al. 1992, Tavanai et al.
2000, Wang et al. 1996).
Taking into account the above mentioned, the goal of this work is to study the
CF-PAN activation process with CO2, highlighting the role of the initial carbonization
step in the CF-PAN activation process.
2. Experimental.
2.1 Materials and Methods.
2.1.1 Carbonization of PANOX fibres
In this work, pre-oxidized commercial PAN fibres PANOX® (SGL
TECHNOLOGIES GmbH) were employed (the use of pre-oxidized PAN fibres
instead PAN fibres is intended to prevent melting or fusion of fibres in the
subsequent carbonization step) (320k filaments, with a fibre´s density of 1.39 g/cm3,
230 MPa of tensile strength). Fibres were carbonized in a quartz reactor, with 6 cm of
internal diameter and 150 cm of length, placed inside of a horizontal oven (contained in
N2 (100 cm3/min) at two different temperatures, 850 and 1000 ºC, with a 10 ºC/min
heating rate and hold for 30 minutes at the maximum carbonization temperature. In

4
these experiments, the effect of the final carbonization temperature and the amount of
matter used on the final CF-PAN yield were analysed.
2.1.2. Activation of CF-PANs.
With the aim to compare the results of the present work with those obtained by
other authors on the petroleum pitch carbon fibres (CFP) activation, the activation was
realized at 890 ºC (Alcañiz-Monge et al. 1994, Vilaplana-Ortego et al. 2008). CF-PANs
(1 gram) were activated in a horizontal oven applying the following thermal treatment:
heated in N2 flow (100 cm3/min, superficial gas velocity of 3.4 cm3/min, at 1 bar and 25
ºC) to 890 ºC, switched to CO2 flow (100 cm3/min) and hold at this temperature for
different periods of time. Additionally, the experiments were realized using water
vapour stream (H2O/N2 40/40 cm3/cm3). The burn-off percentage (BO) was determined
by mass balance. In the nomenclature of the activated samples both, the BO and the
activation agent are indicated (CO2–C, H2O–S) (i.e. CFPAN activated with CO2 and 47
% BO, CFPAN47C).
2.2 Characterization.
The PANOX fibres carbonization process together with released gases was
studied by thermogravimetric analysis and mass spectrometry (TG-MS), respectively,
with a TA-SDT 680 instrument. For that, 10 mg of PANOX fibres were placed in the
thermobalance and subjected to a thermal treatment in He atmosphere (60 cm3/g), with a

5
gas output coupled to a quadrupolar mass spectrometer (Balzers Quadstar model). The
temperature program used was the following: heated to 1000 ºC at 20 ºC/min. This
allowed analysing the weight loss and the evolved gases by the PANOX fibres
decomposition.
The carbon, nitrogen and hydrogen content of the original PANOX fibres, the
CF and the ACF was determined using a Carlo Erba EA 1110CHNS-O instrument,
while the oxygen content was estimated from the previous values, taking into account
that other heteroatoms do not exist in the fibres.
The nature of the CF-PAN surface before and after the activation was analysed
by X-ray photoelectron spectroscopy (XPS). XPS experiments were realized at room
temperature in high vacuum conditions (5.10-8 bars) with a VG-Microtech Multilab
3000 instrument. This instrument consists of a monochromatic X-Ray radiation source
Mg-Kα (1253.6 eV). For energy calibration, it was selected as reference the 1s carbon
transition belonging to graphite, which value is 284.6 eV (Wang et al. 1994). Atomic
ratios were estimated from the relative ratio between XPS spectra peak areas, corrected
by an intensity factor calculated using the Scofield method (Scofield et al. 1976).
Porous texture of the ACF was characterized by gas physical adsorption (N2 at -
196 ºC and CO2 at 0 ºC) (Autosorb 6-B and Autosorb-6, respectively). Before realizing
the adsorption tests, the samples were treated by vacuum at 250 ºC during 4 hours. The
surface area was determined by BET equation (Brunauer et al. 1938). Dubinin-
Radushkevich equation (DR) (Dubinin et al. 1966) was employed to calculate the pore

6
volume distribution (Cazorla-Amorós et al. 1996): a) narrow micropore volume (pore
size < 0.7 nm), called ultramicropores, VCO2, was estimated from CO2 DR plots (relative
pressures < 0.015); (b) total micropore volume (pore size < 2nm), VN2, was calculated
from N2 DR plots (relative pressures < 0.14).
3. Results and Discussion.
3.1. Carbonization of PANOX fibres.
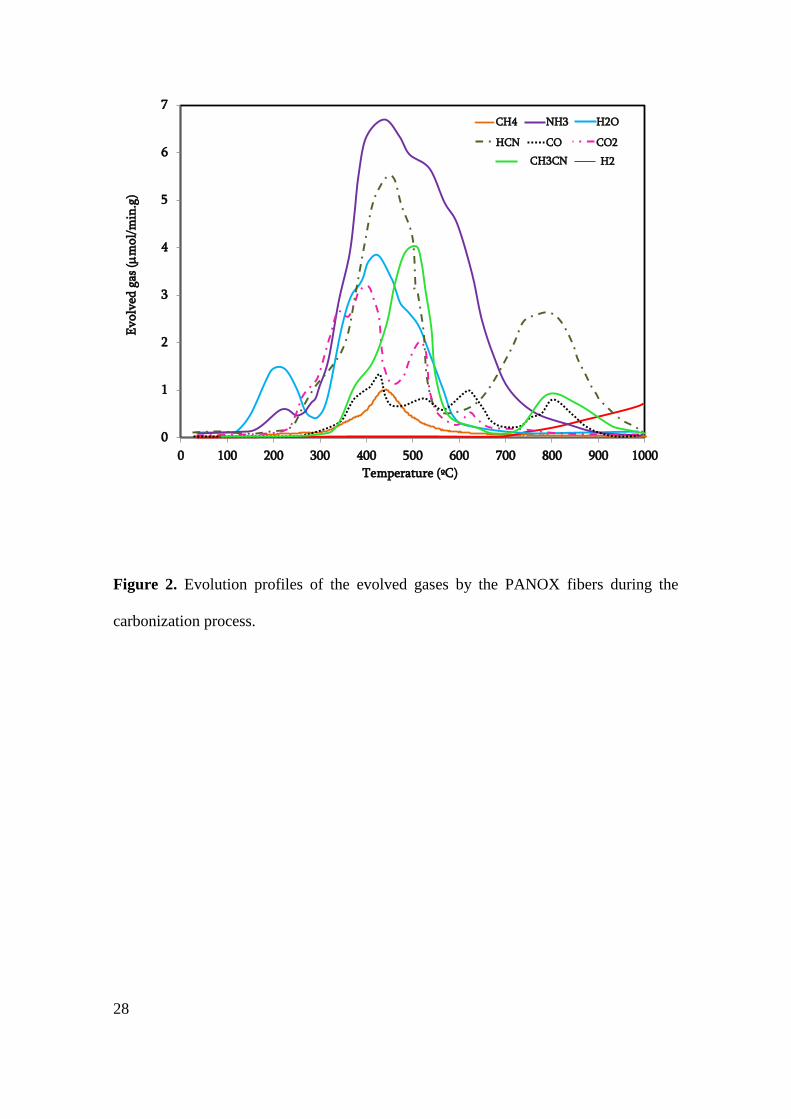
Figures 1 and 2 show the TG curve and the profile of the released gases,
respectively. It must be pointed out that, the thermal treatment of the PAN fibres has
been extensively studied due to the final mechanical features of the obtained CF are
hardly dependent of the conditions in which it is realized. Therefore, and taking into
account that it is not the main goal of this work and the existence of a wide literature
about it (Fitzer et al. 1986, Rahaman et al. 2007, Yusofa et al. 2012), a strict analysis
of the results presented in Figures 1 and 2 will not be realized. In summary, PANOX
fibres carbonization produces an important loss of mass, higher than 50 % (Figure 1),
which takes place mainly through the volatile release, above all as oxygen-containing
compounds (CO, CO2, H2O) and nitrogen-containing compounds (NH3, HCN, CH3CN)
(Figure 2), which leads to a carbon enrichment of the final CF.
As can be observed in Figure 1, the volatile release takes place in three stages (Jing et
al. 2007, Wangxi et al. 2003). In the first stage, at 200-350 ºC, cross-linking reactions
between oxidized PAN polymer chains take place, through radicals generated by the
7
decomposition of terminal oxygen-containing and nitrogen containing groups (Figure
2). In the second stage, at the region of 350-550 ºC, it takes place an important pyrolytic
decomposition, mainly of PAN fibres or fragments of these, which have not been able to
stabilize themselves by cross-linked bonds. In this way, a large amount of nitrogen-
containing compounds together with oxygen-containing groups, mainly CO2 and H2O,
which were originated in the oxidation process of the PAN fibres to obtain the stabilized
PANOX fibres, are produced, (Figure 2). As a consequence of these decompositions, a
large amount of radicals is generated. At the same time, a rearrangement of the linear
molecular segments takes place, leading to cyclization reactions, developing planar
carbonaceous structures, which will lead to an aromatization process of the
carbonaceous structure which begins to take place in the third stage, at 550-700 ºC. For
temperatures higher than 600 ºC, condensation reactions between heterocyclic rings
happens, releasing gases like HCN and NH3 (Park et al. 2001). When the temperature
exceeds 700 ºC, it takes place a higher structure aromatization, through dehydrogenation
and denitrogenation reactions (HCN and N2), and the growing of aromatic structures
(Mittal et al. 1998, Watt et al. 1985).
Taking into account the above commented and that up to 850 ºC it does not take
place an important loss of mass, the carbonization process was realized at 1000 ºC, as
usual when active carbon precursors are used. Furthermore, taking into account the loss
of mass that takes place during the carbonization process and the CO2 activation, it turns
out important to use an amount of sample as large as possible. Therefore, the effect of
the initial fibres amount on the final yield at two different temperatures was studied.
The obtained results are presented in Table 1.

8
Table 1. Carbonization yield (% weight)
As can be appreciated, the obtained results with a small amount, 1 gram, are
similar to that obtained by TG (10 mg) (Fig. 1). This fact indicates, as was expected,
that there are not diffusive problems for the output of the pyrolytic decomposition
products. The higher the fibres amount, the higher the packing of them. In these
conditions, the output of the volatile compounds is more hindered. As a consequence, a
higher yield was obtained. However, this effect is restricted to a certain amount.
Therefore, up to 10 grams it can be observed a yield rise (7 %), which is quite similar to
that obtained with double amount. Finally, it must to be pointed out that this increase of
the yield takes place for temperatures below 850 ºC, since for higher temperatures the
losses are quite similar regardless of the employed amount (6 %). This result is in
agreement with the volatile amount released, which takes place mainly at temperatures
below 850 ºC (Fig. 2), supporting the hypothesis that the increase of the yield should be
related to the greater difficulty in volatiles release.
At this point, it will be analysed the reason of the above mentioned increase of
the yield. To do that, it was determined the elemental composition of both, the
superficial (XPS) and the whole fibres (elemental analysis). Results are shows in Table
2.
Grams Temperature (ºC)
850 1000
1PAN 1 50 44
5PAN 5 52 47
10PAN 10 57 51
20PAN 20 58 52

9
Table 2. Global elemental analysis (% weight) and superficial (% at) determined by
XPS of the original PANOX fibres and carbonized at 1000 ºC
a values in parenthesis are referred to atomic percentage calculated respect to
(C+N+O)at
As expected, comparing PANOX values with those obtained with 1PAN fibres,
the carbonization process leads to carbon enrichment and a decrease of the rest of
heteroatoms, especially nitrogen. This fact is in agreement with released volatiles
compounds (Figure 2). The carbonization process of large amount of PANOX fibres
affects mainly the nitrogen content of resulting CF. This effect could be attributed to
lower nitrogen-containing compounds decomposition, as a consequence of the increase
in the vapour pressure that takes place when the amount of volatile compounds is
released. However, XPS results evidence that this is not the reason. So, while for CF
1PAN the nitrogen content on the surface is similar to the whole value, which indicates
that N is homogeneously distributed in the bulk of the fibres; CF 10PAN and 20PAN
XPS results show higher nitrogen values, the greater, the greater is the carbonized
amount. These results indicate that a nitrogen superficial enrichment during the fibres
carbonization process has happened, which should be attributed to a solid nitrogen
enriched deposit formation on the surface of the carbonized PANOX fibres. The
development of these kinds of superficial deposits, described by other authors, happens
Global (% weight) Superficial (XPS) ( % at)
Ca Na Oa H C N O
PANOX 62.5 (69.6) 16.4 (15.7) 17.6 (14.7) 3.5 65.7 13.7 20.6
CF 1PAN 83.4 (88.1) 2.7 (2.4) 12 (9.5) 1.9 86.1 2.7 11.2
CF 10PAN 84.2 (88.5) 4.0 (3.6) 10 (7.9) 1.8 85.7 5.2 9.1
CF 20PAN 84.8 (89.0) 4.4 (4.0) 9 (7.1) 1.8 85.3 6.5 8.2
10
as a consequence of secondary reactions between the released volatile compounds or
between the last with radicals generated on the surface of the carbonized (Megaritis et
al. 1998, Messenböck et al. 1999, Froment et al. 1990). The above considerations allow
explaining the nitrogen superficial enrichment and the obtained yield.
3.2. CF-PAN activation.
Taking into account the higher yield obtained at 1000 ºC using 10 grams of
PANOX, CF were prepared under these conditions for studying their activation with
CO2 (10PAN). CF 10PAN activation results, together with the bibliographic CFP results
(Alcañiz-Monge et al. 1994, Vilaplana-Ortego et al. 2008), are showed in Figure 3. The
figure includes the results of the CF 1PAN activation, as well as those obtained from
two consecutive 10 PAN activations, which description will be detailed throughout this
section.
As it can be appreciated, CF prepared from different precursors show differences
in their burn-off percentage evolution. So, initially, CFP show a high activation rate
(obtained from the slope), indicating a high reactivity towards CO2 gasification process,
which decreases in accordance with the CF activation process. This behaviour, typical of
carbonization activation processes, is related to a decrease in the number of active sites
present on the surface of the carbonized, (superficial oxygen-containing groups and
defects in the graphitic sheets) according to the material gasification development
(Chiang et al. 2007). The behaviour of the CF 10PAN is completely opposite. Therefore,
initially (1 hour), it shows a low activation rate, indicating an initial CF 10PAN low

11
reactivity (5 % BO vs 15 % BO of CFP). However, the higher the activation time, the
higher the slope of the activation percentage curve, whereas that of CFP shows a similar
slope for all activation times. So that, for activation percentages higher than 20 %, CF
10PAN show a reactivity higher than that showed by CFP (denoted by a higher slope of
the activation curve). This behaviour is usually observed in reactions where exist inactive
species, metallic catalysts or metallic oxides, which are activated during the reaction
(Boehm et al. 1970). In this case, the increase cannot be attributed to this effect since
there are not metallic species in PANOX fibres. Therefore, the observed tendency could
take place as a consequence of: a) initial inaccessibility of CO2 to the active sites, b) the
nature of the superficial groups existing on the surface of these materials (nitrogen-
containing groups (Chiang et al. 2007), which confer them this different behaviour).
Another striking result for the CF 10PAN was found when the ACF obtained
from those were again activated; with the aim to take an advantage of ACF 10PAN,
which were barely activated (i.e. ACF obtained after 2h of activation, with 10 % BO),
these were subjected to a second activation (at different times, 3h and 5h). In contrast to
that expected, ACF reactivity was significantly increased (Figure 3, Second series). In
addition, it was observed that this behaviour was depending on the ACF activation
degree. Therefore, additional activation of 2 hours with greater activation degree than
previous (obtained after 5 hours with 33 % BO), led to a BO percentage correlated to
the above mentioned tendencies (Figure 3, Second series). For comparative purposes,
the figure includes the global BO % (referred to initial amount) of ACF which have
been subjected to two activations. From these values it can be appreciated that can be

12
obtained ACF with different BO percentages, in spite of being subjected to the same
global activation time (7 hours).
The CF 1PAN activation obtained results (obtained from a small amount during
the carbonization process) will help us to explain the previous results. As can be
observed in Figure 3, CF 1PAN show an elevated initial reactivity, which decreases
slightly in accordance with the sample activation, comparable with that showed by ACF
10PAN in their second activation. This different behaviour, as well as the increased
activity observed in ACF 10PAN after a second activation, should be directly related to
different PANOX fibres carbonization conditions, which ultimately, should affect to CF
active sites. In Table 3 are listed the results obtained for ACF which similar activation
percentage (close to 35% BO) by XPS and elemental analysis. Table includes, for
comparative purposes, results above mentioned for CF 10PAN (Table 2).
Table 3. Elemental analysis (% weight) and superficial composition (% at) determined
by XPS for CF 10PAN and ACF (≈35 % BO) obtained from different CF in increasing
carbonization order; 1PAN, 10PAN and 20PAN, respectively.
a values in parenthesis % atomic. Calculated respect to (C+N+O)at
Global (% weight) Superficial (XPS) ( % at)
Ca Na Oa H C N O
CF 10PAN 84.2 (88.5) 4.0 (3.6) 10 (7.9) 1.8 85.7 5.2 9.1
ACF 1PAN 81.9 (86.4) 1.6 (1.4) 15.3 (12.1) 1.2 78.4 1.6 20
ACF 10PAN 82.0 (86.5) 2.3 (2.1) 14.5 (11.5) 1.2 80.6 1.9 17.5
ACF 20PAN 82.4 (86.7) 2.5 (2.3) 14 (11.0) 1.1 81.9 2.1 16
13
Observed differences between original CF and ACF and between CF 10PAN
and ACF 10PAN are in agreement with those expected (Boehm et al. 1970, Raymundo-
Piñero et al. 2000): oxygen enrichment, as superficial oxygen-containing groups, which
is confirmed by higher atomic ratio obtained by XPS. Much more significant for this
work is the similitude between values showed by ACF, especially those referred to
nitrogen content. Therefore, it can be observed as the nitrogen content decreases
considerably after activation (compare Table 2 and Table 3 results), showing lower
nitrogen contents on the ACF surface, as can be deduced from XPS results.
Therefore, it should be reasonable to think that nitrogen-containing compounds
deposition on the ACF surface (without discarding a certain pyrolytic carbon fraction)
(Table 2) block active sites, decreasing for 1PAN samples. The gradual CF 10PAN
reactivity´s increase can be explained considering that the activation removes nitrogen-
containing compounds from the surface (Figure 3). Nevertheless, the considerable
reactivity´s increase observed after the first activation process, independently of ACF
BO (i.e. 10-33%) does not match with the active sites blockage. It also must be
mentioned the result obtained after a double activation (2+3 hours) without removing
ACF from the oven after the first one (after 2 hours, the oven was cooled to room
temperature applying a N2 stream and afterwards ACF were heated and activated for 3
hours more). In this case there was not observed any change on the CF reactivity,
despite being similar to 5 hours simple activation process (Figure 3). This highlights
that ACF are affected by the atmosphere exposure. In this sense, taking into account the
air exposure, it seems to be reasonable thinking that the nitrogen-containing compounds
removal is favoured by their interaction with environmental moisture.
14
With the aim to deepen this aspect, CF 10PAN activation in water/nitrogen
(H2O/N2) stream was realized. Obtained results are showed in Figure 4, which also
contains bibliographic results obtained from a CFP in similar experimental conditions.
For CFP, it can be observed as H2O (v) reactivity is three time higher than that observed
for CO2 despite the first one pressure is half than the last, which is in agreement with
that observed by other authors (Alcañiz-Monge et al. 1994, Walker et al. 1959, Rhyu et
al. 1993). The CF 10PAN activated with H2O leads to high BO % from the beginning of
the reaction, which indicates the CF 10PAN reactivity is much higher than PCF. In fact,
several studies have indicated the catalytic nitrogen-containing compounds effect for
certain reactions (Raymundo-Piñero et al. 2003). By one side, this fact is in
disagreement with the low reactivity observed against CO2, and by other one, it supports
the hypothesis of the increase on the CF PAN activation after a second activation. In
this sense, the low reactivity observed in this work would be in accordance with the
results obtained by other authors regarding to the inhibitor effect of nitrogen
incorporation on microcrystalline carbons oxidation (Mang et al. 1992).
To conclude with this section, the analysed results point to the fact that part of
the released nitrogen-containing compounds during PANOX fibres carbonization are
deposited on the CF surface, which affects to carbonized PAN fibres, decreasing actives
sites or acting as inhibitors of the gasification reaction. Once eliminated, a considerable
increase on the CF 10PAN reactivity is produced, comparable to that observed for CF
1PAN, on which a scarcely deposit takes place.
15
3.3. ACF PAN porous texture characterization.
Regarding to their potential applications, the porosity of the ACF is their most
important property. For that reason, the porous texture of ACF and CF 10PAN was
analysed by physical gas adsorption technique (N2 a -196 ºC y CO2 a 0 ºC). Figure 5
shows the obtained N2 isotherms.
Regarding to the isotherm shape analysis, it must be remarked the following
aspects: i) the adsorption magnitude at P/Po < 0.3, which is related to specific micropores
volume, ii) the isotherm knee, related to micropore size distribution, iii) adsorption at P/Po
> 0.3 and iv) the presence of an hysteresis cycle, which indicates mesopore presence. CF
10PAN do not show N2 adsorption isotherm, indicating that the sample is not porous or the
presence of narrow microporosity (pore size < 0.7 nm) where N2 adsorption does not take
place. On the other hand, all of ACF show adsorption at low relative pressures (< 0.3),
which is characteristic of Type I isotherms, according to IUPAC classification (Sing et al.
1985). This indicates the essentially microporous nature of ACF-PAN, as has been
observed in previous works (Park et al. 2001, Ko et al. 1992, Tavanai et al. 2009, Wang
et al. 1996). The most interesting aspect of this chapter is the microporosity development
given by the activating agents. Therefore, for low BO %, both activating agents produce
similar isotherms regarding to the adsorbed N2 amount and the shape. For samples with
medium BO % (close to 50 %), there are some differences between both series. So, while
water vapour stream activation mainly produces new microporosity, as can be observed in
the increase of the adsorption capacity at P/Po < 0.1, activation with CO2 leads to a
microporosity widening, as can be deduced from de wide knee of the isotherm. This
16
behaviour is opposite to that observed in CF and ACF with other precursors, using both
activating agents (Alcañiz-Monge et al. 1994, Cazorla-Amorós et al. 1996, Vilaplana-
Ortego et al. 2008, Rhyu et al. 1993). For high BO % values, activation with both agents
is similar, since there is any porosity generation. This fact indicates that it takes place the
outer burning of ACF. This result has been observed by other authors and it is related to
the microporosity collapse for higher BO % values (Rhyu et al. 1993).
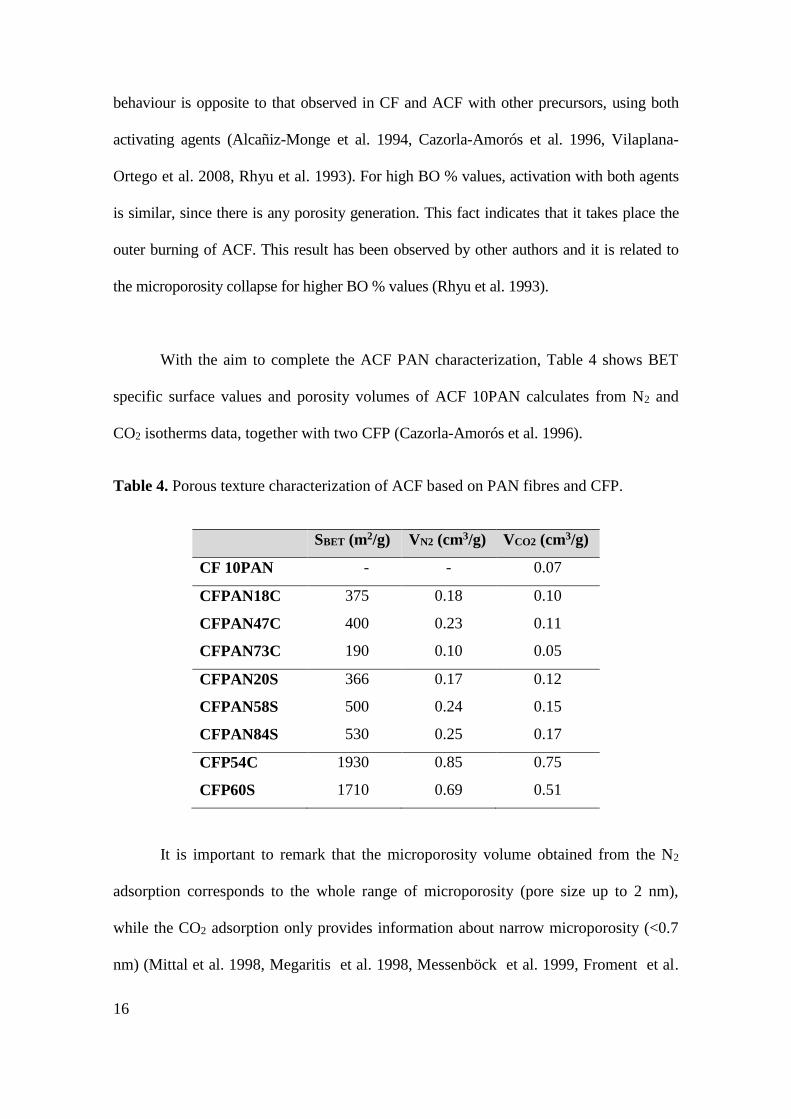
With the aim to complete the ACF PAN characterization, Table 4 shows BET
specific surface values and porosity volumes of ACF 10PAN calculates from N2 and
CO2 isotherms data, together with two CFP (Cazorla-Amorós et al. 1996).
Table 4. Porous texture characterization of ACF based on PAN fibres and CFP.
SBET (m2/g) VN2 (cm3/g) VCO2 (cm3/g)
CF 10PAN - - 0.07
CFPAN18C 375 0.18 0.10
CFPAN47C 400 0.23 0.11
CFPAN73C 190 0.10 0.05
CFPAN20S 366 0.17 0.12
CFPAN58S 500 0.24 0.15
CFPAN84S 530 0.25 0.17
CFP54C 1930 0.85 0.75
CFP60S 1710 0.69 0.51
It is important to remark that the microporosity volume obtained from the N2
adsorption corresponds to the whole range of microporosity (pore size up to 2 nm),
while the CO2 adsorption only provides information about narrow microporosity (<0.7
nm) (Mittal et al. 1998, Megaritis et al. 1998, Messenböck et al. 1999, Froment et al.

17
1990). Hence, the comparison of both, VCO2 and VN2, gives us an idea about the size of
the ACF micropores. Firstly, it is important to highlight the existence of a microporosity
in CF 10PAN, which shows CO2 adsorption but is not affected by N2 adsorption (Figure
5). This behaviour is owed to the existence of restrictions, which hinder the N2 diffusion
in the microporosity bulk (Fitzer et al. 1986, Rahaman et al. 2007). This behaviour has
been observed in other PCF and for carbonized (Cazorla-Amorós et al. 1996, Rahaman
et al. 2007; Rhyu et al. 1990). The total and narrow microporosity volumes ACF
evolution, (VN2) and (VCO2) respectively, are in agreement to N2 isotherm discussion
above commented. For this reason, CO2 activation hardly develops microporosity,
focusing on its widening, increasing VN2 and VCO2 difference, while water vapour
activation leads to a continuous increase of the narrow microporosity, VCO2. Finally, it is
important to remark that water vapour activation produces ACF with a higher porous
texture development, as much in BET surface as microporosity volume. However, the
obtained values are relatively lower than those obtained from CFP under the same
experimental conditions.
As a resume, obtained results highlight differences between CO2 and H2O CF
10PAN activation. These differences are observed in both, the reactivity of activating
agents towards the CF 10PAN gasification process and the CF porosity development.
Comparing results of the present work to those found in the bibliography it can be
conclude that CO2 activation leads to unusual results.
The explanation of the unusual CO2 activation process should be related to the
active sites blockage by nitrogen-containing compounds pyrolytic deposit development,

18
which, taking into account the obtained results, are resistant to the attack of CO2
molecule, so not towards H2O molecule. Considering as correct the CO2 reactivity
towards nitrogen-containing deposits, it can be established how the CF 10PAN
activation process takes place: initially CO2 activation takes place mainly in the
available active sites, free of nitrogen-containing deposits. Therefore, the gasification
process located in these places initially produces microporosity. As the activation
progresses the availability of free nitrogen-containing active sites decreases (Figure 3,
reactivity remains at the same value). So, the activation process continues in the
previously generated micropores. Therefore, the CO2 activation is focused on widening
the original microporosity, producing its collapse at high BO % values.
4. Conclusions
Activation of CF PAN with CO2 leads to unusual results both, activation
percentage evolution over the time and generated porosity development. Therefore, it
initially shows a low activation rate, which increases in the same way of activation
percentage. Much more remarkable is the ACF reactivity´s increase observed after the
second activation. By other hand, the CO2 activation scarcely produces development of
the microporosity focusing on the widening of that, while with water vapour activation
it takes place a continuous narrow microporosity development.
Explanation to the unusual process which takes place under CO2 activation
arises from the PANOX fibres carbonization process. Therefore, the high amount of

19
nitrogen-containing compounds released during the carbonization process makes
possible pyrolytic deposition of these volatile compounds on the surface of fibres,
which leads to both, N superficial enrichment and an increase in the carbonization yield.
In the same way, it produces a decrease in the reactivity of the CF due to the active sites
blockage as a consequence of the nitrogen-containing compounds pyrolytic deposit
development. In addition, these compounds are resistant to CO2 attack, so not towards
H2O.
Acknowledgements.
The authors thank the Generalitat Valenciana and FEDER (PROMETEO2/2014/010),
and MICINN and Plan E (CTQ2012-31762) for the financial support.
5. References
Alcañiz-Monge, J., Cazorla-Amorós, D., Linares-Solano, A., Oya, A., Sakamoto, A.,
Hoshi, K.: Preparation of general purpose carbon fibres from coal tar pitches with low
softening point. Carbon 35, 1079-1087 (1997).
Alcañiz-Monge, J., Cazorla-Amorós, D., Linares-Solano, A., Yoshida, S., Oya, A.: Effect
of the activating gas on tensile strength and pore structure of pitch-based carbon fibres.
Carbon 32, 1277-1283 (1994).
20
Alcañiz-Monge, J., Cazorla-Amorós, D., Linares-Solano, A.: Production of activated
carbons: use of CO2 versus H2O as activating agent. A reply to a letter from P. L. Walker
Jr. Carbon 35, 1665-1668 (1997).
Brunauer, S., Emmett, P.H., Teller, E.: Adsorption of gases in multimolecular layers. J.
Am. Chem. Soc. 60, 309 (1938).
Boehm, H.P., Voll, M.: Basische Oberflächenoxide auf Kohlenstoff—I. Adsorption von
säuren. Carbon. 8, 227 (1970).
Cazorla-Amorós, D., Alcañiz-Monge, J., Linares-Solano, A.: Characterization of
activated carbon fibres by CO2 adsorption. Langmuir. 12, 2820 (1996).
Chiang, Y.C., Lee, C.Y., Lee, H.C.: Surface chemistry of polyacrylonitrile- and rayon-
based activated carbon fibres after post-heat treatment. Mat. Chem. Phys. 101, 199–210
(2007).
Donnet, J.B., Rebouillat S, Wang T.K., Peng, J.C.M. :Carbon Fibres (3rd Edition).
Marcel Dekker, New York (1998).
Dubinin, M.M.: Chemistry and Physics of Carbon, Vol. 2. Marcel Dekker, New York
(1966).
21
Fitzer, E., Frohs, W., Heine, M.: Optimization of stabilization and carbonization
treatment of PAN fibres and structural characterization of the resulting carbon fibres.
Carbon. 24, 387–395 (1986).
Freeman, J., Gimblett, F.G.R., Sing, K.I.W.: Studies of activated charcoal cloth. V.
Modification of pore structure by impregnation with certain transition metal salts and
oxo-complexes. Carbon 27, 85-93 (1989).
Froment, G.F.: Coke Formation in the Thermal Cracking of Hydrocarbons. Rev. Chem.
Eng. 6, 293−328 (1990).
Jing, M., Wang, C., Wang, Q., Bai, Y., Zhu, B.: Chemical structure evolution and
mechanism during pre-carbonization of PAN-based stabilized fibre in the temperature
range of 350–600 °C. Polym. Degrad. Stab. 92, 1737–1742 (2007).
Ko, T.H., Chiranairadul, P., Lu, C.K., Lin, C.H.: The effects of activation by carbon
dioxide on the mechanical properties and structure of PAN-based activated carbon
fibres. Carbon 30, 647–655 (1992).
a) Laine, N.R., Vastola, F.J., Walker, P.L.: The importance of active surface area in the
carbonoxygen reaction. J. Phys. Chem. 67, 2030–2034 (1963). b) Floess, J.K.,
Longwell, J.P., Sarofim, A.F.: Intrinsic reaction kinetics of microporous carbons. 1:
Noncatalyzed chars. Energy & Fuels. 2, 18-26 (1988).

22
Liu, J., Wang, P.H., Li, R.Y.: Physical modification of polyacrylonitrile precursor fibre:
Its effect on mechanical properties. J. Appl. Polym. Sci. 52, (1994) 945–950.
Mang, D., Boehm, H.P., Stanczyk, K., Marsh, H.: Inhibiting effect of incorporated
nitrogen on the oxidation of microcrystalline carbons. Carbon 30, 391-398 (1992).
Mcnair, R.N., Arons, G.N.: Carbon Adsorption Handbook, cap. 22, 819. Ann Arbor
Science Pub., Ann Arbor, Mich., 1977.
Megaritis, A., Messenböck, R.C., Collot, A.G., Zhuo, Y., Dugwell, D.R., Kandiyoti, R.:
Internal consistency of coal gasification reactivities determined in bench-scale reactors:
effect of pyrolysis conditions on char reactivities under high-pressure CO2. Fuel 77,
1411-1420 (1998).
Messenböck, R.C., Dugwell, D.R., Kandiyoti, R.: CO2 and steam-gasification in a high-
pressure wire-mesh reactor: the reactivity of Daw Mill coal and combustion reactivity of
its chars. Fuel 78, 781-793 (1999).
Mittal, J., Konno, H., Inagaki, M., Bahl, O.P.: Denitrogenation behavior and tensile
strength increase during carbonization of stabilized pan fibres. Carbon 36, (1998) 1327-
1330.

23
Mochida, I., Korai, Y., Shirahama, M., Kawano, S., Hada, T., Seo, Y., Yoshikawa, M.,
Yasutake, A.: Removal of SOx and NOx over activated carbon fibres. Carbon. 38, 227–
239 (2000).
Park, J., Kim, K.D.: Influence of activation temperature on adsorption characteristics of
activated carbon fibre composites. Carbon 39, 1741–1746 (2001).
Rahaman, M.S.A., Ismail, A.F., Mustafa, A.: A review of heat treatment on
polyacrylonitrile fibre. Polym. Degrad. Stabil. 92, 1421-1432 (2007).
Raymundo-Piñero, E., Cazorla-Amorós, D., Linares-Solano, A.: The role of different
nitrogen functional groups on the removal of SO2 from flue gases by N-doped activated
carbon powders and fibres. Carbon 41, 1925-1932 (2003).
Raymundo-Piñero, E., Cazorla-Amorós, D., Salinas-Martínez de Lecea, C., Linares-
Solano, A.: Factors controling the SO2 removal by porous carbons: relevance of the
SO2 oxidation step. Carbon 38, 335-344 (2000).
Santos Silva, I., Palma, C., Lemos, F., Ramôa Ribeiro, F., Sousa Lobo, L.: Non catalytic
carbon gasification modeling. Dynamics of Surfaces and Reaction Kinectics in
Heterogeneous Catalysis, in Studies in Surfaces Sciences and Catalysis. (eds.) Froment,
G.F., Waugh, K.C., pp. 535-540. Elsevier Science (1997).
24
Scofield, J.H.: Hartree-Slater subshell photoionization cross-sections at 1254 and 1487
eV. J Electron Spectrosc Relat Phenom. 8, 129–137 (1976).
Sing, K.S.W., Everett, D.H., Haul, R.A.W., Moscou, L., Pierotti, R.A., Rouquerol, J.,
Siemieniewska, T.: Reporting physisorption data for gas/solid systems with special
reference to the determination of surface area and porosity. Pure Appl. Chem. 57, 603
(1985).
Song, Y., Qiao, W., Yoon, S.H., Mochida, I., Guo, Q., Liu, L.: Removal of
formaldehyde at low concentration using various activated carbon fibres. J. Appl.
Polym. Sci. 106, 2151–2157 (2007).
Stejskal, J., Gilbert, R.G.: Polyaniline. Preparation of a conducting polymer. Pure Appl.
Chem. 74, 857–867 (2002).
Suzuki, M.: Activated carbon fibre: Fundamentals and applications. Carbon 32, 577-586
(1994).
Tavanai, H., Jalili, R., Morshed, M.: Effects of fibre diameter and CO2 activation
temperature on the pore characteristics of polyacrylonitrile based activated carbon
nanofibres. Surf. Interface Anal. 41, 814–819 (2009).
Vilaplana-Ortego, E., Maciá-Agulló, J.A., Alcañiz-Monge, J., Cazorla-Amorós, D.,
Linares-Solano, A.: Comparative study of the micropore development on physical
25
activation of carbon fibres from coal tar and petroleum pitches. Micropor. Mesopor.
Mat. 112, 125–132 (2008).
Walker, P.L., Rusinko, F., Austin, L.G.: Gas Reactions of Carbon. Adv.Catal. 11, 133-
221 (1959).
Wang, T., Sherwood, P.M.A.: X-ray Photoelectron Spectroscopic Studies of Carbon
Fibre Surfaces. 17. Interfacial Interactions between Phenolic Resin and Carbon Fibres
Electrochemically Oxidized in Nitric Acid and Phosphoric Acid Solutions, and Their
Effect on Oxidation Behavior. Chem Mater. 6, (1994) 788–795.
Wang, P.H., Yue, Z.R., Liu, J.: Conversion of polyacrylonitrile fibres to activated
carbon-fibres - effect of activation. J. Appl. Polym. Sci. 60, 923–929 (1996).
Wangxi, Z., Jie, L., Gang, W.: Evolution of structure and properties of PAN precursors
during their conversion to carbon fibres. Carbon 41, 2805–2812 (2003).
Watt, W. — Chemistry and physics of conversion of PAN fibres into high-modulus
carbon fibre. Strong fibre, vol.1. (eds.) Watt, W., Perov, B.B., p. 327, Elsevier Science
Publishers, Netherlands (1985).
Ryu, S.K., "Porosity of Activated Carbon Fibre". High Temperature - High Pressure.
22,345-354 (1990).

26
Ryu, S.K., Jin, H.K., Gondy, D., Pusset, N., Ehrburger, P.,"Activation of Carbon Fibres
by Steam and Carbon dioxide". Carbon. 31, 841-842 (1993).
Ryu, S.K., Lee, J.K., Lee, D.W., Pusset, N., Ehrburger, P., "Adsorption Characteristics
of Activated Pitch-based Carbon Fibres". Carbon'90, Paris, France, July 16-20 (1990).
Ryu, S.K., Ko, K.Y., Rhee, B.S., Ehrburger, P., "Density and Pore Volume of Activated
Carbon Fibres". Proc. 21st Biennial Conf.on Carbon, June 13-18, Buffalo, USA, 623
(1993)
Yusofa, N., Ismail, A.F.: Post spinning and pyrolysis processes of polyacrylonitrile
(PAN)-based carbon fibre and activated carbon fibre: A review. J. Anal. Appl. Pyrol.
93, 1–13 (2012).
Zaini, M.A.A., Amano, Y., Machida, M.: Adsorption of heavy metals onto activated
carbons derived from polyacrylonitrile fibre. J. Hazard. Mater. 180, 552–560 (2010)

27
Figure 1. Thermogravimetric curve of the original PANOX fiber.
40
50
60
70
80
90
100
0 100 200 300 400 500 600 700 800 900 1000
Rem
ain
ing
mas
s (w
t %
)
Temperature (ºC)
28
Figure 2. Evolution profiles of the evolved gases by the PANOX fibers during the
carbonization process.
0
1
2
3
4
5
6
7
0 100 200 300 400 500 600 700 800 900 1000
Ev
olv
ed g
as (m
mo
l/m
in.g
)
Temperature (ºC)
CH4 NH3 H2O
HCN CO CO2
H2CH3CN

29
Figure 3. Evolution of the burn-off percentage versus time for the activation of CF
10PAN with CO2; in one stage (Simple), in a second activation of the activated
(Second), for the CFP and for the CF 1PAN (1PAN).
0
10
20
30
40
50
60
70
80
90
0 1 2 3 4 5 6 7 8
Bu
rn-o
ff (
%)
Time (h)
Simple Second Global 2+3 1PAN CFP

30
Figure 4. Burn-off percentage evolution over the time for CFP and CF 10PAN activated
with H2O and CO2, and for CF 1PAN activated with CO2.
0
10
20
30
40
50
60
70
80
90
0 1 2 3 4 5 6 7 8
Bu
rn-o
ff (
%)
Time (h)
CF 1PAN CO2
CF 10PAN CO2
CF 10PAN H2O
CFP CO2
CFP H2O

31
Figure 5. N2 adsorption isotherms of ACF 10PAN activated with CO2 (series CFPAN-
C) and with water vapor (series CFPAN-S).
0
20
40
60
80
100
120
140
160
180
200
0 0.1 0.2 0.3 0.4 0.5 0.6 0.7 0.8 0.9 1
N2
ad
s (c
m3/g
) S
TP
P/Po
CFPAN20S CFPAN58S CFPAN84S
CFPAN18C CFPAN47C CFPAN73C

32