unlocking the vault: next-generation museum population genomics
TRANSCRIPT
Acc
epte
d A
rtic
le
This article has been accepted for publication and undergone full peer review but has not been through the copyediting, typesetting, pagination and proofreading process, which may lead to differences between this version and the Version of Record. Please cite this article as doi: 10.1111/mec.12516 This article is protected by copyright. All rights reserved.
Received Date: 12-Jun-2013 Revised Date : 28-Aug-2013 Accepted Date: 30-Aug-2013 Article type : Original Article
Unlocking the vault: next generation museum population genomics
Ke Bi1*, Tyler Linderoth1,2, Dan Vanderpool3, Jeffrey M Good3, Rasmus Nielsen2, Craig Moritz1,2,4
1. Museum of Vertebrate Zoology, 3101 Valley Life Sciences Building, University of
California, Berkeley, California 94720, USA 2. Department of Integrative Biology, 3060 Valley Life Sciences Building, University of
California, Berkeley, California 94720, USA 3. Division of Biological Sciences, University of Montana, Missoula, Montana 59812, USA 4. Research School of Biology and Centre for Biodiversity Analysis, Australian National
University, Canberra, ACT 0200, Australia
*Corresponding: Ke Bi ([email protected])
Keywords: Exon capture, DNA damage, museum skins, natural history museum collections,
non-model organisms, Tamias
Acc
epte
d A
rtic
le
This article is protected by copyright. All rights reserved.
Abstract
Natural history museum collections provide unique resources for understanding how
species respond to environmental change, including the abrupt, anthropogenic climate change
of the past century. Ideally, researchers would conduct genome-scale screening of museum
specimens to explore the evolutionary consequences of environmental changes, but to date
such analyses have been severely limited by the numerous challenges of working with the
highly degraded DNA typical of historic samples. Here we circumvent these challenges by using
custom, multiplexed, exon-capture to enrich and sequence ~11,000 exons (~4Mb) from early
20TH century museum skins. We used this approach to test for changes in genomic diversity
accompanying a climate-related range retraction in the alpine chipmunks (Tamias alpinus) in
the high Sierra Nevada area of California, USA. We developed robust bioinformatic pipelines
that rigorously detect and filter-out base misincorporations in DNA derived from skins, most of
which likely resulted from post-mortem damage. Furthermore, to accommodate genotyping
uncertainties associated with low-medium coverage data, we applied a recently developed
probabilistic method to call SNPs and estimate allele frequencies and the joint site frequency
spectrum. Our results show increased genetic subdivision following range retraction, but no
change in overall genetic diversity at either non-synonymous or synonymous sites. This case
study showcases the advantages of integrating emerging genomic and statistical tools in
museum collection-based population genomic applications. Such technical advances greatly
enhance the value of museum collections, even where a pre-existing reference is lacking, and
points to a broad range of potential applications in evolutionary and conservation biology.
Introduction
Acc
epte
d A
rtic
le
This article is protected by copyright. All rights reserved.
Natural history museums worldwide house a wealth of biological specimens that
document dynamic changes in biodiversity and are hence invaluable for reconstructing patterns
and processes of evolution across time and space (Wander et al. 2007). In particular, museum
specimens are potentially an important source for genetic data, especially those specimens
collected before the molecular era (Payne & Sorenson 2002). Early successes in obtaining
genetic data from dried museum skins applied PCR to obtain mtDNA sequences from recently
extinct populations or species (Higuchi et al. 1984; Cooper et al. 1992). These studies aimed to
examine genetic changes through time in threatened species (Wayne & Jenks 1991; Glenn et al.
1999; Weber et al. 2000; Godoy et al. 2004) or to enhance various conservation, phylogenetic
and phylogeographic studies (Thomas et al. 1990; Roy et al. 1994; Poulakakis et al. 2008; Wójcik
et al. 2010; McDevitt et al. 2012). Other studies have obtained multi-locus data by amplifying
nuclear microsatellite loci from museum specimens (Taylor et al. 1994; Bouzat et al. 1998;
Harper et al. 2008; Peery et al. 2010; Rubidge et al. 2012), though not without considerable
effort to avoid PCR artifacts (e.g. Taberlet et al. 1996). However, the extraordinary potential of
museum collections has yet to be fully realized because the extensive DNA degradation typical
of these specimens limits the scalability of PCR-based approaches.
The recent advent of massively parallel, next-generation sequencing (NGS) has
fundamentally transformed traditional population genetics into a data-driven discipline, which
enables the analyses of genome-wide patterns of sequence variation with much greater
reliability (Pool et al. 2010). Various target enrichment methods (Briggs et al. 2009; Hodges et
al. 2009; Maricic et al. 2010; Lemmon et al. 2012; McCormack et al. 2012; Tang et al. 2012),
Acc
epte
d A
rtic
le
This article is protected by copyright. All rights reserved.
which selectively enrich sequences prior to NGS, substantially increase the coverage of selected
targets with much reduced experimental cost (Avila-Arcos et al. 2011; Good 2011). Among
these, sequence (exon) capture methods have been successfully applied to ancient bone
templates to obtain genome-scale data in order to provide insights into human evolution
(Burbano et al. 2010; Bos et al. 2011). Such methods have also been used to discover exonic
SNPs in non-model species by relying on pre-existing, closely related reference genomes (Perry
et al. 2010; Cosart et al. 2011; Good et al. 2013). These studies demonstrate the feasibility of
conducting targeted genome-scale analyses from a broad range of DNA sources. However, all of
these examples rely heavily on pre-existing, high quality, genomic resources to target regions of
interest and to align the resulting sequences for variant discovery, a requirement that impedes
application to the wide range of taxa still lacking a genomic reference.
To achieve broader, cost-effective applications, we previously showed that de novo
assembled transcriptomes can be used to design exon-capture experiments, and combined this
with pooled capture of barcoded libraries (Burbano et al. 2010) to enable cost-effective
genomic sampling from modern samples spanning a reasonable taxonomic breadth (Bi et al.
2012). In parallel with such technical advances, powerful statistical methods are emerging to
infer single nucleotide polymorphisms (SNPs), estimate allele frequencies, and jointly infer
population demography and selection from NGS data (Yi et al. 2010; Nielsen et al. 2012). What
remains is to demonstrate that these new approaches can be applied to museum specimens
and yield high quality population genomic data despite the inevitable DNA damage involving
fragmentation and base misincorporation, as well as potential contamination.
Acc
epte
d A
rtic
le
This article is protected by copyright. All rights reserved.
Here, we provide such a demonstration by comparing population samples of the alpine
chipmunk (Tamias alpinus) obtained in the early 20TH century (museum skins) and from the
same areas nearly a century later (fresh tissues). This species is endemic to the high Sierra
Nevada of California and is of particular interest because its range has strongly contracted
upwards over the past century in conjunction with increasing minimum environmental
temperatures (Moritz et al. 2008; Rubidge et al. 2011). Using seven DNA microsatellite loci,
Rubidge et al. (2012) found a decrease in allelic richness, but not heterozygosity, and increased
population differentiation in modern compared to historic specimens of T.alpinus from
Yosemite National Park (YNP), California, USA. These data indicate that range retraction was
mainly caused by extirpation of low-elevation populations rather than population-wide range-
shifts to track climatic niches (Tingley et al. 2009). Nevertheless, a small set of microsatellite
markers may not sufficiently reflect underlying genome-wide diversity (Väli et al. 2008), and
thus will not represent the full spectrum of genomic consequences of range retraction.
In this study we aimed to identify and compare variation across the genome from YNP T.
alpinus that were collected in both historic (1915) and contemporary periods (2004-2008), and
gain insight into how climate change in the past century has affected their genomic variability.
Specifically, we first used de novo transcriptome-based exon capture (Bi et al. 2012) to
successfully obtain genomic data from museum specimens. Second, we developed
bioinformatic pipelines that rigorously detect and filter out artifacts from DNA damage and low-
confidence variants. To call SNPs and estimate allele frequencies, we applied a probabilistic
Acc
epte
d A
rtic
le
This article is protected by copyright. All rights reserved.
framework that takes into account a wide range of statistical uncertainties associated with low-
medium coverage data (Nielsen et al. 2011; Nielsen et al. 2012). Finally, we used these high-
quality variant data to compare patterns of genomic variation between the historic and modern
specimens.
Materials and Methods
Samples
We used specimens collected from T. alpinus populations along the west slope of the
Yosemite transect, at elevations ranging from 2,377 to 3,277 meters (m) (Fig. 1, Table S1). We
chose 20 historic specimens that were sampled in 1915 at YNP by a research team led by
Joseph Grinnell, the founding director of the Museum of Vertebrate Zoology (MVZ) at the
University of California Berkeley. Historic specimens are preserved in the form of dried skins.
Twenty modern specimens were sampled from the same area by the “Grinnell Resurvey” team
initiated by MVZ researchers and collaborators between 2004 and 2008
(http://mvz.berkeley.edu/Grinnell/). Fresh tissues were stored at −80 °C or in 95% ethanol. The
individual sample used for transcriptome sequencing was a male T. alpinus (MVZ224483) from
Bullfrog Lake, Kings Canyon National Park, California, collected in November 2009. RNA was
extracted from liver, kidney, spleen, and heart tissues that were fixed in RNAlater immediately
following euthanasia.
DNA extractions from skins
We confined DNA extractions from museum skins to a separate lab used exclusively for
Acc
epte
d A
rtic
le
This article is protected by copyright. All rights reserved.
historic DNA related lab work. We minimized damage to museum skins by sampling a small (2 x
2 mm) piece of toe pad tissue from each skin using a sterilized surgical blade. The skin was then
kept in a 1.5mL centrifuge tube, and twice rehydrated in a 1x STE buffer (100mM NaCl, 10mM
Tris-HCl pH7.5, 1mM EDTA) for 30 minutes followed by 3 minutes of rigorous vortexing. After
washing, each skin was cut into small pieces inside the same tube using a straight and narrow-
headed surgical blade. We used reagents provided in Qiagen DNeasy Blood & Tissue kits but
purified the DNA using Qiagen PCR purification columns. PCR purification columns are more
efficient at collecting the small fragments (Rowe et al. 2011), which predominate in DNA
samples derived from historic specimens. DNA extractions from modern specimens were
carried out using DNeasy Blood & Tissue kits following the manufacturer’s protocol.
Array design and exon capture experiments
We recently outlined an approach for using de novo assembled transcriptomes to
enable cost-effective exon capture experiments across a reasonable taxonomic breadth (Bi et
al. 2012). Briefly, we generated a cDNA library from combined mRNA extracted from multiple
tissues of a modern T. alpinus specimen following standard procedures. The resulting cDNA
library was then sequenced using one lane of Illumina GAIIx (100bp paired-end), assembled
using ABySS (Birol et al. 2009), and then annotated based on BLASTX (Altschul et al. 1990)
comparisons to a database of human, mouse, rat, and thirteen-lined ground squirrel proteins.
Detailed information for the bioinformatic pipelines used for de novo transcriptome data
processing can be found in Singhal (2013). We used the Agilent SureSelect custom 1M-feature
microarrays to target 11,975 exons that were each at least 201bp long, which we identified
Acc
epte
d A
rtic
le
This article is protected by copyright. All rights reserved.
from the annotated transcripts. Targeted exons, spanning a wide range of evolutionary rates in
the genome (Bi et al. 2012), represented 6,249 protein-coding genes with a target size totaling
4Mb. In addition to the T. alpinus exons, we targeted the ~16 kb T. alpinus complete
mitochondrial genome and 350 bp from the consensus Spermophilus (S. fulvus, S. major, and S.
pygmaeus) SRY gene to assess empirical error rates and potential sample contamination (Bi et
al. 2012). We also selected seven nuclear genes (acrosin, acp5, cmyc, rag-1, anon, zan, and zp2)
previously sequenced in Tamias (6,031 bp total) (Good et al. 2008; Reid et al. 2012), which
were used as positive controls in post-capture qPCR assays to determine the initial enrichment
quality. Array probe design followed the recommendations of Hodges et al. (2009) and are
detailed in Bi et al. (2012).
Genomic libraries for 40 specimens, 20 early 20TH century museum skins and 20 modern
tissues, were constructed according to the protocol outlined by Meyer & Kircher (2010) with
slight modifications: First, we sheared DNA from all modern specimens and DNA from a few
historic specimens in which some high molecular weight DNA fragments were still present.
Shearing DNA for most of the historic skins was not needed since fragments ranged from 100-
300bp, which is the optimal size range for exon capture experiments. The adapter of each
genomic library was associated with a unique 7-nt barcode introduced by indexing PCR. All
libraries were amplified with Phusion High-Fidelity DNA Polymerase (Thermo Scientific) during
the indexing PCR. For each individual sample we performed 2-3 indexing PCR reactions in
parallel and then merged the products thereafter to decrease the PCR stochastic drift.
Barcoded libraries for historic and modern T.alpinus were pooled separately in equal amounts
Acc
epte
d A
rtic
le
This article is protected by copyright. All rights reserved.
and hybridized on one array each along with Tamias Cot-1 DNA (prepared following Trifonov et
al. 2009) and blocking oligos. In addition, we multiplexed individually barcoded genomic
libraries from four modern specimens of red-tailed chipmunks, T. ruficaudus, and hybridized
them on an independent microarray. Tamias ruficaudus served as an outgroup to T. alpinus
such that the orientation of SNPs could be polarized (ancestral vs. derived) to obtain the
unfolded site frequency spectrum (SFS) (see below). Assays using qPCR and the positive control
loci targeted on the same arrays allowed us to determine the post-capture enrichment
efficiency of different exon capture experiments. The verified, enriched libraries were
sequenced using an Illumina HiSeq2000 (100 bp paired-end). The two libraries, one consisting
of 20 pooled historic and the other of 20 pooled modern specimens were each sequenced on
one lane. The pooled library of T. ruficaudus was sequenced using 1/3 of a lane.
Data filtering
The captured sequence reads from T. alpinus and T. ruficaudus libraries were cleaned
and assembled using the same strategy described in Singhal (2013). Briefly, raw sequence reads
were filtered to remove exact duplicates, adapters, bacteria and human contamination, as well
as low complexity. Overlapping paired reads were also merged. The resulting cleaned reads of
the 40 libraries of T. alpinus were then assembled together to generate a final set of consensus
assemblies. A reciprocal BLAST approach (Altschul et al. 1990) was applied to compare the
11,975 target exons with the consensus assemblies in order to identify the set of contigs that
were associated with targets (in-target assemblies). To correct potential assembly errors that
might have been introduced by de novo assembly and/or by merging raw assemblies, we used
Acc
epte
d A
rtic
le
This article is protected by copyright. All rights reserved.
Novoalign (http://www.novocraft.com) to align cleaned reads from the T. alpinus libraries to
the in-target assemblies and then corrected sites where consensus bases were not concordant
with identified major alleles. We also mapped sequence reads of 4 T. ruficaudus individuals to
the corrected T. alpinus in-target assemblies and used “bcftools” and “vcfutils.pl vcf2fq”
implemented in SAMtools (Li et al. 2009) to generate an outgroup sequence file. We mapped
sequence reads from each individual T. alpinus library to the in-target assemblies of T.alpinus,
using Novoalign while constraining the number of mismatched positions to 3 or less per read
pair. The output alignments in SAM format were initially analyzed using SAMtools and its
associated “bcftools” to produce some of the data quality control information in VCF format.
These data were then further filtered using a custom filtering program, SNPcleaner
(https://github.com/fgvieira/ngsClean).
We employed three levels of filtering on the datasets in a hierarchical order: individual-
level, contig-level, and site-level. The filters in each step of the hierarchy were applied only to
the subset of data that passed the quality control thresholds at all previous levels. The first
filters applied were the individual-level filters to remove entire individuals deviating excessively
from the average across-individual coverage and error rate. Contig-level filters, followed by
site-level filters were then applied to remove entire contigs and sites, respectively, that
appeared to be quality outliers. All individual specimens, contigs and sites were filtered on
multiple aspects of quality (e.g. potential cross-sample DNA contamination, sequencing errors,
paralogy, etc.). The detailed protocol is specified below:
1. Filtering at individual level:
Acc
epte
d A
rtic
le
This article is protected by copyright. All rights reserved.
i. Remove individuals having extremely low or high coverage (<1/3 or > 3X the average
coverage across all individuals).
ii. Remove individuals with excessively high sequencing error rates measured as the percentage
of mismatched bases out of the total number of aligned bases in the mitochondrial genome.
Remove females with a high percentage of cleaned reads being mapped to the SRY gene, and
males with extremely low SRY mapping percentage relative to the across-male average.
2. Filtering at contig level:
i. Remove contigs that show extremely low or high coverage based on the empirical coverage
distribution across contigs.
ii. Remove contigs with at least one SNP having allele frequencies highly deviating from Hardy-
Weinberg equilibrium expectations (p < 0.0001) based on a two-tailed exact test (Wigginton et
al. 2005).
3. Filtering at site level:
i. Remove sites that are at least 100bp outside of exons.
ii. Remove sites with excessively low (<19.5 percentile for historic and <18.5 percentile for
modern) or high (>99.3 percentile for historic and >99.4 percentile for modern) coverage based
on the empirical coverage distribution.
iii. Remove sites with biases associated with reference and alternative allele Phred quality,
mapping quality, and distance of alleles from the ends of reads. Also remove sites that show a
bias towards sequencing reads coming from the forward or reverse strand.
iv. Remove sites for which there are not at least 3/4 of the individuals sequenced at 3X
coverage each.
Acc
epte
d A
rtic
le
This article is protected by copyright. All rights reserved.
v. Remove sites with a root mean square mapping quality for SNPs below 10.
vi. Due to the high base misincorporation rate present in the historic specimens, we remove
sites from all 40 individuals for which C to T, and G to A SNPs are identified.
vii. Retain only the sites that pass all filters for both historic and modern specimens so that the
modern and historic data are directly comparable.
The DNA damage filter, whereby C to T and G to A SNP sites are removed, is essential for
genomic studies that use museum collections. DNA preserved from archaeological (or ancient)
and historic museum specimens is often characterized by various types of post-mortem
nucleotide damage (e.g. Stiller et al. 2006; Briggs et al. 2007). The majority of the damage-
driven errors associated with ancient DNA are caused by hydrolytic deamination of cytosine (C)
to uracil (U) residues (Hofreiter et al. 2001; Briggs et al. 2007). Most DNA polymerases replace
uracils with thymines (Ts) during PCR amplification of damaged templates, resulting in an
apparent C to T substitution. These spurious base misincorporations tend to occur towards the
ends of molecules (Briggs et al. 2007), appear to accumulate with time, and can be significantly
elevated even in century-old museum specimens (Sawyer et al. 2012). Population genetic
inference based on damaged, ancient DNA sequences can be severely biased due to the base
misincorporations (Axelsson et al. 2008) and should be examined before all downstream
analyses. In order to characterize the patterns of DNA damage likely present in our dataset, we
used a similar method to that of Briggs et al. (2007) whereby we plotted the frequency of all 12
possible mismatches against the distance from the 5’-end and 3’-end of the sequencing reads in
modern and historic specimens, respectively.
Acc
epte
d A
rtic
le
This article is protected by copyright. All rights reserved.
SNP calling and allele frequency estimation
With low-medium coverage data (<20X per individual in the present study), SNP and
genotype calls based only on allele counting, even after considering quality scores and
coverage, are associated with high uncertainty. This can lead to biased estimates of allele
frequency distributions and population genetic parameters (Hellmann et al. 2008; Johnson &
Slatkin 2008; Lynch 2008). To account for this uncertainty, we called SNPs and estimated allele
frequencies using an empirical Bayesian framework implemented in the software ANGSD
(http://popgen.dk/wiki/index.php/ANGSD). Briefly, for each individual we first calculated the
likelihood for all 10 possible genotypic configurations at every site that passed quality filters.
We then used a maximum likelihood method to estimate the site frequency spectrum (SFS)
based on the genotype likelihoods, jointly for all sites and all individuals (Nielsen et al. 2012).
This was performed separately for the historic and modern population samples. The resulting
population-specific SFS was used as a prior to estimate the posterior probabilities for all
possible derived allele frequencies at each site in each population, which directly allowed for
SNP calling at any degree of certainty. We called SNPs based on the sites having a 95%
probability of being variable. A detailed description of the algorithms employed by ANGSD can
be found at http://popgen.dk/wiki/index.php/ANGSD and in Nielsen et al. (2012).
Population genetic analyses
Several population genetic parameters and summary statistics of interest were
calculated using the SFS. Overall genetic variation was estimated using nucleotide diversity
Acc
epte
d A
rtic
le
This article is protected by copyright. All rights reserved.
measured as the average number of pairwise differences between sequences, π. We also
estimated Watterson’s theta (Θw) (Watterson 1975) for non-synonymous (Θnon-syn) and
synonymous SNPs (Θsyn) respectively. We calculated the ratio Θnon-syn/Θsyn for historic and
modern populations to examine if overall genetic diversity of non-synonymous relative to
synonymous sites has changed over time. We used Tajima's D (Tajima 1989) to examine
whether there was a genomic signal of past population expansion or recent decline. All of these
summary statistics π, Θw, and Tajima’s D were calculated by summing over all possible allele
frequencies weighted by their posterior probabilities in order to account for sequencing
uncertainties.
Differentiation between the modern and historic population was measured using an
estimation of FST appropriate for low coverage NGS data, while genetic relationships among the
individuals in the two time periods was analyzed using principal components analysis (PCA)
based on a covariance matrix of posterior genotype probabilities at every site with a minor
allele frequency of at least 1.25% among all 40 individuals (Fumagalli et al. 2013). These
methods are implemented in the ngsTools software package
(https://github.com/mfumagalli/ngsTools). For higher resolution in the differentiation analysis
we also examined the 2D-SFS between the modern and the historic population to infer shifts in
allele frequencies over time. We further examined population structure using the Bayesian
population clustering method implemented in Structure 2.3.4 (Pritchard et al. 2000). We used
an admixture model with correlated allele frequencies and five independent runs, with each
run having a burn-in of 100,000 followed by 1,000,000 MCMC (Markov Chain Monte Carlo)
Acc
epte
d A
rtic
le
This article is protected by copyright. All rights reserved.
steps from K (number of clusters) = 1 to 10. Results across runs were summarized to determine
the best K using the method of Evanno et al. (2005), implemented in Structure Harvester (Earl &
vonHoldt 2012). Structure results were further analyzed and plotted using CLUMPP1.1.2
(Jakobsson & Rosenberg 2007) and DISTRUCT (Rosenberg 2004).
Results and Discussion
Transcriptome based exon capture on museum specimens
Although there has been a long history of utilizing genetic data from museum
specimens, most studies have been restricted to PCR or capillary sequencing of short fragments
of mitochondrial DNA, individual nuclear loci, and microsatellite loci (reviewed in Wandeler et
al. 2007). The considerably high sensitivity and high throughput of NGS provides
unprecedented opportunities for phylogenomic and population genomic applications based on
museum collections. Rowe et al. (2011) used Illumina technology to sequence the genome
from the skin and bone tissues of one historic mammal specimen. More recently, cross-species
targeted hybridization with NGS was used to sequence complete mitochondrial DNA genomes
from museum specimens (Mason et al. 2011; Guschanski et al. 2013). For our study, we aimed
to obtain genome-wide nuclear markers for population-level comparisons between museum
historic and contemporary specimens. We first generated genomic resources by de novo
sequencing and assembling a multi-tissue transcriptome from a modern chipmunk, and then
designed exon capture microarrays to enrich selected targets from individually-indexed,
pooled, DNA derived from both historic skins and fresh tissues. Here we demonstrate that this
Acc
epte
d A
rtic
le
This article is protected by copyright. All rights reserved.
is a fast and cost-effective approach for enriching genome-wide nuclear markers from low
quality DNA typical of historic skins with sufficient sequencing coverage to characterize
population genomic diversity. Our method is especially valuable for non-model organisms
including those comprising the vast majority of museum collections for which a pre-existing
reference genome is not usually available.
We used a multi-tissue transcriptome sequencing approach to increase the transcript
diversity and ultimately the robustness of the marker development. We suggest that future
projects should also consider exploring sequence resources from various other tissue types
since the organs chosen in this study do not necessarily represent the best combination for
maximizing the transcript diversity. For example, the testis transcriptome is typically more
complex than other tissues (Soumillon et al. 2013).
De novo assembly of the Tamias transcriptome yielded 37,563 contigs (36.5 Mb), 21,262
(28.1 Mb) of which were annotated, with a mean length of 1,297 bp and an average fold
coverage of 54X (Bi et al. 2012). Over 120,000 exons were identified from the annotated
transcripts. 962,438 60bp probes were printed on the microarrays to target 11,975 exons that
were greater than 200bp each in length (4 Mb total), the Tamias mitochondrial genome (16 Kb),
the ground squirrel (Spermophilus) SRY gene (350 bp), and seven control nuclear genes (6 kb).
Further details on probe and array design can be found in Bi et al. (2012).
The exon capture experiments were successful, as detailed in Table S2. For historic and
modern T. alpinus specimens, 32.2 and 43.6 Gb (NCBI SRA ID: SRR847500) raw data were
generated, and 14.9 and 21.8 Gb high-quality data were retained after quality filtering,
respectively. Exogenous DNA contamination derived from bacteria and/or human was trivial
Acc
epte
d A
rtic
le
This article is protected by copyright. All rights reserved.
(<0.3% for both libraries) and removed from the dataset (Table S2). De novo assembly of
cleaned sequences produced 10,583 contigs (total assembly size: 7.6 Mb, N50: 722bp, mean
contig length: 715bp); the identity of contigs from the in-target assemblies was determined by
reciprocal BLAST to the selected exons. For all individuals, an average of 99% of the target exon
bases were covered by at least one sequence read.
We found that, on average, 46.7% and 33.8% of the cleaned reads aligned to the targets
for historic and modern individuals, respectively (Fig. S1). The mitochondrial genome only made
up 0.4% of the total target (16Kb out of 4Mb) but among all of the reads that were mapped to
targets, 6-7% were derived from the mitochondrial genome. This effect is not surprising given
that there are typically several hundred copies of the mitochondrial genome per diploid cell
(Robin & Wong 1988). Indeed, this inherent difference in copy number is one of the primary
reasons that studies on ancient DNA have traditionally relied upon sequencing of mitochondrial
DNA (e.g. Krings et al. 2000). Given this bias, including both mitochondrial and nuclear targets
in the same capture experiment will inevitably result in some loss in overall sequencing
efficiency. Here we included mitochondrial DNA probes specifically haploid targets that can be
used as an internal control against for cross-sample contamination and recombinant PCR, and
to provide an empirical estimate of sequencing and postmortem error rates (see Bi et al. 2012).
We intentionally used a five-fold lower tiling density for mitochondrial relative to nuclear
targets (20 versus 4-bp tiling) to help counteract the copy number bias, though our sequencing
results indicate that a much lower tiling density is warranted. We recommend that future
studies carefully consider the balance between quality control insights afforded by including
mitochondrial targets and the potential loss in experimental efficiency. Unless targeting a large
Acc
epte
d A
rtic
le
This article is protected by copyright. All rights reserved.
portion of the mitochondrial genome is of particular interest, it is likely that targeting a smaller
subset of the mitochondrial genome and/or other haploid genetic markers (e.g., X and Y-linked
loci in males) could provide sufficient internal controls while avoiding loss in overall
experimental efficiency.
The higher specificity (proportion of cleaned reads that were mapped to targets) for
historic individuals is noteworthy, given that degraded samples are notorious for performing
poorly in PCR-based experiments. This might be because the shorter average DNA library sizes
of the historic specimens (~150bp versus ~200bp for the modern samples) resulted in more
efficient enrichment by the 60-bp probes of the Agilent SureSelect capture arrays. Furthermore,
the specificity was highly uniform in each population, indicating that multiplexing did not bias
the capture efficiency towards particular libraries. The average base fold coverage within exons
was 18.9X in historic and 19.7X in modern individuals (Fig. S2). For all individuals, on average,
99% of the exons had coverage of at least 5X, and 90% had coverage of at least 10X.
The average fold coverage of each captured exon in historic and modern specimens was
highly correlated (Fig. S3), suggesting consistent performance between independent capture
experiments despite half the data being derived from century-old museum skins. The total
length of contigs in the in-target assemblies was much greater than that of exons originally
targeted due to the capture of flanking intronic sequence. However, there was an abrupt
decrease in the average fold coverage near the edges of each contig making these regions more
prone to assembly errors. To ensure high confidence in downstream variant calling, we only
considered SNPs identified in flanking regions covered by reads that overlapped with a
contiguous exon by at least 1 bp.
Acc
epte
d A
rtic
le
This article is protected by copyright. All rights reserved.
Data filtering and pattern of base misincorporation in historic DNA
We first applied individual-level, quality-control filters to the datasets to remove any
data introducing severe bias among individual specimens. The Spermophilus SRY gene was
effectively captured in all male Tamias samples. In contrast, the capture of SRY was negative in
females considering that only five samples had only one to two sequence reads that were
mapped to the SRY gene, indicating a negligible degree of cross-sample contamination (Table
S2). We did find that the error rate was relatively greater in historic specimens (see below).
However, there were no strong deviations in empirical error rate or sequencing coverage for
any individual compared to the respective population average. Therefore, all 40 T. alpinus and 4
T. ruficaudus specimens passed the quality control filtering at the individual level.
The contig-level filters were subsequently employed to filter entire contigs from
specimens that passed individual-level filters. The in-target assemblies of T. alpinus and T.
ruficaudus were examined for potential assembly errors, resulting in 1,193 and 552 sites being
corrected, respectively. After filtering, 1,334 contigs (12.6% of the total) were removed because
they either showed extreme coverage or possessed SNPs that deviated significantly from HWE,
which is indicative of paralogs.
Various site-level filters were lastly carried out to remove unreliable sites belonging to
the contigs that passed contig-level filters. The empirical error rate was almost fivefold higher in
historic (0.19%) versus modern (0.04%) samples and might be caused by the presence of
Acc
epte
d A
rtic
le
This article is protected by copyright. All rights reserved.
excessive miscoding lesions that caused incorrect bases to be incorporated during PCR
amplification (Sawyer et al. 2012). To examine this further, we plotted the frequency of all 12
possible mismatches against the distance from the 5’-end and 3’-end of the sequencing reads in
modern and historic specimens, respectively (Fig. 2). For the modern specimens, the frequency
of all changes remained constant and similar along the sequences, while there were excessive C
to T substitutions at the 5' ends of the historic sequences and complementary guanine (G) to
adenine (A) substitutions at the 3' ends of the respective molecules. The frequencies of C to T
and G to A substitutions were ~4 fold above other possible mismatches at the 5’- and 3’-most
positions, respectively. The occurrence of both misincoporation-type substitutions rapidly
decreased over the first 5-10 bp from the ends of the read and then steadily decreased toward
the opposite end of the sequence. However, compared to other changes, their frequencies
remained elevated throughout the sequence.
Overall, we observed a pattern of base misincorporation in our historic samples that is
in strong agreement with patterns of damage accumulation characteristic of ancient DNA
(Briggs et al. 2007). We prepared our historic DNA libraries with a Pyrococcus-like polymerase
(Phusion High-Fidelity DNA Polymerase) that stalls amplification of templates containing uracil
(Greagg et al. 1999; Heyn et al. 2010) and thus should reduce (but not eliminate)
misincorporation errors in our sequence data (Ginolhac et al. 2011). Consistent with this, the
frequency of C to T misincorporation at the end of molecules is nearly an order of magnitude
lower in our data (~0.58%; Fig. 2) when compared to sequences of DNA libraries from similarly
aged museum samples that were prepared with a non-proofreading enzyme (2-4%; Sawyer et
al. 2012). This apparent improvement in sequence fidelity comes with two important caveats.
Acc
epte
d A
rtic
le
This article is protected by copyright. All rights reserved.
First, proofreading enzymes that are stalled by the presence of uracil may be poorly suited for
use on highly damage samples, where up to 60% of DNA fragments may contain at least one
uracil (Briggs et al. 2010). Second, substantial C to T and G to A misincorporations still persist in
our data (Fig. 2) despite the use of a proofreading enzyme that should not amplify molecules
containing uracil. One possible source of error is that library amplification occurs after adaptor
ligation and therefore will not prevent G to A errors created during blunt end repair of 5' single
stranded fragments. Another likely explanation is that not all instances of cytosine deamination
result in uracil. For example, deamination of a methylated cytosine causes a direct transition to
a thymine that will not be detected by proofreading polymerases and may account for up to
10% of misincorporations in ancient DNA (Briggs et al. 2010). Regardless of the source(s) of
error, population genetic and demographic analyses based on damaged, ancient DNA
sequences can be severely biased by base misincorporation (Axelsson et al. 2008). To
accommodate this, we removed all C to T and G to A changes from both historic and modern
datasets for subsequent analyses.
After the site-level filtering, we retained 3 Mb data out of the total 4.4 Mb of pre-
filtered data which included exonic regions and partial flanking sequences (within a +/-99 bp
window).
SNP calling and population genetic analyses
As the sequencing coverage of our data was not adequate to naively call genotypes for

Acc
epte
d A
rtic
le
This article is protected by copyright. All rights reserved.
each individual with high confidence by counting alleles, we used a SNP calling and allele
frequency estimation method based on genotype likelihoods that uses information from all
individuals at all sites simultaneously (Yi et al. 2010; Nielsen et al. 2012). This approach greatly
increased the statistical power to detect SNPs and improved allele frequency estimations
compared to individual-based SNP calling algorithms. Using ANGSD, we were able to identify
1,578 high quality sites with at least a 95% posterior probability of being variable. Among these
SNPs, 1,250 were found in historic specimens and 1,277 in modern specimens, meaning that
the number of segregating sites has remained fairly constant in YNP T. alpinus over the past
century.
Comparison of the SFS for the temporal T. alpinus populations suggests minimal changes
in allele frequencies over the period of climate change. Accordingly, the 2D-SFS showed a
strong correlation between the modern and historic population allele frequency distributions
(Fig. 3). This is reflected in the low global Fst (0.023) between the two time period populations.
The genome wide per site nucleotide diversity (π) (Fig. 4) and Tajima’s D for the historic
population were 8.179e-05 and -0.026, respectively; while for the modern population, per site
π and Tajima's D were 8.738e-05 and 0.0487. This result clearly indicates that there was
minimal change in genomic diversity for these sampled populations from two time points
spanning 90 years (~90 generations). In general, observable changes in allele frequencies and
reduced genetic diversity requires that the number of generations during which a population
experiences a reduced population size (t), should not be much smaller than the effective size of
the reduced population. The expected ratio of heterozygosity for a population of size Nb before
a bottleneck to a population of size Na t generations after a bottleneck, is e-t/Na((et/Na -1)Na

Acc
epte
d A
rtic
le
This article is protected by copyright. All rights reserved.
+Nb)/Nb. So if t/Na is small (say <0.1), the bottleneck has very little effect on genetic diversity.
Using seven microsatellite loci, Rubidge et al. (2012) surveyed 88 historic and 146
modern T. alpinus specimens and also found no change in heterozygosity in YNP temporal
populations over the past century. However, they did find a significant decrease in allelic
richness in modern samples. This result may not be surprising since rare alleles are lost at a
greater rate than that at which heterozygosity declines after a bottleneck (e.g. Nei et al. 1975;
Roderick & Navajas 2003). In this study we targeted a much smaller sample size (20 individuals
in each era) and found approximately the same distribution of allele frequencies in historic and
modern samples (similar values of Tajima’s D). The discrepancy between the two studies may
be explained in terms of differences in sampling as we may lack power to identify rare alleles
with our relatively smaller sample sizes.
We annotated and classified SNPs based on whether they are coding (synonymous and
nonsynonymous) or noncoding (untranslated regions (UTRs), introns). Assuming that non-
synonymous mutations tend to be more deleterious than synonymous substitutions, it is
expected that Θnon-syn/Θsyn would increase in populations that undergo a size reduction
because the effect of drift would overcome that of purifying selection. Thus, we might expect to
see a greater Θnon-syn/Θsyn ratio in the modern population compared to the historic
population of T. alpinus. However, we failed to detect such a signal; results showed that Θnon-
syn/Θsyn was nearly identical for historic (0.976) and modern populations (0.986). This
consistency also indicates that our data filtering pipelines worked effectively in terms of
eliminating potential errors from the datasets. Our results suggest that if the T. alpinus
population size is declining, the decline has not lasted long enough to leave a discernible
Acc
epte
d A
rtic
le
This article is protected by copyright. All rights reserved.
genetic signal.
The PCA analysis (Fig. 5A) based on genotypic covariance showed that historic
individuals were more genetically similar to each other than modern individuals, indicating
increased genetic structure within the modern population. This result may be due to reduced
gene flow among increasingly isolated modern T. alpinus subpopulations, in contrast to more
widespread historic gene flow. The signal of genetic heterogeneity in modern specimens was
mostly driven by individuals collected from a few geographically close localities near the
Vogelsang, Evelyn, and Fletcher lakes (Fig. 5B). Individuals sampled from the remaining
localities formed one genetic group. This pattern was concordant with Structure results: there
was no population subdivision detected in historic specimens, while three genetic clusters (K=3;
Evanno et al. 2005) were identified in modern samples. Targeting a much larger sample size,
Rubidge et al. (2012) used seven microsatellite loci and detected more (K=4) genetic structure
in modern T. alpinus. Thus, our results generally agree with Rubidge et al. (2012) in terms of
finding increased population genetic structure in modern T. alpinus. The lack of resolution in
the clustering analysis is most likely caused by our relatively modest population-level sampling
since our current study is focused primarily on demonstrating the feasibility of generating high
quality population genomic data from historic museum specimens. It was believed that the
extinction of individuals inhabiting lower elevations could have caused the disruption of genetic
connectivity among higher elevation localities, and was therefore responsible for increased
genetic structure in modern T. alpinus (Rubidge et al. 2012).
Conclusions
For this study we designed a robust experimental, bioinformatic, and statistical
Acc
epte
d A
rtic
le
This article is protected by copyright. All rights reserved.
framework for population genomic studies of museum specimens. Specifically, we
demonstrated the feasibility of enriching high-quality, genome-wide nuclear markers and SNP
calling from sequence data derived from museum historic skins. Moreover, this proof-of-
concept experiment was conducted on a species group for which no independent high-quality
genomic resources exist.
Our approach is likely to be useful across a very broad range of evolutionary and
ecological questions. A large number of museum specimens represent the past and recent
genetic diversity of small, declining or extinct populations, making them especially valuable
because collecting new material is consequently difficult or impossible. Paradoxically, the
extensive, random fragmentation that makes DNA from museum skins a poor template for PCR
is a boon for short-read parallel sequencing. That said, there remains significant bioinformatic
challenges for the analyses of historic DNA. We observed substantial base misincorporations in
DNA derived from century old museum skins and developed pipelines for data filtration at
different levels (individuals, contigs, sites), which addresses post mortem damages. Low-
medium coverage sequence data will be common in cost-effective, population genomic, study
designs that use NGS. To account for the genotyping uncertainties associated with such data,
we integrated a recently developed Bayesian SNP calling framework based on joint information
from all individuals in a sample, which is expected to be more powerful than variant calling
based on single individuals (Nielsen et al. 2012).
Transcriptome-based, multiplexed, exon capture is a fast and cost-effective approach
for gathering thousands of nuclear loci derived from museum specimens that lack a pre-existing
Acc
epte
d A
rtic
le
This article is protected by copyright. All rights reserved.
reference genome. This opens the door to population level, genomic comparisons for diverse
taxa in museum collections. Furthermore, the initial development of genome resources does
not rely on historic specimens. Rather, this approach produces a high quality transcriptome
reference by using only one modern specimen and then uses exon capture to enrich
homologous genes from historic specimens by DNA hybridization. Moreover, because this
method works at modest phylogenetic scales (Bi et al. 2012; Jin et al. 2012), if the species of
interest is extinct or cannot be sampled in modern times, genetically close relatives can be used
to design the capture array.
There are a few alternative approaches that might suffice to generate an initial
reference when transcriptome sequencing is not feasible and moderately divergent genomic
references are not available. Though it remains unclear how robust hybridization-based
captures are across deeper evolutionary divergences, it is likely that more divergent genome
references could be used to generate an initial capture experiment where one or a few
individuals are captured and sequenced to high coverage. A second, species-specific capture
could then be designed from the subset of regions that are successfully recovered.
Alternatively, probes could also be designed using shotgun genomic NGS data from one
individual, which would rely on assembled genome scaffolds and direct alignment of the
sequence reads to the exome of the most closely related species with an available genome
reference. The experiments described in the present study were carried out using array-based
exon capture. It is worth noting that in-solution based methods utilizing longer probes will likely
be more cost-effective for targeting large genomic regions and large sample sizes, and are more
likely to provide sufficient enrichment from divergent references or poorly preserved DNA
Acc
epte
d A
rtic
le
This article is protected by copyright. All rights reserved.
typical of museum skins.
All of these capture-based approaches are likely to cost more and require greater initial
experimental and bioinformatic investment than alternative reduced representation
approaches on non-model organisms that rely upon restriction digests to enrich anonymous
regions of the genome (i.e., RAD-seq and related approaches; Baird et al. 2008). However, RAD-
seq is poorly suited for use on limited or highly degraded DNA sources (Etter et al. 2011),
precluding its broad application to historic museum samples. Moreover, transcriptome-based
exon capture offers a number of other decisive advantages over RAD-seq including greater
experimental control, lower experimental variance among loci and samples, some a priori
knowledge of target function, and the ability to explicitly partition different site classes in
population genetic analyses (e.g., synonymous and non-synonymous positions).
One of the keys to museum population genomic applications is to ensure similar
sequencing coverage among historic and modern specimens. Uneven coverage among
specimens adds difficulty to the statistical analyses that could lead to biases if the variance in
coverage and errors are not modeled accurately. Many current methods are designed to
accommodate this issue (e.g., ANGSD) but could fail if the error structure is not modeled
accurately. In this regard, we recommend that researchers always aim for a balanced design
including managing enrichment PCR and equimolar pooling of pre-capture libraries to ensure
similar coverage among historic and modern specimens.
We demonstrated that we were able to use the methods herein described to obtain
Acc
epte
d A
rtic
le
This article is protected by copyright. All rights reserved.
biologically meaningful results. The population genomic analyses of early 20TH century museum
historic skins and contemporary specimens of Alpine chipmunks (T. alpinus) showed that there
was no major change in overall genetic diversity over the time period examined. However, we
observed increased population genetic structure within the modern period, which is likely a
consequence of reduced gene flow among patchy subpopulations due to climate-change
induced range contraction. Future research will focus on larger specimen sample and genetic
target sizes for T. alpinus, and will compare subsequent findings to those from populations that
have remained stable during climate change to understand its demographic and evolutionary
consequences for wildlife populations.
Acknowledgements
The authors would like to thank Chris Conroy, Eileen Lacey, James Patton, Karen Rowe,
Kevin Rowe and Jack Sullivan for providing access to museum specimens and tissues, Hernán
Burbano for sharing scripts for array design, Maria Santos for helping with maps, and Brice
Sarver for providing Tamias mitochondrial sequence. We also thank the Texas Advanced
Computing Center (TACC) at the University of Texas at Austin for providing computational
support. We would also like to acknowledge Roberta Damasceno, Sean Maher, and Sonal
Singhal for their insightful comments on this manuscript and Johannes Krause and Adrian Briggs
for helpful conversations on damage patterns in ancient DNA. This work was supported by an
NSERC postdoctoral fellowship (KB), University of Montana start-up funds (JG), and University
of California Berkeley VCR-BiGCB and the Gordon and Betty Moore Foundation (RN & CM). TL
was in-part supported by the NIH Genomics Training Grant (Grant T32HG000047-13).
Acc
epte
d A
rtic
le
This article is protected by copyright. All rights reserved.
Data Accessibility
The T. alpinus RNAseq and exon capture sequencing data are available in the NCBI sequence
read archive (SRA) (IDs: SRR504595 & SRR847500). The bioinformatic pipelines used in this
study are available at https://github.com/MVZSEQ/Exon-capture. The T. alpinus annotated
transcripts and sequences of short DNA baits for exon capture are available at the DRYAD, entry
doi:10.5061/dryad.s296n
References
Altschul SF, Gish W, Miller W, Myers EW, Lipman DJ (1990) Basic local alignment search tool.
Journal of Molecular Biology, 215, 403-410.
Avila-Arcos MC, Cappellini E, Romero-Navarro JA, Wales N, Moreno-Mayar JV, Rasmussen M,
Fordyce SL, Montiel R, Vielle-Calzada JP, Willerslev E, Gilbert MT (2011) Application and
comparison of large-scale solution-based DNA capture-enrichment methods on ancient
DNA. Scientific reports, 1, 74.
Axelsson E, Willerslev E, Gilbert MTP, Nielsen R (2008) The effect of ancient DNA damage on
inferences of demographic histories. Molecular Biology and Evolution, 25, 2181-2187.
Baird NA, Etter PD, Atwood TS, Currey MC, Shiver AL, Lewis ZA, Selker EU, Cresko WA, Johnson
EA (2008) Rapid SNP discovery and genetic mapping using sequenced RAD markers.
PLoS ONE, 3, e3376.
Bi K, Vanderpool D, Singhal S, Linderoth T, Moritz C, Good JM (2012) Transcriptome-based exon
capture enables highly cost-effective comparative genomic data collection at moderate
Acc
epte
d A
rtic
le
This article is protected by copyright. All rights reserved.
evolutionary scales. BMC Genomics, 13, 403.
Birol İ, Jackman SD, Nielsen CB, Qian JQ, Varhol R, Stazyk G, Morin RD, Zhao Y, Hirst M, Schein
JE, Horsman DE, Connors JM, Gascoyne RD, Marra MA, Jones SJ (2009) De novo
transcriptome assembly with ABySS. Bioinformatics, 25, 2872-2877.
Bos KI, Schuenemann VJ, Golding GB, Burbano HA, Waglechner N, Coombes BK, McPhee JB,
DeWitte SN, Meyer M, Schmedes S, Wood J, Earn DJ, Herring DA, Bauer P, Poinar HN,
Krause J (2011) A draft genome of Yersinia pestis from victims of the Black Death.
Nature, 478, 506-510.
Bouzat JL, Lewin HA, Paige KN (1998) The ghost of genetic diversity past: historical DNA analysis
of the greater prairie chicken. The American Naturalist, 152, 1-6.
Briggs AW, Good JM, Green RE, Krause J, Maricic T, Stenzel U, Lalueza-Fox C, Rudan P, Brajkovic
D, Kucan Z, Gusic I, Schmitz R, Doronichev VB, Golovanova LV, de la Rasilla M, Fortea J,
Rosas A, Pääbo S (2009) Targeted retrieval and analysis of five Neandertal genomes.
Science, 325, 318–321.
Briggs AW, Stenzel U, Johnson PL, Green RE, Kelso J, Prüfer K, Meyer M, Krause J, Ronan MT,
Lachmann M, Pääbo S (2007) Patterns of damage in genomic DNA sequences from a
Neandertal. Proceedings of the National Academy of Sciences of the United States of
America, 104, 14616-14621.
Briggs AW, Stenzel U, Meyer M, Krause J, Kircher M, Pääbo S (2010) Removal of deaminated
cytosines and detection of in vivo methylation in ancient DNA. Nucleic Acids Research,
38, e87.
Burbano HA, Hodges E, Green RE, Briggs AW, Krause J, Meyer M, Good JM, Maricic T, Johnson
Acc
epte
d A
rtic
le
This article is protected by copyright. All rights reserved.
PLF, Xuan Z, Rooks M, Bhattacharjee A, Brizuela L, Albert FW, de la Rasilla M, Fortea J,
Rosas A, Lachmann M, Hannon GJ, Pääbo S (2010) Targeted investigation of the
Neandertal genome by array-based sequence capture. Science, 328, 723-725.
Cooper A, Mourer-Chauvire C, Chambers GK et al. (1992) Independent origins of New Zealand
moas and kiwis. Proceedings of the National Academy of Sciences of the United States of
America, 89, 8741-8744.
Cosart T, Beja-Pereira A, Chen S, Ng SB, Shendure J, Luikart G (2011) Exome-wide DNA capture
and next generation sequencing in domestic and wild species. BMC Genomics, 12, 347.
Earl DA, vonHoldt BM (2012) STRUCTURE HARVESTER: a website and program for visualizing
STRUCTURE output and implementing the Evanno method. Conservation Genetics
Resources, 4, 359-361.
Etter P, Bassham S, Hohenlohe PA, Johnson E, Cresko WA (2011) SNP discovery and genotyping
for evolutionary genetics using RAD sequencing. In: Molecular Methods for Evolutionary
Genetics, Methods in Molecular Biology, vol. 772 (eds Orgogozo V, Rockman MV), pp
157-178. Humana Press, New York, USA.
Evanno G, Regnaut S, Goudet J (2005) Detecting the number of clusters of individuals using the
software STRUCTURE: a simulation study. Molecular Ecology, 14, 2611-2620.
Fumagalli M, Vieira FG, Korneliussen TS, Linderoth T, Huerta-Sanchez E, Anders Albrechtsen A,
Nielsen R. 2013. Quantifying population genetic differentiation from Next-Generation
Sequencing data. Genetics, 10.1534/genetics.113.154740.
Greagg MA, Fogg MJ, Panayotou G, Evans SJ, Connolly BA, Pearl LH (1999) A read-ahead
function in archaeal DNA polymerases detects promutagenic template-strand uracil.
Acc
epte
d A
rtic
le
This article is protected by copyright. All rights reserved.
Proceedings of the National Academy of Sciences of the United States of America, 96,
9045–9050.
Ginolhac A, Rasmussen M, Gilbert MTP, Willerslev E, Orlando L (2011) mapDamage: testing for
damage patterns in ancient DNA sequences. Bioinformatics, 27, 2153-2155.
Glenn TC, Stephan W, Braun MJ (1999) Effects of a population bottleneck on whooping crane
mitochondrial DNA variation. Conservation Biology, 13, 1097-1107.
Godoy JA, Negro JJ, Hiraldo F, Donázar JA (2004) Phylogeography, genetic structure and
diversity in the endangered bearded vulture (Gypaetus barbatus, L) as revealed by
mitochondrial DNA. Molecular Ecology, 13, 371-390.
Good JM, Hird S, Reid N, Demboski JR, Steppan SJ, Martin-Nims TR, Sullivan J (2008) Ancient
hybridization and mitochondrial capture between two species of chipmunks. Molecular
Ecology, 17, 1313-1327.
Good JM (2011) Reduced representation methods for subgenomic enrichment and next-
generation sequencing. In: Molecular Methods for Evolutionary Genetics, Methods in
Molecular Biology, vol. 772 (eds Orgogozo V, Rockman MV), pp 85-103. Humana Press,
New York, USA.
Good JM, Wiebe V, Albert FW, Burbano HA, Kircher M, Green RE, Halbwax M, André C, Atencia
R, Fischer A, Pääbo S (2013) Comparative population genomics of the ejaculate in
humans and the great apes. Molecular Biology and Evolution, 30, 964–976.
Guschanski K, Krause J, Sawyer S, Valente LM, Bailey S, Finstermeier K, Sabin R, Gilissen E, Sonet
G, Nagy ZT, Lenglet G, Mayer F, Savolainen V (2013) Next-Generation Museomics
Disentangles One of the Largest Primate Radiations. Systematic Biology, doi:
Acc
epte
d A
rtic
le
This article is protected by copyright. All rights reserved.
10.1093/sysbio/syt018.
Harper GL, McClean N, Goulson D (2008) Analysis of museum specimens suggests extreme
genetic drift in the adonis blue butterfly (Polyommatus bellargus). Biological Journal of
the Linnean Society, 88, 447– 452.
Hellmann I, Mang Y, Gu Z, Li P, de la Vega FM, Clark AG, Nielsen R (2008) Population genetic
analysis of shotgun assemblies of genomic sequences from multiple individuals. Genome
Research, 18, 1020–1029.
Heyn P, Stenzel U, Briggs AW, Kircher M, Hofreiter M, Meyer M (2010) Road blocks on
paleogenomes--polymerase extension profiling reveals the frequency of blocking lesions
in ancient DNA. Nucleic Acids Research, 38, e161.
Higuchi R, Bowman B, Freiberger M, Ryder OA, Wilson AC (1984) DNA sequences from the
quagga, and extinct member of the horse family. Nature, 312, 282-284.
Hodges E, Rooks M, Xuan Z, Bhattacharjee A, Benjamin Gordon D, Brizuela L, Richard McCombie
W, Hannon GJ (2009) Hybrid selection of discrete genomic intervals on custom-designed
microarrays for massively parallel sequencing. Nature Protocol, 4, 960-974.
Hofreiter M, Jaenicke V, Serre D, Haeseler von A, Paabo S (2001) DNA sequences from multiple
amplifications reveal artifacts induced by cytosine deamination in ancient DNA. Nucleic
Acids Research, 29, 4793-4799.
Jakobsson M, Rosenberg N (2007) CLUMPP: a cluster matching and permutation program for
dealing with multimodality in analysis of population structure. Bioinformatics, 23, 1801-
1806.
Jin X, He M, Ferguson B, Meng Y, Ouyang L, Ren J, Mailund T, Sun F, Sun L, Shen J, Zhuo M, Song
Acc
epte
d A
rtic
le
This article is protected by copyright. All rights reserved.
L, Wang J, Ling F, Zhu Y, Hvilsom C, Siegismund H, Liu X, Gong Z, Ji F, Wang X, Liu B,
Zhang Y, Hou J, Wang J, Zhao H, Wang Y, Fang X, Zhang G, Wang J, Zhang X, Schierup
MH, Du H, Wang J, Wang X. (2012) An effort to use human-based exome capture
methods to analyze chimpanzee and macaque exomes. PLoS ONE, 7, e40637.
Johnson PLF, Slatkin M (2008) Accounting for bias from sequencing error in population genetic
estimates. Molecular Biology and Evolution, 25, 199-206.
Krings M, Capelli C, Tschentscher F, Geisert H, Meyer S, von Haeseler A, Grossschmidt K,
Possnert G, Paunovic M, Paabo S (2000). A view of Neandertal genetic diversity. Nature
Genetics, 26, 144–146.
Lemmon A, Emme S, Lemmon E (2012) Anchored hybrid enrichment for massively high-
throughput phylogenomics. Systematic Biology, 61,727-744.
Li H, Handsaker B, Wysoker A, Fennell T, Ruan J, Homer N, Marth G, Abecasis G, Durbin R, 1000
Genome Project Data Processing Subgroup (2009) The Sequence alignment/map (SAM)
format and SAMtools. Bioinformatics, 25, 2078-2079.
Lynch M (2008) Estimation of Nucleotide Diversity, Disequilibrium Coefficients, and Mutation
Rates from High-Coverage Genome-Sequencing Projects. Molecular Biology and
Evolution, 25, 2409-2419.
Maricic T, Whitten M, Pääbo S (2010) Multiplexed DNA Sequence Capture of Mitochondrial
Genomes Using PCR Products. PLoS ONE, 5, e14004.
Mason VC, Li G, Helgen KM, Murphy WJ (2011) Efficient cross-species capture hybridization and
next-generation sequencing of mitochondrial genomes from noninvasively sampled
museum specimens. Genome Research, 21, 1695-1704.
Acc
epte
d A
rtic
le
This article is protected by copyright. All rights reserved.
McCormack JE, Faircloth BC, Crawford NG, Gowaty PA, Brumfield RT, Glenn TC (2012)
Ultraconserved elements are novel phylogenomic markers that resolve placental
mammal phylogeny when combined with species-tree analysis. Genome Research, 22,
746–754.
McDevitt AD, Zub K, Kawałko A, Oliver MK, Herman JS, Wójcik JM (2012) Climate and refugial
origin influence the mitochondrial lineage distribution of weasels (Mustela nivalis) in a
phylogeographic suture zone. Biological Journal of the Linnean Society, 106, 57-69.
Meyer M, Kircher M (2010) Illumina sequencing library preparation for highly multiplexed
target capture and sequencing. Cold Spring Harbor Protocols, 2010, pdb.prot5448.
Moritz C, Patton JL, Conroy CJ, Parra JL, White GC, Beissinger SR (2008) Impact of a century of
climate change on small-mammal communities in Yosemite National Park, USA. Science,
322, 261-264.
Nei M, Maruyama T, Chakraborty R (1975) The bottleneck effect and genetic variability in
populations. Evolution, 29, 1-10.
Nielsen R, Korneliussen T, Albrechtsen A, Li Y, Wang J (2012) SNP calling, genotype calling, and
sample allele frequency estimation from New-Generation Sequencing data. PLoS One, 7,
e37558.
Nielsen R, Paul JS, Albrechtsen A, Song YS (2011) Genotype and SNP calling from next-
generation sequencing data. Nature Review Genetics, 12, 443-451.
Payne RB, Sorenson MD (2002) Museum collections as sources of genetic data. Bonn zoological
Bulletin, 51, 97–104.
Peery MZ, Hall LA, Sellas A, Beissinger SR, Moritz C, Bérubé M, Raphael MG, Nelson SK,
Acc
epte
d A
rtic
le
This article is protected by copyright. All rights reserved.
Golightly RT, McFarlane-Tranquilla L, Newman S, Palsbøll PJ (2010) Genetic analyses of
historic and modern marbled murrelets suggest decoupling of migration and gene flow
after habitat fragmentation. Proceedings of the Royal Society B-Biological Sciences, 277,
697-706.
Perry GH, Marioni JC, Melsted P, Gilad Y (2010) Genomic-scale capture and sequencing of
endogenous DNA from feces. Molecular Ecology, 19, 5332-5344.
Pool JE, Hellmann I, Jensen JD, Nielsen R (2010) Population genetic inference from genomic
sequence variation. Genome Research, 29, 291-300.
Poulakakis N, Glaberman S, Russello M, Beheregaray LB, Ciofi C, Powell JR, Caccone A (2008)
Historical DNA analysis reveals living descendants of an extinct species of Galápagos
tortoise. Proceedings of the National Academy of Sciences of the United States of
America, 105, 15464-15469.
Pritchard JK, Stephens M, Donnelly P (2000) Inference of population structure using multilocus
genotype data. Genetics, 155, 945-959.
Reid N, Demboski JR, Sullivan J (2012) Phylogeny estimation of the radiation western American
chipmunk (Tamias) in the face of introgression using reproductive protein genes.
Systematic Biology, 61, 44-62.
Robin ED, Wong R (1988) Mitochondrial DNA molecules and virtual number of mitochondria per
cell in mammalian cells. Journal of Cellular Physiology, 136, 507-513.
Roderick GK, Navajas M (2003) Genes in new environments: genetics and evolution in biological
control. Nature Reviews Genetics, 4, 889-899.
Rosenberg N (2004) DISTRUCT: a program for the graphical display of population structure.
Acc
epte
d A
rtic
le
This article is protected by copyright. All rights reserved.
Molecular Ecology Resources, 4, 137-138.
Rowe KC, Singhal S, Macmanes MD, Ayroles JF, Morelli TL, Rubidge EM, Bi K, Moritz CC (2011)
Museum genomics: low-cost and high-accuracy genetic data from historical specimens.
Molecular Ecology Resources, 11, 1082-1092.
Roy MS, Girman DJ, Taylor AC, Wayne RK (1994) The use of museum specimens to reconstruct
the genetic-variability and relationships of extinct populations. Experientia, 50, 551–557.
Rubidge EM, Monahan WB, Parra JL, Cameron SE, Brashares JS (2011) The role of climate,
habitat, and species co-occurrence as drivers of change in small mammal distributions
over the past century. Global Change Biology, 17, 696-708.
Rubidge EM, Patton JL, Lim M, Burton AC, Brashares JS, Moritz C (2012) Climate-induced range
contraction drives genetic erosion in an alpine mammal. Nature Climate Change, 2, 285-
288.
Sawyer S, Krause J, Guschanski K, Savolainen V, Paabo S (2012) Temporal patterns of nucleotide
misincorporations and DNA fragmentation in ancient DNA. PLoS ONE, 7, e34131.
Soumillon M, Necsulea A, Weier M, Brawand D, Zhang X, Gu H, Barthes P, Kokkinaki M, Nef S,
Gnirke A, Dym M, de Massy B, Mikkelsen TS, Kaessmann H (2013) Cellular source and
mechanisms of high transcriptome complexity in the mammalian Testis. Cell Reports, 3,
2179-2190.
Singhal S (2013) De novo transcriptomic analyses for non-model organisms: an evaluation of
methods across a multi-species data set. Molecular Ecology Resources, 13, 403-416.
Stiller M, Green RE, Ronan M, Simons JF, Du L, He W, Egholm M, Rothberg JM, Keates SG,
Ovodov ND, Antipina EE, Baryshnikov GF, Kuzmin YV, Vasilevski AA, Wuenschell GE,
Acc
epte
d A
rtic
le
This article is protected by copyright. All rights reserved.
Termini J, Hofreiter M, Jaenicke-Després V, Pääbo S (2006) Patterns of nucleotide
misincorporations during enzymatic amplification and direct large-scale sequencing of
ancient DNA. Proceedings of the National Academy of Sciences of the United States of
America, 103, 13578-13584.
Taberlet P, Griffin S, Goossens B, Questiau S, Manceau V, Escaravage N, Waits LP, Bouvet J
(1996) Reliable genotyping of samples with very low DNA quantities using PCR. Nucleic
Acids Research, 24, 3189–3194.
Tajima F (1989) Statistical method for testing the neutral mutation hypothesis by DNA
polymorphism. Genetics, 123, 585–595.
Tang W, Qian D, Ahmad S, Mattox D, Todd NW et al. (2012) A low-cost exon capture method
suitable for large-scale screening of genetic deafness by the massively-parallel
sequencing approach. Genetic testing and molecular biomarkers, 16, 536-542.
Taylor AC, Sherwin WB, Wayne RK (1994) Genetic variation of microsatellite loci in a
bottlenecked species: the northern hairy-nosed wombat Lasiorhinus krefftii. Molecular
Ecology, 3, 277–290.
Thomas WK, Pääbo S, Villablanca FX, Wilson AC (1990) Spatial and temporal continuity of
kangaroo rat populations shown by sequencing mitochondrial DNA from museum
specimens. Journal of Molecular Evolution, 31, 101–112.
Tingley MW, Monahan WB, Beissinger SR, Moritz C (2009) Birds track their Grinnellian niche
through a century of climate change. Proceedings of the National Academy of Sciences
of the United States of America, 106, 19637-19643.
Trifonov VA, Vorobieva NN, Rens W (2009) FISH With and without COT1 DNA. In: Fluorescence
Acc
epte
d A
rtic
le
This article is protected by copyright. All rights reserved.
In Situ Hybridization (FISH): Application Guide (ed. Liehr T), pp 99-109. Springer-Verlag,
Berlin, Heidelberg.
Väli U, Einarsson A, Waits L, Ellegren H (2008) To what extent do microsatellite markers reflect
genome-wide genetic diversity in natural populations? Molecular Ecology, 17, 3808-
3817.
Wandeler P, Hoeck PE, Keller LF (2007) Back to the future: museum specimens in population
genetics. Trends in Ecology & Evolution, 22, 634-642.
Watterson GA (1975) On the number of segregating sites in genetical models without
recombination. Theoretical Population Biology, 7, 256-276.
Wayne RK, Jenks SM (1991) Mitochondrial DNA analysis implying extensive hybridization of the
endangered red wolf Canis rufus. Nature, 351, 565-568.
Weber DS, Stewart BS, Garza JC, Lehman N (2000) An empirical genetic assessment of the
severity of the northern elephant seal population bottleneck. Current Biolology, 10,
1287-1290.
Wigginton, JE, Cutler DJ, Abecasis GR (2005) A note on exact tests of Hardy-Weinberg
equilibrium. The American Journal of Human Genetics, 76, 887-893.
Wójcik JM, Kawałko A, Marková S, Searle JB, Kotlík P (2010) Phylogeographic signatures of
northward post-glacial colonization from high-latitude refugia: a case study of bank
voles using museum specimens. Journal of Zoology, 281, 249-262.
Yi X, Liang Y, Huerta-Sanchez E, Jin X, Cuo ZX, Pool JE, Xu X, Jiang H, Vinckenbosch N,
Korneliussen TS, Zheng H, Liu T, He W, Li K, Luo R, Nie X, Wu H, Zhao M, Cao H, Zou J,
Shan Y, Li S, Yang Q, Asan, Ni P, Tian G, Xu J, Liu X, Jiang T, Wu R, Zhou G, Tang M, Qin J,
Acc
epte
d A
rtic
le
This article is protected by copyright. All rights reserved.
Wang T, Feng S, Li G, Huasang, Luosang J, Wang W, Chen F, Wang Y, Zheng X, Li Z,
Bianba Z, Yang G, Wang X, Tang S, Gao G, Chen Y, Luo Z, Gusang L, Cao Z, Zhang Q,
Ouyang W, Ren X, Liang H, Zheng H, Huang Y, Li J, Bolund L, Kristiansen K, Li Y, Zhang Y,
Zhang X, Li R, Li S, Yang H, Nielsen R, Wang J, Wang J (2010) Sequencing of 50 human
exomes reveals adaptation to high altitude. Science, 329, 75-78.
Figure legends:
Fig. 1. Sampling localities for the present study. Historical sampling localities (1915) are shown
in filled blue circles and modern (2004–2008) in filled red crosses. The range of Yosemite
National Park (YNP) is outlined by a solid black line. The YNP transect is outlined by dashed
lines. The inset shows the state of California.
Fig. 2. Patterns of mismatches in historic and modern Tamias alpinus sequences. The
frequencies of the 12 types of mismatches (y axis) are plotted as a function of distance from the
5′ and 3′-ends of the sequence reads (x axis). The first 50bp of the sequence reads are shown.
The frequency of each particular mismatch type is calculated as the proportion of a particular
alternative (non-reference) base type at a given site along the read, and is coded in different
colors and line patterns explained at the bottom of the plots: “X > Y” indicates a change from
reference base type X to alternative base type Y.
Fig. 3. Two-dimensional unfolded site frequency spectrum (2D-SFS) for SNPs between historic
(x axis) and modern (y axis) Tamias alpinus specimens. The color of each data point represents
the number of SNPs belonging to the particular category in the 2D-SFS, which is depicted in the
Acc
epte
d A
rtic
le
This article is protected by copyright. All rights reserved.
color key inset.
Fig. 4. Distribution of genome wide per site average pairwise nucleotide diversity (π) and
Watterson's theta (Θw) for historic and modern Tamias alpinus populations. Histograms
showing the frequencies of the log-transformed per site values of Θw (top) and π (bottom)
calculated using allele frequencies weighted by their posterior probabilities for each of the
2,997,745 sites that passed quality control filters. The historic population is depicted in
lavender and the modern population is in light pink as shown in the legend. The magenta
portion of bars represents the overlap between the historic and modern population theta
values.
Fig. 5. Genetic structure of historic and modern Tamias alpinus specimens. (A) Principal
Components Analysis (PCA) plot based on genetic covariance among all the 40 T. alpinus
individuals. The first 3 principle components (PCs) are shown and cumulatively explain 10.58%
of the total genetic variance (3.72%, 3.50%, and 3.36% for PCs 1, 2 and 3, respectively): The
proportion of the genetic variance explained by the PCs is shown in the inset barplot at the
bottom, where each bar is a PC and the y-axis is the proportion of variance explained (the first 3
PCs are colored). Each sphere in the PCA plot represents an individual specimen. Non-blue
spheres are modern specimens and blue spheres are historic specimens. The corresponding 2D-
PCA plots (PC1 vs PC2, PC1 vs PC3 and PC2 vs PC3) are shown in Fig. S4. The barplots at the top
are Bayesian clustering results for historic (K=2, left) and modern (K=3, right) T. alpinus
generated by the program STRUCTURE. Each individual specimen is represented by a horizontal
line partitioned into colored segments that indicate the cluster membership. Spheres labeled at
the bottom of the plots correspond to those from the PCA plot. (B) Each point on the Yosemite
Acc
epte
d A
rtic
le
This article is protected by copyright. All rights reserved.
map corresponds to an individual T. alpinus sample and the color represents the relative
contributions from the first three PCs (red, green, blue) shown in the inset barplot. Specimens
collected from Vogelsang, Evelyn, and Fletcher lakes (shown as yellow and blue members in the
STRUCTURE plot above for modern specimens) are indicated with an arrow.
Supporting Figures:
Fig. S1. Specificity of exon capture in historic and modern Tamias alpinus specimens.
Specificity represents the percentage of cleaned reads aligned within the targets over the total
reads aligned to the consensus assemblies. Each column represents an individual library. Blue
bars are historic and red bars are modern specimens.
Fig. S2. Sequencing coverage of targets enriched in historic and modern Tamias alpinus
specimens. (A) Boxplots showing the first to third quartile of the coverage distribution for
individuals, where each box represents an individual. (B) Cumulative coverage plots show the
distribution of average base coverage per exon. Coverage is shown on the x axis, and the
binned percentage of exons at each coverage on the left y axis. The green line and right y axis
show the cumulative coverage as a percentage of total exons.
Fig. S3. Comparison of performance of exon capture in independent capture experiments.
Base coverage is shown on the x (historic) and y (modern) axes. There is strong correlation in
capture efficiency between the same targets in historic and modern specimens captured on
separate microarrays.
Fig. S4. The first 3 principle components (PCs) from a Principal Component Analysis (PCA) of
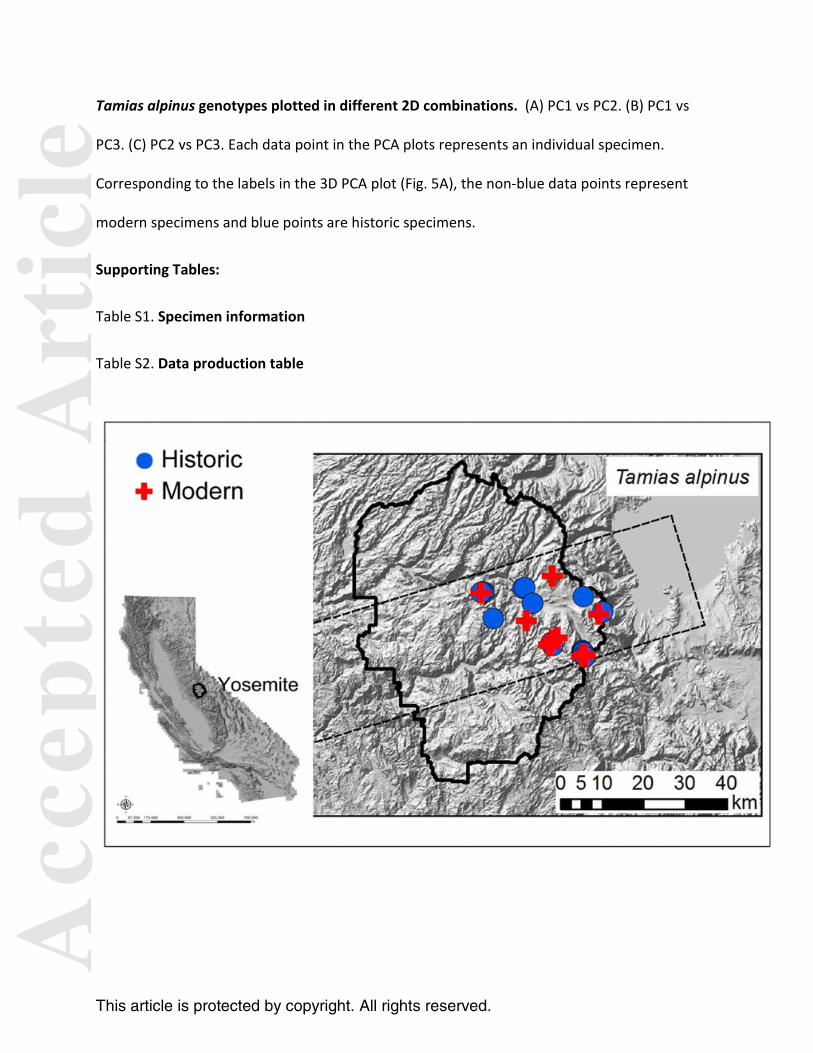
Acc
epte
d A
rtic
le
This article is protected by copyright. All rights reserved.
Tamias alpinus genotypes plotted in different 2D combinations. (A) PC1 vs PC2. (B) PC1 vs
PC3. (C) PC2 vs PC3. Each data point in the PCA plots represents an individual specimen.
Corresponding to the labels in the 3D PCA plot (Fig. 5A), the non-blue data points represent
modern specimens and blue points are historic specimens.
Supporting Tables:
Table S1. Specimen information
Table S2. Data production table
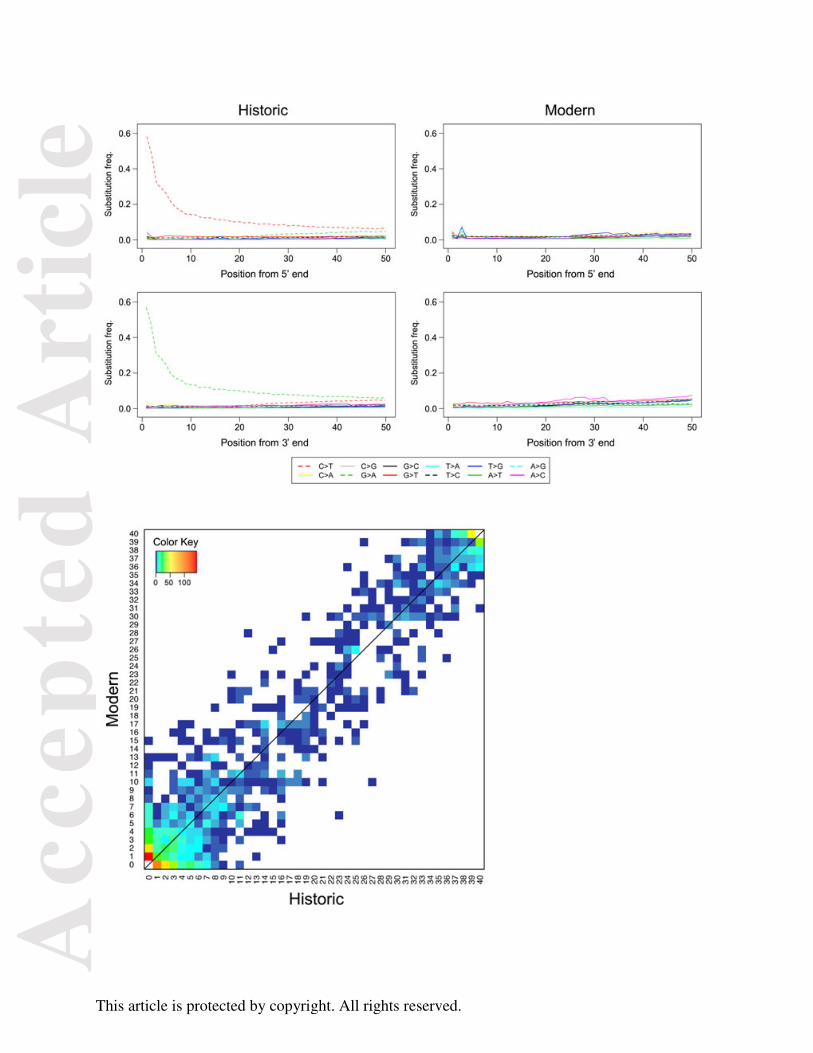
Acc
epte
d A
rtic
le
This article is protected by copyright. All rights reserved.
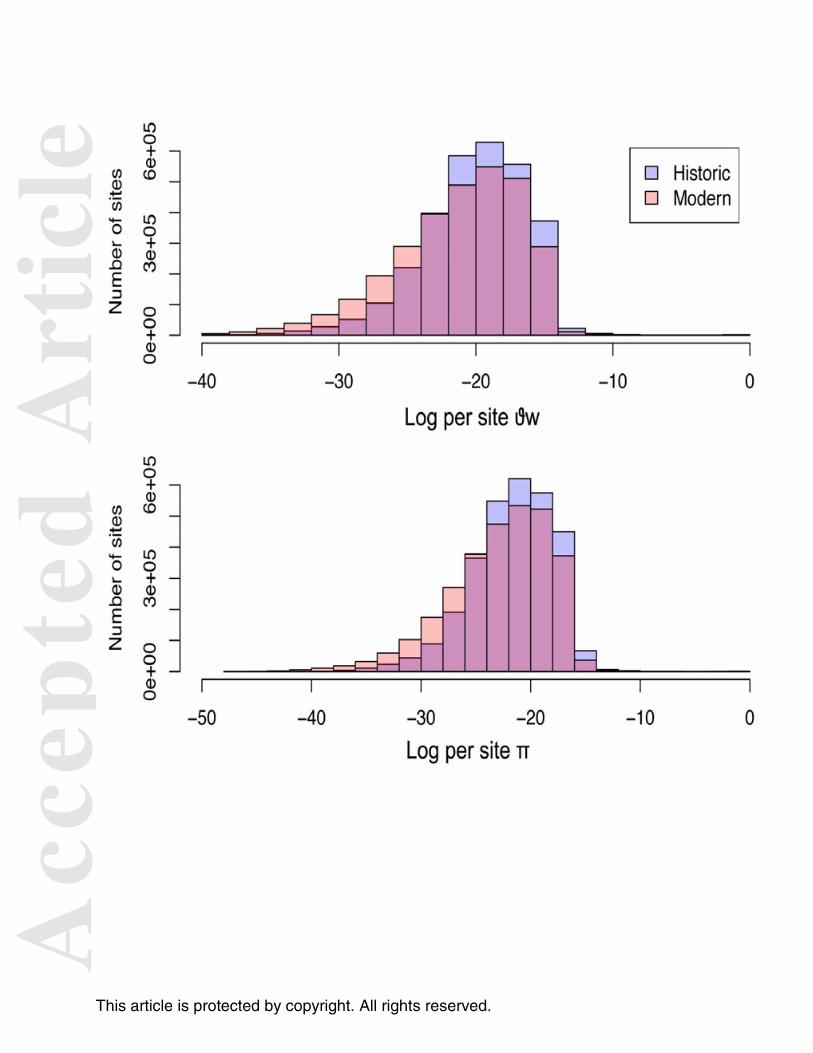
Acc
epte
d A
rtic
le
This article is protected by copyright. All rights reserved.
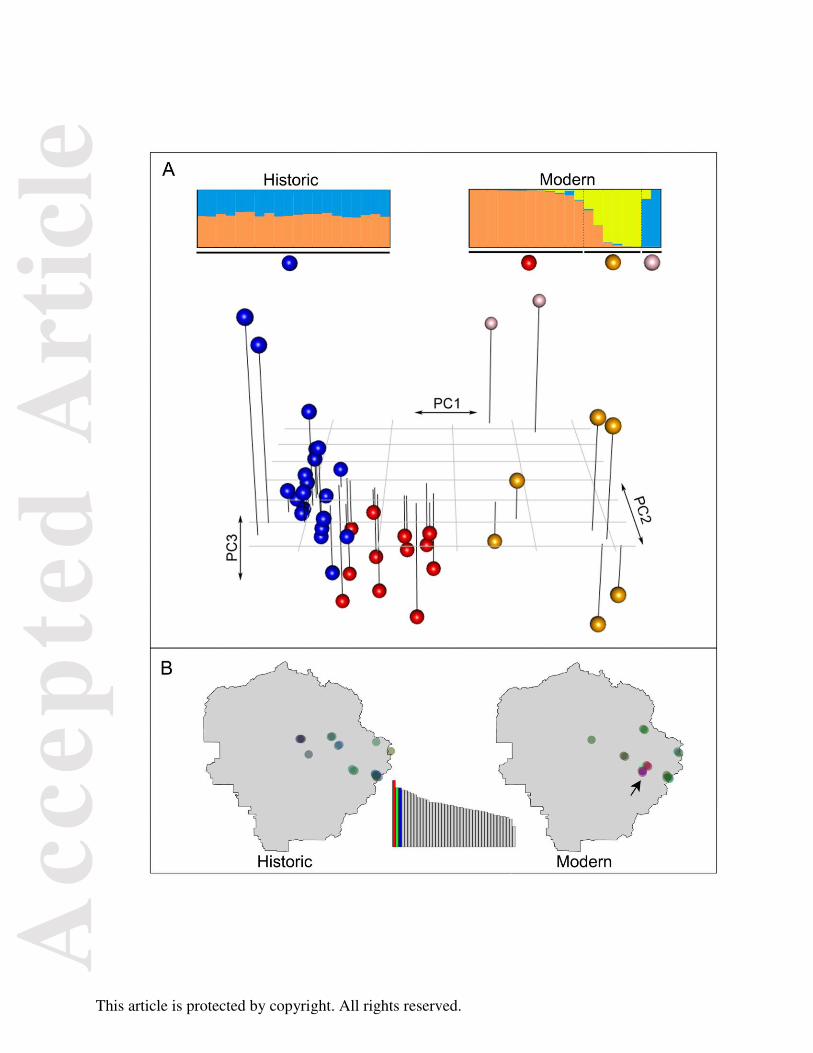
Acc
epte
d A
rtic
le
This article is protected by copyright. All rights reserved.