university of zurich - uzh · 2010-12-09 · to 2 mm from the tympanic annulus. a simple...
TRANSCRIPT

University of ZurichZurich Open Repository and Archive
Winterthurerstr. 190
CH-8057 Zurich
http://www.zora.uzh.ch
Year: 2010
Complex stapes motions in human ears
Sim, J H; Chatzimichalis, M; Lauxmann, M; Röösli, C; Eiber, A; Huber, A M
Sim, J H; Chatzimichalis, M; Lauxmann, M; Röösli, C; Eiber, A; Huber, A M (2010). Complex stapes motions inhuman ears. Journal of the Association for Research in Otolaryngology : JARO, 11(3):329-341.Postprint available at:http://www.zora.uzh.ch
Posted at the Zurich Open Repository and Archive, University of Zurich.http://www.zora.uzh.ch
Originally published at:Journal of the Association for Research in Otolaryngology : JARO 2010, 11(3):329-341.

COMPLEX STAPES MOTIONS IN HUMAN EARS
1Jae Hoon Sim, 1Michail Chatzimichalis, 2Michael Lauxmann, 1Christof Röösli,
2Albrecht Eiber, and 1Alexander M. Huber
1University Hospital Zurich, 2University of Stuttgart
Abstract
It has been reported that the physiological motion of the stapes in human and several animals
in response to acoustic stimulation is mainly piston-like at low frequencies. At higher
frequencies, the pattern includes rocking motions around the long and short axes of the
footplate in human and animal ears. Measurements of such extended stapes motions are
highly sensitive to the exact angulation of the stapes in relation to the measurement devices
and to measurement errors. In this study, velocity in a specific direction was measured at
multiple points on the footplates of human temporal bones using a Scanning Laser Doppler
Vibrometer (SLDV) system, and the elementary components of the stapes motions, which
were the piston-like motion and the rocking motions about the short and long axes of the
footplate, were calculated from the measurements. The angular position of a laser beam with
respect to the stapes and coordinates of the measurement points on the footplate plane were
calculated by correlation between the SLDV measurement frame and the footplate-fixed
frame, which was obtained from micro-CT images. The ratios of the rocking motions relative
to the piston-like motion increased with frequency and reached a maximum around 7 kHz.
A novel method for quantitatively assessing measurements of complex stapes motions and
error boundaries of the motion components is presented. In the frequency range of 0.5 to 8
kHz, the magnitudes of the piston-like and two rocking motions were larger than estimated
values of the corresponding upper error bounds.
Keywords: Stapes, piston-like motion, rocking motion, Laser Doppler Vibrometer (LDV),
micro-CT
1

1. Introduction
Békésy (1960) and Kirikae (1960) described motions of the stapes footplate in human
ears as a combination of translational motions along the longitudinal axis of the stapes
(piston-like motions) and rotational motions (rocking motions). It has been reported that the
human stapes motions are piston-like at low frequencies and include rocking motions along
the long and short axes of the footplate at high frequencies (Heiland et al. 1999; Huber et al.
2001; Hato et al. 2003). Studies of rocking motions have been extended to other animals such
as cat (Decraemer et al. 2000) and gerbil (Decraemer et al. 2007; Ravicz et al. 2008). Most of
the current human cochlear models do not represent the effects of the rocking motions
because these motions are believed to produce no net volume displacement on the oval
window and have negligible effects on hearing mechanisms (Kolston and Ashmore 1996;
Dodson 2001; Lim and Steele 2002). On the measurement side, a previous study by
Rochefoucauld et al. (2007) reported that motion components other than the piston-like
motion did not produce scala-vestibuli pressure in gerbil ears. However, a recent study by
Huber et al. (2008) showed that enhancement of the rocking motions of the stapes by
mechanical stimulation affected the cochlear response in guinea pigs, as demonstrated by
changes in compound action potentials (CAP). It is anticipated that there will be further
investigation of the relation between the rocking motions and fluid-flux inside the cochlea,
and methods to measure stapes motions, particularly the rocking motions, need to be
systemically studied.
Laser Doppler Vibrometer (LDV) systems have been widely used to measure stapes
motions, and several methods to measure all or a subset of the 3-D motion components of the
stapes have been developed using the LDV system. Hato et al. (2003) measured velocities at
five points on the footplate and calculated the piston-like and two rocking motions of the
stapes. Eiber et al. (2007) also calculated the piston-like and two rocking motions from 3-D
velocity components at a point on the stapes head measured using a 3-D LDV system. In
their measurements and resulting calculations, the position and direction of the stapes in the
measurement frame were estimated, and location of the measurement points on the stapes and
the relative angular position of the laser beam with respect to the stapes were obtained based
on the estimation. Inaccuracy in such estimations can cause significant errors in the calculated
motion components, especially on small-sized stapes such as that of guinea pigs. In a study
by Decraemer et al. (2007), 3-D components of motions at multiple points on the stapes were
measured by changing the angular position of the laser beam using goniometers, and six rigid
body motion components of the stapes in gerbil ears were calculated. In that study,
2

coordinates of the observation points were read from the xyz-positioning system. A computed
tomography (CT) model of the stapes was registered in the position of the stapes during the
experiment using these coordinates to fully describe the experimental geometry. However,
complicated setups with the goniometers were required for this accurate assessment of the
angular position of the laser beam with respect to the stapes.
In our study, velocities at multiple points on the stapes footplate were measured using
SLDV. The piston-like and two rocking motions of the stapes were calculated as a response
to physiological sound stimuli for six human ears. An accurate way to relate the SLDV
measurement frame to the footplate-fixed frame and thus determine coordinates of
measurement points and the laser beam direction in the footplate-fixed frame was introduced
using micro-CT technology.
Detailed investigation of the quantitative assessment of the effects of measurement
errors on the rigid body motion components of the stapes was another goal of this study. In
the work by Hato et al. (2003), reverse calculation of velocities at the measurement points
from identified rigid body motion components was used to verify consistency of measurement
and calculation of the overall stapes motions. However, if contribution of a specific rigid body
motion component to the entire stapes motion is relatively small, then good agreement
between the original measurement and the reverse calculation does not guarantee accuracy of
the rigid body motion component. In this study, the error boundaries of the motion
components were examined and compared with the components of the stapes motions
obtained from the measurements.
2. Material and Methods
2.1 Specimen preparation
Six temporal bones (TBs) from the right side of human cadavers (an average age of
approximately 60 years) were used in this study. The human TBs were harvested within 24 h
after death and were placed in 0.1% Cialit (sodium-2-ethylmercurimercapto-benzoxazol-5-
carbonide) solution, at 4° C. The TBs were inspected using an operating microscope for
possible abnormalities. All experiments were performed within 7 days of the explantation.
After removal of all connective tissues and muscles, the external ear canal was drilled down
to 2 mm from the tympanic annulus. A simple mastoidectomy with posterior tympanotomy,
which included removal of the mastoid and a part of the tympanic segment of the facial nerve
and surrounding bone, was performed in order to obtain a clear and near-perpendicular view
3

of the stapes footplate. The tympanic membrane (TM), ossicles, stapedius muscle, and tendon
were left intact. All temporal bones were periodically moistened with physiological saline
solution to prevent drying during preparation.
2.2 Velocity measurement
The loudspeaker (ER-2, Etymotic Research, USA) and the microphone probe (ER-7C,
Etymotic Research, USA) were placed in an artificial external ear canal near the TM. The
artificial external ear canal (AEEC) was attached and sealed acoustically using silicone and
bony wax to the bony rim of the former external ear canal, creating an acoustic chamber of
about 0.5 ml volume. The distance between the microphone probe and the TM center was
maintained at approximately 3 mm.
A multi-frequency sound consisting of harmonic sound waves with 32 different
frequencies in the range of 0.5 to 8 kHz was generated by a function generator (HP 33120A,
Hewlett Packard, USA) and delivered via the loudspeaker. The frequency steps in the multi-
frequency sound were 100 Hz from 0.5 to 2 kHz, 200 Hz from 2 to 3 kHz, 300 or 400 Hz
from 3 to 4 kHz, and 500 Hz from 4 to 8 kHz. The sound pressure level (SPL) in the ear canal
was measured by the microphone probe in front of the TM, and amplitude of stimulation at
each frequency was adjusted by HLV 1.01 software (Polytec GmbH, Germany), such that the
SPL had a flat spectrum within 5 dB along the measured frequency range. The final SPL with
adjusted amplitudes was in the range of 94 to 105 dB. The magnitude and phase of the
velocities at multiple points (150 to 200 points) on the footplate were measured using an
OFV-3001 SLDV system (Polytec GmbH, Germany), and the X and Y coordinates of the
measurement points in the SLDV measurement frame were recorded by PSV V8.5 software
(Polytec GmbH, Germany). A sampling frequency of 25.6 kHz was chosen to prevent aliasing,
and the frequency resolution was set at 12.5 Hz.
2.3 Frame registration
The XYZ coordinate system of the SLDV measurement frame was set such that the laser
beam was along the Z direction and the XY plane was normal to the laser beam, while the xyz
coordinate system of the footplate-fixed frame was determined such that the xy plane was best
fit to the lateral-side surface of the footplate (the surface to which the stapes crura are
attached), and the origin was on the centroid of the surface. The 3-D feature of the stapes
obtained from micro-CT images was used for calculation of the footplate-fixed frame. In the
footplate-fixed frame, the long axis of the footplate was set as the x axis, the short axis of the
4
footplate as the y axis, and the direction normal to the xy plane as the z axis. The posterior,
inferior, and lateral directions were set as positive directions for the x, y, and z axes for the
right ear.
Because an inaccurate estimation of position and direction of the footplate in the SLDV
measurement frame may produce significant errors in calculation of the rigid body motion
components, an accurate way of obtaining the relation between the SLDV measurement frame
and the footplate-fixed frame was developed using micro-CT technology. Five to seven retro-
reflective glass beads of 50-micron diameter were placed on the footplate and/or the anterior
crus of the stapes. The beads were attached before velocity measurements and were held in
position by capillary adhesion during the measurements. After the velocity measurements,
while maintaining the SLDV measurement frame, the laser beam was positioned on the beads
and the X and Y coordinates of the beads in the SLDV measurement frame were recorded by
the PSV V8.5 software. Next, the stapes with glass beads in position was carefully removed
from the TBs, and the glass beads were glued onto the stapes. To avoid any displacement of
the beads due to the manipulation, a gel-type glue was used, and it was applied from the
direction perpendicular to the bony surfaces where the beads were placed. The stapes with
glass beads attached was scanned by the micro-CT scanner with a 12-micron resolution to
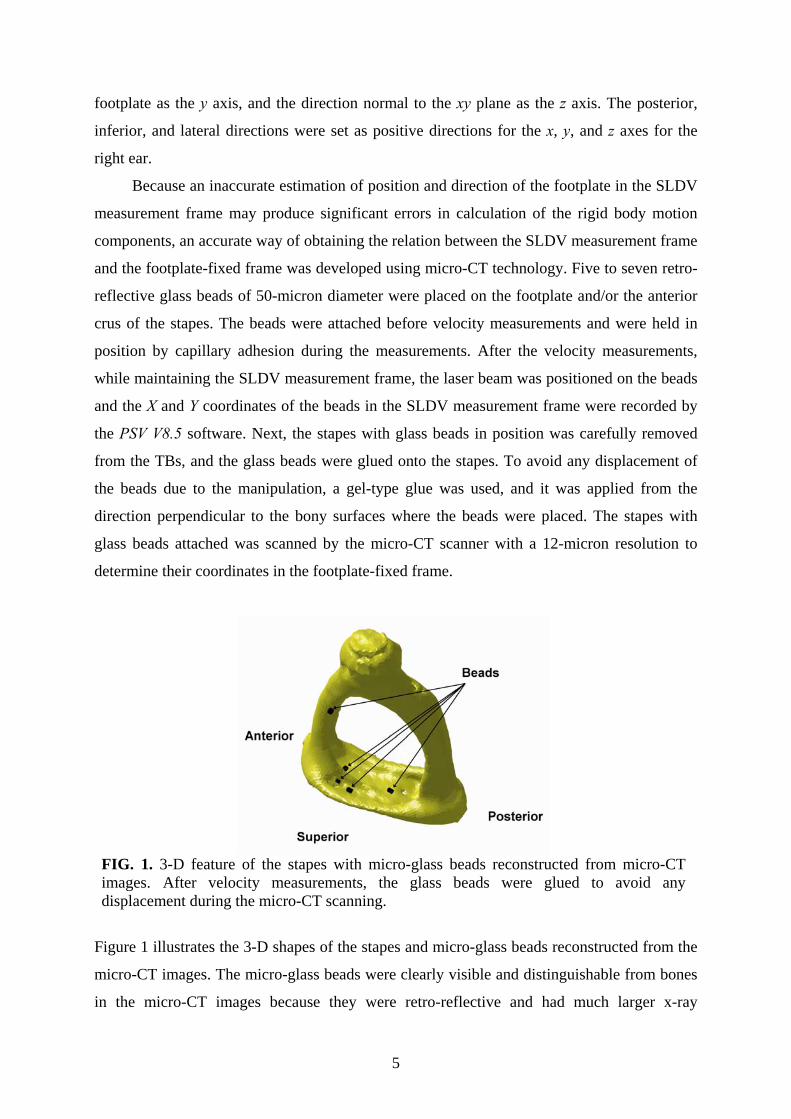
determine their coordinates in the footplate-fixed frame.
FIG. 1. 3-D feature of the stapes with micro-glass beads reconstructed from micro-CT images. After velocity measurements, the glass beads were glued to avoid any displacement during the micro-CT scanning.
Figure 1 illustrates the 3-D shapes of the stapes and micro-glass beads reconstructed from the
micro-CT images. The micro-glass beads were clearly visible and distinguishable from bones
in the micro-CT images because they were retro-reflective and had much larger x-ray
5

attenuation than the bones. When the gray-scale level on the image was linearly scaled such
that the maximum attenuation and no attenuation corresponded to values of 1,000 and 0, the
gray-scale values of the bones were below 500 and the values of the beads were above 980.
With coordinate values of the glass beads in the SLDV measurement frame and footplate-
fixed frame, the relation between these two frames is given by the following equation (Sim
2007).
shiftb
shiftb
shiftb
b
b
b
zz
yy
xx
Z
Y
X
Q , (1)
where
.
coscossincoscossinsinsinsincossincos
sincoscoscossinsinsincossinsinsincos
sincossincoscos
Q
Xb, Yb, and Zb are coordinates of the glass beads in the SLDV measurement frame, while xb, yb,
and zb are the corresponding coordinates in the footplate-fixed frame. xshift, yshift, and zshift
indicate the offsets of the origins between the two frames. Three Eulerian angles of φ, θ, and
ɸ, which were rotation angles of the footplate-fixed frame with respect to z, y, and x axes in
sequence (Type I, Greenwood 1988), and the offsets xshift, yshift, and zshift were calculated by
correlation of the coordinate values of the glass beads in both frames. To get three Eulerian
angles from five or seven reference points, the Levenberg-Marquardt method, a nonlinear
least-square error method provided in Matlab (The MathWorks Inc.), was used. Because the Z
coordinate values of the glass beads (Zb) cannot be detected from the SLDV System, Eq. (1)
has two sets of the Eulerian angles as a solution. To avoid an unexpected solution set and
“local minimum” in the nonlinear least-square error method, approximate adjusting was
performed manually before the numerical calculation.
With the obtained relation between the SLDV measurement frame and the footplate-
fixed frame, coordinates Xm and Ym of a measurement point m in the SLDV measurement
frame, which were recorded during the velocity measurement by the PSV V8.5 software, were
converted into the corresponding coordinates xm, ym, and zm in the footplate-fixed frame.
6

(2)
shift
shift
shift
m
m
m
m
m
m
z
y
x
Z
Y
X
z
y
x1-Q
Because the Z coordinate value Zm of the measurement point could not be measured, Eq. (2)
was solved assuming the measurement points were on the xy plane (zm = 0) of the footplate-
fixed frame. Figure 2 illustrates the stapes registered in the footplate-fixed frame and
measurement points (black dots on the figure) aligned on the xy plane. With the micro size of
the glass beads, the relation between the measurement frame and the footplate-fixed frame
could be precisely obtained.
FIG. 2. The stapes of a human ear and measurement points aligned in the footplate-fixed frame. Coordinates of the measurement points in the footplate-fixed frame were calculated by correlation between the SLDV measurement frame XYZ and footplate-fixed frame xyz, which was obtained from coordinates of the glass beads in both frames. All measurement points were assumed to be on the xy plane of the footplate-fixed frame
2.4 Calculation of the elementary components in the stapes motion
Rigid body motions of the stapes can be described with three translational components
and three rotational components about a reference point in a given reference frame. If the
annular ring restricts in-plane motions of the stapes footplate considerably, then only three
substantial motions of the footplate remain: one translational component in the z direction at
the footplate center and two rotational components about the long and short axes of the
7

footplate (Fig. 3). The translational motion of the footplate center in the z direction is usually
called a piston-like motion, and the two rotational motions are called rocking motions.
In previous studies (Békésy 1960; Kirikae 1960; Heiland et al. 1999; Hato et al. 2003),
it has been assumed that due to the shape of the annular ligament and the mechanical stress
and strain distribution in it, the in-plane motions of the footplate, which resulted from
translational displacements in the x and y directions and rotations around the z axis, are much
smaller by magnitudes than the piston-like and rocking motions. Though the restriction of the
in-plane motion of the footplate has not been proved and there still exists the possibility that
the magnitude of the other components are comparable to the piston-like and rocking motions,
it is assumed in this study that the piston-like and two rocking motions are the elementary
components of the stapes motions.
FIG. 3. Rigid body motion components of the stapes. A Translational motion voz of the footplate center (piston-like motion), B rotational motion ωx around the long axis of the footplate (rocking around the long axis of the footplate), and C rotational motion ωy around the short axis of the footplate (rocking around the short axis of the footplate).
8

Denoting the rotational velocity along the x axis as ωx, the rotational velocity along the
y axis as ωy, and the translational velocity of the footplate center (the origin of the footplate-
fixed frame) along the z axis as voz, these rigid body motion components are related to the
velocity component vmz of the measured velocity at a point m on the footplate plane (zm = 0)
as follows:
mymxozmz xyvv . (3)
The velocity at the point has only a z-component because in-plane motions along the footplate
plane are assumed to be negligible (ωz = vmx = vmy = 0). With an angle θL between the laser
beam direction and the z axis (shown in Fig. 2), the relation between measured velocities and
rigid body motion components of the stapes can be expressed as
rm Avv Lcos , (4)
where vm is a vector with measured velocities, A is the matrix determined from x and y
coordinates of the n measurement points on the footplate, and vr is a vector with rigid body
motion components
3
2
1
2
1
2
1
in
i
i
ti
n ev
ev
ev
e
v
v
v
mv , ,
nn xy
xy
xy
1
1
1
22
11
A
y
x
oz
iy
ix
ioz
ti
y
x
oz
e
e
ev
e
v
rv .
Where ω is an angular frequency, m is the phase of the velocity of the measured vm, and oz ,
x , and z indicate the phases of the rigid body motion components voz, ωx, and ωy. Taking
more than three non-colinear measurement points into account, the method of least squares
error is used to express vr by the following relationship
mr vAAAv T1T
Lcos
1. (5)
In the calculation with Eq. (5), the velocities were taken as complex numbers from their
magnitude and phase data.
9

The phases were recorded for both ear canal pressure and velocities of the points on
the footplate, and the phase m of the measured velocity vm was obtained as the relative
phases with respect to the phase EC of ear canal pressure PEC. Consequently, the phases oz ,
x , and z of the stapes motion components voz, ωx, and ωy were also calculated with respect
to the phase of the ear-canal pressure. The phases of the rotational velocity components were
taken in the positive x (posterior), y (inferior), and z (lateral) directions. The distance between
the microphone and the TM was much smaller than the wavelengths of the sound waves at the
measurement frequencies; therefore, the effects of the phase delay in the ear canal on the
measurement data were negligible.
2.5 Error analysis
The maximum possible error (MPE) in each rigid body motion component was
introduced as an estimation of the maximum possible error of the motion component (Eqs.
(A.19-A.21)), and the error ratio (ER) was obtained as a ratio of the MPE to the magnitude of
the corresponding rigid body motion component (Eqs. (A.22-24)).
In calculation of the MPE, the actual measurement error at a measurement point could
not be measured, and a measurement error measure, as defined in Eq. (A.18) was used. This
measurement error measure at a measurement point was calculated from the difference
between the measured velocity and the recalculated velocity, which was reversely calculated
from the rigid body motion components. In calculating the difference, the complex numbers
of the two velocities were taken to consider both magnitude and phase. The difference was
also weighted by a factor that described the contribution of the measured velocity to
calculation of the rigid body motion components. Definitions and details of the mathematical
formulations may be found in the “Appendix”.
10

3. Results
3.1 Motions of the stapes
Figure 4 illustrates the piston-like and rocking motions calculated from two separate
measurements in a temporal bone. The magnitudes of the motion components were
normalized by the magnitude |PEC| of the ear canal pressure, and the phases of the motion
components were calculated for the positive x, y, and z axes relative to the phases EC of the
ear canal pressure, as described in the “Calculation of the elementary components in the
stapes motions”. The black lines represent the first measurement, while the gray lines
represent the second measurements in the temporal bone. In both magnitude (A) and phase
(B), the two measurements showed very good (voz, ωy) and good (ωx) repeatability.
FIG. 4. Comparison of the two measurements in a temporal bone. A Magnitudes |voz|, |ωx|, and |ωy| and B phases oz , x , and y of the piston-like and rocking motion components
calculated from the two separate measurements (black: first measurement, gray: second measurement) in a temporal bone. The magnitudes were normalized by the magnitude |PEC| of ear canal pressure, and the phases were calculated relative to the phase EC of the ear
canal pressure, for the positive x (posterior), y (inferior), and y (lateral) directions.
Figure 5 illustrates translational velocities voz in the z direction at the center of the
footplate normalized by the ear canal pressure as well as their mean values in comparison
with the data of Asai et al. (1997) and Hato et al. (2003). The magnitude of this normalized
piston-like motion showed amplitudes between the results from Asai et al. (1997) and Hato et
al. (2003) below 2.5 kHz and were similar to Asai et al. (1997) above 2.5 kHz. The averaged
magnitude had its peak around 1.0 kHz, and the minimum values were around 6.5 kHz.
Variation of the phase of the translational motion in the considered frequency range was less
than 2 cycles. The six bone measurements showed considerable individual differences in
magnitude.
11

FIG. 5. Translational velocity (piston-like motion) voz in the z direction at the footplate center (piston-like motion) normalized by the ear-canal pressure PEC in comparison to data from Asai et al. (1997, dotted) and Hato et al. (2003, dashed). A Magnitude |voz| and B phase oz . The phases were taken from the translational velocity components in the
negative z direction (medial direction).
Figure 6 illustrates rotational velocities ωx along the long axis (x axis) of the footplate
normalized by the ear canal pressure (A: magnitude and B: phase). The averaged magnitude
had its peak around 1.0 kHz and the minimum values were around 6.0 kHz. At low
frequencies around 500 Hz, the phase of the rotational velocity component in the positive x
direction showed about a half-cycle difference from the phase of the translational velocity
component in the positive z direction at the footplate center (Fig. 6B). The phase of the
rotational velocity component in the positive x direction decreased with frequency, showing
less than a 2-cycle variation between 0.5 and 8 kHz.
FIG. 6. Rotational velocity (rocking motion) ωx around the long axis normalized by the ear-canal pressure. A Magnitude |ωx| and B phase x . The phases were taken from the
rotational velocity components in the positive x direction (posterior direction).
12
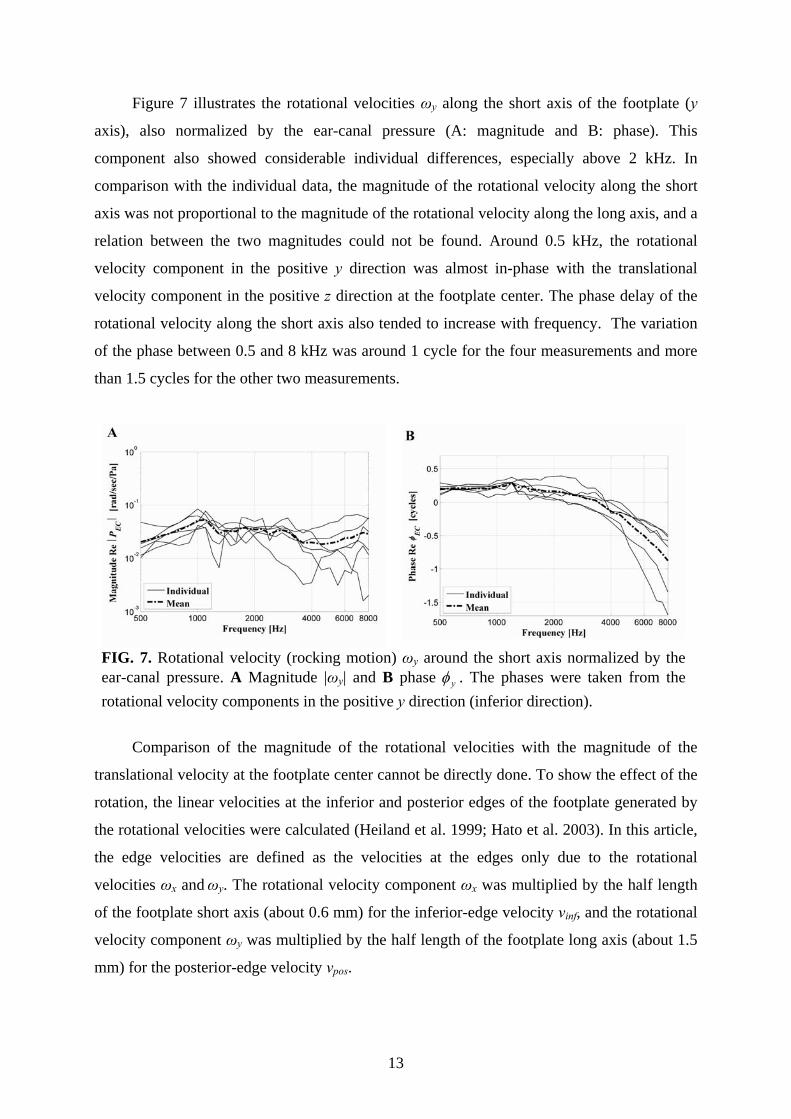
Figure 7 illustrates the rotational velocities ωy along the short axis of the footplate (y
axis), also normalized by the ear-canal pressure (A: magnitude and B: phase). This
component also showed considerable individual differences, especially above 2 kHz. In
comparison with the individual data, the magnitude of the rotational velocity along the short
axis was not proportional to the magnitude of the rotational velocity along the long axis, and a
relation between the two magnitudes could not be found. Around 0.5 kHz, the rotational
velocity component in the positive y direction was almost in-phase with the translational
velocity component in the positive z direction at the footplate center. The phase delay of the
rotational velocity along the short axis also tended to increase with frequency. The variation
of the phase between 0.5 and 8 kHz was around 1 cycle for the four measurements and more
than 1.5 cycles for the other two measurements.
FIG. 7. Rotational velocity (rocking motion) ωy around the short axis normalized by the ear-canal pressure. A Magnitude |ωy| and B phase y . The phases were taken from the
rotational velocity components in the positive y direction (inferior direction).
Comparison of the magnitude of the rotational velocities with the magnitude of the
translational velocity at the footplate center cannot be directly done. To show the effect of the
rotation, the linear velocities at the inferior and posterior edges of the footplate generated by
the rotational velocities were calculated (Heiland et al. 1999; Hato et al. 2003). In this article,
the edge velocities are defined as the velocities at the edges only due to the rotational
velocities ωx and ωy. The rotational velocity component ωx was multiplied by the half length
of the footplate short axis (about 0.6 mm) for the inferior-edge velocity vinf, and the rotational
velocity component ωy was multiplied by the half length of the footplate long axis (about 1.5
mm) for the posterior-edge velocity vpos.
13

Figure 8 illustrates relative magnitudes (A: inferior-edge velocity and C: posterior-
edge velocity) and phases (B: Inferior-edge velocity and D: Posterior-edge velocity) of the
edge velocities with respect to the footplate-center velocity in the z direction. The relative
phases of the edge velocities were calculated by subtracting the phase of the footplate-center
velocity in the positive z direction from the phases of the edge velocities.
FIG. 8. Relative magnitudes and phases of the edge velocities due to the rocking of the footplate with respect to the footplate-center velocity (piston-like motion) A Relative magnitude and B phase of the inferior-edge velocity vinf due to the rocking of the footplate along the long axis, and C relative magnitude and D phase of the posterior-edge velocity vpos due to the rocking of the footplate along the short axis.
The mean ratio of the inferior-edge velocity to the footplate-center velocity began at
approximately -14 dB at 0.5 kHz, and reached the maximum of -7 dB around 7.5 kHz. The
mean ratio reported by Hato et al. (2003) had the maximum of about 5.5 dB around 5.5 kHz.
In contrast, our values for this ratio were larger below 2 kHz and smaller above 2 kHz than
the values by Hato et al. The relative phases of the inferior-edge velocities were about -0.5
cycle up to 2 kHz in the averaged value and showed large individual differences above 2 kHz.
14

This means that the rotational motion along the negative x axis (anterior direction) is in-phase
with the piston-like motion in the positive z direction (lateral direction) at low frequencies.
The mean ratio of the posterior-edge velocity to the footplate-center velocity tended to
increase with frequency, and reached the maximum of 7 dB around 7 kHz. Our values for this
ratio were larger than the corresponding values reported by Hato et al. (2003) and Heiland et
al. (1999) below 4 kHz. The relative phase of the posterior-edge velocity was around zero
(That is, the rotational motion along the inferior direction was in-phase with the piston-like
motion in the lateral direction) below 1.5 kHz. Above 1.5 kHz, the relative phase of the
posterior-edge velocity tended to increase with frequency for the four measurements, while
the relative phase did not increase with frequency for the other two measurements.
3.2 Maximum possible error (MPE) of stapes motion components
Figure 9 illustrates the mean magnitudes of the rigid body motion components
normalized by the ear-canal pressure |voz|, |ωx|, and |ωy| and the corresponding MPE |voz|MPE,
|ωx|MPE, and |ωy|MPE.
FIG. 9. Mean magnitudes of rigid body motion components (black) and their mean maximum possible errors (MPEs, gray) A Translational velocity at the footplate center and B rotational velocities around the long and short axes of the footplate.
The mean magnitude of the translational velocity at the footplate center normalized to the ear
canal sound pressure was much larger than the corresponding maximum possible error across
frequency (Fig. 9A). The mean magnitude of the rotational velocity component about the long
axis (solid in Fig. 9B) was above the corresponding MPE (dashed in Fig. 9B) up to 5 kHz.
The mean magnitude of the rotational velocity component along the short axis (dot-dashed in
Fig. 9B) was above the corresponding MPE through the whole measurement frequency range
(dotted in Fig. 9B).
15

4. Discussion
4.1 Rocking motions
In our measurements, there existed rocking motions comparable to the piston-like
motion in the frequency range of measurement (Fig. 8). Such rocking motions are presumed
to be caused by the stimuli parallel to the footplate, on the stapes head (excitations in the XH
and YH in Fig.10, Eiber et al. 2007; Huber et al. 2008).
FIG. 10. Excitation of the elementary motion components on the stapes head. The excitation in the ZH direction mainly generates a piston-like motion, while the excitations in the XH and YH directions mainly generate rocking motions about the short and long axes of the footplate
The excitation in the ZH direction mainly generates a piston-like motion, while the excitations
in the XH and YH directions mainly generate rocking motions about the short and long axes of
the footplate. Considering the middle-ear anatomy of the human, stimuli for the rocking
motions are expected. The anterior part and posterior parts of the TM in human ears, which
are divided by its attachment to the manubrium, have different shapes and sizes. The non-
symmetric modes of the TM motions between the anterior and posterior aspects in human ears
can cause torsional motions of the malleus (Puria et al. 2007a). Existence of such torsional
motions is enhanced by the cross-sectional shape of the malleus handle, which has a circular
shape in human (Puria et al. 2007b). The circular cross-section of the human malleus handle
has an isotropic strength against forces in all directions, including the torsional stimuli. The
torsional motions of the malleus in human ears are expected to be transferred as various
stimulations to the stapes through the deformable joint between the malleus and incus. It is
known that cat ears also have a non-symmetric TM, a circular cross-sectional shape in the
16

malleus handle, and a deformable joint between the malleus and incus (Puria et al. 2007a).
The vibrational modes of the cat stapes have been studied previously (Guinan and Peake
1967; Decraemer and Khanna 1999; Decraemer et al. 2000), and it was demonstrated that
complex modes of stapes motion occur, including rocking motions.
4.2 Error on the motion components
Considering the magnitudes of the rigid body components reconstructed from
measurements and the corresponding maximum possible errors in physiological motions (Fig.
9), the translational velocity component at the footplate’s center is valid, but validities of the
rotational velocity components are limited. The rotational velocity around the short axis (y
axis) has good validity along the whole measurement frequency range (0.5 to 8 kHz), while
the rotational velocity around the long axis (x axis) has good validity only below 5 kHz. To
get better results for assessing the rocking motion, the signal-to-noise ratio in the LDV
measurement should be increased with improved measurement conditions such as reflectivity
of the laser beam on the measured surface and performance of the SLDV system. A wider
range of measurement area closer to the footplate center and a laser beam direction more
perpendicular to the footplate are also desired for better accuracy (see section A.1 in
Appendix). However, obtaining such a measurement setup is limited by the surgical access to
the stapes. The small measurement area causes large errors on the rotational velocities by
making mlx and mly in Eq. (A.19 – A.20) large. With our surgical access procedure, an
angle of approximately 50° to 60° between the laser beam and the footplate plane was
obtained. Such limitations in surgical access can be improved by altering the surgical access
to expose more area of the footplate.
The footplate position error causes errors in the coordinates of the measurement points
and the laser beam direction, and thus errors in the rigid body motion components. In this
study, five to seven micro-glass beads of 50-micron diameter were attached to the stapes to
obtain a correlation between the SLDV measurement frame and the footplate-fixed frame.
Considering the size of the glass bead, the alignment error within the range of ± 4.3 degrees is
expected with five glass beads. The error range becomes smaller by increasing the number of
the glass beads or decreasing the size of the glass beads and placing them as far as possible
from each other.
17

4.3 Individual difference
In the magnitudes and phases of all stapes motion components, the measurements
showed large standard deviations. The large deviations in the measurements are presumed to
be mainly due to large individual differences in middle-ear anatomy (Sim and Puria 2008) as
well as the older age of the donors. For the six temporal bones used in this study, the standard
deviation of the footplate area was 8.5 % of the averaged values (2.97 ± 0.25 mm2).
5. Conclusion
For assessing measurements of stapes motion, the maximum possible error was
introduced as a reference for error boundaries of the elementary motion components of the
stapes. In the measurements of physiological motions with our measurement setup and
conditions, the magnitude of the rotational velocity component about the long axis of the
footplate was almost the same as the corresponding maximum possible error above 5 kHz. To
overcome the small magnitudes of the motion components and get valid results, the
measurement conditions such as reflectivity of the laser beam on the measured surface and
performance of the SLDV system should be improved.
In this study, micro-CT imaging technology with micro-beads attached to the stapes was
introduced to obtain accurate coordinates of the measurement points and laser beam
orientation in the footplate-fixed frame.
In the frequency range of 0.5 to 8 kHz, the magnitudes of the rocking motions were
comparable to the magnitude of the piston-like motion, although there were large individual
differences. Regardless of whether the rocking motions are desirable or not, a considerable
amount of these motions exist, at least in human. Therefore, the detailed contribution of the
rocking motions to hearing should be investigated in the future.
18
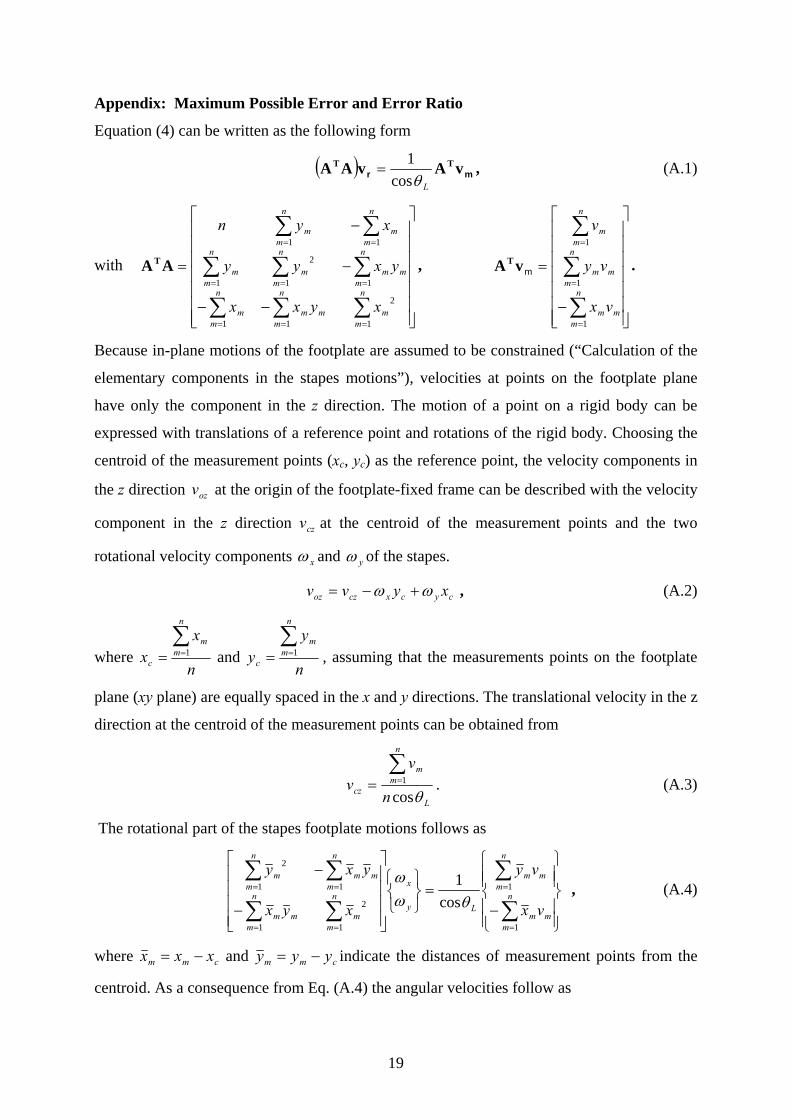
Appendix: Maximum Possible Error and Error Ratio
Equation (4) can be written as the following form
mr vAvAA TT
Lcos
1 , (A.1)
with , .
n
mm
n
mmm
n
mm
n
mmm
n
mm
n
mm
n
mm
n
mm
xyxx
yxyy
xyn
1
2
11
11
2
1
11
AAT
n
mmm
n
mmm
n
mm
vx
vy
v
1
1
1
mvAT
Because in-plane motions of the footplate are assumed to be constrained (“Calculation of the
elementary components in the stapes motions”), velocities at points on the footplate plane
have only the component in the z direction. The motion of a point on a rigid body can be
expressed with translations of a reference point and rotations of the rigid body. Choosing the
centroid of the measurement points (xc, yc) as the reference point, the velocity components in
the z direction at the origin of the footplate-fixed frame can be described with the velocity
component in the z direction at the centroid of the measurement points and the two
rotational velocity components
ozv
czv
x and y of the stapes.
cycxczoz xyvv , (A.2)
where n
xx
n
mm
c
1 and
n
yy
n
mm
c
1 , assuming that the measurements points on the footplate
plane (xy plane) are equally spaced in the x and y directions. The translational velocity in the z
direction at the centroid of the measurement points can be obtained from
L
n
mm
cz n
vv
cos1 . (A.3)
The rotational part of the stapes footplate motions follows as
n
mmm
n
mmm
Ly
x
n
mm
n
mmm
n
mmm
n
mm
vx
vy
xyx
yxy
1
1
1
2
1
11
2
cos
1
, (A.4)
where cmm xxx and cmm yyy indicate the distances of measurement points from the
centroid. As a consequence from Eq. (A.4) the angular velocities follow as
19

n
mmm
Lx vlx
1cos
1
and (A.5)
n
mmm
Ly vly
1cos
1
, (A.6)
where 2
11
2
1
2
11
2
n
iii
n
ii
n
ii
n
iiim
n
iim
m
yxyx
yxxxylx and
2
11
2
1
2
11
2
n
iii
n
ii
n
ii
n
iiim
n
iim
m
yxyx
yxyyxly .
In above equations,
n
iix
1
2 and
n
iiy
1
2 are determined by the size of the measurement area,
while
n
iii yx
1
is determined by the shape of the measurement area. In the case that the scan
area is symmetric with respect to the axes,
n
iii yx
1
becomes zero. The measured velocities vm
contain a true velocity vmT and a measurement error vm
E
Em
Tmm vvv . (A.7)
Substituting Eq. (A.3) and (A.7) into Eqs. (A.2), (A.5), and (A.6), the following equations are
obtained.
n
m
Em
Tmm
L
Ex
Txx vvlx
1cos
1
, (A.8)
n
m
Em
Tmm
L
Ey
Tyy vvly
1cos
1
, (A.9)
c
Ey
Tyc
Ex
Tx
L
n
m
Em
Tm
Eoz
Toz xy
n
vvvv
cos1 . (A.10)
From Eqs. (A.8) - (A.10), it follows,
n
m
Emm
L
Ex vlx
1cos
1
, (A.11)
n
m
Emm
L
Ey vly
1cos
1
, (A.12)
20

cE
ycE
xL
n
m
Em
Eoz xy
n
vv
cos1 . (A.13)
Observing Eqs. (A.11) and (A.12), errors in angular velocities due to measurement errors
become smaller with the smaller magnitudes of (lx)m and (ly)m. The magnitudes of (lx)m and
(ly)m can be reduced by increasing the size of the measurement area. In Eq. (A.13), it is shown
that error in the piston-like motion (translational components at the footplate center) is related
to the location of the scan area. When the scan area is farther from the center of the footplate
(that is, the magnitudes of xc and yc are larger), errors in angular motions are more reflected
into the calculated translational motion of the footplate center. It is also obvious that the
smaller θL results in smaller errors.
The magnitudes of the velocity component errors in Eqs. (A.11) – (A.13) can be
bounded by the following relations
n
m
Emm
L
Ex vlx
1cos
1
, (A.14)
n
m
Emm
L
Ey vly
1cos
1
, (A.15)
n
m
Emmc
n
m
Emmc
n
m
Em
L
Eoz vlyxvlxy
n
vv
11
1
cos
1
. (A.16)
If measurement error at each measurement point could be estimated, then the error boundaries
of the rigid body motion components could be obtained by Eqs (A.14) – (A.16). In actual
measurements, the measurement error at each point is not known, and it is difficult to estimate.
If we reversely calculate the velocity at a measurement point k from the rigid body motion of
the stapes, then we get
Lkykxczk xyvv cos . (A.17)
The magnitude of the difference between re-calculated velocity from the rigid body
components (Eq. (A.17)) and original measured velocity can be used as a measure of the
magnitude of error at the point (Hato et al. 2003). However, in calculation of the rotational
velocities, the velocity at each point is weighted by the corresponding distance from the
centroid of the scan area (Eqs. (A.5) and (A.6)). Therefore, when the rotational velocity
components are large, the difference between recalculated velocity and original measured
velocity becomes smaller for the points farther from the centroid and larger for the points
21

closer to the centroid. This results in a reduced measure of the measurement error for the
farther points and a magnified measure of the error for the closer points. To get a more
reasonable measure of the measurement error, we define εk as a measurement error measure at
a measurement point k,
meaniymeanixcz
kykxcz
kkkxyv
xyvvv
, (A.18)
where n
xx
n
ii
meani
1 and
n
yy
n
ii
meani
1 are the average distances from the centroid to the
measurement points on the stapes footplate in x and y axes. In the definition of the
measurement error measure above (Eq. (A.18)), the difference between the measured and
recalculated velocities is weighted by a factor that describes the contribution of the velocity at
a measurement point k to calculation of the rigid body motion components. Substituting
mE
mv into Eqs. (A.14) – (A.16), the following MPEs are derived as
n
mmm
LMPEx lx
1cos
1
, (A.19)
n
mmm
LMPEy ly
1cos
1
, (A.20)
n
mkmc
n
mmmc
n
mm
LMPEoz lyxlxy
nv
11
1
cos
1
. (A.21)
Consequently, the error ratio as the ratio of the MPE to the magnitude of the corresponding
calculated motion component is calculated as follows:
Lx
n
mmm
x
MPEx
ERx
lx
cos
1 , (A.22)
Ly
n
kmm
y
MPE
Ey
ERy
ly
cos1 , (A.23)
Loz
n
mmmc
n
kmmc
n
mm
oz
MPE
Eoz
ERoz nv
lyxnlxyn
v
vv
cos111
. (A.24)
22
References
Asai M, Roberson JB, and Goode RL (1997) Acoustic effect of malleus head removal and tensor tympani muscle section on middle ear reconstruction. Laryngoscope. 107(9):1217-1222
Békésy G (1960) Experiments in Hearing. New York, McGraw-Hill
de la Rochefoucauld O, Decraemer WF, Khanna SM, and Olson ES (2008) Simultaneous measurements of ossicular velocity and intracochlear pressure leading to the cochlear input impedance in gerbil. Journal of the Association for Research in Otolaryngology. 9(2): 161-177
Decraemer WF and Khanna SM (1999) New insight in the functioning of the middle-ear; The function and mechanics of normal, diseased, and reconstructed middle ears. Eds. Rosowski JJ and Merchant S. Kugler Publication, The Hague, The Netherlands. pp 23-38
Decraemer WF, Khanna SM, and Funnell WRJ (2000) Measurement and modeling of the three-dimensional vibration of the stapes in cat. Proceeding of the Symposium on Recent Developments in Auditory Mechanics, Eds. Wada H, Takasaka K, Ikeda K, Phyama K, and Koike T. World Scientific. pp 36-43
Decraemer WF, de La Rochefoucauld O, Dong W, Khanna SM, Dirckx JJ, and Olson ES (2007) Scala vestibuli pressure and three-dimensional stapes velocity measured in direct succession in gerbil. J. Acoust. Soc. Am. 121 (5): 2774-2791
Dodson JM (2001) Efficient finite element methods/ Reduced-order modelling for structural acoustics with applications to transduction. Ph.D. Thesis, University of Michigan, Ann Arbor, MI
Eiber A, Breuninger C, Sequeira D, and Huber A (2007) Mechanical excitation of complex stapes motion in guinea pigs. In: Huber A and Eiber A (Eds.), Middle ear mechanics in research and otology, Zurich, Switzerland. World Scientific Press, Singapore. pp123-129
Greenwood DT (1988) Eulerian angles. In: Principles of dynamics. Prentice Hall, New Jersey. pp 354-358
Guinan JJ and Peake WT (1967) Middle-ear characteristics of anesthetized cats. J. Acoust. Soc. Am. 41: 1237-1261
Hato N, Stenfelt S, and Goode RL (2003) Three-dimensional stapes footplate motion in human temporal bones. Audiol Neurootol. 8:140-152
Heiland KE, Goode RL, Asai M, and Huber AM (1999) A human temporal bone study of stapes footplate movement. AMJ Otol. 20:81-86
Huber AM, Linder T, Ferrazzini M, Schmid S, Dillier N, Stoeckli S, and Fisch U (2001) Intraoperative assessment of stapes movement. Ann Otol Rhinol Laryngol. 110:31-35
Huber AM, Sequeira D, Breuninger C, Eiber A (2008) The effect of complex stapes motion on response of the cochlea. Otology & Neurotology. 29(8): 1187-1192
Kirikae J. The structure and function of the middle ear (1960) Tokyo, University of Tokyo Press
Kolston PJ and Ashmore JF (1996) Finite element micromechanical modelling of the cochlea in three dimensions. J. Accoust. Soc. Am. 99: 455-467
23

24
Lim KM and Steele CR (2002) A three-dimensional nonlinear active cochlea model analyzed by the WKB-numeric method. Hearing Research. 170:190-205
Puria S, Sim JH, Shin M, and Steele CR (2007a) A gear in the middle ear. The 30th Association for Research in Otolaryngology Winter Research Meeting, Denver, Colorado
Puria S, Sim JH, Shin M, Tuck-Lee J, and Steele CR (2007b) Middle ear morphometry from cadaveric temporal bone micro-CT imaging. In: Huber A and Eiber A (Eds.), Middle ear mechanics in research and otology, Zurich, Switzerland. World Scientific Press, Singapore. pp 259-268
Ravicz ME, Cooper NP, and Rosowski JJ (2008) Gerbil middle-ear sound transmission from 100 Hz to 60 kHz. J. Acoust. Soc. Am. 124: 363-380
Sim JH (2007) Imaging, physiology, and biomechanics of the malleus-incus complex. Ph.D. Thesis at Stanford University, Stanford, CA, USA
Sim JH and Puria S (2008) Soft tissue morphometry of the malleus-incus complex from micro-CT imaging. Journal of the Association for Research in Otolaryngology. 9: 5-21