university of technology - mrgep.weebly.com · the process of experimentation involves...
TRANSCRIPT

Laboratory Manual – Electrical Technology (2210)
UNIVERSITY OF TECHNOLOGY, JAMAICA
SCHOOL OF ENGINEERING
LAB MANUAL: ELECTRICAL TECHNOLOGY (ELE2210)
Group: BENG 2:
INTRODUCTION
Laboratories form an integral part of the curriculum and will be given as courses.
Laboratories will be presented in modules. Each module will carry several experiments. Students
are required to pass each module in order to successfully complete the laboratory course of
study.
Each laboratory session will be of three (3) hours duration, and student attendance is
compulsory. Each experiment will carry equal marks and there will be a final evaluation on
completion of each module. This final evaluation will carry fifty-percent weighting of the lab
course and may take the form of an exam (oral / practical) or project. In the event that a final
evaluation was not conducted for the course, then the experiments shall carry the full weighting
for the course.
Each laboratory experiment will be required to be submitted in a formal laboratory report, the
outline of which is presented in the “Laboratory Report Writing” document.
In some experiments, the format of the laboratory instruction sheet may be such that the student
is required to fill in responses to questions asked in the laboratory instruction. Where such is the
case, the student is expected to submit the completed sheet at the end of the lab session, and also
to submit a formal lab report on the due date as stipulated by technologist.
The Laboratory Report
An effective way to acquire practical skills in engineering studies is by experimenting in a
laboratory. The process of experimentation involves organization, observation, familiarization
with various pieces of equipment, working with others, writing, and communicating ideas and
information. These are the skills required of an engineer.
In engineering education, lab experiments are usually designed to enhance the understanding of
the engineering topic(s). Students are supposed to “dirty their hand” in preparing the experiment
set-up, organize the experiment flow, and learn to observe the salient features as well as to spot
any unexpected occurrence as part of the training to acquire the practical skill to become an
engineer. Although the introduction and the procedure are usually given in the lab manual,
students should practice writing a proper lab report which includes all the necessary sections,
targeting at a reader who does not have any prior knowledge about the experiment. This is to
develop the skill in documenting the laboratory work and communicating that experience to
others. Here are some guidelines in preparing laboratory reports for engineering curricula:

Laboratory Manual – Electrical Technology (2210)
UNIVERSITY OF TECHNOLOGY, JAMAICA
ELECTRICAL TECHNOLOGY
LAB #1: SERIES AND PARALLEL CONNECTIONS
OBJECTIVE To investigate the properties of a series and parallel resistive
circuit and to determine the internal resistance of a 1.5V cell.
APPARATUS D.C. Power Supply ` Bread Board Digital Multimeter 1-1.5V Cell
R1- 20K Carbon Resistor
R2- 33K Carbon Resistor
R3 -100 Carbon Resistor PRE- LAB ASSIGNMENT:
1. Build a chart outlining the main differences between currents and voltages for series and parallel networks.
2. Using the colour code, find the values and tolerance for commercial resistors
marked with the following colours:
a. Red, red, red, silver b. Yellow, red, black, gold c. Blue, yellow, red, silver
PROCEDURE
Activity #1
1. Connect the circuit as shown in figure 1, with the supply voltage
set to 5volts. Open the circuit at point A and use the multimeter to
measure the current at that point.

Laboratory Manual – Electrical Technology (2210)
Figure 1 Figure 2
2. Record in Table 1 the value of the current. Repeat this procedure for points “B”
and “C” of figure 1.
3. Use the Ohmmeter to measure the total resistance of the circuit and record this value (make sure the power is disconnected).
4. Measure and record the voltage across each of the resistors, R1 and R2.
5. Measured the Voltage across R1 and R2 (points “A” and “C”)
Table 1
6. What can you say about the current at points A, B and C of the circuit?
7. Find by calculation, the voltage across R1
8. Find by calculation, the voltage across R2
9. Find by calculation, the voltage across R1 and R2 (points A and C)
10. What can you say about the sum of the voltages across the resistors R1 and R2, and the voltage across the points A and C (supply voltage)?
11. Are the resistors connected in series or parallel?
12. Measure the total resistance of R1 and R2
Point A B C
Current, I(A)

Laboratory Manual – Electrical Technology (2210)
13. Calculate the total resistance of R1 and R2. Is the total resistance you measured consistent with the calculated value?
Activity #2
1. Connect the circuit in figure 2. Measure and record the current at the points A, B and C.
Table 2
2. Measure and record the voltage across each of the resistors, R1 and R2.
3. Find by calculation, the voltage across R1
4. Find by calculation, the voltage across R2
5. What can you say about the individual voltages with respect to the supply voltage?
6. What can you say about the sum of the current at points C and B, and the current
at point A.
7. Are the resistors in series or parallel?
8. Measure the total resistance of R1 and R2?
9. Calculate the total resistance of R1 and R2. Is the total resistance you measured consistent with the calculated value?
Activity #3
1. Measure the E.M.F. of the cell and record this value in the space provided.
2. Take the 100 resistor (R), measure and record its actual value. 3. Set up the circuit as shown in figure 3. Measure and record the current flowing through the resistor.
Point A B C
Current, I (A)

Laboratory Manual – Electrical Technology (2210)
Figure 3
1. Find by calculation the actual value of resistor “R”.
2. Given that E = Ir +IR, determine the value of the internal resistance, r of the cell. (where E is the EMF of the cell, “I” the measured current in the circuit and “R” the installed resistor). Show all working.

Laboratory Manual – Electrical Technology (2210)
LAB # 2: RC Time Constant
OBJECTIVE To investigate the time constant of a RC circuit.
APPARATUS Digital Multimeter (DMM) Timer/Stop watch
R1 - 560K Resistors
C1 - 33 F Capacitor C2 - unknown Capacitor PRE-LAB ASSIGNMENT:
1. Define time constant.
2. A 33 µF capacitor is charged to 240 volts and then discharged through a 1 kΩ resistor. Sketch a labeled curve describing the discharge current of the capacitor.
PROCEDURE:
Activity #1 : Charging a capacitor through a resistor
Figure 1.
1. Set up the circuit as shown in figure 1 with the switch in position A. (NOTE THE
POLARITY OF CAPACITOR IN THE CIRCUIT)
Have your circuit checked before turning on the power supply!

Laboratory Manual – Electrical Technology (2210)
2. Place a piece of wire across the capacitor and turn on the power supply. The wire
across the capacitor keeps the capacitor voltage at zero.
3. This step requires two persons, one to operate the stopwatch and one to take
readings. The person with the stopwatch will indicate to the other when to take
readings from the voltmeter and the other person should be watching the voltmeter
to record the voltage at the instances indicated by the person with the timer.
4. Set the stopwatch to 00:00. Simultaneously remove one end of the wire and start the
stopwatch. Record the voltage at the time intervals shown in table 1. Do not stop the
timer until this process is completed.
Time (s) 5 10 15 20 25 30 35 40 45 50
Voltage (V)
Time (s) 55 60 65 70 75 80 85 90 95 100
Voltage (V)
Table 1.
5. Use the values in Table 1 to plot a neat graph of voltage versus time.
Activity #2: Discharging a capacitor through a resistor
1. With the switch still in position A, briefly place the piece of wire across the terminals of
the resistor then remove wire from the circuit. This is done to make sure the capacitor is
fully charged. At this point the voltage across the capacitor should be about 12V.
2. Reset the stopwatch. With the same two person partnership, remove the wire and then
quickly place the switch in position B and start the stopwatch. Record the voltage across
the capacitor at the time intervals in Table 2.
Time (s) 5 10 15 20 25 30 35 40 45 50
Voltage (V)
Time (s) 55 60 65 70 75 80 85 90 95 100
Voltage (V)
Table 2

Laboratory Manual – Electrical Technology (2210)
3. Use the values in Table 2 to plot on the same graph sheet, the graph of
voltage versus time.
Activity #3: Using the time constant to determine the value of an unknown
capacitor.
1. Place the unknown capacitor in parallel with the one already in the circuit and repeat
procedures of activity 2 and record your values in Table 3. Use the values in Table 3 to
plot on the same graph sheet, the graph of voltage versus time.
Time (s) 5 10 15 20 25 30 35 40 45 50
Voltage (V)
Time (s) 55 60 65 70 75 80 85 90 95 100
Voltage (V)
Table 3
Questions:
(Show all working)
1. Calculate the theoretical value of the time constant, for the circuit of figure 1.
Given that = RC.
2. The time constant is the time the RC circuit takes to charge to 63% of the supply voltage
or to discharge to 37% of the supply voltage.
(a) Determine from both the charge and discharge graph the time constants c & d of the
circuit of figure 1. [Where c represents the time constant (charging) and d the time
constant (discharging)].
(b) Compare the theoretical and actual values of the time constants.
3. Examine the two discharging curves, which of the two has the larger time constant? Give
reason/s for your answer.
4. Determine from the discharge curve of the paralleled capacitors RC circuit, the value of the
unknown capacitor. Show all working.
5. If a resistor was placed in series with the one in figure 1, how would this affect the time
constant? Give reason/s.

Laboratory Manual – Electrical Technology (2210)
UNIVERSITY OF TECHNOLOGY, JAMAICA
SCHOOL OF ENGINEERING
Experiment # 3: RLC CIRCUIT
Objective(s)
1) To verify that the impedance Z of a series RLC circuit is 22 )( CL XXRz .
2) To determine how the impedance of a series RLC circuit varies with frequency.
Apparatus:
6.3 V 50Hz power supply
Digital Multi-meter
Audio frequency signal generator
Resistor: ½ W, 5000Ω
Capacitor: 0.1F, 0.05F
Switch: SPST
Inductor/choke: 8mH at 50mA
Introduction
In this experiment you will examine how the impedance of a series RLC circuit varies with
frequency. At one particular frequency, referred to as RESONANT FREQUENCY (FR), it is
known that the impedance of the circuit is a minimum value equal to the resistance of the circuit.
Since the impedance is minimum then the current, I must be a maximum.
We know from the general impedance formula of 22 )( CL XXRz .
At resonance XL = XC; Z = R, henceR
E
Z
EI .
Note that the current at resonance is limited only by the circuit’s resistance, even though it still
possesses inductance and capacitance. In the absence of a resistor, the limiting resistance will be
equal to the inherent resistance of the inductor, capacitor and associated wiring. It is the latter
resistance which limits the current in practical series resonant.
Voltage Amplification
The quality, Q, of a series resonant CL circuit is given by the formula:R
XQ L .

Laboratory Manual – Electrical Technology (2210)
It should not be forgotten that at resonance, although the p.d. across the series capacitance –
inductance combination is zero, the p.d. across each is in fact, a maximum. (It is because the two
voltages are in opposite phase that their joint new voltage is zero.)
Now the voltage across L, VL = IXL, but at resonance LX
EI and if we substitute, this is the
formula we get:
LL XR
EV
RecallR
XQ L , hence VL = QE.
Frequency Response Characteristics
The graph of I versus F will look something like this:
FR
Imax
Frequency, F
Cu
rren
t
PRE-LAB ASSIGNMENT:
1. Define the concepts of inductive and capacitive reactance.
2. Define the term resonance as related to RLC circuits.
PROCEDURE:
Activity #1: Verification of 22 )( CL XXRz

Laboratory Manual – Electrical Technology (2210)
AC
5000
F1.0
mH8
Fig. 1
rmsV3.6
1) Wire the circuit as shown in fig.1
2) Measure and record in Table.1 the applied voltage, E, and the potential differences VR,
VL and VC across R, L and C respectively, using the voltmeter.
E/ VR/ VL/ VC/
Table.1
3) From the measured values of VR and from the rated value of R, compute the current I.
4) Compute the values the values XL and XC from the computed value I and from the
measured values VL and VC.
5) Compute the impedance Z of the RLC circuit in fig. 1 using the formula:I
EZ
6) Compute and record Z using the formula: 22 )( CL XXRz ; use the values of XL
and XC calculated from step # 4.
7) Compare the values obtained for the methods which used the formula in 5 and 6 above.

Laboratory Manual – Electrical Technology (2210)
Activity 2: Effect of Frequency on Impedance
Signal
generator
5000
F05.0
mH8
Fig. 2
1) Disconnect the power supply from the circuit in fig. 1 and connect the circuit as
shown in fig. 2. GET YOUR CIRCUIT APPROVED.
2) Set the signal generator to about three quarters of the maximum voltage and a
frequency of 150Hz.
3) Connect a voltmeter across R and an oscilloscope across the inductor, L and
capacitor to measure VLC (Voltage across L and C).
4) Increase or decrease the frequency of the signal generator as required, until the
voltage across, L and C is a minimum. At this point, the voltage across R should
be at a maximum.
5) Note the frequency FR at which there is a minimum VLN and record this in Table.
2.
6) Measure and record in Table 2 also, the applied voltage E, the voltage VR, VL,
and VC and VLC. (use the oscilloscope to measure all voltages except VR, but
remember that they are peak-to-peak values which you must convert to RMS
values, before recording them in Table 3;
recall that Vrms = 2
PV)
7) Compute and record the difference between VL and VC. Also compute and record
the current I using R
VI R and the impedance
I
EZ .
8) Decrease the frequency of the generator by 20Hz and record the new frequency,
FR. Set the output E of the generator at the same level as for FR in the step #6
repeat the measurements and computations of steps 6 and 7 at the frequency FR
– 20 and record in Table 2.
9) Repeat step #8 for each of the frequencies shown in Table 2. Be certain that for
each frequency, the output of the generator is kept at the same voltage level as in
step #6.

Laboratory Manual – Electrical Technology (2210)
Frequency/
Hz
Applied
Voltage
E/VP-P
VR
/VP-P
VL
/VP-P
VC
/ VP-P
VLC
/ VP-P
VL - VC
/ VP-P
I/A Z/Ω
FR +100 =
FR + 80 =
FR + 60 =
FR +20 =
FR =
FR – 20 =
FR – 40 =
FR – 60 =
FR – 80 =
FR – 100 =
Table 2
10) From the data in Table 2 draw a graph of: Z versus F; I versus F.
Questions:

Laboratory Manual – Electrical Technology (2210)
1. State the condition for which the current I will be a maximum, and impedance z a
minimum in circuit in fig. 2.
2. Compute the value of minimum current.
3. What is the value of minimum impedance?
4. How does the experimental value of Z in activity #1, part 5 compare with the formula
value in part 6 of same activity? Explain any differences.
5. Refer to your data in Table 2 and to the graph of Z versus F. Explain, in your own words
the effect on Z for a change in F.
6. Refer to your data in Table 2 and to the graph of I versus F. Explain, in your own words
the effect on I for a change in F.
7. From fig. 2 what should be the effect on Z, if any, of interchanging L and C? Why?
8. From Table 2, comment on the relationship, if any between the measured voltage VLC
and the voltage VL – VC, (or VC – VL), at any specific frequency. Explain any unexpected
results.
9. Assume that the external resistor R in circuit of Fig 2 is short-circuited. What will limit
the value of current I when XL = XC.

Laboratory Manual – Electrical Technology (2210)
Experiment # 4 CATHODE RAY OSCILLOSCOPE
OBJECTIVE: To be introduced to the operation of the Cathode Ray Oscilloscope and
utilize it to measure time changing signals.
APPARATUS:
Oscilloscope
Signal Generator
PRE-LAB ASSIGNMENT:
1. List three types of practical measurements for which the oscilloscope may be used.
2. Briefly describe the calibration procedure for the oscilloscope.
PROCEDURE:
Activity 1
1) Turn on the oscilloscope and adjust the necessary controls to establish a clear
bright, horizontal line across the center of the screen.
2) Connect the signal generator to the vertical input of the oscilloscope and set the
output of the generator to a 1000Hz waveform.
3) Set the volts/div setting of the oscilloscope to 1V/div and adjust the amplitude
control of the signal generator to establish a 4V peak-to-peak sinusoidal
waveform on the screen.
4a) Set the time/div setting of the scope to 0.1ms/div (i.e. 100µs/div).
4b) Sketch the waveform on the graph Fig 1 below.

Laboratory Manual – Electrical Technology (2210)
Fig 1.
4c) Determine the number of time divisions occupied by one cycle of the waveform
4d) Use your answer to 4c to calculate the period and the frequency of the sinusoidal
wave.
5a) Change the time / div setting to 1ms/div.
5b) Sketch the waveform in Fig 2 below.
Fig 2.

Laboratory Manual – Electrical Technology (2210)
5c) Determine the number of time divisions occupied in one cycle of the sinusoidal waveform.
5d) Use your answer to 5c to calculate the period and the frequency sinusoidal wave.
6a) Did the frequencies that you calculated in parts 4d and 5d change significantly?
6b) What did you observe about the height and width of the sinusoidal waveform as the time /
div settings changed from 0.1 ms /div to 1ms /div? Give reason(s) for your observation.
Activity 2
7) Do not touch the controls of the signal generator but return the time /div
setting of the scope 0.1ms/div.
8a) Change the volts /div setting of the scope to 2V/div.
8b) Sketch the waveform on Fig 3
Fig 3
8c) Calculate the peak-peak value of the sinusoidal waveform.
9a) Change the volts/div setting of the scope to 0.5 V/div.
Laboratory Manual – Electrical Technology (2210)
9b) Sketch the waveform on Fig 4
Fig 4.
9c) Calculate the peak-peak value of the sinusoidal waveform.
10a) Did the voltage values that you calculated in parts 8c and 9c change significantly?
10b) What did you observe about the height and the width of one
cycle of the sinusoidal waveform as the volts/div setting changed from
2V/div to 0.5V/div? Give reasons for your observations.
Activity 3
11) Make all the necessary adjustments to clearly display a 5,000Hz 6V pp
sinusoidal signal on the oscilloscope in the center of the screen.
12) Draw the waveform on figure 5, carefully noting the required number of
horizontal and vertical divisions. Record your chosen volts/div and time/div settings.

Laboratory Manual – Electrical Technology (2210)
Fig. 5 - Graph for Waveform
Volts/div = _________
Time/div = _________

Laboratory Manual – Electrical Technology (2210)
Experiment # 5: SEMICONDUCTORS, RECTIFICATION AND
SMOOTHING
OBJECTIVE To investigate diode testing, rectification and smoothing circuits.
APPARATUS Oscilloscope Digital Multimeter (DMM) Signal Generator 4 -Silicon Diodes, 1N4001 1- Germanium Diode
3.3K Resistors
10 F Capacitor
100 F Capacitor PRE- LAB ASSIGNMENT:
1. Describe briefly, how you would to test a diode using a digital multimeter.
2. Define the term “PIV” of a diode. INTRODUCTION: Most modern digital multimeter (DMM) can be used to determine
the condition of the diode, that is, whether it is good or bad. They have a scale that denoted by a diode symbol that will indicate the condition of the diode in the forward and reverse bias regions. If connected to establish a forward and reverse bias connection, the meter will display the forward bias threshold voltage while in the reverse bias condition, an “OL” or “1” may appear on the display to indicate the open circuit approximation. The threshold voltage for silicon is 0.7V while that for germanium is 0.3V.
Activity #1: Diode Test
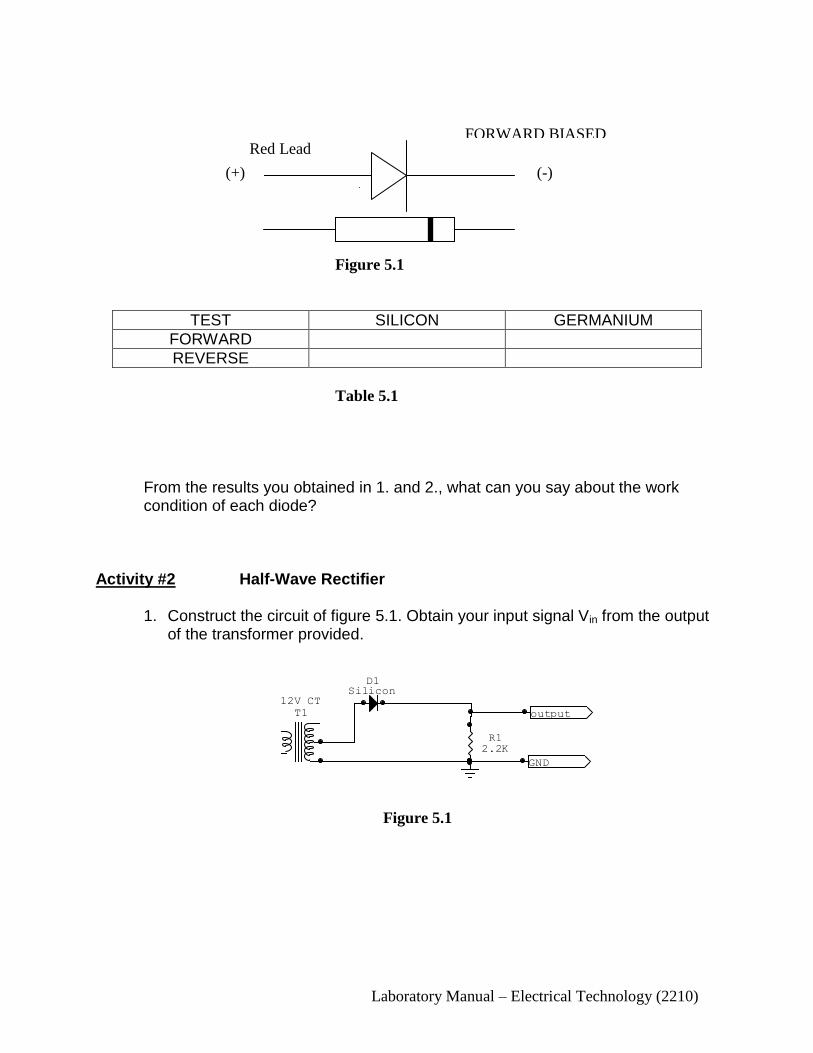
1. Choose a silicon and germanium diode. 2. Using the connection shown in figure 5.1 check each diode
using the diode testing scale on the DMM. Record your results in table 5.1.
Laboratory Manual – Electrical Technology (2210)
Figure 5.1
TEST SILICON GERMANIUM
FORWARD
REVERSE
Table 5.1
From the results you obtained in 1. and 2., what can you say about the work condition of each diode?
Activity #2 Half-Wave Rectifier
1. Construct the circuit of figure 5.1. Obtain your input signal Vin from the output of the transformer provided.
Figure 5.1
Red Lead
(+) (-)
FORWARD BIASED
GND
output
12V CT
T1
D1Silicon
R12.2K

Laboratory Manual – Electrical Technology (2210)
2. On the graphs of figure 5.2a and 5.2b sketch the input voltage Vin and the output voltage Vout respectively. Also note the vertical and horizontal sensitivity.
Figure 5.2a Figure 5.2b
Vertical sensitivity = __________ Vertical sensitivity = __________
Horizontal sensitivity = ________ Horizontal sensitivity = ________
Activity #3 Full - Wave Bridge Rectification and Smoothing.
1. Construct the circuit of figure 5.3. Obtain your input signal Vin from the output of the transformer provided.
Figure 5.3
2. On the two separate graphs of figure 5.3 sketch the input voltage, Vin and the output voltage Vout. Also note the vertical and horizontal sensitivity.
GND
Output
R12.2k
T112VCT
Silicon

Laboratory Manual – Electrical Technology (2210)
Figure 5.4a Figure 5.4b
Vertical sensitivity = __________ Vertical sensitivity = __________
Horizontal sensitivity = ________ Horizontal sensitivity = ________
3. Connect the given capacitor across the output, one at a time. Use the oscilloscope to
observe the voltage at the output and make sketches on figure 5.4 to show the effect
of each capacitor when it is placed in the circuit.
Figure 5.5a Figure 5.5b
Capacitor value = ____________ Capacitor value = ___________
Vertical sensitivity = __________ Vertical sensitivity = __________
Horizontal sensitivity = ________ Horizontal sensitivity = ________
4. Comment on the effect of the capacitors on the output.

Laboratory Manual – Electrical Technology (2210)
Experiment # 6: BASIC LOGIC GATES AND COMBINATORIAL
CIRCUITS
OBJECTIVE To investigate the behavior of the AND, OR and NOT gate.
APPARATUS Digital Design Experimenter 7408 IC 7432 IC 7404 IC INTRODUCTION:
In general, logic circuits have one or more inputs and only one output. The circuits respond to various input combinations, and a truth table shows the relationship between a circuit’s input combination and its output.
The digital design experimenter is an instrument primarily used to construct and test digital circuits. The basic digital design experimenter consist of a breadboard, power supply, several logic level switches and logic level indicators.
PRE-LAB ASSIGNMENT:
1. What is the difference between the CMOS and TTL logic families?
2. Look up the data sheet for the IC’s to be used in this experiment.

Laboratory Manual – Electrical Technology (2210)
PROCEDURE:
Activity # 1: The AND logic Gate
1. Figure 6.1 shows the pin layout for the 7408 IC which contains four AND logic gates.
.
Figure 6.1
2. Connect Vcc to 5 volts a GND to power supply ground.
3. Choose one of the AND gates. Connect the inputs A and B to separate logic switches and the output Y, to a logic level indicator.
4. Set inputs A and B to each set of logic levels listed in Table 1 and record the output level observed.
Table 1
LOGIC SWITCHES OUTPUT LOGIC
LEVEL (0/1)
A B Y
0 0
0 1
1 0
1 1

Laboratory Manual – Electrical Technology (2210)
Activity # 2: The OR logic Gate
1. Figure 6.2 shows the pin layout for the 7432 IC which contains four OR logic gates.
2. Connect Vcc to 5 volts and GND to the power supply ground.
3. Choose one of the OR gates. Connect the inputs A and B to separate logic switches and the output Y, to a logic level indicator.
Figure 6.2
4. Set inputs A and B to each set of logic levels listed in Table 2 and record the output level observed.
Table 2
Activity # 3 : The NOT logic Gate
1. Figure 6.3 shows the pin layout for the 7404 IC which contains six NOT logic gates.
2. Connect Vcc to 5 volts a GND to power supply ground.
3. Connect a logic level switch to Input A and a logic level indicator to output Y.
LOGIC SWITCHES OUTPUT LOGIC
LEVEL (0/1)
A B Y
0 0
0 1
1 0
1 1

Laboratory Manual – Electrical Technology (2210)
4. Set input “A” to each of the logic level in Table 3 and record the output levels observed.
Figure 6.3
Table 3
Activity # 4: Combinatorial Logic Circuit
1. Construct the circuit of figure 4 using the 7408 IC and 7432 IC (Make sure to connect Vcc and GND to both ICs).
2. Connect toggle switches to inputs A, B and C and connect the output Q to a logic level indicator.
3. For each combination shown in the Table 4, observe the output state and record the state in the table.
Figure 6.4
LOGIC
SWITCH A OUTPUT LOGIC LEVEL
( 0/1)
A Y
0
1

Laboratory Manual – Electrical Technology (2210)
Table 4
QUESTIONS:
1. The output of an AND gate is ________ whenever any input is LOW. 2. The output of an OR gate is Low only when ___________________ .
3. The output of an inverter is always ____________ the input.
4. Write the Boolean expression for the circuit of figure 6.4.
_________________________________________
LOGIC LEVEL INPUTS OUTPUT LEVEL
A B C Q
0 0 0
0 0 1
0 1 0
0 1 1
1 0 0
1 0 1
1 1 0
1 1 1