university of ontario institute of technology fact …...uoit fact book – 2014-2015 v3.0 january...
TRANSCRIPT


UOIT Fact Book – 2014-2015 v3.0 January 2015 |Page 1
Table of contents Highlights of 2014-2015 ..................................................................................................................................................................................3
Faculties and programs ..................................................................................................................................................................................5
Student data 2014-2015 .................................................................................................................................................................................7
Undergraduate and graduate students by faculty, gender, and full-time (FT)/part-time (PT) status, 2014-2015 ................................................... 7
Undergraduate students and Fiscal Full-time Equivalents (FFTEs) by faculty, program and full-time (FT)/part-time (PT) status, 2014-2015 ........ 8
Graduate students and Full-time Equivalents (FTEs) by faculty, program, degree and full-time (FT)/part-time (PT) status, 2014-2015 .............. 12
Undergraduate student headcount by year of study, 2014-2015 ........................................................................................................................... 14
Student count by faculty and residency, 2014-2015 ............................................................................................................................................... 15
Students ...................................................................................................................................................................................................... 16
Undergraduate student demographics.................................................................................................................................................................... 17
Graduate student demographics ............................................................................................................................................................................. 18
Undergraduate and graduate student count by faculty .......................................................................................................................................... 19
Undergraduate FFTEs by Faculty ............................................................................................................................................................................. 21
Graduate FTEs by faculty ......................................................................................................................................................................................... 21
Age distribution of students .................................................................................................................................................................................... 22
New student admission averages ............................................................................................................................................................................ 23
New student applications from Ontario high schools and yield rates ..................................................................................................................... 24
Distribution of first-year and fourth-year class sizes ............................................................................................................................................... 26
Degrees/diplomas granted ...................................................................................................................................................................................... 28
Total degrees/diplomas conferred by faculty .......................................................................................................................................................... 29
Faculty and staff .......................................................................................................................................................................................... 31
Continuing staff, 2014-2015 .................................................................................................................................................................................... 31
Core Faculty ............................................................................................................................................................................................................. 33
Tuition and fees ........................................................................................................................................................................................... 35
Tuition and fees (2014-2015 full-time fee schedule) ............................................................................................................................................... 35
Student financial aid and scholarships .......................................................................................................................................................... 37
Student scholarships and awards, 2014-2015 ......................................................................................................................................................... 38
Student financial aid, 2014-2015 ............................................................................................................................................................................. 38
Research ...................................................................................................................................................................................................... 40
Research grants and contracts by faculty and by source, 2014-2015 ..................................................................................................................... 40
UOIT Fact Book – 2014-2015 v3.0 January 2015 |Page 2
Percentage of total research grants held by faculty, 2014-2015............................................................................................................................. 40
Research grants and contracts from Tri-Council by faculty/school, 2014-2015 ...................................................................................................... 41
Research grants by faculty ....................................................................................................................................................................................... 41
Total research grants and contracts ........................................................................................................................................................................ 43
Research intensity per capita ................................................................................................................................................................................... 44
Finance ........................................................................................................................................................................................................ 45
Library ......................................................................................................................................................................................................... 46
Number of library holdings ...................................................................................................................................................................................... 46
Library personnel ..................................................................................................................................................................................................... 47
Residences ................................................................................................................................................................................................... 48
Residence accommodation located on UOIT/Durham College property ................................................................................................................ 48
Athletics ...................................................................................................................................................................................................... 49
Student athletes by sport, 2014-2015 ..................................................................................................................................................................... 49
Fact Book glossary ....................................................................................................................................................................................... 50
Contact ........................................................................................................................................................................................................ 52
Acknowledgements...................................................................................................................................................................................... 52

UOIT Fact Book – 2014-2015 v3.0 January 2015 |Page 3
Highlights of 2014-2015
Return to Table of contents
The university’s undergraduate and graduate enrolment for the 2014-2015 academic year surpassed 10,000 for the first time. The university welcomed an incoming class of just over 3,000 undergraduate and graduate students in September 2014.
At Convocation 2015, the university conferred its first PhD in Computer Science, and the first graduate diplomas in Nuclear Technology, as well as Education and Digital Technologies. UOIT’s alumni base also passed the 12,000 mark in 2015.
UOIT officially opened the UOIT-Baagwating Indigenous Student Centre in downtown Oshawa. The university’s newest building was made possible through the partnership and generous financial support of FedDev Ontario, the Baagwating Community Association and UOIT’s community friends. The new student centre recognizes and celebrates Indigenous histories and cultures and enhances the university’s unwavering commitment to the success of all students.
UOIT signs the Pathways Program Agreement on International Student Recruitment agreement with Durham College. Eligible international students who apply to Durham College will receive a Letter of Admission indicating that when they complete their college studies, they will be eligible to directly enrol into a relevant UOIT undergraduate program with advanced standing.
Three of UOIT’s Canada Research Chairs garnered national and international recognition in 2014: o Dr. Carolyn McGregor
(Health Informatics) cited by Prime Minister Harper; and also awarded the Order of Australia
o Dr. Isabel Pedersen (Digital Life, Media and Culture) named to the Royal Society of Canada
o Dr. Pierre Côté presented with two awards by the Canadian Chiropractic Association and the Ontario Chiropractic Association
UOIT demonstrated its engagement with advanced manufacturing leaders by hosting a conference that featured Siemens CEO Robert Hardt and leaders from IBM, General Motors and Cimetrix Solutions. UOIT is positioned as a university committed to help meet the grand societal challenges we face now and will face in the years ahead.
UOIT announced a new incubator partnership with Ryerson University and Simon Fraser University. The UOIT-Ryerson-SFU partnership was one of 15 projects chosen in the selection process for the Canada Accelerator and Incubator Program (CAIP), designed by the federal government to help outstanding small- and medium-sized Canadian enterprises to grow, prosper and create jobs.
The Faculty of Science’s innovative Forensic Science program received the prestigious accreditation of the American Academy of Forensic Sciences’ Forensic Education Programs Accreditation Commission. It’s the second such program in Canada granted this distinction by the Colorado Springs, Colorado-based organization.
UOIT demonstrated its commitment to continuing growth in graduate studies as the Faculty of Social Science and Humanities announced new graduate programs in Forensic Psychology. First intake of this new program will be in Fall 2015.
The Canadian Engineering Accreditation Board awarded the maximum possible national accreditation term of six-years for the Mechanical Engineering program, certifying all UOIT Engineering programs with its strongest level of endorsement.
ACE ushered in a new era of multi-purpose testing and product development by engaging new partnerships in: motorsports and extreme weather testing of everyday products like smartphones. ACE also expanded its multidisciplinary research capacity (health sciences/engineering/science/information technology) through such projects as the physiological testing of heat exertion capacity of firefighters and using those findings toward the develop a simulation game (“serious game”).

UOIT Fact Book – 2014-2015 v3.0 January 2015 |Page 4
Highlights of 2014-2015
The 2014-2015 UOIT Ridgebacks women’s soccer team made a big splash in the Canadian Interuniversity Sport (CIS) soccer community by winning the Ontario University Athletics (OUA) bronze medal, marking UOIT’s first-ever OUA medal in a team sport. The team went on to earn a berth in the national championship tournament in Quebec City. Head coach Peyvand Mossavat was also named CIS Coach of the Year.
Two UOIT Ridgebacks student-athletes were named to represent Canada at Universiade in South Korea in July 2015: Kylie Bordeleau and Katherine Koehler-Grassau of the women’s soccer team. UOIT’s Peyvand Mossavat was named the Canadian team’s head coach.
The Faculty of Science’s Physics Research Group sent a helium-filled balloon into the stratosphere, about 25 kilometres above the earth’s surface. The sensors monitored a wide range of parameters such as air pressure, temperature, humidity and altitude.
87 per cent of UOIT’s graduates working full-time are employed in their field of study.
Re$earch Infosource’s annual report recognized UOIT for publication impact and international research collaboration. In 2014, UOIT ranked No. 7 in publication impact, and No. 10 in international research collaboration. The report ranks universities according to financial input by measuring their total sponsored research income and research intensity.
UOIT’s exhibited ongoing
community engagement through a wide range of activities and events such as: Engineering Robotics competition, Popsicle stick bridge-building, Science Rendezvous, Durham Region Science Fair, Go ENG Girl, Go CODE Girl, FIRST Robotics Canada, FIRST Lego League; and charitable events such as the annual Walk and Run for the Boys and Girls Club of Durham, and Climatic Zumba in ACE to raise money for Nova’s.
UOIT hosted hydrogen production experts from around the world at the 6th annual International Conference on Hydrogen Production (ICH2P).
UOIT student successes: o Graduating Communication student
Samantha Bates (FSSH) presented a communication ethics paper at a prestigious Chicago conference (on ‘catfishing’ the act of concealing who you really are with a fake cyberprofile in order to hook someone into an online romance).
o FBIT students with the UOIT Accounting Association volunteered to help people in the community file their tax returns. They also organized taxation workshops for UOIT students.
o Mechanical Engineering students Matt Gajkowski and Michael Zhang enjoyed incredible success through the entrepreneurial FastStart program and the Spark Centre, as they garnered nearly $3 million in pre-sales for their company Tiko 3D for their 3D printer creation.
o Faculty of Education students hosted an anti-bullying workshop with the Durham District School Board, partnering in the Board’s Safe Schools program.
o Faculty of Health Sciences graduate students from the Motor Behaviour and Physical Activity Lab presented their research at the University of Michigan, a conference focusing on physical activity for people with disabilities.
Return to Table of contents

UOIT Fact Book – 2014-2015 v3.0 January 2015 |Page 5
Faculties and programs
FACULTIES
Faculty of Business and Information
Technology
Faculty of Education
Faculty of Engineering and Applied
Science
Faculty of Energy Systems and Nuclear
Science
Faculty of Health Sciences
Faculty of Science
Faculty of Social Science and Humanities
UNDERGRADUATE PROGRAMS (B) Bridge option
(C) Co-op option
Bachelor of Commerce:
o Accounting (B)
o Business (B)
o Finance (B)
o Marketing (B)
o Organizational Behaviour/Human
Resources Management (B)
Bachelor of Information Technology: (B)
o Comprehensive
o Game Development and
Entrepreneurship (B)
o Networking and Information
Technology (IT) Security
Return to Table of contents
Bachelor of Education:
o Concurrent – Science
o Intermediate/Senior
o Primary/Junior
Bachelor of Applied Science:
o Nuclear Power (B)
Bachelor of Engineering:
o Automotive Engineering
o Electrical Engineering
o Energy Systems Engineering
o Manufacturing Engineering
o Mechanical Engineering
o Nuclear Engineering
o Software Engineering
Bachelor of Engineering and Management:
o Automotive Engineering and
Management
o Electrical Engineering and Management
o Manufacturing Engineering and
Management
o Energy Systems Engineering and
Management
o Nuclear Engineering and Management
o Mechanical Engineering and
Management
o Software Engineering and Management
Bachelor of Allied Health Sciences (B)
Bachelor of Health Science:
o Comprehensive
o Kinesiology
o Medical Laboratory Science
Bachelor of Science in Nursing (B)
Bachelor of Science:
o Applied and Industrial Mathematics (C)
o Biological Science (B) (C)
o Chemistry (C)
o Computing Science (C)
o Forensic Science (C)
o Physical Science (C)
o Physics (C)
o Health Physics and Radiation Science
Bachelor of Science and Management:
o Biological Science and Management
o Physical Science and Management
Bachelor of Arts:
o Communication (B)
o Community Development and Policy
Studies
o Criminology and Justice (B)
o Legal Studies (B)
o Forensic Psychology
o Adult Education and Digital Technology (B)

UOIT Fact Book – 2014-2015 v3.0 January 2015 |Page 6
Return to Table of contents
GRADUATE PROGRAMS
MBA – Master of Business Administration
MITS – Master of Information Technology
Security
MBA/MITS – Master of Business
Administration and Master of
Information Technology Security
MSc – Master of Science
o Applied Bioscience
o Computer Science
o Materials Science
o Modelling and Computational Science
PhD – Doctor of Philosophy
o Applied Bioscience
o Computer Science
o Electrical and Computer Engineering
o Materials Science
o Mechanical Engineering
o Nuclear Engineering
o Modelling and Computational Science
MA – Master of Arts
o Education
o Criminology
MEd – Master of Education
MEng – Master of Engineering
o Automotive Engineering
o Electrical and Computer Engineering
o Mechanical Engineering
o Nuclear Engineering
MEngM – Master of Engineering
Management
MASc – Master of Applied Science
o Automotive Engineering
o Electrical and Computer Engineering
o Mechanical Engineering
o Nuclear Engineering
MHSc – Master of Health Sciences
Diploma
o Education and Digital Technologies
o Engineering Management
o Nuclear Design Engineering
o Nuclear Technology
Fuel, Materials and Chemistry
Health Physics
Operation and Maintenance
Radiological Applications
Reactor Systems
Safety, Licensing and Regulatory
Affairs
UOIT Fact Book – 2014-2015 v3.0 January 2015 |Page 7
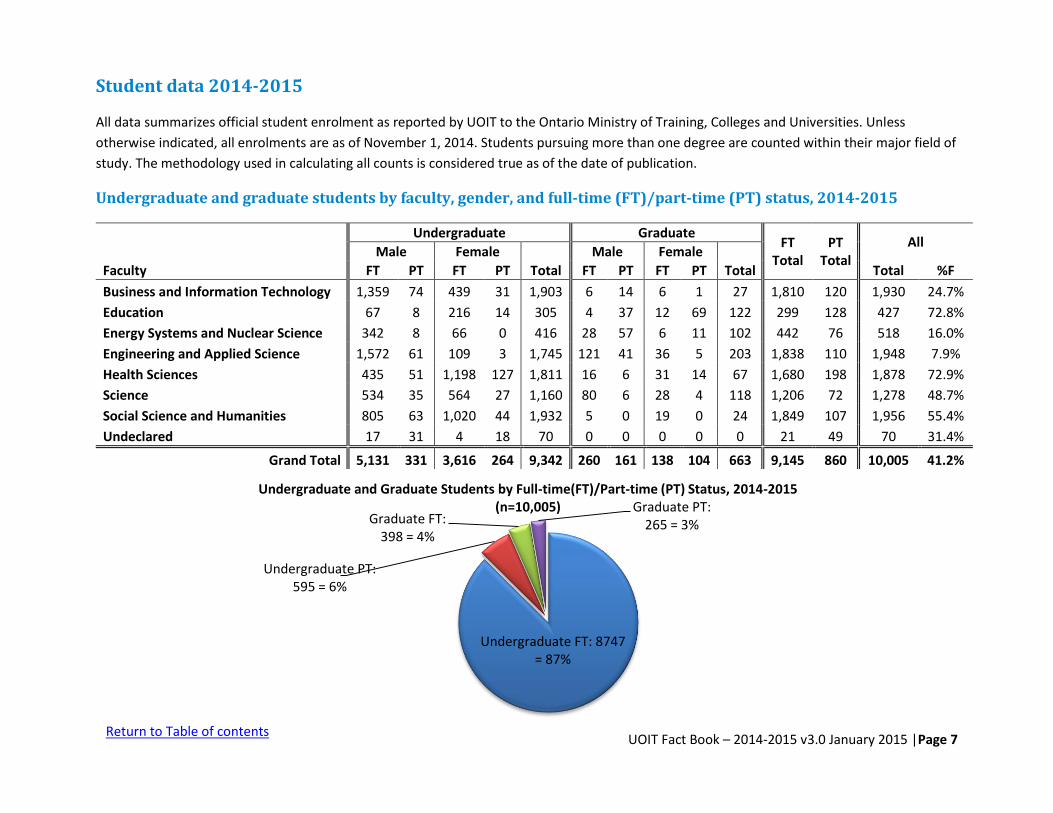
Undergraduate FT: 8747= 87%
Undergraduate PT:595 = 6%
Graduate FT: 398 = 4%
Graduate PT: 265 = 3%
Undergraduate and Graduate Students by Full-time(FT)/Part-time (PT) Status, 2014-2015(n=10,005)
Student data 2014-2015
All data summarizes official student enrolment as reported by UOIT to the Ontario Ministry of Training, Colleges and Universities. Unless
otherwise indicated, all enrolments are as of November 1, 2014. Students pursuing more than one degree are counted within their major field of
study. The methodology used in calculating all counts is considered true as of the date of publication.
Undergraduate and graduate students by faculty, gender, and full-time (FT)/part-time (PT) status, 2014-2015
Faculty
Undergraduate Graduate FT
Total PT
Total
All Male Female Male Female
FT PT FT PT Total FT PT FT PT Total Total %F
Business and Information Technology 1,359 74 439 31 1,903 6 14 6 1 27 1,810 120 1,930 24.7%
Education 67 8 216 14 305 4 37 12 69 122 299 128 427 72.8%
Energy Systems and Nuclear Science 342 8 66 0 416 28 57 6 11 102 442 76 518 16.0%
Engineering and Applied Science 1,572 61 109 3 1,745 121 41 36 5 203 1,838 110 1,948 7.9%
Health Sciences 435 51 1,198 127 1,811 16 6 31 14 67 1,680 198 1,878 72.9%
Science 534 35 564 27 1,160 80 6 28 4 118 1,206 72 1,278 48.7%
Social Science and Humanities 805 63 1,020 44 1,932 5 0 19 0 24 1,849 107 1,956 55.4%
Undeclared 17 31 4 18 70 0 0 0 0 0 21 49 70 31.4%
Grand Total 5,131 331 3,616 264 9,342 260 161 138 104 663 9,145 860 10,005 41.2%
Return to Table of contents

UOIT Fact Book – 2014-2015 v3.0 January 2015 |Page 8
Undergraduate students and Fiscal Full-time Equivalents (FFTEs) by faculty, program and full-time (FT)/part-time
(PT) status, 2014-2015
Faculty Program FT PT Total FFTEs
Business and Information Technology Accounting 137 6 143 109.4
Business 833 40 873 838.6
Business Bridge 25 5 30 27.4
Business-ACTU Durham College 9 0 9 8.3
E-Commerce 0 2 2 0.7
Finance 123 10 133 115.8
Information Technology 10 1 11 10.2
Information Technology - Game Development 292 12 304 273.8
Information Technology Bridge 6 3 9 9.9
Marketing 61 7 68 63.9
Networking & IT Security 262 11 273 237.7
Org Beh & Human Resources Mngt 40 8 48 39.4
Business and Information Technology Total 1,798 105 1,903 1,735.1
Education Adult Education & Digital Tech 24 22 46 28.8
Education (Concurrent) 19 0 19 17.6
Education (Consecutive) - Intermediate/Senior 83 0 83 83.4
Education (Consecutive) - Primary/Junior 157 0 157 158.6
Education Total 283 22 305 288.4
Energy Systems and Nuclear Science Energy Systems Engineering 64 0 64 55.9
Energy Systems Engineering & Mgmt 5 1 6 4.9
Health Physics & Radiation Sci 43 1 44 37.4
Nuclear Engineering 280 4 284 238.1
Nuclear Engineering & Mgmt 12 1 13 8.4
Nuclear Power 4 1 5 4.2
Energy Systems and Nuclear Science Total 408 8 416 348.9
Return to Table of contents

UOIT Fact Book – 2014-2015 v3.0 January 2015 |Page 9
Undergraduate students and FFTEs by faculty, program and FT/PT status, 2014-2015 continued
Faculty Program FT PT Total FFTEs
Engineering and Applied Science Automotive Engineering 221 7 228 185.7
Automotive Engineering & Mgmt 2 1 3 1.9
Electrical Engineering 419 20 439 368.6
Electrical Engineering & Mgmt 7 1 8 4.3
Manufacturing Engineering 77 0 77 62.5
Manufacturing Engineering & Mgmt 1 1 2 0.8
Mechanical Engineering 756 29 785 680.1
Mechanical Engineering & Mgmt 13 0 13 12.6
Software Engineering 185 5 190 167.1
Engineering and Applied Science Total 1,681 64 1,745 1,483.6
Health Sciences Allied Health Sciences 10 98 108 44.9
Health Sciences 352 11 363 341.6
Kinesiology 400 9 409 383.1
Kinesiology-Adv. Standing Opt. 48 3 51 44.2
Medical Laboratory Science 150 6 156 141.2
Nursing (Collaborative) 427 11 438 400.4
Nursing (Post-PN) 148 33 181 141.5
Nursing (Post-PN) Georgian 98 7 105 89.2
Health Sciences Total 1,633 178 1,811 1,586.1
Science Applied and Industrial Math 41 0 41 35.6
Applied and Industrial Math-Co-op 3 0 3 3.0
Biological Sci. & Mgmt-Co-op 0 1 1 0.6
Biological Science 528 25 553 486.1
Biological Science & Mgmt 9 2 11 9.2
Biological Science-Co-op 13 1 14 12.1
Biology Bridge 2 0 2 1.0
Chemistry 168 7 175 147.4
Chemistry-Co-op 9 3 12 9.0
Computing Science 133 7 140 119.8
Return to Table of contents

UOIT Fact Book – 2014-2015 v3.0 January 2015 |Page 10
Undergraduate students and FFTEs by faculty, program and FT/PT status, 2014-2015 continued
Faculty Program FT PT Total FFTEs
Science continued Computing Science-Co-op 17 5 22 19.5
Forensic Science 116 4 120 115.7
Forensic Science & Mgmt 1 0 1 1.0
Physical Science 1 0 1 1.2
Physics 56 6 62 51.0
Physics-Co-op 1 1 2 1.0
Science Total 1,098 62 1,160 1,013.2
Social Science and Humanities Communication 185 7 192 176.0
Communications Bridge 5 2 7 3.6
Community Dev & Policy Studies 49 2 51 44.7
Criminology and Justice 960 52 1012 930.3
Criminology and Justice Bridge 35 26 61 64.6
Forensic Psychology 326 8 334 314.3
Forensic Psychology Bridge 41 0 41 25.0
Legal Studies 210 7 217 210.9
Legal Studies Bridge 11 3 14 12.7
Public Policy 3 0 3 1.8
Social Science and Humanities Total 1,825 107 1,932 1,783.9
Undeclared Business-ACTU Durham College 0 40 40 18.1
Exchange Student 15 0 15 8.8
Not Applicable 6 9 15 7.4
Undeclared Total 21 49 70 34.3
Grand Total 8,747 595 9,342 8,273.4
Return to Table of contents

UOIT Fact Book – 2014-2015 v3.0 January 2015 |Page 11
Return to Table of contents

UOIT Fact Book – 2014-2015 v3.0 January 2015 |Page 12
Graduate students and Full-time Equivalents (FTEs) by faculty, program, degree and full-time (FT)/part-time (PT)
status, 2014-2015
Faculty Program Degree FT PT Total FTEs
Business and Information Technology Business Admin/Information Tec MBAMIT 1 1 2 1.3
Business Administration MBA 5 5 10 6.5
Information Tech Security MITS 6 9 15 8.7
Business and Information Technology Total 12 15 27 16.5
Education Educ Technology & Informatics DIPL 0 2 2 0.6
Education MA 4 12 16 7.6
MED 12 92 104 39.6
Education Total 16 106 122 47.8
Energy Systems and Nuclear Science Fuel, Materials and Chemistry DIPL 0 2 2 0.6
Health Physics DIPL 0 1 1 0.3
Nuclear Design Engineering DIPL 0 34 34 10.2
Nuclear Engineering MENG 5 13 18 8.9
PHD 13 9 22 15.7
MASC 15 6 21 16.8
Nuclear Engineering -UNENE MENG 0 1 1 0.3
Reactor Systems DIPL 1 1 2 1.3
Safety, Licensing & Regulatory Affairs DIPL 0 1 1 0.3
Energy Systems and Nuclear Science Total 34 68 102 54.4
Engineering and Applied Science Automotive Engineering MASC 8 1 9 8.3
MENG 2 0 2 2
Electrical and Computer Eng. MASC 41 7 48 43.1
MENG 13 3 16 13.9
PHD 24 8 32 26.4
Engineering Management MENGM 5 9 14 7.7
Return to Table of contents

UOIT Fact Book – 2014-2015 v3.0 January 2015 |Page 13
Graduate students and Full-time Equivalents (FTEs) by faculty, program, degree and full-time (FT)/part-time (PT)
status, 2014-2015
Faculty Program Degree FT PT Total FTEs
Engineering and Applied Science continued Mechanical Engineering PHD 33 7 40 35.1
MENG 6 3 9 6.9
MASC 25 8 33 27.4
Engineering and Applied Science Total 157 46 203 170.8
Health Sciences Health Sciences MHSC 47 20 67 53
Health Sciences Total 47 20 67 53
Science Applied Bioscience MSC 18 0 18 18
PHD 11 2 13 11.6
Computer Science MSC 38 0 38 38
PHD 20 4 24 21.2
Materials Science PHD 5 0 5 5
MSC 4 1 5 4.3
Modelling & Computational Sci PHD 3 0 3 3
MSC 9 3 12 9.9
Science Total 108 10 118 111
Social Science and Humanities Criminology MA 24 0 24 24
Social Science and Humanities Total 24 0 24 24
Undeclared Exchange Student 0 0 0 0
Undeclared Total 0 0 0 0
Grand Total 398 265 663 477.5
Return to Table of contents

UOIT Fact Book – 2014-2015 v3.0 January 2015 |Page 14
Undergraduate student headcount by year of study, 2014-2015
Faculty
Headcount
Y1 Y2 Y3 Y4+ Total
Business and Information Technology 533 491 414 465 1,903
Education 259 0 31 15 305
Energy Systems and Nuclear Science 81 110 79 146 416
Engineering and Applied Science 664 414 335 332 1,745
Health Sciences 393 474 484 460 1,811
Science 404 315 218 223 1,160
Social Science and Humanities 376 519 473 564 1,932
Undeclared 60 1 4 5 70
Grand Total 2,770 2,324 2,038 2,210 9,342
0
100
200
300
400
500
600
700
Business andInformationTechnology
Education EnergySystems and
NuclearScience
Engineeringand Applied
Science
HealthSciences
Science SocialScience andHumanities
Undeclared
Undergraduate Student Headcount by Year of Study, 2014-2015
Y1
Y2
Y3
Y4+
Return to Table of contents

UOIT Fact Book – 2014-2015 v3.0 January 2015 |Page 15
Student count by faculty and residency, 2014-2015
Faculty Undergraduate Graduate Grand Total
Domestic International %
Int'l Domestic International %
Int'l All % Int'l
Business and Information Technology 1,812 91 4.8% 20 7 25.9% 1,930 5.1%
Education 304 1 0.3% 122 0 0.0% 427 0.2%
Energy Systems and Nuclear Science 390 26 6.3% 98 4 3.9% 518 5.8%
Engineering and Applied Science 1,465 280 16.0% 96 107 52.7% 1,948 19.9%
Health Sciences 1,758 53 2.9% 65 2 3.0% 1,878 2.9%
Science 1,110 50 4.3% 93 25 21.2% 1,278 5.9%
Social Science and Humanities 1,906 26 1.3% 22 2 8.3% 1,956 1.4%
Undeclared 55 15 21.4% 0 0 0.0% 70 21.4%
Grand Total 8,800 542 5.8% 516 147 22.2% 10,005 6.9%
Return to Table of contents
Return to Table of contents

UOIT Fact Book – 2014-2015 v3.0 January 2015 |Page 16
Students
All data summarizes official student enrolment as reported by UOIT to the Ontario Ministry of Training, Colleges and Universities, which has a
count date of November 1 each academic year. Students pursuing more than one degree are counted within their major field of study. Students
in the Bachelor of Science/Bachelor of Education (Concurrent) program are counted in the Faculty of Science in Years 1 to 4, and in the Faculty of
Education in Year 5. The methodology used in calculating all counts is considered true as of the date of publication.
Return to Table of contents

UOIT Fact Book – 2014-2015 v3.0 January 2015 |Page 17
Undergraduate student demographics
2010-11 2011-12 2012-13 2013-2014 2014-2015
Gender
Male 4,069 4,651 5,091 5,321 5,462 Female 2,902 3,254 3,512 3,782 3,880
% Female 42% 41% 41% 42% 42% Enrolment Status
Full-time 6,515 7,472 8,139 8,601 8,747
Part-Time 456 433 464 502 595 % Part-Time 7% 5% 5% 6% 6%
Residency
Domestic 6,742 7,618 8,200 8,632 8,800 International 229 287 403 471 542
% International 3% 4% 5% 5% 6%
Total 6,971 7,905 8,603 9,103 9,342
0
1,000
2,000
3,000
4,000
5,000
6,000
7,000
8,000
9,000
Male Female Full-time Part-Time Domestic International
Gender Enrolment Status Residency
Undergraduate Student Demographics, 2010-2015
2010-11
2011-12
2012-13
2013-14
2014-15
Return to Table of contents
Return to Table of contents

UOIT Fact Book – 2014-2015 v3.0 January 2015 |Page 18
Graduate student demographics
2010-11 2011-12 2012-13 2013-14 2014-2015
Gender
Male 272 288 333 370 421 Female 141 154 181 224 242 % Female 34% 35% 35% 38% 37%
Enrolment Status
Full-time 308 294 333 376 398 Part-Time 105 148 181 218 265 % Part-Time 25% 33% 35% 37% 40%
Residency
Domestic 336 368 430 481 516 International 77 74 84 113 147
% International 19% 17% 16% 19% 22%
Total 413 442 514 594 663
0
50
100
150
200
250
300
350
400
450
500
Male Female Full-time Part-Time Domestic International
Gender Enrolment Status Residency
Graduate Student Demographics, 2010-2015
2010-11
2011-12
2012-13
2013-14
2014-15
Return to Table of contents

UOIT Fact Book – 2014-2015 v3.0 January 2015 |Page 19
Undergraduate and graduate student count by faculty
Undergraduate student count by faculty
Faculty 2010-11 2011-12 2012-13 2013-14 2014-15
Business and Information Technology 1,765 1,889 1,933 1,893 1,903
Education 315 260 254 284 305
Energy Systems and Nuclear Science 345 430 453 485 416
Engineering and Applied Science 1,044 1,168 1,343 1,498 1,745
Health Sciences 1,348 1,502 1,638 1,737 1,811
Science 853 991 1,081 1,144 1,160
Social Science and Humanities 1,276 1,636 1,857 2,025 1,932
Undeclared 25 29 44 37 70
Total 6,971 7,905 8,603 9,103 9,342
Graduate student count by faculty
Faculty 2010-11 2011-12 2012-13 2013-14 2014-15
Business and Information Technology 25 27 26 37 27
Education 62 87 111 108 122
Energy Systems and Nuclear Science 58 64 65 92 102
Engineering and Applied Science 142 133 158 173 203
Health Sciences 34 30 34 53 67
Science 65 73 90 102 118
Social Science and Humanities 27 28 29 28 24
Undeclared 0 0 1 1 0
Total 413 442 514 594 663
Return to Table of contents
Return to Table of contents
Return to Table of contents

UOIT Fact Book – 2014-2015 v3.0 January 2015 |Page 20
4%18%
15%
31%10%
18%
4%
0%
Graduate Student Count by Faculty, 2014-2015 (n=9,342)
Business and InformationTechnology
Education
Energy Systems and NuclearScience
Engineering and AppliedScience
Health Sciences
Science
Social Science andHumanities
Undeclared
Return to Table of contents
20%
3%
5%19%
19%
12%
21%
1%
Undergraduate Student Count by Faculty, 2014-2015 (n=9,342)
4%18%
15%
31%10%
18%
4%
0%
Graduate Student Count by Faculty, 2014-2015 (n=9,342)
Business and InformationTechnology
Education
Energy Systems and NuclearScience
Engineering and AppliedScience
Health Sciences
Science
Social Science andHumanities
Undeclared

UOIT Fact Book – 2014-2015 v3.0 January 2015 |Page 21
Undergraduate FFTEs by Faculty
Faculty 2010-11 2011-12 2012-13 2013-2014 2014-2015
Business and Information Technology 1,667.8 1,773.4 1,784.3 1,731.8 1,735.1
Education 314.5 264.1 248.1 274.9 288.4
Energy Systems and Nuclear Science 316.5 395.7 404.6 411.8 348.9
Engineering and Applied Science 929.7 1,022.5 1,166.4 1,266.9 1,483.6
Health Sciences 1,177.7 1,328.0 1,427.9 1,515.0 1,586.1
Science 780.5 891.6 978.1 1,027.1 1,013.2
Social Science and Humanities 1,219.1 1,538.8 1,748.7 1,887.9 1,783.9
Undeclared 15.2 13.1 18.9 21.2 34.3
Grand Total 6,421.1 7,227.3 7,777.0 8,136.6 8,273.4
Graduate FTEs by faculty
Faculty 2010-11 2011-12 2012-13 2013-2014 2014-2015
Business and Information Technology 12.4 15.1 20.4 29.3 16.5
Education 29.8 38.0 48.0 47.8 47.8
Energy Systems and Nuclear Science 46.1 47.9 46.8 53.5 54.4
Engineering and Applied Science 133.6 118.3 130.0 142.9 170.8
Health Sciences 27.7 23.0 28.4 41.8 53.0
Science 63.6 68.8 83.7 97.8 111.0
Social Science and Humanities 26.3 27.3 29.0 27.3 24.0
Undeclared 0.0 0.0 1.0 1 0.0
Grand Total 339.5 338.4 387.3 441.4 477.5
Return to Table of contents
UOIT Fact Book – 2014-2015 v3.0 January 2015 |Page 22
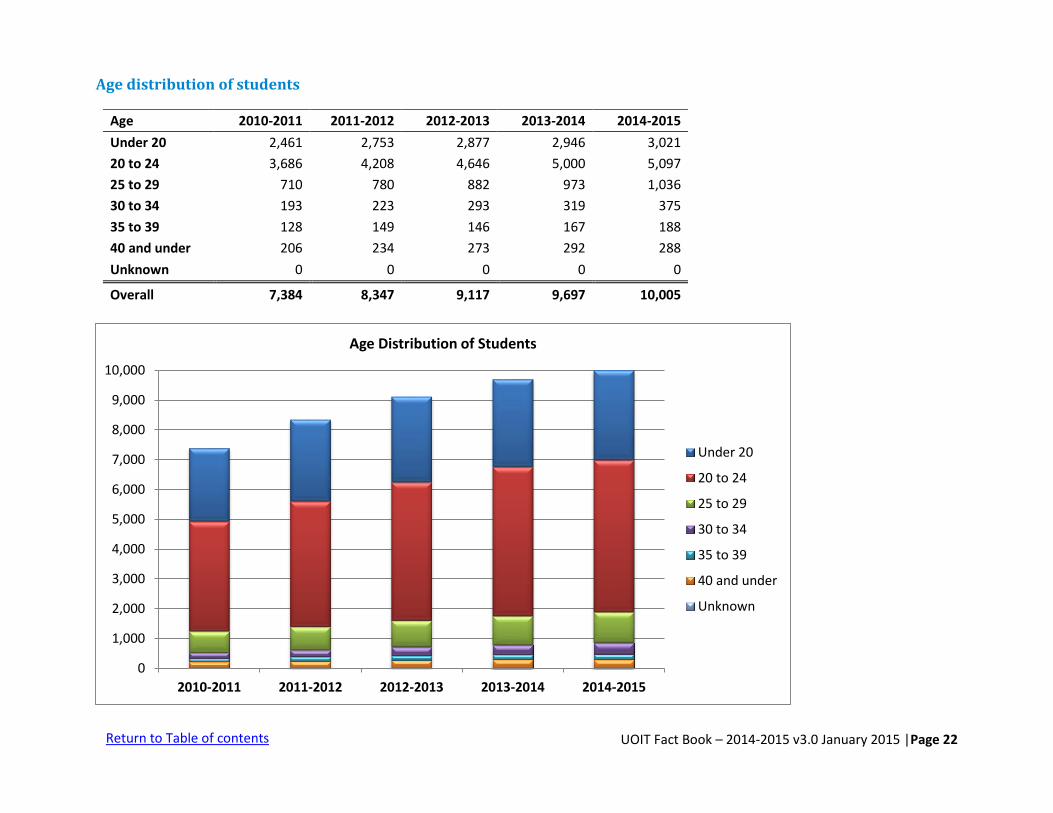
Age distribution of students
Age 2010-2011 2011-2012 2012-2013 2013-2014 2014-2015
Under 20 2,461 2,753 2,877 2,946 3,021
20 to 24 3,686 4,208 4,646 5,000 5,097
25 to 29 710 780 882 973 1,036
30 to 34 193 223 293 319 375
35 to 39 128 149 146 167 188
40 and under 206 234 273 292 288
Unknown 0 0 0 0 0
Overall 7,384 8,347 9,117 9,697 10,005
0
1,000
2,000
3,000
4,000
5,000
6,000
7,000
8,000
9,000
10,000
2010-2011 2011-2012 2012-2013 2013-2014 2014-2015
Age Distribution of Students
Under 20
20 to 24
25 to 29
30 to 34
35 to 39
40 and under
Unknown
Return to Table of contents

UOIT Fact Book – 2014-2015 v3.0 January 2015 |Page 23
New student admission averages
Faculty 2010-2011 2011-2012 2012-2013 2013-2014 2014-2015
Business and Information Technology 77.0 77.0 77.5 77.8 78.1
Energy Systems and Nuclear Science 79.2 79.3 78.7 79.3 82.0
Engineering and Applied Science 76.9 76.4 77.2 77.9 78.4
Health Sciences 78.5 79.8 79.3 81.3 80.4
Science 78.8 78.2 78.5 78.6 79.5
Social Science and Humanities 76.2 76.4 77.1 77.1 77.1
Undeclared - - - - -
Overall Average 77.8 77.9 78.0 78.7 79.3
* As students from Concurrent Education are placed in the Faculty of Science there are no 101 admissions for Education, hence there are not any admission averages to report for this Faculty.
74.0
75.0
76.0
77.0
78.0
79.0
80.0
81.0
82.0
83.0
Business andInformationTechnology
EnergySystems and
NuclearScience
Engineeringand Applied
Science
HealthSciences
Science Social Scienceand
Humanities
New Student Admission Averages by Faculty, 2014-15
Overall Average
Return to Table of contents

UOIT Fact Book – 2014-2015 v3.0 January 2015 |Page 24
New student applications from Ontario high schools and yield rates
Year 2010-2011 2011-2012 2012-2013 2013-2014 2014-2015
Applicant 6,044 6,416 6,943 7,134 7,092
Admission 4,766 4,622 5,538 5,783 5,897
Confirmation 1,458 1,567 1,615 1,711 1,588
Registration 1,415 1,520 1,546 1,660 1,574
Admission Rate (Admission/ Applicant) 0.79 0.72 0.80 0.81 0.83
Confirmation Rate (Confirmation/ Admission) 0.31 0.34 0.29 0.30 0.27
Registration Rate (Registration/ Admission) 0.30 0.33 0.28 0.29 0.27
0
1,000
2,000
3,000
4,000
5,000
6,000
7,000
8,000
2010-2011 2011-2012 2012-2013 2013-2014 2014-2015
New Student Applicants from Ontario High Schools, Yield Rates, 2010-2015
Applicant
Admission
Confirmation
Registration
Return to Table of contents

UOIT Fact Book – 2014-2015 v3.0 January 2015 |Page 25
0.00
0.10
0.20
0.30
0.40
0.50
0.60
0.70
0.80
0.90
2010-2011 2011-2012 2012-2013 2013-2014 2014-2015
New Student Applications from Ontario High Schools -Yield Rates 2010-2015
Admission Rate (Admission/Applicant)
Confirmation Rate (Confirmation/Admission)
Registration Rate (Registration/Admission)
Return to Table of Contents
Return to Table of contents

UOIT Fact Book – 2014-2015 v3.0 January 2015 |Page 26
Distribution of first-year and fourth-year class sizes
Distribution of first-year class sizes
Number of Students 2010-2011 2011-2012 2012-2013 2013-2014 2014-2015
Fewer than 30 9 7 16 15 12
30 to 60 40 46 44 39 23
61 to 100 13 20 20 20 20
101 to 250 39 38 45 43 42
250 or more 3 6 7 6 4
Total 104 117 132 123 101
Fewer than 3012%
30 to 6023%
61 to 10020%
101 to 25041%
250 or more4%
Distribution of First Year Class Sizes, 2014-15
Return to Table of contents

UOIT Fact Book – 2014-2015 v3.0 January 2015 |Page 27
Distribution of fourth-year class sizes
Number of Students 2010-2011 2011-2012 2012-2013 2013-2014 2014-2015
Fewer than 30 109 85 127 77 71
30 to 60 49 68 66 82 80
61 to 100 1 6 21 13 12
101 to 250 2 0 0 1 3
250 or more 0 1 1 0
Total 161 160 215 173 166
Fewer than 3043%
30 to 6048%
61 to 1007%101 to 250
2%
Distribution of Fourth Year Class Sizes, 2014-15
Return to Table of contents

UOIT Fact Book – 2014-2015 v3.0 January 2015 |Page 28
Degrees/diplomas granted
Degree 2010 2011 2012 2013 2014
Bachelor of Arts (Honours) 163 151 275 323 393
Bachelor of Allied Health Science (Honours) 1 10 10 13
Bachelor of Applied Science (Honours) 11 6
Bachelor of Commerce (Honours) 184 219 262 257 267
Bachelor of Education (Consecutive) 254 21 27 211 228
Bachelor of Education (Concurrent) 9 285 231 16 19
Bachelor of Engineering & Management (Honours) 51 33 45 29 20
Bachelor of Engineering (Honours) 148 125 151 199 219
Bachelor of Health Science (Honours) 83 85 111 124 154
Bachelor of Information Technology 68 67 76 90 80
Bachelor of Science 2 2 2 1 2
Bachelor of Science (Honours) 94 108 119 125 148
Bachelor of Science & Management (Honours) 9 7 6 6 2
Bachelor of Science in Nursing (Honours) 105 114 144 153 188
Master of Applied Science 30 45 25 19 34
Master of Arts 11 11 13 11
Master of Business Administration 1 3 3 2
Master of Education 1 11 17 30 33
Master of Engineering 11 22 20 12 11
Master of Health Science 10 11 9 13
Master of Information Technology Security 14 10 12 7 12
Master of Science 18 15 19 21 10
PHD 2 6 12 18
Total 1,244 1,345 1,583 1,681 1,883
Return to Table of contents

UOIT Fact Book – 2014-2015 v3.0 January 2015 |Page 29
Degrees/Diplomas Granted Continued
Graduate Diploma 2010 2011 2012 2013 2014
Educ Technology & Informatics 2 Health Physics 2 1 Operation and Maintenance 1
Reactor Systems 1
Total 3 4
Degrees and diplomas 2010 2011 2012 2013 2014
Grand Total 1,244 1,345 1,586 1,681 1,887
Return to Table of contents

UOIT Fact Book – 2014-2015 v3.0 January 2015 |Page 30
Total degrees/diplomas conferred by faculty
2010 2011 2012 2013 2014 Total
Business and Information Technology 266 297 353 357 361 1,885
Social Science and Humanities 163 162 283 336 396 400
Engineering and Applied Science 202 180 194 201 219 1,121
Science 114 126 143 151 159 1,523
Energy Systems and Nuclear Science 47 53 59 83 94 372
Health Sciences 188 210 276 296 368 1,523
Education 264 317 278 257 290 1,630
Total 1,244 1,345 1,586 1,681 2,248 9,165
0
50
100
150
200
250
300
350
400
Tota
l nu
mb
er
of
de
gre
es/
dip
lom
as
Total Degrees/Diplomas Conferred by Faculty, 2010-2014
Return to Table of contents

UOIT Fact Book – 2014-2015 v3.0 January 2015 |Page 31
Faculty and staff
Faculty counts are summarized from reports submitted by Human Resources to Statistics Canada. All definitions follow those used in the original
submission. Counts are based on faculty as of October 1 of the academic year. Percentages are rounded to the nearest whole number. The
asterisk (*) denotes inclusion of 8 Durham College teaching faculty cross-appointed with UOIT. The methodology used in calculating all counts is
considered true as of the date of publication.
Continuing staff, 2014-2015
Classification Total
Core Faculty (including five Academic Executives) 204
Teaching Faculty* 66
Definite Term 13
Senior Executives (non-academic) and Directors/Assistant Vice-Presidents (AVPs) 15
Professional/Managerial 112
Administrative/Technical 223
Total 633
Core Faculty (including five
Academic Executives): 204=
32%
Teaching Faculty*: 66=11%
Definte Term: 13= 2%
Senior Executives (non-academic)
and Directors/Assista
nt Vice-Presidents (AVPs): 15=2%
Professional/Managerial: 112= 18%
Administrative/Technical: 223=35%
Non Academic Staff:
350= 55%
UOIT Continuing Staff, 2014-2015(n=633*)
Return to Table of contents

UOIT Fact Book – 2014-2015 v3.0 January 2015 |Page 32
Teaching Faculty*: 66 = 23%
Definite Term: 13= 5%
Assistant Professor: 75=27%
Associate Professor: 86= 30%
Full Professor: 38=13%Academic
Executives: 5=2%
Core Faculty: 204=72%
UOIT Academic Staff Demographics, 2014-15(n=283*)
Return to Table of contents

UOIT Fact Book – 2014-2015 v3.0 January 2015 |Page 33
Core Faculty
Only academic administrators up to Deans are included in the following counts. Academic Executives (President, Provost, AVPs) are not included
in faculty counts.
2010-2011 2011-2012 2012-2013 2013-2014 2014-2015
Gender
Male 97 102 113 117 121
Female 63 64 65 70 78
% Female 39% 39% 37% 37% 39%
Appointment Status
Assistant Professor 81 82 77 72 75
Associate Professor 48 45 60 77 86
Full Professor 31 39 41 38 38
Total 160 166 178 187 199
2010-2011 2011-2012 2012-2013 2013-2014 2014-2015
Full Professor 31 39 41 38 38
Associate Professor 48 45 60 77 86
Assistant Professor 81 82 77 72 75
0
50
100
150
200
Core Faculty by Appointment Status
Full Professor
Associate Professor
Assistant Professor
Return to Table of contents

UOIT Fact Book – 2014-2015 v3.0 January 2015 |Page 34
2010-2011 2011-2012 2012-2013 2013-2014 2014-2015
Male 97 102 113 117 121
Female 63 64 65 70 78
0%
10%
20%
30%
40%
50%
60%
70%
80%
90%
100%
Core Faculty by Gender
Male
Female
18
6
1
9
14
9
18
15.75
7
6.5
15.75
11
18
12
4
4
5
10
3
4
8
0 5 10 15 20
Faculty of Business and…
Faculty of Education
Faculty of Energy Systems and…
Faculty of Engineering and…
Faculty of Health Sciences
Faculty of Science
Faculty of Social Science and…
Core Faculty by Faculty and Rank
Full Professor
Associate Professor
Assistant Professor
Return to Table of contents

UOIT Fact Book – 2014-2015 v3.0 January 2015 |Page 35
Tuition and fees
Tuition and fees (2014-2015 full-time fee schedule)
Undergraduate
Tuition (Domestic) Year 1 Year 2 Year 3 Year 4 Year 5
BA, BASc, BSc, BEd, BHSc, BSc, BSc & Mgmt, BScN $6,040 $6,005 $5,988 $5,959 $5,902
BCom $7,649 $7,576 $7,525 $7,246
BIT $9,003 $8,981 $8,892 $8,849
BEng, BEng & Mgmt $8,584 $8,502 $8,421 $8,109 $7,520
Tuition (International) Year 1 Year 2 Year 3 Year 4 Year 5
BA, BASc, BEd, BHSc, BSc & Mgt, BScN $18,119 $18,014 $17,195 $17,113 $17,113
BCom $18,825 $18,645 $17,798 $17,380
BIT $20,717 $20,666 $19,908 $19,532
BEng, BEng & Mgmt $21,396 $21,193 $20,229 $19,480 $19,480
Graduate - Program Based
Tuition (Domestic) Year 1 Year 2 Year 3 Year 4
MA (Crim), MHSc, MSc (Arts and Sciences) $8,174 $8,133
MASc, MEng, MENGM (Engineering) $8,499 $8,458
PhD (Arts and Science) $8,174 $8,133 $8,133 $8,054
PhD (Engineering) $8,499 $8,458 $8,458 $8,377
Diploma in Nuclear Technology, Engineering Management $5,666
Tuition (International) Year 1 Year 2 Year 3 Year 4
MA (Crim), MHSc, MSc (Arts and Sciences) $17,191 $17,106
MASc, MEng, MENGM (Engineering) $18,562 $18,472
PhD (Arts and Science) $17,191 $17,106 $16,321 $16,161
PhD (Engineering) $18,562 $18,472 $17,625 $16,972
Diploma in Nuclear Technology, Engineering Management $12,375
Return to Table of contents
UOIT Fact Book – 2014-2015 v3.0 January 2015 |Page 36
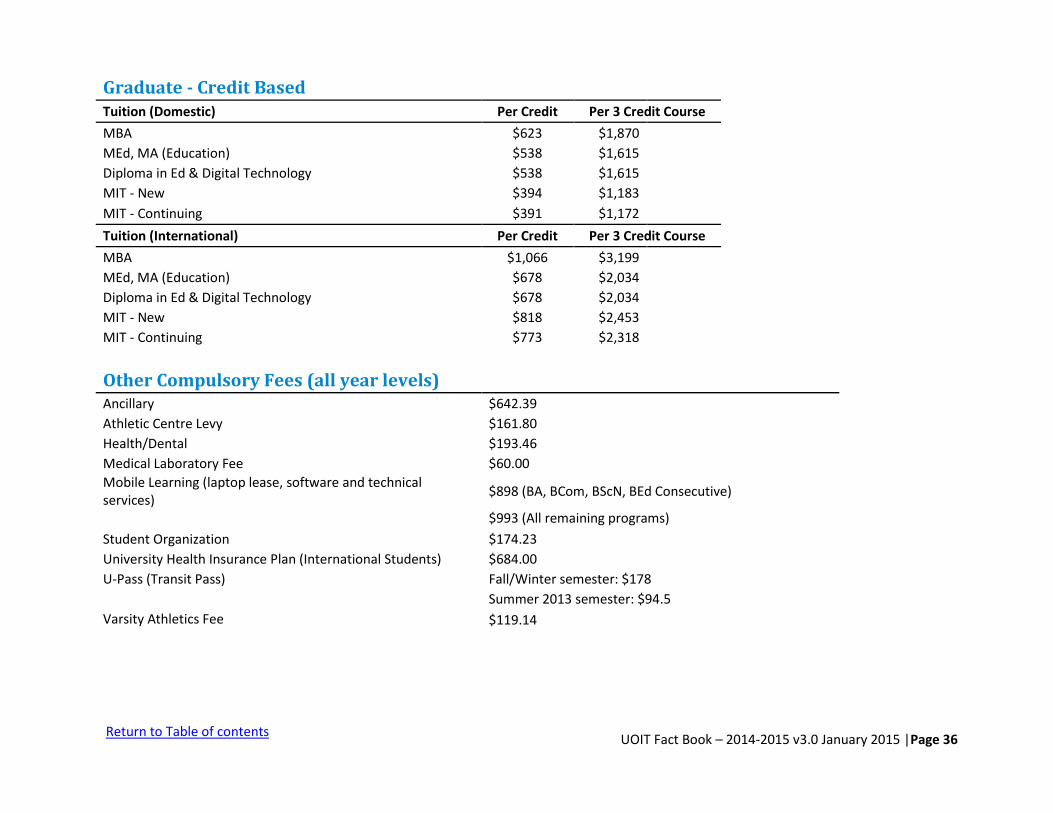
Graduate - Credit Based
Tuition (Domestic) Per Credit Per 3 Credit Course
MBA $623 $1,870
MEd, MA (Education) $538 $1,615
Diploma in Ed & Digital Technology $538 $1,615
MIT - New $394 $1,183
MIT - Continuing $391 $1,172
Tuition (International) Per Credit Per 3 Credit Course
MBA $1,066 $3,199
MEd, MA (Education) $678 $2,034
Diploma in Ed & Digital Technology $678 $2,034
MIT - New $818 $2,453
MIT - Continuing $773 $2,318
Other Compulsory Fees (all year levels)
Ancillary $642.39
Athletic Centre Levy $161.80
Health/Dental $193.46
Medical Laboratory Fee $60.00
Mobile Learning (laptop lease, software and technical services)
$898 (BA, BCom, BScN, BEd Consecutive)
$993 (All remaining programs)
Student Organization $174.23
University Health Insurance Plan (International Students) $684.00
U-Pass (Transit Pass) Fall/Winter semester: $178
Summer 2013 semester: $94.5
Varsity Athletics Fee $119.14
Return to Table of contents

UOIT Fact Book – 2014-2015 v3.0 January 2015 |Page 37
Miscellaneous Program Related Fees
Business and Information Technology Course Materials Fees (FBIT)
1. BUSI4190 $125.00
2. INFR1411U $5.00
3. INFR1310U $65.00 Canadian Society for Medical Laboratory Science membership fee (fee associated with MLSC4300) $75.00
Coop fee (per semester fee for B.Sc, B.Eng & B.Eng and Mgmt) $500.00
Education Course Materials Fee (EDU)
1. EDUC 4900 $100
2. EDUC 4910 $100
Engineering Opportunities Fee (ENG) $15
Kinesiology HLSC4492U & HLSC4493 $140.00
Medical Laboratory Fee $60.00
Med Lab Mask Fit Fee - MLSC4300 $32.00
Nursing Association Membership $15.00
Nursing lab fee (year one and two) $50.00
Nursing levy $10.00
Nursing Mask Fitting Fee $15.00
Outdoor Education Field Trip Fee (EDU)
1. EDUC 3482 $120.00
2. EDUC 3480 $130.00
3. EDUC 3481 $45.00
4. EDUC 3483 $80.00
Student Society Fee (FBIT) $10.00
Return to Table of contents

UOIT Fact Book – 2014-2015 v3.0 January 2015 |Page 38
Student financial aid and scholarships
Amounts are in Canadian dollars. Data is provided by the Student Awards and Financial Aid office.
Student scholarships and awards, 2014-2015
Admission Scholarships New Continuing Total
Number Amount Number Amount Number Amount
Chancellor's Scholarship ($7,000/year for four years) 1 $7,000 3 $21,000 4 $28,000
President's Scholarship ($6,000/year for four years) 2 $12,000 5 $27,000 7 $39,000
Founder's Scholarship ($5,000/year for four years) 2 $10,000 2 $10,000 4 $20,000
First Robotics ($3,000/year for four years) 1 $3,000 0 $0 1 $3,000
Global Leadership Award ($11,480/year for four years) 1 $11,480 0 $0 1 $11,480
Total 7 $43,480 10 $58,000 17 $101,480
Awards of Recognition New Continuing Total
Number Amount Number Amount Number Amount
95.0% - 100% = $3000 (renewable in 2nd, 3rd and 4th year) 5 $15,000 17 $51,000 22 $66,000
90.0% - 94.9% = $2,000 (renewable in 2nd, 3rd and 4th year) 67 $134,000 85 $169,000 152 $303,000
85.0% - 89.99% = $1,500 (renewable in 2nd, 3rd and 4th year) 184 $273,750 79 $118,500 263 $392,250
80.0% - 84.9% = $1,250 (renewable in 2nd, 3rd and 4th year) 360 $443,032 47 $58,750 407 $501,782
80.0% - 84.9% = $750 (renewable in 2nd, 3rd and 4th year) 0 $0 0 $0 0 $0
Renamed Awards = $1500 ( renewable up to 4 years) 0 $0 0 $0 0 $0
Total 616 $865,782 228 $397,250 844 $1,263,032
Total Awards and Scholarships 623 $909,262 238 $455,250 861 $1,364,512
Return to Table of contents

UOIT Fact Book – 2014-2015 v3.0 January 2015 |Page 39
Student financial aid
Type of Aid Total
Total Nil awards* 626
Total Canada Student Loan only 1,222
Total Ontario Student Loan only 48
Total Grant only 265
Total Canada and Ontario Student Loan 3,970
Total Number of OSAP applications on file 6,131
Funding Total
Total Canada Student Loans Issued $26,611,248
Total Ontario Student Loans Issued $13,785,012
Total Grants $14,781,817
Total Funding Issued $55,178,077
*'Nil' awards are situations where a student's OSAP assessment results in no funding due to their financial resources exceeding or meeting their
calculated costs.
Return to Table of contents
UOIT Fact Book – 2014-2015 v3.0 January 2015 |Page 40
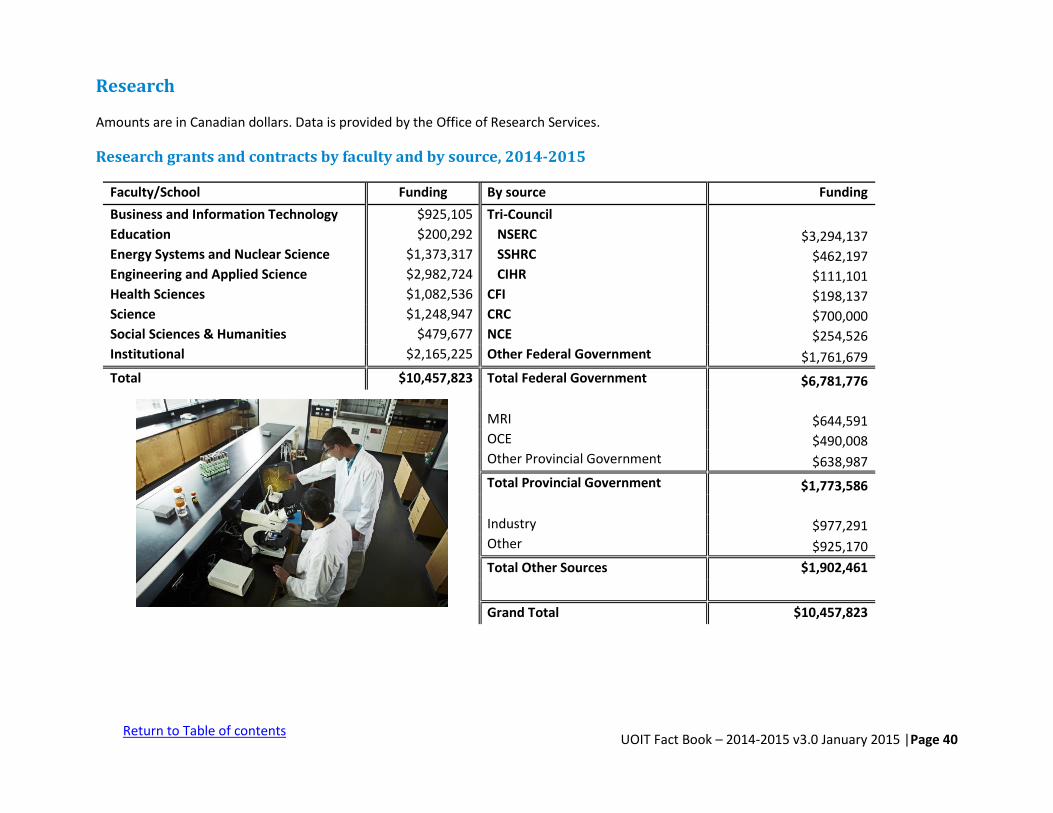
Research
Amounts are in Canadian dollars. Data is provided by the Office of Research Services.
Research grants and contracts by faculty and by source, 2014-2015
Faculty/School Funding By source Funding
Business and Information Technology $925,105 Tri-Council Education $200,292 NSERC $3,294,137 Energy Systems and Nuclear Science $1,373,317 SSHRC $462,197 Engineering and Applied Science $2,982,724 CIHR $111,101 Health Sciences $1,082,536 CFI $198,137 Science $1,248,947 CRC $700,000 Social Sciences & Humanities $479,677 NCE $254,526 Institutional $2,165,225 Other Federal Government $1,761,679
Total $10,457,823 Total Federal Government $6,781,776
MRI $644,591 OCE $490,008 Other Provincial Government $638,987
Total Provincial Government $1,773,586
Industry $977,291 Other $925,170
Total Other Sources $1,902,461
Grand Total $10,457,823
Return to Table of contents

UOIT Fact Book – 2014-2015 v3.0 January 2015 |Page 41
Percentage of total research grants held by faculty, 2014-2015
Research grants and contracts from Tri-Council by faculty/school, 2014-2015
Tri-Council FBIT FEDU FESNS FEAS FHS FSci FSSH Institutional
NSERC $413,880 $0 $812,678 $1,326,394 $42,000 $622,685 $76,500 SSHRC $115,327 $129,358 $0 $27,631 $0 $174,392 $15,489 CIHR $0 $0 $102,599 $0 $8,502
Total $529,207 $129,358 $812,678 $1,326,394 $172,230 $622,685 $174,392 $100,491
8.8%
1.9%
13.1%
28.5%
10.4%
11.9%
4.6%
20.7%
Business and Information Technology
Education
Energy Systems and Nuclear Science
Engineering and Applied Science
Health Sciences
Science
Social Sciences & Humanities
Institutional
Return to Table of contents

UOIT Fact Book – 2014-2015 v3.0 January 2015 |Page 42
Research grants by faculty
Faculty 2010-2011 2011-2012 2012-2012 2013-2014 2014-2015
Business and Information Technology $822,614 $808,828 $1,044,496 $771,224 $925,105
Education $126,207 $652,467 $266,312 $430,951 $200,292
Energy Systems and Nuclear Science $1,343,396 $1,347,780 $1,671,727 $1,694,688 $1,373,317
Engineering and Applied Science $3,806,020 $3,139,208 $3,317,612 $3,618,902 $2,982,724
Health Sciences $448,787 $502,898 $1,633,659 $1,829,417 $1,082,536
Science $1,991,768 $1,207,730 $1,163,929 $1,202,766 $1,248,947
Social Science and Humanities $30,127 $128,115 $373,340 $448,663 $479,677
Institutional $978,562 $2,717,928 $2,854,536 $1,645,120 $2,165,225
Total $9,547,481 $10,504,954 $12,325,611 $11,641,731 $10,457,823
Return to Table of contents

UOIT Fact Book – 2014-2015 v3.0 January 2015 |Page 43
Total research grants and contracts
Funding Source 2010-2011 2011-2012 2012-2013 2013-2014 2014-2015
Total federal government $6,397,984 $7,228,171 $6,623,566 $6,147,646 $6,781,776
Total provincial government $1,391,173 $1,858,803 $3,154,354 $2,444,922 $1,773,586
Total other sources $1,758,324 $1,417,981 $2,547,691 $3,049,162 $1,902,461
Total $9,547,481 $10,504,954 $12,325,611 $11,641,730 $10,457,823
$0
$2,000,000
$4,000,000
$6,000,000
$8,000,000
$10,000,000
$12,000,000
$14,000,000
2010-2011 2011-2012 2012-2013 2013-2014 2014-2015
Total federal government Total provincial government Total other sources Total
Return to Table of contents

UOIT Fact Book – 2014-2015 v3.0 January 2015 |Page 44
Research intensity per capita
Research intensity: Total number of Core Faculty divided by sponsored funding in academic year (excluding Academic Executives)
2010-2011 2011-2012 2012-2013 2013-2014 2014-2015
Research intensity $59,672 $63,283 $69,245 $62,255 $52,552
Return to Table of contents

UOIT Fact Book – 2014-2015 v3.0 January 2015 |Page 45
Finance
UOIT’s Finance department publishes reference information online, including financial statements and operating budgets. This can be found at:
uoit.ca/faculty_staff/campus_services/finance/reference_information.
Return to Table of contents

UOIT Fact Book – 2014-2015 v3.0 January 2015 |Page 46
Library
Number of library holdings
Category 2010-2011 2011-2012 2012-2013 2013-2014 2014-2015
Books and government publications (number of volumes) 60,000 60,900 64,250 59,000 63,200
E-books (number of titles) 45,000 550,700 550,640 709,250 622,552
E-journals (number of titles) 40,000 75,570 121,224 124,350 81,780
Print journals (number of titles) 50 75 73 45 48
Microfilms (number of pieces) 887 887 887 0 0
Sound and video recordings (number of titles) 10,000 14,170 17,190 40,235 67,823
Air photos (number of pieces) 0 0 0 0 0
Total 155,937 702,302 754,264 932,880 835,403 Notes: E-books: Decrease attributable to the elimination of duplicate title counts and removal of some database products. E-journals (number of of titles): Decrease attributable to the elimination of duplicate title counts and removal of some database products. Sound and video recordings: Includes 66,281 e-video, 933 e-audios, and 609 physical items.
Return to Table of contents

UOIT Fact Book – 2014-2015 v3.0 January 2015 |Page 47
Library personnel
Type of personnel 2010-2011 2011-2012 2012-2013 2013-2014 2014-2015 Professional librarians and managers 9.5 11 11 11 11.23
Assistants 15.79 17 20 20 19.86
Students
Total 25.29 28 31 31 31.09 Note: Total numbers for both UOIT & Durham College funded positions given above. UOIT funded Prof. Lib. & Managers -8.93, DC funded Prof. Lib. & Managers -2.3; UOIT funded Assistants - 15.62, DC Funded Assistants-4.24.
0
5
10
15
20
25
2010-2011 2011-2012 2012-2013 2013-2014 2014-2015
Library personnel
Professional librarians and managers
Assistants
Return to Table of contents

UOIT Fact Book – 2014-2015 v3.0 January 2015 |Page 48
Residences
Residence accommodation located on UOIT/Durham College property
Residence Style Beds available
Simcoe Village Open-concept suites 440 Simcoe Village Private 214 South Village Private 706 West Residence Apartment-style 216
Total 1,576 Notes: All accommodations are shared with Durham College. West Residence is available to upper-year students only.
Return to Table of contents
UOIT Fact Book – 2014-2015 v3.0 January 2015 |Page 49
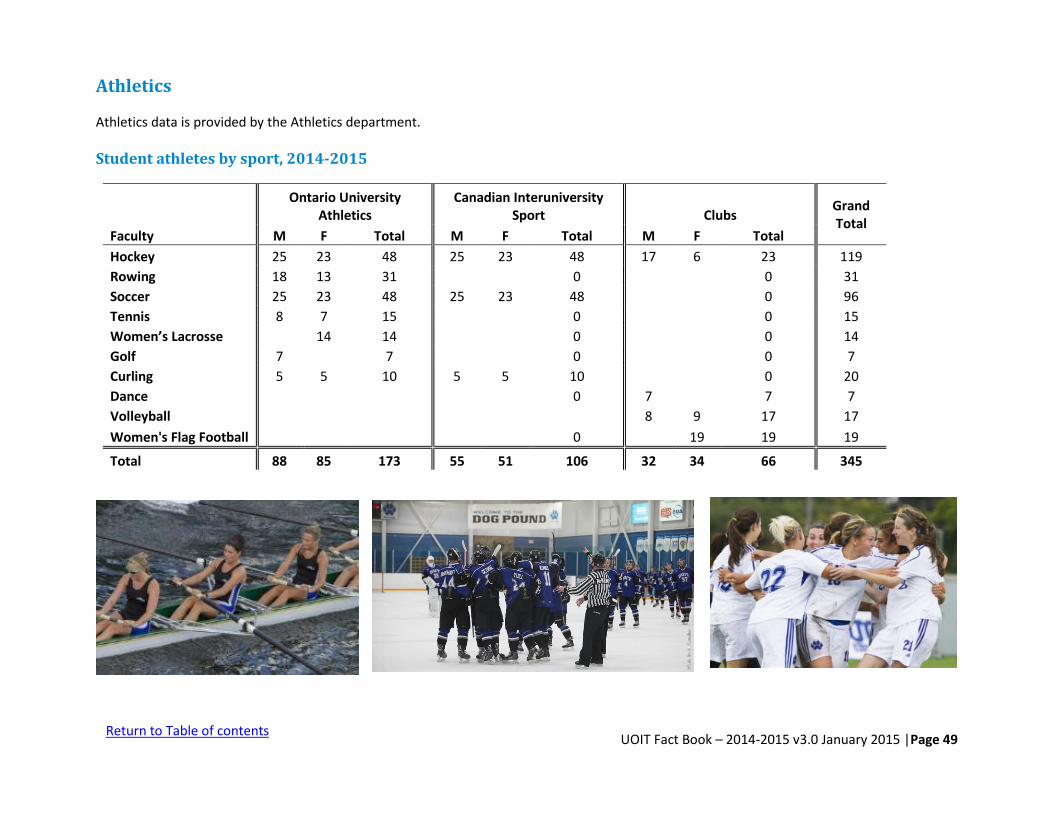
Athletics
Athletics data is provided by the Athletics department.
Student athletes by sport, 2014-2015
Ontario University
Athletics Canadian Interuniversity
Sport Clubs Grand Total
Faculty M F Total M F Total M F Total
Hockey 25 23 48 25 23 48 17 6 23 119
Rowing 18 13 31 0 0 31
Soccer 25 23 48 25 23 48 0 96
Tennis 8 7 15 0 0 15
Women’s Lacrosse 14 14 0 0 14
Golf 7 7 0 0 7
Curling 5 5 10 5 5 10 0 20
Dance 0 7 7 7
Volleyball 8 9 17 17
Women's Flag Football 0 19 19 19
Total 88 85 173 55 51 106 32 34 66 345
Return to Table of contents

UOIT Fact Book – 2014-2015 v3.0 January 2015 |Page 50
Fact Book glossary
Assistant Professor – A professional rank where a faculty member has completed the doctoral degree and can demonstrate experience or strong potential in the facilitation of learning, scholarly research and/or creative professional practice.
Associate Professor – A professional rank where a faculty member has demonstrated a record as a good and technologically innovative teacher committed to academic excellence and high-quality peer-assessed scholarship and/or creative professional practice.
BIU – Basic Income Unit. BIU = Full-time Equivalent (FTE) multiplied by weighting factor, depending on program of registration and the level of study. This measure of enrolment is used in government funding calculations.
CFI – Canada Foundation for Innovation
CIHR – Canadian Institutes of Health Research
Tenure/Tenure-track Faculty – Any person employed by the university with responsibility for a full range of academic duties (teaching, research and service), who is eligible for tenure or is tenured.
COU – Council of Ontario Universities
CRC – Canada Research Chair
Eligible/ineligible students –Refers to the eligibility of a student for operating grants from the provincial government. A student is considered eligible if he or she is either a Canadian citizen, a permanent resident, an eligible international student or a protected person; and is enrolled at an eligible institution, in a publicly-supported program approved after meeting the specific eligibility criteria set by the Ministry of Training Colleges and Universities.
FTE/FFTE – Full-time Equivalent/Fiscal Full-time Equivalent. Undergraduate and graduate FTEs are counted differently. Undergraduate FTEs are counted as a proportion of a normal full-time load for a particular program and level of registration over an academic year (all terms), or FFTE. Full-time undergraduates normally register for two terms per academic year, and those taking a full course load generate 0.5 FTE each term or 1.0 FFTE in total. Undergraduate students taking fewer courses than a full course load will generate proportionately fewer FTEs, and those taking more than a full course load or earning credits in a third term generate more FTEs. Graduate students are counted per term. By convention, graduate FTEs are approximated by summing FTEs in fall and summer terms. Graduates normally register for three terms. Full-time graduate students generate 1.0 FTE and part-time graduate students 0.3 FTE.
Full-time and part-time status – Students are considered full-time when they take 60 per cent or more of a full course load. Part-time status is designated for students taking less than 60 per cent of a full course load.
Headcount – Every student enrolled is counted as one headcount, regardless of registration status or course load or level of study. Fall term full-time headcounts (counted on November 1) are a commonly used measure for enrolments.
Return to Table of contents

UOIT Fact Book – 2014-2015 v3.0 January 2015 |Page 51
Fact Book glossary continued
MRI – Ministry of Research and Innovation (Ontario)
MTCU – Ministry of Training, Colleges and Universities (Ontario)
NCE – Networks of Centres of Excellence (Canada)
NSERC – Natural Sciences and Engineering Research Council of Canada
OCE – Ontario Centres of Excellence
Professor – A professional rank where a faculty member has demonstrated a clear commitment to, and a record of success in, the facilitation of learning and has shown substantial achievement in research and/or creative professional practice as evidenced by the production of a body of scholarly work or creative professional practice that is widely known and respected.
SSHRC – Social Sciences and Humanities Research Council of Canada
Teaching Faculty – Any person employed by the university with a focus on teaching. Classifications under this category include Lecturer and Lecturer and Laboratory Co-ordinator.
Undergraduates and graduates – Undergraduates are enrolled in undergraduate-level programs such as undergraduate diplomas and certificates, and bachelor's degrees; graduates are enrolled in graduate programs such as graduate diplomas and certificates, master's and doctoral degrees.
Return to Table of contents

UOIT Fact Book – 2014-2015 v3.0 January 2015 |Page 52
Contact
Any questions regarding the material contained in this publication should be directed to: Office of Institutional Research and Analysis (OIRA) University of Ontario Institute of Technology (UOIT) 2000 Simcoe Street North Oshawa, Ontario L1H 7K4 [email protected] uoit.ca/oira
Acknowledgements
The Office of Institutional Research and Analysis would like to thank individuals from the following departments for their collaboration in the production of this version of the UOIT Fact Book:
Durham College/UOIT residence
Athletics department
Office of Campus Infrastructure and Sustainability
Office of the Provost
Communications and Marketing
Student Awards and Financial Aid office
Office of the Vice-President Research, Innovation and International
Campus Library
Return to Table of contents
