university of naples federico ii - unina.it phd mastrovito.pdf · i would to thank my fellow...
TRANSCRIPT
UNIVERSITY OF NAPLES FEDERICO II Department of Structures
for Engineering and Architecture
PH.D. PROGRAMME IN
SEISMIC RISK
COORDINATOR PROF. ALDO ZOLLO
XXVIII CYCLE
MARCO MASTROVITO
PH.D. THESIS
SEISMIC BEHAVIOR OF RC PRECAST BUILDINGS:
THE CASE OF EMILIA EARTHQUAKE
TUTOR: PROF. DR. GENNARO MAGLIULO
CO-TUTOR: DR. CRESCENZO PETRONE
2016


To my Family and my Love


AKNOWLEDGMENTS
The PhD conclusion represents, for me, the achievement of a prestigious and ambitious
goal. It has been a hard course, full of difficulties and sacrifices. A course made of
study, nights, travels. Today I can say that all the spent efforts are repaid by the infinite
sense of gratification I feel right now. It is precisely for this reason that I feel obliged to
thank those who made this work possible. I would express my gratitude to the head of
the Italian Air Force Infrastructure Service, General De Rubeis, and to my commanders
at the 2° R.G.A.M. of Rome-Ciampino, Colonels Faggiano, Sciandra and Frontoni,
who gave me the opportunity to attend the PhD in Seismic Risk.
I would like to deeply thank my tutor, Prof. Gennaro Magliulo, who have been an
important guide even among many mutual work commitments. He blindly believed in
me, as well as in the opportunity to trust me with the development of this research
project. I would like to sincerely acknowledge my co-tutor, Dr. Crescenzo Petrone,
who has followed step by step the research program improvement, with extreme
patience and availability, providing a profound support to the ideas and to the studies
carried on: my thanks will never be enough to express my sincere gratitude for having
carefully reviewed this thesis, even kilometers away, with wisdom and comprehension.
I would to thank my fellow travelers Filomena De Silva and Piero Brondi, for their
support during these years of study. Special thanks to Maddalena Cimmino, with
whom I shared the tough times of the study course, without ever hiding the smiles to
overcome them. My special appreciation goes to Marianna Ercolino, because she never
spared herself in sharing her precious knowledge and support about the theme of the
seismic response of RC precast buildings. I would to thank Orsola Coppola for the
valuable advices and her infinite availability. Many thanks to Marcello Donvito, my
lifetime friend, for the support that he never failed to give me. I would to express my
gratitude to those friends and colleagues with whom I started this course, that saw its
origin, but took different ways.
I would like to thank the people who for years accept my choices in silence, showing
infinite understanding for my too many absences: to my family goes my infinite
gratitude and my sincere apologies. I would to thank Nana and Bisky, for their
company and the moments full of joy spent together.
My deepest gratitude goes, finally, to the person with whom I am sharing this
wonderful piece of life. To Martina, that had to accept my silences, my concerns, my
absence too many times, with deep patience, returning with unconditional love and
never making me miss the support and the determination to carry on.
Rome, March 2016


Abstract
I
ABSTRACT
The thesis is focused on the seismic behavior of existing RC precast buildings. This
structural typology has been characterized by a very quick development since the time
of the First World War, due to the reduction of construction time and to the possibility
of a better check on each structural element produced in the factories through industrial
processes. The main activities carried out in RC precast facilities are certainly
associated to the industrial sector, thanks to large spans and high usable height.
Therefore, the concept of loss for these buildings is not only related to human lives or
to the repair costs, but also to the costs due to the interruption of the activities carried
out in them. Emilia earthquake, occurred in May 2012, has sadly demonstrated the
inadequacy of industrial facilities in absorbing horizontal seismic forces, causing
deaths and injuries, as well as a huge economic loss.
The earthquake consequences on industrial buildings are presented in the first part of
the thesis, through the description of the reported damage of some facilities inspected
after the earthquake. For each industrial building, the main geometrical issues are
analyzed, along with the description of the principal structural elements.
Among the investigated buildings, two industrial facilities located in Mirandola (MO),
a few kilometers away each other, are considered as case-study buildings. The first
structure reported the partial collapse due to the breaking of two central columns, with
the fall of beams and tiles. The second facility reported only minor damages, such as
the fall of a corner cladding element.
A tridimensional numerical model has been implemented in order to first verify the
seismic performance of the first building, according to the Italian code. Thus, nonlinear
static and dynamic analyses have been performed. The N2 method by Fajfar was used,
taking into account the flexibility of the roof. Therefore, two different methods for the
definition of the displacement control point are followed: one is based on geometrical
considerations (proposed method); the other is based on the procedure proposed by
Casarotti in its Adaptive Capacity Spectrum Method.
At the end of each analysis, both fragile and ductile mechanisms have been checked.
The most suitable capacity models have been then selected. In particular, columns
shear capacity evaluation have been conducted through the study of the models
available in the technical literature. Then, rotations at the columns base have been
investigated, as well as the frictional behavior of the tiles-to-beams and beams-to-

Seismic Behavior of RC Precast Buildings: The Case Of Emilia Earthquake
II
columns connections. Nonlinear dynamic analysis gave less conservative results than
the nonlinear static analysis. In both cases, the obtained results show the frictional
connections to be inadequate to adsorb the seismic forces. Comparison between the
nonlinear static analysis results obtained following both formulations for the control
point definition demonstrated the validity of the proposed method. In order to validate
the model, nonlinear dynamic analyses have been carried on using as input signals the
acceleration components recorded by one of the Italian RAN stations. The comparison
between experimental and theoretical results have been conducted in order to verify the
numerical model capability to predict the real damages suffered by the building. For
this reason, the model has been completed taking into account the crane, positioned as
evidenced by the photos taken shortly after the earthquake. The numerical model has
proven to be capable to predict the real damages reported by the building, showing the
shear failure of the most stressed columns. In particular, the crane presence has proved
to be fundamental in order to justify the columns shear failure. Furthermore, the
theoretical-experimental comparison has corroborated the validity of the adopted
models. The same modeling issues have been adopted implementing a tridimensional
model of the second case-study building. Corresponding columns belonging to both
structures have been considered in order to study the different behavior of the facilities.
From the comparison it is shown that the first building is subjected to higher shear
forces due to larger masses. Furthermore, the vertical component of the earthquake has
significantly affected the columns shear capacity, reducing it in correspondence with
the minimum axial load values. Finally, a tridimensional model of the second facility
taking into account the horizontal cladding panels have been implemented, in order to
study their influence on the vibration periods, comparing the seismic response with the
bare model one. Results show that the choice, in the numerical model, of the panels
constraint typology affects decisively the vibration periods values. In particular, the
choice of rigid constraints reduces significantly all the vibration periods; the use of
semi rigid constraints results in a reduction of the higher modes vibration periods.
Keywords: industrial facilities, seismic behavior, nonlinear analyses, shear capacity,
displacement control point, flexible diaphragm.

Table of contents
III
TABLE OF CONTENTS
Abstract ..................................................................................................... I
Table of contents .................................................................................... III
List of figures ........................................................................................... V
List of tables ........................................................................................... IX
Chapter 1 Introduction ...................................................................... 1
1.1 Motivations ..................................................................................................... 1
1.2 Objectives ........................................................................................................ 3
1.3 Outline of the thesis ........................................................................................ 4
1.4 References ....................................................................................................... 6
Chapter 2 Industrial buildings behavior during the Emilia
earthquake 8
2.1 The Emilia earthquakes ................................................................................. 8
2.2 The code development ................................................................................. 10
2.3 Seismic behavior of precast facilities .......................................................... 12
2.3.1 A building (ACEA-ARIES) ..................................................................... 13
2.3.2 M building (Immobiliare Mantovani S.r.l.) ........................................... 15
2.3.3 U building (Unifer S.r.l.) ....................................................................... 18
2.3.4 Conclusions ........................................................................................... 22
2.3.5 References .............................................................................................. 23
Chapter 3 Analysis of the seismic performance of two industrial
buildings 26
3.1 State of knowledge and structure description ........................................... 27
Seismic Behavior of RC Precast Buildings: The Case Of Emilia Earthquake
IV
3.2 Real damages ................................................................................................ 32
3.3 Numerical modelling .................................................................................... 37
3.3.1 Plastic hinges material tool ................................................................... 42
3.4 Seismic evaluation according to the italian code ....................................... 43
3.4.1 Nonlinear static analysis ....................................................................... 44
3.4.2 Nonlinear dynamic analysis – accelerograms selection........................ 49
3.5 Capacity models ........................................................................................... 50
3.5.1 Shear capacity models ........................................................................... 50
3.5.2 Connections capacity models ................................................................ 52
3.5.3 Rotation capacity models ....................................................................... 52
3.6 Results comparison ...................................................................................... 53
3.6.1 Nlsa results ............................................................................................ 54
3.6.2 Nlda results ............................................................................................ 63
3.6.3 Nonlinear static and dynamic results comparison ................................ 66
3.7 Model validation ........................................................................................... 69
3.7.1 Damage prediction ................................................................................ 71
3.8 Di Quattro 1995 Building ............................................................................ 81
3.8.1 Structural description and territorial context ........................................ 81
3.8.2 Real damages ......................................................................................... 84
3.8.3 Modelling in OpenSees .......................................................................... 85
3.8.4 Nonlinear dynamic analysis results ....................................................... 86
3.8.5 Case studies results comparison ............................................................ 90
3.8.6 D1 building cladding panels influence .................................................. 96
3.8.6.1 Results analysis .............................................................................. 98
3.8.7 References .............................................................................................. 99
Chapter 4 Conclusions.................................................................... 103
List of figures
V
LIST OF FIGURES
Figure 1 - Map in terms of recorded horizontal PGA – RAN (May 29, 2012). .............. 2
Figure 2 - Industrial facilities damaged by the earthquake: infill cladding panels
collapse (a); plastic hinge formation (b). ......................................................................... 3
Figure 3 - The Emilia earthquakes distribution (Swiss Seismological Service). ............. 9
Figure 4 - A building: two bays scheme in the longitudinal direction. ......................... 13
Figure 5 – A building: main area view (a); vertical cladding panels (b); masonry infill
wall (c). .......................................................................................................................... 14
Figure 6 - Damage reported by the A building: tiles loss of support (a); columns loss of
verticality (b); plastic hinges formation at the column bases (c); collapse of brick infill
walls(d). ......................................................................................................................... 15
Figure 7 - M building plan: excerpt from the original design documents. .................... 16
Figure 8 - M building damages: plastic hinge development (a) (b); collapse of internal
infill wall(c)(d). ............................................................................................................. 18
Figure 9 - U building plan (design document)............................................................... 19
Figure 10 – Column-to-foundation plinth connection. .................................................. 20
Figure 11 - Beam-to-column connection. ...................................................................... 20
Figure 12 - Panel-to-column connection. ...................................................................... 21
Figure 13 - U building reported damage: falling of panels (a); breaking of metal
support (b). .................................................................................................................... 21
Figure 14 - U building reported damage: localized supporting beams breaking. .......... 22
Figure 15 - Pre-event view of case-study building, placed in Mirandola (MO) (Google
Earth™). ......................................................................................................................... 27
Figure 16 - Building plan: main building (blue); secondary annex structure (red). ...... 28
Figure 17 - Beam-to-beam connection. ......................................................................... 29
Figure 18 - Longitudinal section and plan view of a beam. .......................................... 30
Figure 19 - Roof beam section: neoprene pads position................................................ 30
Figure 20 – Building schematic plan and columns identification. ................................ 31
Figure 21 – Structural drawings: “PF” column features. ............................................... 32
Figure 22 - D1 building: falling of a roof tile. ............................................................... 33
Figure 23 - Case study: point of view (a); injured columns (b). .................................... 33
Seismic Behavior of RC Precast Buildings: The Case Of Emilia Earthquake
VI
Figure 24 - Reduction in longitudinal bars and failure surface height for the injured
column. .......................................................................................................................... 34
Figure 25 - Case study: presence of the crane near the collapsed columns (a); partial
collapse of the facility - photo taken during the demolition operations (b). .................. 35
Figure 26 - State of one column during the structure demolition phases: damages in the
upper portion. ................................................................................................................ 35
Figure 27 - Case study: view of the injured structure (a); photo of the collapsed
columns after the demolition operations (b); one of the two columns break details (c).
....................................................................................................................................... 36
Figure 28 - Case study: damage of the horizontal panels (a); failure of a panel (b). ..... 37
Figure 29 - 3D building model implemented in OpenSees. .......................................... 38
Figure 30 - Concrete stress-strain model proposed by Mander et al. ............................ 40
Figure 31 – PG02 Column: Moment-Rotation relationship (a); Moment-curvature
curve and bilinearization (b). ......................................................................................... 41
Figure 32 - Model of building bays in Y direction: particular of the horizontal and
vertical eccentricities (not in scale). .............................................................................. 41
Figure 33 - Matlab GUI created in order to define the plastic hinges moment-curvature
and moment-rotation behavior....................................................................................... 42
Figure 34 - Capacity curves in x direction (X+ and X-) for both "MASSA" and
"MODO" distributions. .................................................................................................. 45
Figure 35 - Control displacement point choice in X and Y direction. ........................... 46
Figure 36 - Control point displacement vs total shear in N-S direction: comparison
between the proposed method (grey lines) and the ACSM procedure (black lines). .... 47
Figure 37 - Control point displacement vs total shear in E-W direction: comparison
between the proposed method (grey lines) and the ACSM procedure (black lines). .... 47
Figure 38 - Equivalent SDOF model and F-d bilinearization scheme. .......................... 48
Figure 39 - Capacity curves in X direction derived from the proposed control
displacement point procedure (grey) vs the Casarotti and Pinho formulas (black). ...... 55
Figure 40 - Capacity curves in Y direction derived from the proposed control
displacement point procedure (grey) vs the Casarotti and Pinho formulas (black). ...... 55
Figure 41 - Capacity curves in X and Y direction: circles indicates the demand
displacements, squares indicates first plasticization points. .......................................... 56
Figure 42 - Modes of vibration: 1st (a); 2nd (b); 3rd (c); 4th(d). .................................. 57
Figure 43 - Capacity Curves plotted in the Acceleration Displacement Response
Spectrum Plane (X direction). ....................................................................................... 58
Figure 44 - Capacity Curves plotted in the Acceleration Displacement Response
Spectrum Plane (Y direction). ....................................................................................... 58
List of figures
VII
Figure 45 - ADRS spectrum graphic check using the Casarotti and Pinho method to
establish the control displacement point (X direction). ................................................. 60
Figure 46 - ADRS spectrum graphic check using the Casarotti and Pinho method to
establish the control displacement point (Y direction). ................................................. 60
Figure 47 - NLSA results in terms of shear in EW direction (a) and NS direction (b). 62
Figure 48 - NLSA results in terms of chord rotation in EW direction (a) and NS
direction (b): maximum demand (black), Fischinger capacity (grey). EC8 capacity
(white). .......................................................................................................................... 63
Figure 49 – Connections frictional checks for both static and dynamic nonlinear
analysis: Safe Factors evaluated as the ratio between Demand and Capacity. .............. 66
Figure 50 - Nonlinear analysis result comparison in terms of shear (EW direction). ... 67
Figure 51 - Nonlinear analysis result comparison in terms of shear (NS direction)...... 68
Figure 52 - Shear check in EW direction: comparison between the results obtained
using the proposed method and the Casarotti and Pinho procedure for the control point
displacement evaluation. ............................................................................................... 69
Figure 53 - Shear check in NS direction: comparison between the results obtained
using the proposed method and the Casarotti and Pinho procedure for the control point
displacement evaluation. ............................................................................................... 69
Figure 54 – MRN Station signals recorded on 20th May 2012. .................................... 70
Figure 55 - 2_06 and 2_07 columns reduction in longitudinal reinforcement. ............. 72
Figure 56 - 1st columns row shear check diagrams in Y direction: shear load (black),
Sezen-Mohele shear capacity (dark grey), Biskinis shear capacity sez. BB (grey),
Biskinis shear capacity sez. AA (light grey). ................................................................ 73
Figure 57 - Recorded signals seismic spectra in both X and Y direction. ..................... 74
Figure 58 - Time history MRN analysis results: shear check in EW direction. ............ 75
Figure 59 - Time history MRN analysis results: shear check in NS direction. ............. 75
Figure 60 - Checks in terms of shear: shear failures in NS direction. ........................... 75
Figure 61 – 2nd columns row shear check diagrams in Y direction: shear load (black),
Sezen-Mohele shear capacity (dark grey), Biskinis shear capacity sez. BB (grey),
Biskinis shear capacity sez. AA (light grey). ................................................................ 76
Figure 62 - Cross section features in Response2000. .................................................... 78
Figure 63 – 2_07 column shear Capacity versus Demand comparison. ........................ 79
Figure 64 - D2 building during the demolition phases: in the foreground on the right
the 1_07 column. ........................................................................................................... 80
Figure 65 - 2_07 column failure: comparison between real damages (a) and Response
2000 crack prevision (b). ............................................................................................... 81
Figure 66 - Mirandola (MO) aerial view: D1(rectangular boundary) and D2 (circled
boundary) location. ........................................................................................................ 82

Seismic Behavior of RC Precast Buildings: The Case Of Emilia Earthquake
VIII
Figure 67 - D2 plan taken from the building final design report. .................................. 83
Figure 68 - A typical D2 column: on the top the steel rods are visible and the downpipe
in the middle. ................................................................................................................. 84
Figure 69 - D2 building damages: falling of the corner cladding element (a); cracks due
to the tiles displacement (b),(c),(d). ............................................................................... 85
Figure 70 - D2 building plan scheme and numerical model tridimensional view in
OpenSees. ...................................................................................................................... 86
Figure 71 - Shear check in E-W direction for the first columns row: shear demand
(blue) vs shear capacity according to the Sezen formula (cyan). .................................. 88
Figure 72 - Shear check in N-S direction for the first columns row: shear demand
(blue) vs shear capacity according to the Sezen formula (cyan). .................................. 89
Figure 73 - Figure 54 - Shear check in E-W direction for the second columns row:
shear demand (blue) vs shear capacity according to the Sezen formula (cyan). ........... 89
Figure 74 - Figure 54 - Shear check in N-S direction for the second columns row: shear
demand (blue) vs shear capacity according to the Sezen formula (cyan). ..................... 90
Figure 75 - Roof tiles adopted for D1(a) and D2(b) buildings. ..................................... 91
Figure 76 - D1 facility H cross section principal beams. .............................................. 92
Figure 77 - Comparison between similar D1 and D2 building columns. ...................... 94
Figure 78 - Columns comparison: recorded shear in N-S direction. ............................. 94
Figure 79 - Columns comparison: recorded shear in E-W direction. ............................ 95
Figure 80 - Columns comparison: recorded axial forces. .............................................. 96
Figure 81 - Cladding panels anchoring system. ............................................................ 97
Figure 82 - Case study front elevation: simple scheme of panels type 1 and 2. ............ 98
Figure 83 - Infilled building model in OpenSees. ......................................................... 98
List of tables
IX
LIST OF TABLES
Table 1 - Case study buildings: clients and years of construction. ................................ 12
Table 2 - Inspected structures features. ......................................................................... 23
Table 3 - Columns main characteristics. ....................................................................... 31
Table 4 - Materials main mechanical properties. ........................................................... 40
Table 5 - Mass participation ratio and modal participation factor values in X (E-W) and
Y (N-S) directions. ........................................................................................................ 54
Table 6 - Checks in terms of displacements for the Life Safety Limit State considering
the first plasticization point (NLSA – Real System). .................................................... 57
Table 7 - Periods of vibration for the first four modes. ................................................. 57
Table 8 - Checks in terms of displacements for the Life Safety Limit State (NLSA –
Equivalent System). ....................................................................................................... 59
Table 9 - Example of columns numbering adopted in the graphs. ................................ 61
Table 10 - NLDA: selected seismic input records. ........................................................ 64
Table 11 - NLDA: shear capacity (Vc) and shear demand (Vd) in EW direction. ........ 65
Table 12 – NLDA: shear capacity (Vc) and shear demand (Vd) in NS direction. ........ 65
Table 13 – Features of the 1st Emilia seismic mainshock recorded by the MRN station.
....................................................................................................................................... 71
Table 14 - Frictional Safety Factors. ............................................................................. 87
Table 15 - Maximum rotation recorded in E-W and N-S directions and related Safety
Factors. .......................................................................................................................... 87
Table 16 - Main D1 and D2 buildings general features. ................................................ 92
Table 17 – D1 and D2 model periods of vibration. ....................................................... 93
Table 18 - Modal analysis results for the base structure and for the infill model
structure. ........................................................................................................................ 99

Introduction
1
Chapter 1 INTRODUCTION
The roots of the development of concrete precast buildings in Italy lie in the first
postwar years, when the need to quickly rebuild the destroyed housing stock led the
pioneering spirit of the engineers of that time.
The necessity to build structures in less time, saving on production costs, resulted in
the growth of manufacturing processes capable of ensuring the building of long spans
structures, overcoming the unique of steel structures.
The spread of concrete precast buildings in our Country has grown more and more,
coming to cover, in the Nineties, the 85% of the whole industrial buildings stock
(Toniolo, 2001).
The rapidity of construction was made possible by a very simple basic construction
system. Generally, this type of facilities is characterized by a simple structural layout,
made of cantilevered monolithic columns placed into socket foundations; prestressed
concrete beams are placed on columns corbels or directly at the top of the columns,
serving as support beams for roof tiles.
The described static scheme, because of the columns height, greater than ordinary cast-
in-place buildings, implies high flexibility and thus need greater attention in the design
of the connections between structural elements, in order to withstand horizontal
actions.
1.1 MOTIVATIONS
The seismic performance evaluation of existing concrete precast buildings has been
emphasized once again after the earthquake that hit Emilia Romagna in May 2012,
causing considerable damages mainly in the industrial hubs near the epicenters.
The “emilian” seismic sequence happened with two main-shocks: the first shock, a 5.9
moment magnitude earthquake, occurred on May 20, with epicenter located at Finale
Emilia (Modena, Northern Italy); the second main-shock, characterized by 5.8 MW,
occurred on May 29 near Medolla (Modena, Northern Italy) (Figure 1).

Seismic Behavior of RC Precast Buildings: The Case Of Emilia Earthquake
2
Figure 1 - Map in terms of recorded horizontal PGA – RAN (May 29, 2012).
The hit areas were characterized by a high concentration of industrial facilities (about
48,000, for a total of 190,000 employees); therefore, besides the losses in terms of
human lives (27 casualties and more than 350 injured), the earthquake caused huge
damages in economic terms.
Economic losses, both direct and indirect ones, due to the earthquake amounted overall
to more than 13 billion euros in the stricken northern Italy regions. In Emilia-Romagna
region the estimated loss is about 12 billion euros: 3 billion euros to the residential
buildings; more than 5 billion euros to the industrial facilities; 3 billion euros to
historic-cultural and religious buildings (PCM, 2012).
The earthquake revealed the structural deficiencies of precast buildings, whose seismic
vulnerability was mainly associated to the inadequacy of the codes and standards used
in the design phase. As a matter of fact, the seismic hazard maps of the stricken areas
has been updated only in 2003, settling in the class of medium-low seismicity region.
Furthermore, as allowed by the Law. n. 168 17/08/2005, art. n. 14-undevicies,
application of the latest seismic technical code requirements (Ministerial Decree
14/09/2005) become compulsory only in 2006.
Introduction
3
(a)
(b)
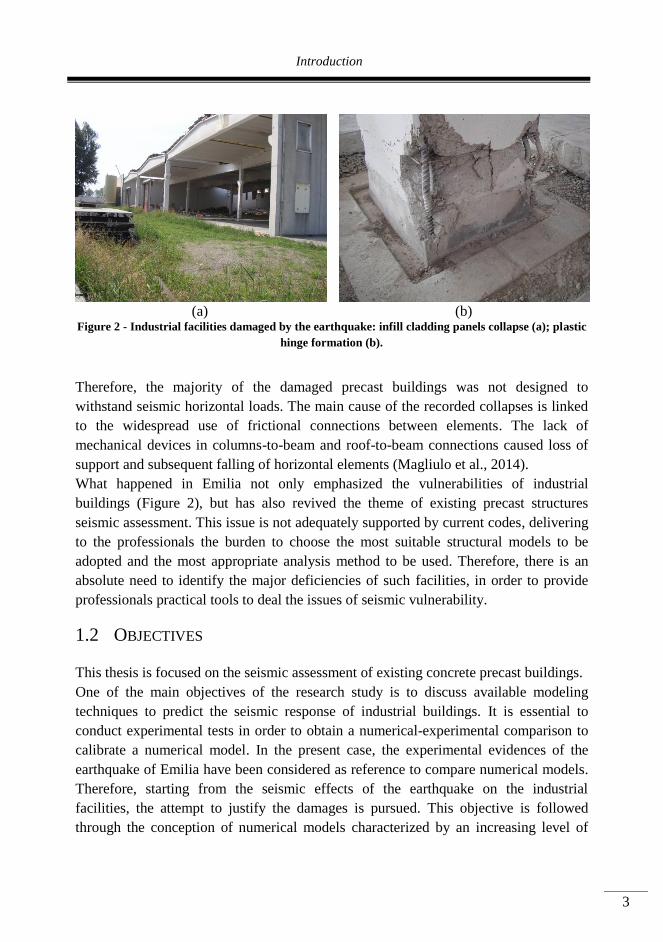
Figure 2 - Industrial facilities damaged by the earthquake: infill cladding panels collapse (a); plastic
hinge formation (b).
Therefore, the majority of the damaged precast buildings was not designed to
withstand seismic horizontal loads. The main cause of the recorded collapses is linked
to the widespread use of frictional connections between elements. The lack of
mechanical devices in columns-to-beam and roof-to-beam connections caused loss of
support and subsequent falling of horizontal elements (Magliulo et al., 2014).
What happened in Emilia not only emphasized the vulnerabilities of industrial
buildings (Figure 2), but has also revived the theme of existing precast structures
seismic assessment. This issue is not adequately supported by current codes, delivering
to the professionals the burden to choose the most suitable structural models to be
adopted and the most appropriate analysis method to be used. Therefore, there is an
absolute need to identify the major deficiencies of such facilities, in order to provide
professionals practical tools to deal the issues of seismic vulnerability.
1.2 OBJECTIVES
This thesis is focused on the seismic assessment of existing concrete precast buildings.
One of the main objectives of the research study is to discuss available modeling
techniques to predict the seismic response of industrial buildings. It is essential to
conduct experimental tests in order to obtain a numerical-experimental comparison to
calibrate a numerical model. In the present case, the experimental evidences of the
earthquake of Emilia have been considered as reference to compare numerical models.
Therefore, starting from the seismic effects of the earthquake on the industrial
facilities, the attempt to justify the damages is pursued. This objective is followed
through the conception of numerical models characterized by an increasing level of
Seismic Behavior of RC Precast Buildings: The Case Of Emilia Earthquake
4
accuracy, improved in a process that resulted in the definition of the accurate models
herein presented.
A critical review of the seismic assessment of existing precast buildings according to
the current technical standards is another objective of the study. According to the
Italian code (NTC2008), both linear or nonlinear static or dynamic analysis may be
adopted to evaluate the seismic vulnerability of existing buildings.
The aim of the performed analysis is to investigate different the analysis results, with
particular attention to the code verification of the building. In particular, both nonlinear
dynamic and static analysis have been performed in order to make a comparison
between the relative results. Thus, nonlinear static analysis needs a particular attention
in order to be correctly performed. In fact, nonlinear static analysis on a tridimensional
building model is based on the assumption that a control point displacement is
representative of the global behavior of the structure. According to national and
international codes, nonlinear static analyses are supposed to be valid only when a
series of important assumptions are made: first of all the irrelevance of the higher
modes. Since the rigid diaphragm condition is not assured for concrete precast
buildings, particular care has been paid to the choice of the displacement control point.
A method to consider the displacement control point is proposed: technical literature
seems to be poor in this terms.
1.3 OUTLINE OF THE THESIS
The thesis is focused on two main Chapters: Chapter 2, in which the seismic behavior
of three inspected industrial buildings after the first Emilia earthquake mainshock is
presented, and Chapter 3, that deals with the investigation of the seismic performance
of two facilities considered as case-study buildings.
In Section 2.1 the Emilia earthquake is described, with its main features. The recorded
spectra obtained from the Italian RAN stations exhibits a good match with the design
code spectra for type C soil with a return design spectrum period of 2.475 years.
In Section 2.2 a brief structural codes development is presented. The analysis of the
different code steps demonstrates that the constructions built until 2005 were not
designed to adequately adsorb seismic horizontal forces. This explains the high seismic
vulnerability of concrete industrial buildings.
Section 2.3 deals with the description of three industrial facilities hit by the earthquake.
The buildings have been inspected after the first Emilia earthquake mainshock. The
reported damage for each building is described: the main criticalities affected the loss
of support with subsequent fall of horizontal elements, the columns loss of verticality,
Introduction
5
the development of plastic hinges at the column bases and the collapse of infill and
cladding panels.
Section 3.1 and 3.2 deals with the description of the principal analyzed building and
the analysis of the earthquake consequencies. Among the presented facilities, the
principal case-study building is the one which reported the highest damage. In fact, it
reported the partial collapse due to the break of two central columns.
In Section 3.3 the numerical modeling phase is described. A tridimensional building
model in OpenSees has been implemented, considering a lumped plasticity model.
Because of their frictional nature, element connections as internal hinges are modeled.
Geometric eccentricities have also been considered. A practical tool has been
implemented in order to define the plastic hinges behavior.
Section 3.4 is focused on the seismic evaluation of existing buildings in compliance
with the Italian code, according to which both linear or nonlinear static or dynamic
analysis may be adopted in order to evaluate the seismic vulnerability of existing
buildings. Therefore nonlinear static and dynamic analysis procedures are presented,
with particular attention in the definition of the control displacement point for the static
analysis, given that the rigid diaphragm condition is not ensured. At the end of each
analysis checks in terms of both fragile and ductile mechanism are conducted, using
the capacity models presented in Section 3.5.
In Section 3.6 the analyses results are showed. A comparison between nonlinear static
and dynamic analyses results is conducted. This study is motivated by the fact that the
two different analyses, characterized by a different level of accuracy, could conduct to
opposite results.
Dynamic nonlinear analysis considering the Mirandola station recordings as input
signals is presented in Section 3.7. The main objective of this procedure is the
validation of the adopted numerical model, through a theoretical-experimental
comparison.
Section 3.8 introduces the second case-study building of the entire research program. It
is an older structure than the previous one, located a few kilometers away from it, but
suffered only minor damage because of the Emilia earthquake. A tridimensional model
of the building is implemented, on the basis of the modeling issues adopted for the
precious facility. Nonlinear dynamic analysis with the recorded acceleration signals are
carried on in order to make a comparison with the principal case study seismic
performance. Furthermore, a numerical model with the presence of the cladding panels
is implemented, with the objective to study their influence in the facility vibration
periods.
Seismic Behavior of RC Precast Buildings: The Case Of Emilia Earthquake
6
1.4 REFERENCES
Magliulo G, Ercolino M, Petrone C, Coppola O, Manfredi G (2014) The Emilia
Earthquake: Seismic Performance of Precast Reinforced Concrete Buildings.
Earthquake Spectra 30 (2):891-912. doi:doi:10.1193/091012EQS285M
PCM (2012) Dipartimento della Protezione Civile - DPC. Italian Application to
mobilize the European Union Solidarity Fund – EUSF: Earthquakes May 2012
in the area of the Regions: Emilia-Romagna, Lombardia and Veneto
Toniolo G (2001) Cent’anni di Prefabricazione in calcestruzzo 2001. 128. Versão para
discussão

Introduction
7

Seismic Behavior of RC Precast Buildings: The Case Of Emilia Earthquake
8
Chapter 2 INDUSTRIAL BUILDINGS
BEHAVIOR DURING THE EMILIA
EARTHQUAKE
In this chapter the Emilia earthquake is analyzed on the basis of its consequences on a
series of considered industrial buildings. Firstly, a brief description of the seismic event
evolution is carried out. Its intrinsic features make it certainly one of the most peculiar
Italian seismic events of the last years, especially for the maximum recorded
accelerations. Then, a careful analysis of the evolution of the Italian anti-seismic
regulatory framework is presented. In a curious way, even if Italy has been hit from a
terrible seismic event in early 20th century, with a subsequent detailed study of the
territorial aspects linked with the earthquake occurrence and the development of
seismic building technologies, the Italian code history shows a great inertia in the
application of seismic regulations. This is one of the reasons which led to the built, up
to less than ten years ago, of facilities inadequate from a seismic point of view. Finally,
the seismic response to the Emilia earthquake of a group of concrete precast buildings
is presented.
2.1 THE EMILIA EARTHQUAKES
In May 2012 Northern Italy has been hit by a series of seismic events that have
highlighted especially the deficiencies of industrial facilities. The seismic sequence
was characterized by two main shocks: the first, occurred on 20th May, a 5.9 moment
magnitude MW earthquake, was located at Finale Emilia (Modena, Northern Italy); the
second main shock of 5.8 moment magnitude MW, with epicenter located at Medolla
(Modena, Northern Italy), occurred on 29th May. These main shocks belong to a
sequence started on May 18th, as shown in Figure 3.

Industrial buildings behavior during the Emilia earthquake
9
Figure 3 - The Emilia earthquakes distribution (Swiss Seismological Service).
The hit areas, according to the national reference seismic hazard model, are in the field
of medium level of seismic hazard. In fact, it is characterized by an expected horizontal
peak ground acceleration (PGA) with a 10% probability of exceedance in 50 years that
ranges between 0.10 g and 0.15 g. As shown in (Magliulo et al., 2014) (Meletti et al.,
2012), the recorded spectra for the horizontal components obtained from the Mirandola
strong motion recording station (MRN) exhibits a good matching with the design code
spectra for type C soil (CS.LL.PP., 2008) with a return period of 2,475 years.
Therefore, such an earthquake represents a very rare event.
In the epicentral areas, along with maximum horizontal accelerations of about 250-300
cm/s2, maximum vertical accelerations up to 900 cm/s
2 were also recorded. Therefore,
several studies have been carried out in the areas hit by the earthquakes, also aimed to
determine the influence of seismic site effects. In some sites, liquefaction phenomena
evidences are also exhibited. (Priolo et al., 2012), through his preliminary analyses
based on HVSR definition, found important amplification peaks in the 0.8 – 1.0 Hz
frequency range. Many sites located in the Po Plain had shown frequency peaks due to
site effects for medium-long periods (Bordoni et al., 2012). The experimental
evidences confirmed the presence of cohesionless soils at the surface layers, such as
silty-sandy soils. Therefore, it should be emphasized as the seismic response has often
suffered from spectral amplification phenomena for medium-long periods, typical of
precast buildings.
Seismic Behavior of RC Precast Buildings: The Case Of Emilia Earthquake
10
The area struck by the earthquakes is one of the most important Italian industrial hubs,
with high concentration of productive activities. Therefore, extensive damage has been
reported by industrial facilities.
2.2 THE CODE DEVELOPMENT
As mentioned in the previous paragraph, the Emilia earthquakes, in terms of peaks
values, represents a really rare event. Nevertheless, most of the damaged buildings
have been realized with structural codes deficient from the seismic point of view. To
well understand the regulatory framework from which these structures derive, a brief
description of the Italian seismic code development is reported.
The birth of the first shape of Italian seismic code is generally associated to the 1908
Messina earthquake: the Royal Decree n. 193 18/04/1909 (in Italian Regio Decreto 18
aprile 1909 n. 193) is in fact the first Italian seismic regulation. Therefore, since 1909
(and until 1974), municipalities were classified as seismic only after being heavily
damaged by an earthquake. In some cases, in order to encourage the construction of
new buildings for economic growth, municipalities were even declassified. The
regulatory framework essentially does not change until the enactment of the Law n. 64
(Legge n. 64) 02/02/1974, which states that the seismic classification should be made
on the basis of proven scientific and technical reasons, by means of Ministerial
Decrees. Moreover, Law n. 64 provided the opportunity to update the seismic
standards whenever it was justified by the evolution of knowledge of seismic
phenomena. While the seismic classification is operated, as in the past, by inserting the
municipalities affected by the new seismic events.
Later, the seismological studies performed after the Friuli Venezia Giulia earthquake of
1976 and the Irpinia earthquake of 1980, inserted in the “Geodinamica” project by the
CNR (National Research Centre), led to a proposal for a new seismic classification
process. Therefore, in 1981 the national territory was classified in three seismic
categories. By means of apposite Ministerial Decrees, between 1981 and 1984, the
45% of the entire national territory has been classified and complied with specific
technical regulations. It is important to emphasize that the proposal by the CNR
involved for the first time a probabilistic approach to the issue of the seismic risk.
After the Puglia and Molise earthquake of 2002, the Prime Minister Ordinance n.
3274/2003 is enacted, which reclassified the whole country in four different hazard
zones, removing non-hazardous areas. Each seismic zone was identified according to
four different design bedrock acceleration values: 0.35 g, 0.25 g, 0.15 g and 0.05 g.
From this point on, no area of our country is excluded from the seismic classification.
Industrial buildings behavior during the Emilia earthquake
11
In parallel with the procedures for the seismic classification, the update of the technical
provisions on constructions took place with the Ministerial Decree 03/03/1975, which
laid the background for the latest Ministerial Decree 16/01/1996, later replaced by the
Ministerial Decree 14/09/2005. The most recent regulation step is the Ministerial
Decree 14/01/2008 (NTC 2008), which approves the new Italian technical standards
for buildings, which are nowadays compulsory in Italy.
It’s important to emphasize that the OPCM 3274/2003, binding from 23th October
2005, grant a transitory period of 18 months in which it was not mandatory to take into
account the new seismic classification, except for some facilities, such as strategic
buildings. Similarly, even the release of the DM 14/09/2005 allowed a transitional
period of 18 months in which it was possible to design “normal” structures according
the old buildings codes (Law n. 1086 05/11/1971 and Law n. 64 02/02/1974). This
explains why most of the buildings in the area affected by the earthquake were
inadequate from the point of view of seismic capacity.
Beyond the legislative inertia, another deep limit for precast buildings concerns the
slow understanding of their seismic behavior from a technical point of view. In fact,
specific indications for precast structures appeared for the first time in the DM
03/12/1987, which gave some indications for the design of the connections, especially
in seismic zones. Later, OPCM 3274/2003 provided more detailed design indications
for precast buildings, recognizing the important role of the connection in the whole
building static and dynamic behavior. Finally, the most recent technical Italian code
(NTC 2008), on the basis of the EC8 provisions for precast buildings, spend a large
section to the development of technical issues for these facilities. In particular,
confirmed the implication to use mechanical devices in the connections, in order to
transfer horizontal forces between structural elements (beam-to-column and roof-to-
beam connections). For the support of the beams, it is provided that only one end is
sliding: in this case, the support must be capable to absorb the relative horizontal
displacements. In any case, connections must be designed to absorb seismic forces
without considering the frictional contribute.
Based on the above, the Emilia territory struck by the earthquake was inserted in
seismic zone 3 only in 2003, according to the OPCM 3274/2003 provisions. However,
as already mentioned previously, this seismic zonation becomes mandatory only on 23
October 2005. Therefore, the high vulnerability shown by the industrial buildings
during the earthquake is related to the fact that constructions built until 2005 were not
designed to adequately adsorb seismic horizontal forces.

Seismic Behavior of RC Precast Buildings: The Case Of Emilia Earthquake
12
2.3 SEISMIC BEHAVIOR OF PRECAST FACILITIES
The piece of land affected by the earthquake is one of the most important centers of
industrial production of Italian territory. In the hit areas there were about 48.000
industrial facilities: the damaged buildings reported economic losses of more than 5
billion euros.
As previously cited, most of the damaged facilities were not designed according to
seismic criteria. As a matter of fact, the principal cause of collapse is linked to the
presence of connections unable to transfer horizontal forces. Therefore, the loss of
support of the tiles or beams caused the fall of them and the consequent building
collapse. Another critical issue is associate with the cladding panels breaking. The
principal cause of panel collapse is the lack of adequate connection devices between
panel and structure. The main damage reported by the precast columns was the loss of
verticality: this happened because of the lack of rigid constraint at the columns base.
Furthermore, the excessive brackets spacing in the critical zone, or the small diameter
of the bars, have resulted in the formation of plastic hinges.
As part of emergency operations carried out in the immediate post-earthquake, five
industrial buildings were inspected. The buildings in question, located in Mirandola
(MO) and Finale Emilia (MO), were realized between 1990 and 2011. They are typical
one-story industrial facilities, and have been designed and realized by the same precast
facilities construction company. Therefore, it’s clearly visible the same constructive
ideology, with the recurrent use of the same assemblage schemes. Except for the only
structure built in 2011, designed according to the NTC2008 indications, DM
16/01/1996 has been used in the design phase, and then the buildings appear to be
designed to support only vertical loads. Also wind effects are modeled as vertical
forces. The facility names adopted in the present thesis are the acronyms given
according to the building clients or owners. Therefore, in the following, the structures
will be referred to as A, D1, M, D2 and U (see Table 1) buildings.
Client/Owner Year of building Short name
adopted
ACEA - ARIES 1990 A
DI QUATTRO S.r.l. 1995 D1
IMMOBILIARE
MANTOVANI S.r.l. 2001 M
DI QUATTRO S.r.l. 2004 D2
UNIFER S.r.l. 2011 U
Table 1 - Case study buildings: clients and years of construction.
Industrial buildings behavior during the Emilia earthquake
13
For each building it was possible to get the final design reports. Thus, the starting point
of the present study is represented by the building design report analysis, consisting in
calculation reports and graphic designs. Furthermore, a photographic archive has been
made, with the photos taken immediately after the first main shock (20th May 2012).
Photos were taken during the buildings inspection phase, made as part of emergency
relief operations guided by DPC (Civil Protection Department).
In the present chapter the D1 and D2 buildings are not described. In fact, they are
assumed as benchmark facilities and will be deeply analyzed in a separate chapter of
this thesis. Here it is merely stated that D2 building is, among the above-mentioned
buildings, the one that suffered the heavier damage. In fact it reported the partial
collapse due to the breakdown of two central columns. In contrast, for D1 building,
even if older than D2 and located in its vicinity, only light damage was reported.
2.3.1 A BUILDING (ACEA-ARIES)
A building is a single story precast facility constructed in 1990 in Mirandola (MO). It is
the oldest among the inspected facilities. It is characterized by 50 x 120 meters
rectangular plan. The structural building scheme is composed by seven column rows in
the transverse direction, 20 m spaced, and six column rows spaced 10 m in the
orthogonal direction. Columns have 50x50 square cross sections, or 40x50 rectangular
cross sections. The columns total height is 7.3 m. Warping in the major direction is
realized by double slope beams (Figure 4). In the transversal direction, the building
scheme is completed by secondary girders and Greek-pi tiles. The structure is closed
with vertical precast panels 8.9 m height. As shown in Figure 5, the building is
internally divided by means of masonry infill walls. The foundation system is
constituted by discrete socket foundations.
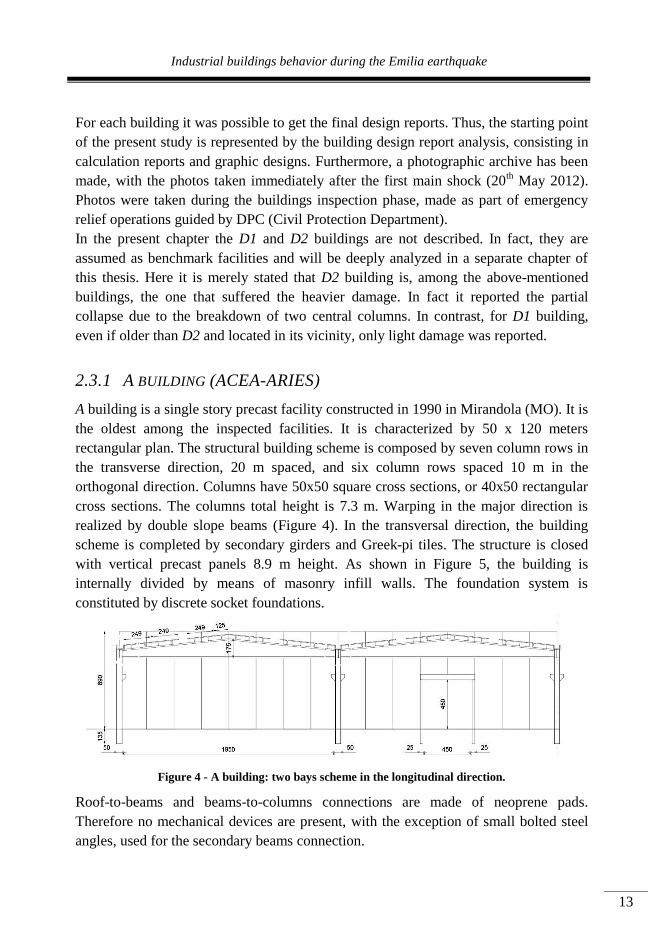
Figure 4 - A building: two bays scheme in the longitudinal direction.
Roof-to-beams and beams-to-columns connections are made of neoprene pads.
Therefore no mechanical devices are present, with the exception of small bolted steel
angles, used for the secondary beams connection.

Seismic Behavior of RC Precast Buildings: The Case Of Emilia Earthquake
14
(a)
(b)
(c)
Figure 5 – A building: main area view (a); vertical cladding panels (b); masonry infill wall (c).
The damage suffered by the A building concerns the loss of support of tiles and beams
and their falling, the loss of verticality of the columns, the development of plastic
hinges at the column bases, the break of some portions of the masonry infill walls
(Figure 6). As reported in (Magliulo et al., 2014; Belleri et al., 2014), the damage
correlated to the structural elements loss of support is to associate with the lack of
mechanical devices between the elements. In the case of A building, the loss of support
caused the tiles falling, emphasizing the extreme inadequacy of pure frictional
connections (Figure 6 (a)). The loss of verticality (Figure 6(b)) has to be associated
with an inappropriate foundation element design. Generally, the column-foundation
connection real behavior is not really clear (Canha et al., 2009). In this case the
foundation elements design has been probably conducted considering design practices
rather than accurate models. The development of plastic hinges at the column bases
(Figure 6(c))is certainly due to the elevate stirrups spacing in the embedded column
portions and in the relative critical zones. The collapse of masonry infill walls (Figure
6(d))and the falling of non-structural elements such as metal storage shelves caused
several injures, as well as the facilities condemn. In the present case, as is possible to
see in Figure 6(a), the shelves suffered the overturning because of the lack of
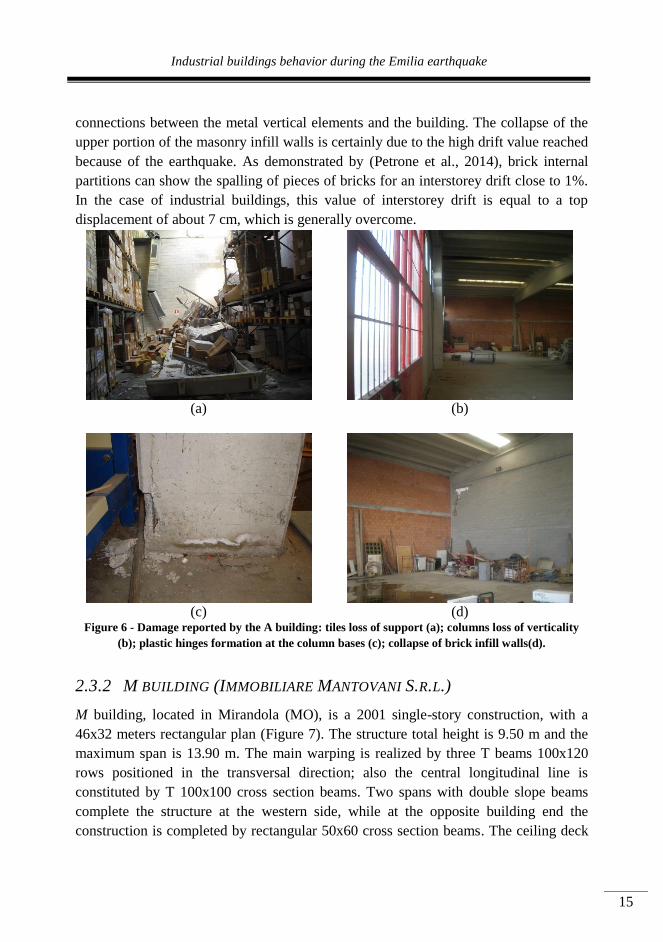
Industrial buildings behavior during the Emilia earthquake
15
connections between the metal vertical elements and the building. The collapse of the
upper portion of the masonry infill walls is certainly due to the high drift value reached
because of the earthquake. As demonstrated by (Petrone et al., 2014), brick internal
partitions can show the spalling of pieces of bricks for an interstorey drift close to 1%.
In the case of industrial buildings, this value of interstorey drift is equal to a top
displacement of about 7 cm, which is generally overcome.
(a)
(b)
(c)
(d)
Figure 6 - Damage reported by the A building: tiles loss of support (a); columns loss of verticality
(b); plastic hinges formation at the column bases (c); collapse of brick infill walls(d).
2.3.2 M BUILDING (IMMOBILIARE MANTOVANI S.R.L.)
M building, located in Mirandola (MO), is a 2001 single-story construction, with a
46x32 meters rectangular plan (Figure 7). The structure total height is 9.50 m and the
maximum span is 13.90 m. The main warping is realized by three T beams 100x120
rows positioned in the transversal direction; also the central longitudinal line is
constituted by T 100x100 cross section beams. Two spans with double slope beams
complete the structure at the western side, while at the opposite building end the
construction is completed by rectangular 50x60 cross section beams. The ceiling deck
Seismic Behavior of RC Precast Buildings: The Case Of Emilia Earthquake
16
is composed by concrete shed roof. The external structural envelope is granted by
horizontal cladding panels, linked to the main structure by means of metal anchors.
The beams are supported by 50x70 or 50x50 cm cross section columns, arranged in
three rows and filled in discrete socket foundations. Beam-to-beam and beam-to-
column connections are realized by means of neoprene pads and steel rods. As could
be seen in the design graphic documents, steel rods have a purely constructive function
rather than structural. In fact, they are designed considering the load condition that
occurs during the assembly phase. Tiles-to-beams connections are purely frictional and
the resistance to horizontal forces is delivered to the friction between concrete and
neoprene surfaces.
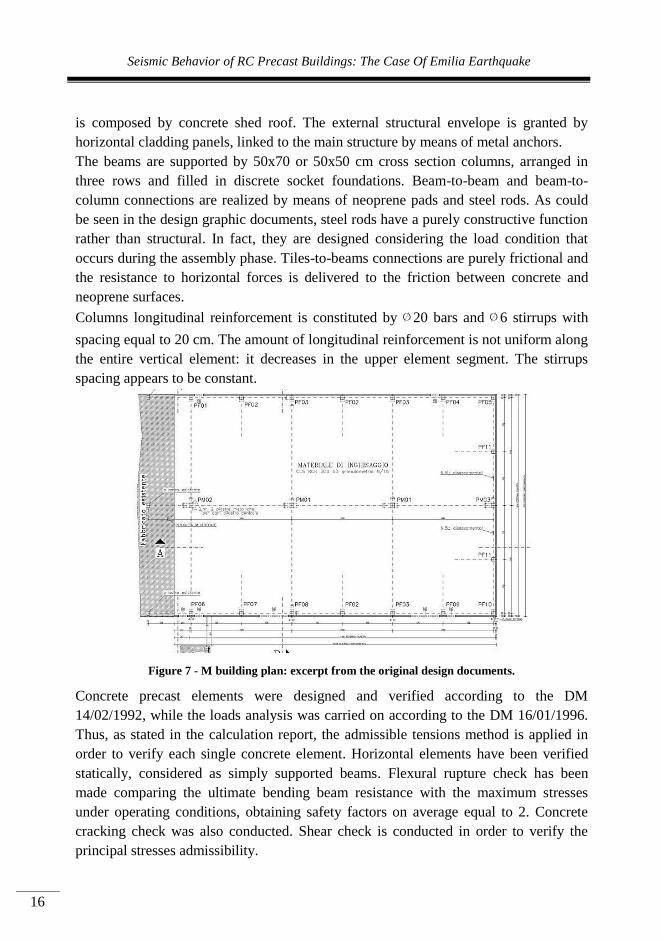
Columns longitudinal reinforcement is constituted by ∅20 bars and ∅6 stirrups with
spacing equal to 20 cm. The amount of longitudinal reinforcement is not uniform along
the entire vertical element: it decreases in the upper element segment. The stirrups
spacing appears to be constant.
Figure 7 - M building plan: excerpt from the original design documents.
Concrete precast elements were designed and verified according to the DM
14/02/1992, while the loads analysis was carried on according to the DM 16/01/1996.
Thus, as stated in the calculation report, the admissible tensions method is applied in
order to verify each single concrete element. Horizontal elements have been verified
statically, considered as simply supported beams. Flexural rupture check has been
made comparing the ultimate bending beam resistance with the maximum stresses
under operating conditions, obtaining safety factors on average equal to 2. Concrete
cracking check was also conducted. Shear check is conducted in order to verify the
principal stresses admissibility.

Industrial buildings behavior during the Emilia earthquake
17
Columns design has been conducted in a more refined way considering a global
building model by means of WinStrand software. In particular, 13 load conditions have
been considered, for a total of 31 load combinations. Wind action is considered
horizontally acting. However, columns check has been conducted according to the
admissible tensions method.
An important consideration deals with the presence, in the finite elements model, of the
crane supporting beams. The crane is taken in account exclusively through its
reactions. The concrete corbels have also been verified through strut-and-tie model. It
is not reported any information about the design of the socket foundation.
The principal damage suffered by the building because of the earthquake is the
formation of plastic hinges at the column bases for the central rows (Figure 8(a)(b)).
The latter are the most stressed because they have to support the greater roof portion.
Also in this case, the development of plastic hinges is due to the high stirrups spacing
in the columns critical zones. From the technical reports is possible to assess that the
columns stirrups spacing show a reduction in the top extremities or in correspondence
with the concrete corbels. Another damage suffered by the building is the breaking of
the masonry infill walls (Figure 8). Generally, the drift values reached during the
earthquakes in this type of building overcome the infill wall resistance, causing in
plane and out-of-plane walls mechanisms. In the present case, breaking of masonry
infill walls happened because of the pounding of the crane support steel beams, as is
possible to observe in Figure 8 (b).
(a)
(b)
Seismic Behavior of RC Precast Buildings: The Case Of Emilia Earthquake
18
(c)
(d)
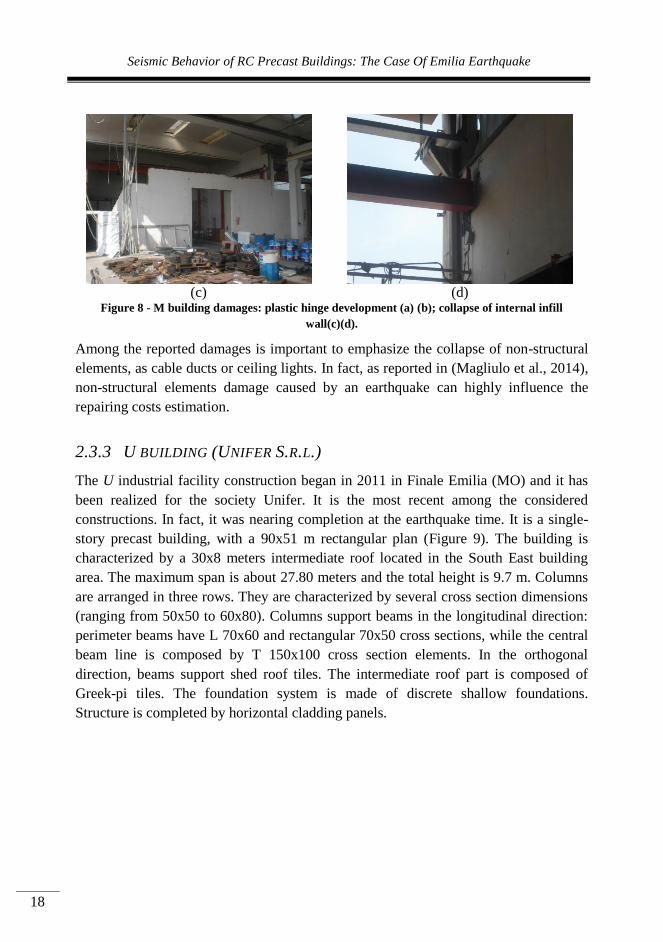
Figure 8 - M building damages: plastic hinge development (a) (b); collapse of internal infill
wall(c)(d).
Among the reported damages is important to emphasize the collapse of non-structural
elements, as cable ducts or ceiling lights. In fact, as reported in (Magliulo et al., 2014),
non-structural elements damage caused by an earthquake can highly influence the
repairing costs estimation.
2.3.3 U BUILDING (UNIFER S.R.L.)
The U industrial facility construction began in 2011 in Finale Emilia (MO) and it has
been realized for the society Unifer. It is the most recent among the considered
constructions. In fact, it was nearing completion at the earthquake time. It is a single-
story precast building, with a 90x51 m rectangular plan (Figure 9). The building is
characterized by a 30x8 meters intermediate roof located in the South East building
area. The maximum span is about 27.80 meters and the total height is 9.7 m. Columns
are arranged in three rows. They are characterized by several cross section dimensions
(ranging from 50x50 to 60x80). Columns support beams in the longitudinal direction:
perimeter beams have L 70x60 and rectangular 70x50 cross sections, while the central
beam line is composed by T 150x100 cross section elements. In the orthogonal
direction, beams support shed roof tiles. The intermediate roof part is composed of
Greek-pi tiles. The foundation system is made of discrete shallow foundations.
Structure is completed by horizontal cladding panels.
Industrial buildings behavior during the Emilia earthquake
19
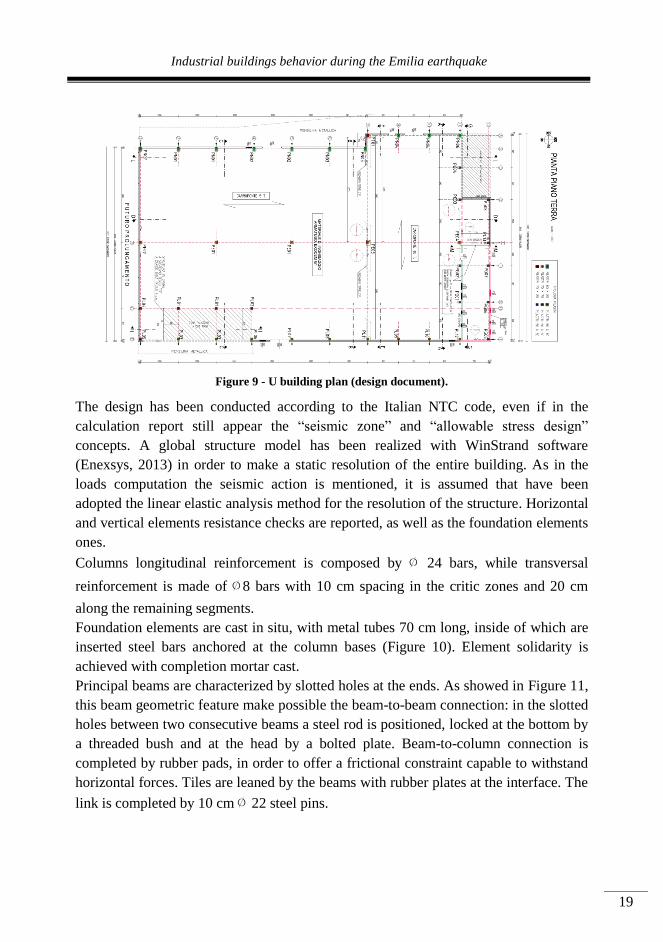
Figure 9 - U building plan (design document).
The design has been conducted according to the Italian NTC code, even if in the
calculation report still appear the “seismic zone” and “allowable stress design”
concepts. A global structure model has been realized with WinStrand software
(Enexsys, 2013) in order to make a static resolution of the entire building. As in the
loads computation the seismic action is mentioned, it is assumed that have been
adopted the linear elastic analysis method for the resolution of the structure. Horizontal
and vertical elements resistance checks are reported, as well as the foundation elements
ones.
Columns longitudinal reinforcement is composed by ∅ 24 bars, while transversal
reinforcement is made of ∅8 bars with 10 cm spacing in the critic zones and 20 cm
along the remaining segments.
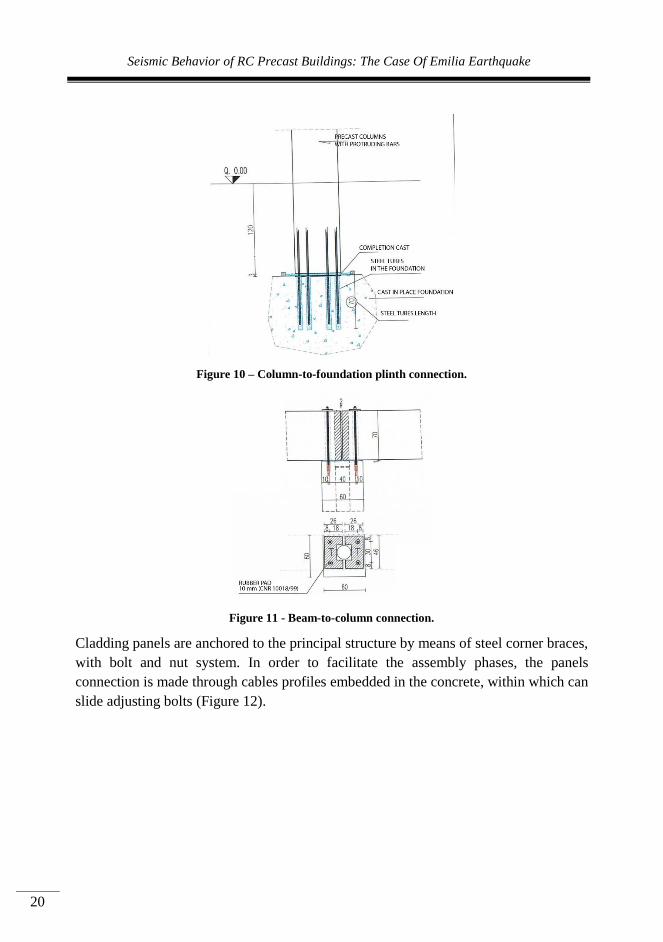
Foundation elements are cast in situ, with metal tubes 70 cm long, inside of which are
inserted steel bars anchored at the column bases (Figure 10). Element solidarity is
achieved with completion mortar cast.
Principal beams are characterized by slotted holes at the ends. As showed in Figure 11,
this beam geometric feature make possible the beam-to-beam connection: in the slotted
holes between two consecutive beams a steel rod is positioned, locked at the bottom by
a threaded bush and at the head by a bolted plate. Beam-to-column connection is
completed by rubber pads, in order to offer a frictional constraint capable to withstand
horizontal forces. Tiles are leaned by the beams with rubber plates at the interface. The
link is completed by 10 cm ∅ 22 steel pins.
Seismic Behavior of RC Precast Buildings: The Case Of Emilia Earthquake
20
Figure 10 – Column-to-foundation plinth connection.
Figure 11 - Beam-to-column connection.
Cladding panels are anchored to the principal structure by means of steel corner braces,
with bolt and nut system. In order to facilitate the assembly phases, the panels
connection is made through cables profiles embedded in the concrete, within which can
slide adjusting bolts (Figure 12).
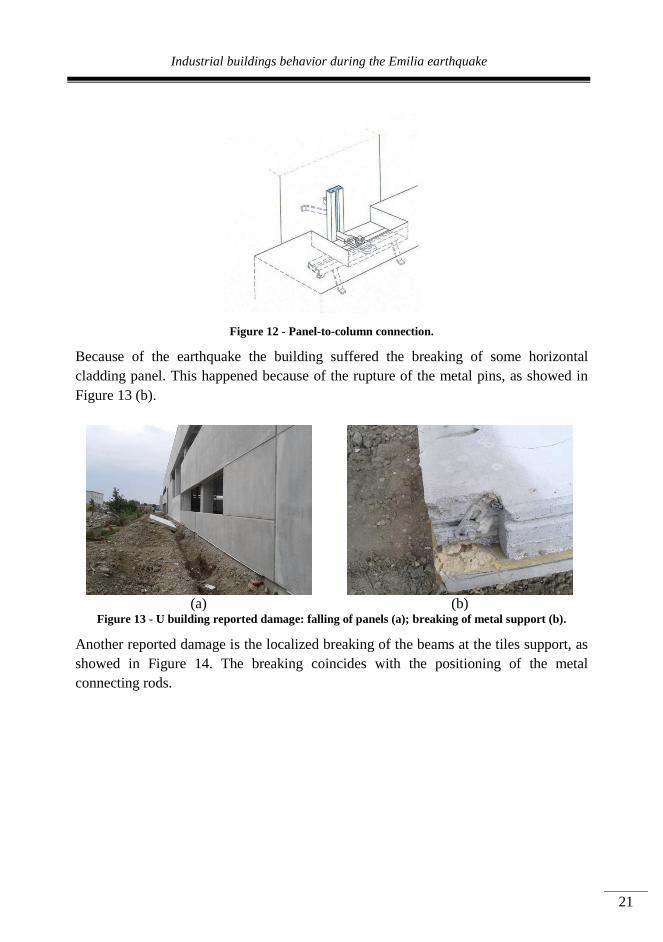
Industrial buildings behavior during the Emilia earthquake
21
Figure 12 - Panel-to-column connection.
Because of the earthquake the building suffered the breaking of some horizontal
cladding panel. This happened because of the rupture of the metal pins, as showed in
Figure 13 (b).
(a)
(b)
Figure 13 - U building reported damage: falling of panels (a); breaking of metal support (b).
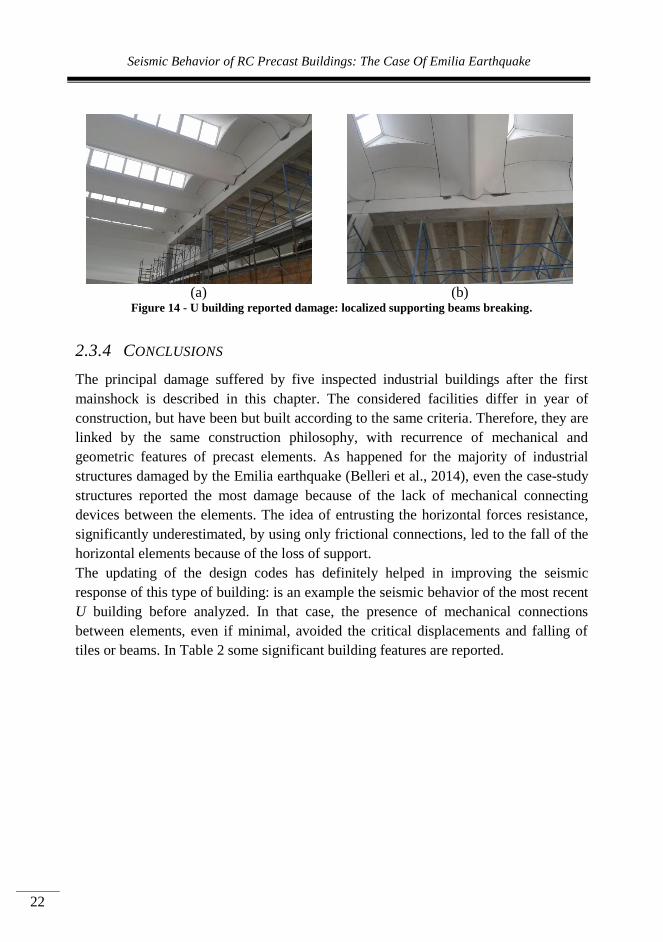
Another reported damage is the localized breaking of the beams at the tiles support, as
showed in Figure 14. The breaking coincides with the positioning of the metal
connecting rods.
Seismic Behavior of RC Precast Buildings: The Case Of Emilia Earthquake
22
(a)
(b)
Figure 14 - U building reported damage: localized supporting beams breaking.
2.3.4 CONCLUSIONS
The principal damage suffered by five inspected industrial buildings after the first
mainshock is described in this chapter. The considered facilities differ in year of
construction, but have been but built according to the same criteria. Therefore, they are
linked by the same construction philosophy, with recurrence of mechanical and
geometric features of precast elements. As happened for the majority of industrial
structures damaged by the Emilia earthquake (Belleri et al., 2014), even the case-study
structures reported the most damage because of the lack of mechanical connecting
devices between the elements. The idea of entrusting the horizontal forces resistance,
significantly underestimated, by using only frictional connections, led to the fall of the
horizontal elements because of the loss of support.
The updating of the design codes has definitely helped in improving the seismic
response of this type of building: is an example the seismic behavior of the most recent
U building before analyzed. In that case, the presence of mechanical connections
between elements, even if minimal, avoided the critical displacements and falling of
tiles or beams. In Table 2 some significant building features are reported.

Industrial buildings behavior during the Emilia earthquake
23
BUILDING
ACRONYM
DISTANCE FROM
EPICENTRE
[Km]
PLAN
DIMENSIONS [m x m]
HEIGHT
[m]
GEOMETRICAL REINFORCEMENT
RATIO
[maximum value]
COLUMNS
TRANSVERSAL REINFORCEMENT
A 15 50x120 7.3 0.008 ∅6/20
D1 15 50x20 7 0.008 ∅6/20
M 15 46x32 9.5 0.008 ∅6/20
D2 15 90x45 8 0.008 ∅6/20
U 8 93x51 9.7 0.011 ∅8/10
Table 2 - Inspected structures features.
Although the U building is the closest to the epicenter, it reported the slightest damage
among the analyzed structures. This is certainly to be attributed to the improved
structural design of the building, from a seismic point of view. First, it must be
emphasized the presence of mechanical devices between the elements. This avoided
damages due to excessive displacements, as happened for the other considered
structures. In addition, the presence of transverse reinforcement with adequate diameter
and spacing, implemented the column shear strength. Falling of horizontal cladding
panels, one of the main problems encountered in the industrial structures in Emilia hit
by the earthquake, demonstrates how, during the building design phase, it didn’t exist
an adequate model to check the panels anchorage system seismic behavior.
2.3.5 REFERENCES
Belleri A, Brunesi E, Nascimbene R, Pagani M, Riva P (2014) Seismic performance of
precast industrial facilities following major earthquakes in the Italian territory.
Journal of Performance of Constructed Facilities
Bordoni P, Azzara RM, Cara F, Cogliano R, Cultrera G, Di Giulio G, Fodarella A,
Milana G, Pucillo S, Riccio G (2012) Preliminary results from EMERSITO, a
rapid response network for site-effect studies. Annals of Geophysics 55 (4)
Canha RMF, Ebeling EB, de Cresce El ALH, El Debs MK (2009) Analysing the base
of precast column in socket foundations with smooth interfaces. Materials and
structures 42 (6):725-737
CS.LL.PP. (2008) DM 14 Gennaio 2008: Norme tecniche per le costruzioni. vol 29.
Gazzetta Ufficiale della Repubblica Italiana,
Enexsys (2013) WinStrand Structural Analysis & Design, Manuale teorico e d’uso.
Magliulo G, Ercolino M, Petrone C, Coppola O, Manfredi G (2014) The Emilia
Earthquake: Seismic Performance of Precast Reinforced Concrete Buildings.
Earthquake Spectra 30 (2):891-912. doi:doi:10.1193/091012EQS285M

Seismic Behavior of RC Precast Buildings: The Case Of Emilia Earthquake
24
Meletti C, D'Amico V, Ameri G, Rovida A, Stucchi M (2012) Seismic hazard in the Po
Plain and the 2012 Emilia earthquakes. Annals of Geophysics 55 (4)
Petrone C, Magliulo G, Manfredi G (2014) Shake table tests for the seismic assessment
of hollow brick internal partitions. Engineering Structures 72:203-214
Priolo E, Romanelli M, Barnaba C, Mucciarelli M, Laurenzano G, Dall'Olio L, Zeid
NA, Caputo R, Santarato G, Vignola L (2012) The Ferrara thrust earthquakes
of May-June 2012: preliminary site response analysis at the sites of the OGS
temporary network. Annals of Geophysics 55 (4)

Industrial buildings behavior during the Emilia earthquake
25
Seismic Behavior of RC Precast Buildings: The Case Of Emilia Earthquake
26
Chapter 3 ANALYSIS OF THE SEISMIC
PERFORMANCE OF TWO INDUSTRIAL
BUILDINGS
This chapter focuses on the main objectives of the thesis. Following what described in
the previous chapter, it is enriched with the in-depth description of two structures
considered as case study buildings. From the group of industrial facilities previously
described, the remaining buildings are therefore considered, with the objective to find
out the principal reasons for their actual seismic behavior. Section 3.1 deals with the
careful description of the first case study, from the territorial context to the detailed
description of the main structural elements. The considered building is the principal
case-study example, because it reported the heaviest damage among the whole
considered structures. In Section 3.2 the description of the real damages suffered by the
building is reported with the support of photographs taken shortly after the first
mainshock. Photos show the partial collapse of the facility, due to the braking of two
central columns. In Section 3.3 the structure numerical model implementation is
described. The building is modeled in OpenSees, with two important goals:
a. Apply the most refined methods of analysis indicated by the Italian technical
standards, in order to verify the seismic behavior of the building from a
regulatory point of view;
b. Test a numerical model in terms of the prediction of the real building behavior.
Therefore, a tridimensional building model is realized, characterized by
unidimensional beam elements. Also the geometrical eccentricities are taken into
account. For the definition of the plastic hinge behavior, a simple tool is presented in
Section 3.3.1. Section 3.4 deals with the nonlinear analysis methods allowed by the
Italian code, useful to evaluate the seismic performance of existing buildings. The first
analysis method presented in Section 3.4.1 is the nonlinear static one. Because of the
hypothesis of rigid diaphragm cannot be assumed, particular attention has been given
in the displacement control point selection. In Section 3.4.2 nonlinear dynamic analysis
is presented. The goal to pursuit is the check, after each analysis, of both fragile and
Analysis of the seismic performance of two industrial buildings
27
ductile mechanism. Thus, in Section 3.5 capacity models are presented: in Section
3.5.1 the shear capacity formulas adopted in the present study are described. In
particular, Sezen and Mohele formulas and Biskinis shear resistance relationships are
presented. Finally, a further shear strength value is obtained by means of the software
Response2000, based on the Vecchio and Collins “Modified Compression Field
Theory”. In Sections 3.5.2 and 3.5.3 the connections and rotations capacity models are
described. Section 3.6 concerns the great results presentation phase. All the obtained
results are described and compared between the different analysis methods. In Section
3.7 the model validation has been carried out: the comparison between theoretical and
experimental building performance is made in order to get an assessment on the
modeling performed. In fact, in Section 3.8 the damage prediction is described: with
the try to compare the model behavior with the real building performance exhibited
during the Emilia earthquake. Section 3.9 deals with the description of the second
important case-study facility. This industrial building, even if have been built out ten
years earlier than the above-mentioned one, has suffered minor damage because of the
earthquake. Nonlinear dynamic analyses have been performed in order to verify one
more time the accuracy of the adopted numerical modeling issues.
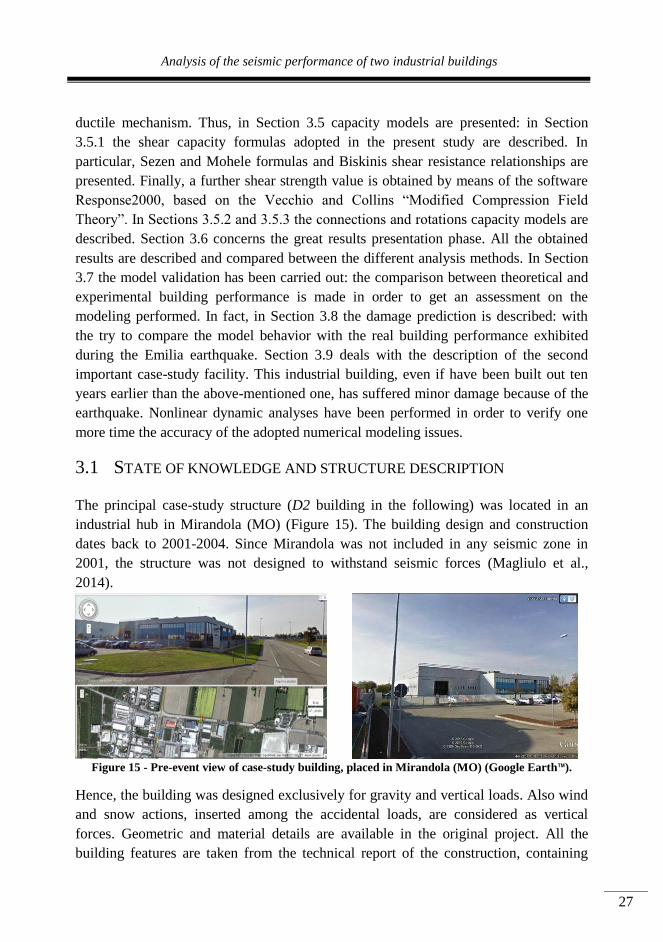
3.1 STATE OF KNOWLEDGE AND STRUCTURE DESCRIPTION
The principal case-study structure (D2 building in the following) was located in an
industrial hub in Mirandola (MO) (Figure 15). The building design and construction
dates back to 2001-2004. Since Mirandola was not included in any seismic zone in
2001, the structure was not designed to withstand seismic forces (Magliulo et al.,
2014).
Figure 15 - Pre-event view of case-study building, placed in Mirandola (MO) (Google Earth™).
Hence, the building was designed exclusively for gravity and vertical loads. Also wind
and snow actions, inserted among the accidental loads, are considered as vertical
forces. Geometric and material details are available in the original project. All the
building features are taken from the technical report of the construction, containing
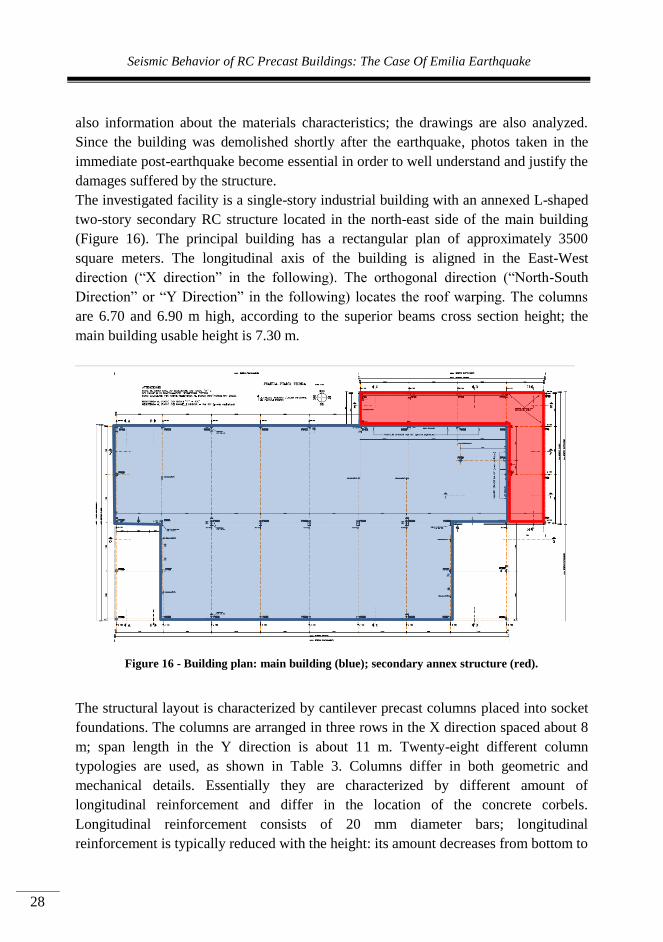
Seismic Behavior of RC Precast Buildings: The Case Of Emilia Earthquake
28
also information about the materials characteristics; the drawings are also analyzed.
Since the building was demolished shortly after the earthquake, photos taken in the
immediate post-earthquake become essential in order to well understand and justify the
damages suffered by the structure.
The investigated facility is a single-story industrial building with an annexed L-shaped
two-story secondary RC structure located in the north-east side of the main building
(Figure 16). The principal building has a rectangular plan of approximately 3500
square meters. The longitudinal axis of the building is aligned in the East-West
direction (“X direction” in the following). The orthogonal direction (“North-South
Direction” or “Y Direction” in the following) locates the roof warping. The columns
are 6.70 and 6.90 m high, according to the superior beams cross section height; the
main building usable height is 7.30 m.
Figure 16 - Building plan: main building (blue); secondary annex structure (red).
The structural layout is characterized by cantilever precast columns placed into socket
foundations. The columns are arranged in three rows in the X direction spaced about 8
m; span length in the Y direction is about 11 m. Twenty-eight different column
typologies are used, as shown in Table 3. Columns differ in both geometric and
mechanical details. Essentially they are characterized by different amount of
longitudinal reinforcement and differ in the location of the concrete corbels.
Longitudinal reinforcement consists of 20 mm diameter bars; longitudinal
reinforcement is typically reduced with the height: its amount decreases from bottom to

Analysis of the seismic performance of two industrial buildings
29
top. Transverse reinforcement is made of 8 mm diameter stirrups spaced each 200 mm
in the central part of the column and 50 mm at the top. All the stirrups are closed with
90-degree end hooks. In Table 3 for each column type some important geometric
features are reported: is the longitudinal tension reinforcement, while and are
respectively the geometrical and mechanical reinforcement ratio. Columns are
connected at the top by prestressed rectangular-shaped beams. These principal beams
act as the support for the roof. Secondary beams, the ones which connect the two-story
annex building, are characterized by L-shaped and inverted T-shaped cross sections.
Beam-to-column connection is assured through slotted holes at the end of the beams
where steel rods are allocated (Figure 17). The steel rods are important also to realize
beam-to-beam connections: in the slotted holes between two consecutive beams a steel
rod is positioned, locked at the bottom by a threaded bush and at the head by a bolted
plate. An integrative concrete casting should assure the monolithic nature of the joint.
However the integrative mortar is not visible from the pictures and the joint behavior is
supposed to be absolutely frictional.
Figure 17 - Beam-to-beam connection.
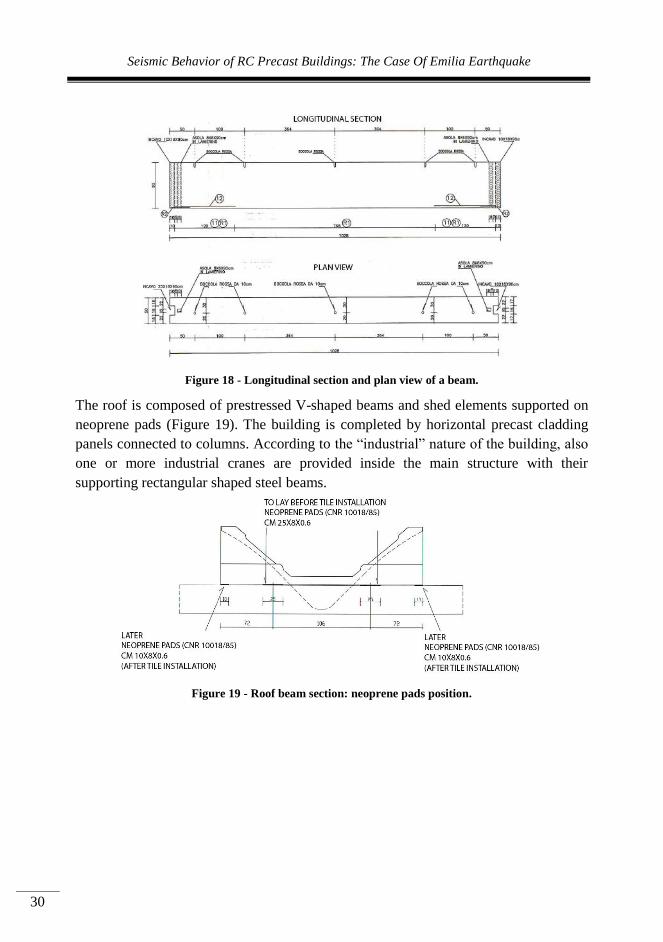
Seismic Behavior of RC Precast Buildings: The Case Of Emilia Earthquake
30
Figure 18 - Longitudinal section and plan view of a beam.
The roof is composed of prestressed V-shaped beams and shed elements supported on
neoprene pads (Figure 19). The building is completed by horizontal precast cladding
panels connected to columns. According to the “industrial” nature of the building, also
one or more industrial cranes are provided inside the main structure with their
supporting rectangular shaped steel beams.
Figure 19 - Roof beam section: neoprene pads position.
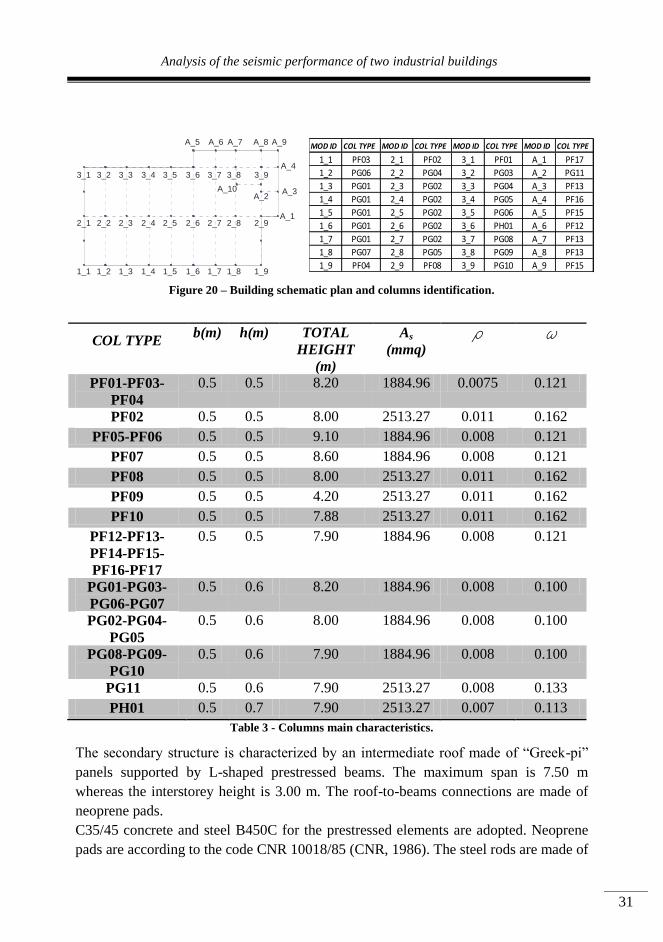
Analysis of the seismic performance of two industrial buildings
31
Figure 20 – Building schematic plan and columns identification.
COL TYPE b(m) h(m) TOTAL
HEIGHT
(m)
As
(mmq) r w
PF01-PF03-
PF04
0.5 0.5 8.20 1884.96 0.0075 0.121
PF02 0.5 0.5 8.00 2513.27 0.011 0.162
PF05-PF06 0.5 0.5 9.10 1884.96 0.008 0.121
PF07 0.5 0.5 8.60 1884.96 0.008 0.121
PF08 0.5 0.5 8.00 2513.27 0.011 0.162
PF09 0.5 0.5 4.20 2513.27 0.011 0.162
PF10 0.5 0.5 7.88 2513.27 0.011 0.162
PF12-PF13-
PF14-PF15-
PF16-PF17
0.5 0.5 7.90 1884.96 0.008 0.121
PG01-PG03-
PG06-PG07
0.5 0.6 8.20 1884.96 0.008 0.100
PG02-PG04-
PG05
0.5 0.6 8.00 1884.96 0.008 0.100
PG08-PG09-
PG10
0.5 0.6 7.90 1884.96 0.008 0.100
PG11 0.5 0.6 7.90 2513.27 0.008 0.133
PH01 0.5 0.7 7.90 2513.27 0.007 0.113
Table 3 - Columns main characteristics.
The secondary structure is characterized by an intermediate roof made of “Greek-pi”
panels supported by L-shaped prestressed beams. The maximum span is 7.50 m
whereas the interstorey height is 3.00 m. The roof-to-beams connections are made of
neoprene pads.
C35/45 concrete and steel B450C for the prestressed elements are adopted. Neoprene
pads are according to the code CNR 10018/85 (CNR, 1986). The steel rods are made of
1_1 1_2 1_3 1_4 1_5 1_6 1_7 1_8 1_9
2_1 2_2 2_3 2_4 2_5 2_6 2_7 2_8 2_9
3_1 3_2 3_3 3_4 3_5 3_6 3_7 3_8 3_9
A_5 A_6 A_7 A_8 A_9
A_1
A_2A_3
A_4
A_10
MOD ID COL TYPE MOD ID COL TYPE MOD ID COL TYPE MOD ID COL TYPE
1_1 PF03 2_1 PF02 3_1 PF01 A_1 PF17
1_2 PG06 2_2 PG04 3_2 PG03 A_2 PG11
1_3 PG01 2_3 PG02 3_3 PG04 A_3 PF13
1_4 PG01 2_4 PG02 3_4 PG05 A_4 PF16
1_5 PG01 2_5 PG02 3_5 PG06 A_5 PF15
1_6 PG01 2_6 PG02 3_6 PH01 A_6 PF12
1_7 PG01 2_7 PG02 3_7 PG08 A_7 PF13
1_8 PG07 2_8 PG05 3_8 PG09 A_8 PF13
1_9 PF04 2_9 PF08 3_9 PG10 A_9 PF15
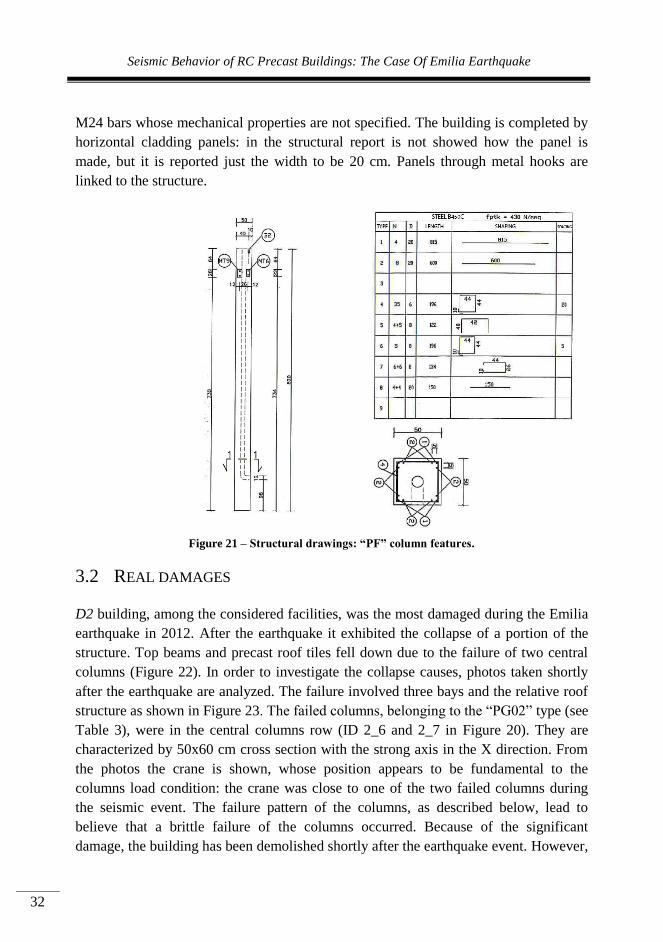
Seismic Behavior of RC Precast Buildings: The Case Of Emilia Earthquake
32
M24 bars whose mechanical properties are not specified. The building is completed by
horizontal cladding panels: in the structural report is not showed how the panel is
made, but it is reported just the width to be 20 cm. Panels through metal hooks are
linked to the structure.
Figure 21 – Structural drawings: “PF” column features.
3.2 REAL DAMAGES
D2 building, among the considered facilities, was the most damaged during the Emilia
earthquake in 2012. After the earthquake it exhibited the collapse of a portion of the
structure. Top beams and precast roof tiles fell down due to the failure of two central
columns (Figure 22). In order to investigate the collapse causes, photos taken shortly
after the earthquake are analyzed. The failure involved three bays and the relative roof
structure as shown in Figure 23. The failed columns, belonging to the “PG02” type (see
Table 3), were in the central columns row (ID 2_6 and 2_7 in Figure 20). They are
characterized by 50x60 cm cross section with the strong axis in the X direction. From
the photos the crane is shown, whose position appears to be fundamental to the
columns load condition: the crane was close to one of the two failed columns during
the seismic event. The failure pattern of the columns, as described below, lead to
believe that a brittle failure of the columns occurred. Because of the significant
damage, the building has been demolished shortly after the earthquake event. However,
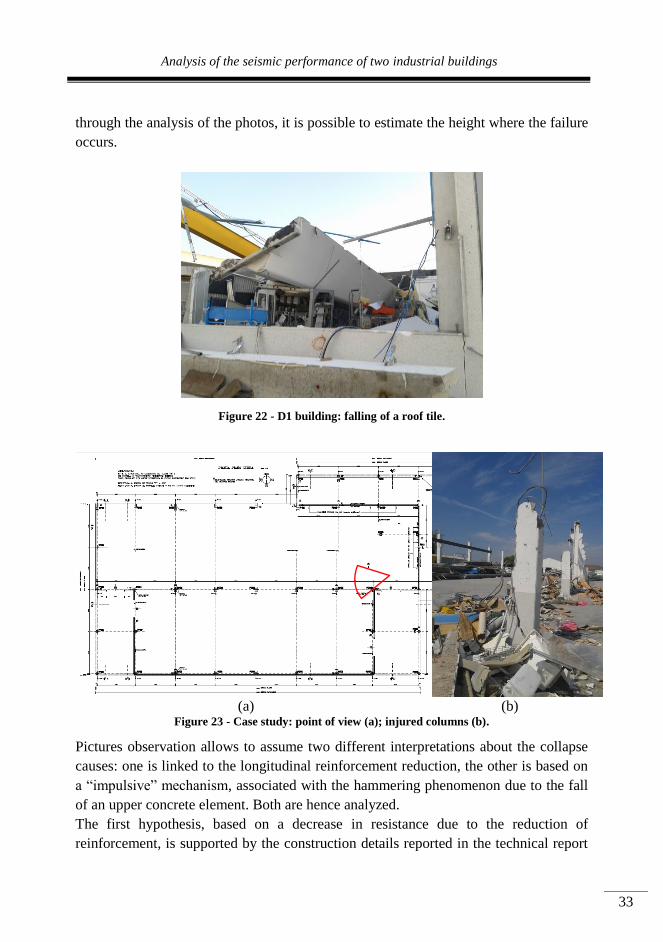
Analysis of the seismic performance of two industrial buildings
33
through the analysis of the photos, it is possible to estimate the height where the failure
occurs.
Figure 22 - D1 building: falling of a roof tile.
(a)
(b) Figure 23 - Case study: point of view (a); injured columns (b).
Pictures observation allows to assume two different interpretations about the collapse
causes: one is linked to the longitudinal reinforcement reduction, the other is based on
a “impulsive” mechanism, associated with the hammering phenomenon due to the fall
of an upper concrete element. Both are hence analyzed.
The first hypothesis, based on a decrease in resistance due to the reduction of
reinforcement, is supported by the construction details reported in the technical report
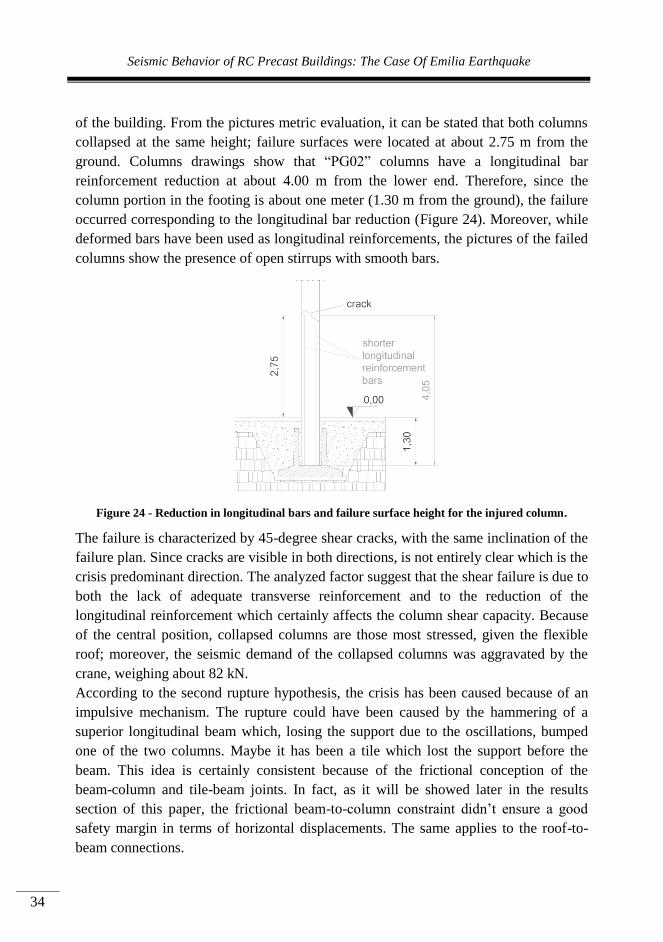
Seismic Behavior of RC Precast Buildings: The Case Of Emilia Earthquake
34
of the building. From the pictures metric evaluation, it can be stated that both columns
collapsed at the same height; failure surfaces were located at about 2.75 m from the
ground. Columns drawings show that “PG02” columns have a longitudinal bar
reinforcement reduction at about 4.00 m from the lower end. Therefore, since the
column portion in the footing is about one meter (1.30 m from the ground), the failure
occurred corresponding to the longitudinal bar reduction (Figure 24). Moreover, while
deformed bars have been used as longitudinal reinforcements, the pictures of the failed
columns show the presence of open stirrups with smooth bars.
Figure 24 - Reduction in longitudinal bars and failure surface height for the injured column.
The failure is characterized by 45-degree shear cracks, with the same inclination of the
failure plan. Since cracks are visible in both directions, is not entirely clear which is the
crisis predominant direction. The analyzed factor suggest that the shear failure is due to
both the lack of adequate transverse reinforcement and to the reduction of the
longitudinal reinforcement which certainly affects the column shear capacity. Because
of the central position, collapsed columns are those most stressed, given the flexible
roof; moreover, the seismic demand of the collapsed columns was aggravated by the
crane, weighing about 82 kN.
According to the second rupture hypothesis, the crisis has been caused because of an
impulsive mechanism. The rupture could have been caused by the hammering of a
superior longitudinal beam which, losing the support due to the oscillations, bumped
one of the two columns. Maybe it has been a tile which lost the support before the
beam. This idea is certainly consistent because of the frictional conception of the
beam-column and tile-beam joints. In fact, as it will be showed later in the results
section of this paper, the frictional beam-to-column constraint didn’t ensure a good
safety margin in terms of horizontal displacements. The same applies to the roof-to-
beam connections.
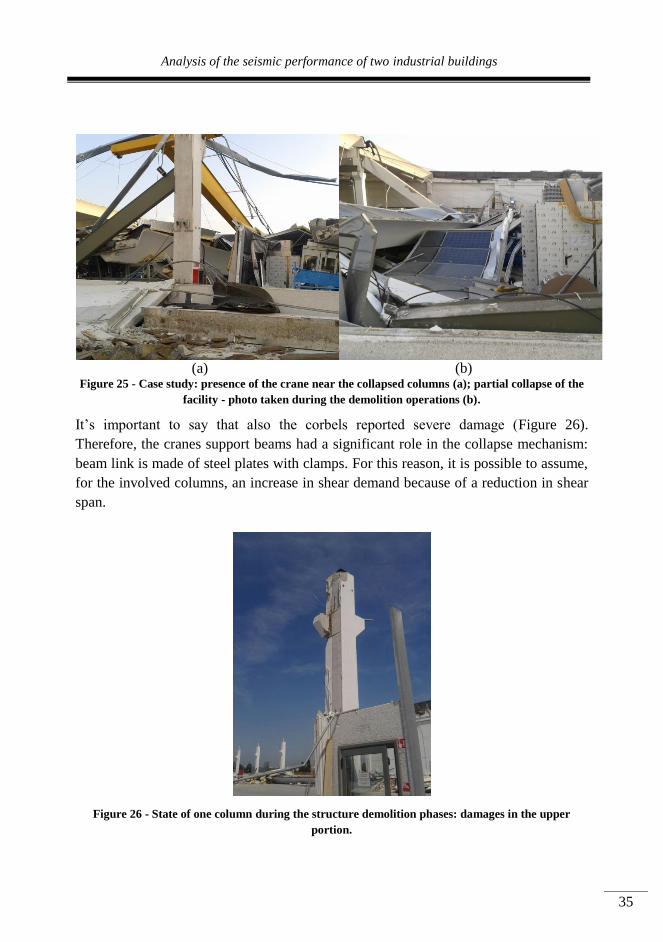
Analysis of the seismic performance of two industrial buildings
35
(a)
(b)
Figure 25 - Case study: presence of the crane near the collapsed columns (a); partial collapse of the
facility - photo taken during the demolition operations (b).
It’s important to say that also the corbels reported severe damage (Figure 26).
Therefore, the cranes support beams had a significant role in the collapse mechanism:
beam link is made of steel plates with clamps. For this reason, it is possible to assume,
for the involved columns, an increase in shear demand because of a reduction in shear
span.
Figure 26 - State of one column during the structure demolition phases: damages in the upper
portion.
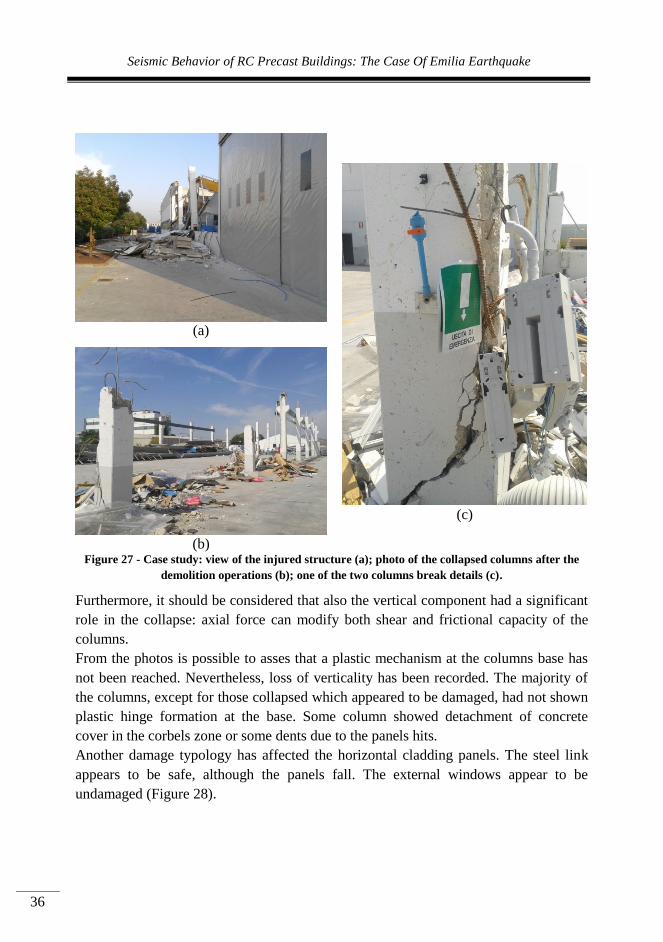
Seismic Behavior of RC Precast Buildings: The Case Of Emilia Earthquake
36
(a)
(c)
(b)
Figure 27 - Case study: view of the injured structure (a); photo of the collapsed columns after the
demolition operations (b); one of the two columns break details (c).
Furthermore, it should be considered that also the vertical component had a significant
role in the collapse: axial force can modify both shear and frictional capacity of the
columns.
From the photos is possible to asses that a plastic mechanism at the columns base has
not been reached. Nevertheless, loss of verticality has been recorded. The majority of
the columns, except for those collapsed which appeared to be damaged, had not shown
plastic hinge formation at the base. Some column showed detachment of concrete
cover in the corbels zone or some dents due to the panels hits.
Another damage typology has affected the horizontal cladding panels. The steel link
appears to be safe, although the panels fall. The external windows appear to be
undamaged (Figure 28).
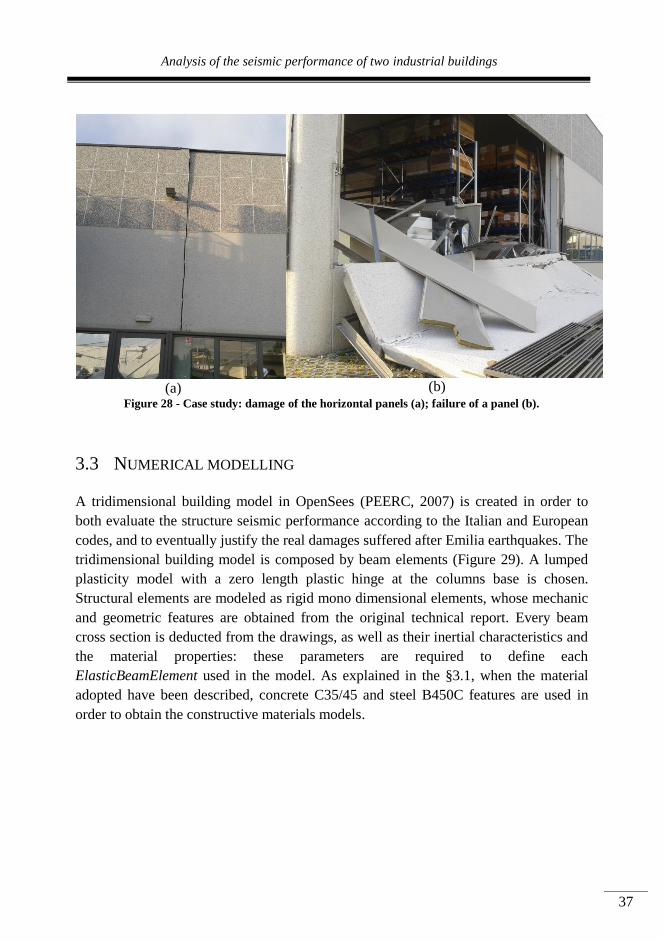
Analysis of the seismic performance of two industrial buildings
37
(a)
(b)
Figure 28 - Case study: damage of the horizontal panels (a); failure of a panel (b).
3.3 NUMERICAL MODELLING
A tridimensional building model in OpenSees (PEERC, 2007) is created in order to
both evaluate the structure seismic performance according to the Italian and European
codes, and to eventually justify the real damages suffered after Emilia earthquakes. The
tridimensional building model is composed by beam elements (Figure 29). A lumped
plasticity model with a zero length plastic hinge at the columns base is chosen.
Structural elements are modeled as rigid mono dimensional elements, whose mechanic
and geometric features are obtained from the original technical report. Every beam
cross section is deducted from the drawings, as well as their inertial characteristics and
the material properties: these parameters are required to define each
ElasticBeamElement used in the model. As explained in the §3.1, when the material
adopted have been described, concrete C35/45 and steel B450C features are used in
order to obtain the constructive materials models.
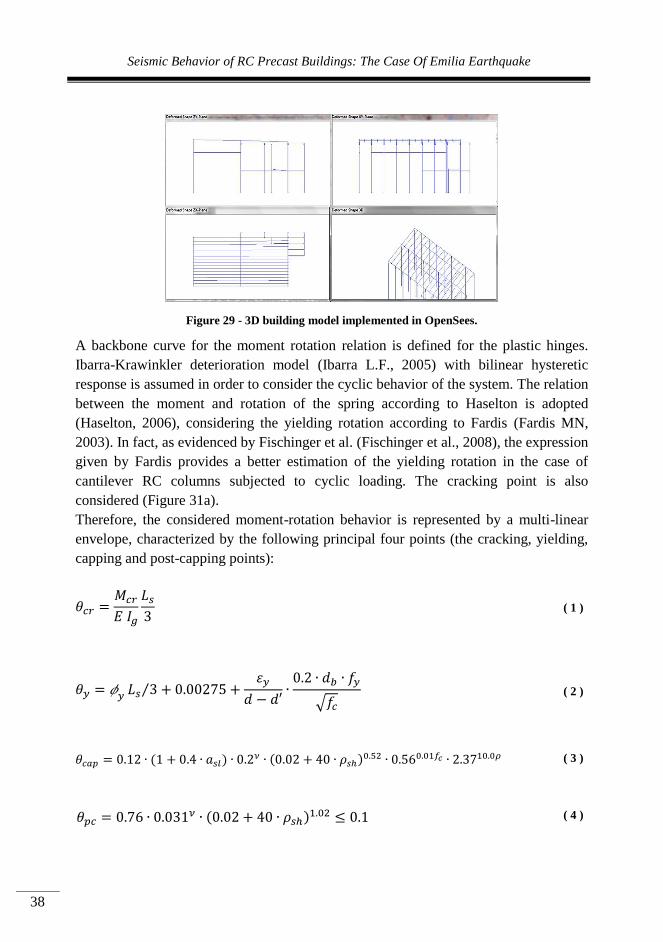
Seismic Behavior of RC Precast Buildings: The Case Of Emilia Earthquake
38
Figure 29 - 3D building model implemented in OpenSees.
A backbone curve for the moment rotation relation is defined for the plastic hinges.
Ibarra-Krawinkler deterioration model (Ibarra L.F., 2005) with bilinear hysteretic
response is assumed in order to consider the cyclic behavior of the system. The relation
between the moment and rotation of the spring according to Haselton is adopted
(Haselton, 2006), considering the yielding rotation according to Fardis (Fardis MN,
2003). In fact, as evidenced by Fischinger et al. (Fischinger et al., 2008), the expression
given by Fardis provides a better estimation of the yielding rotation in the case of
cantilever RC columns subjected to cyclic loading. The cracking point is also
considered (Figure 31a).
Therefore, the considered moment-rotation behavior is represented by a multi-linear
envelope, characterized by the following principal four points (the cracking, yielding,
capping and post-capping points):
( 1 )
⁄
√
( 2 )
( 3 )
( 4 )

Analysis of the seismic performance of two industrial buildings
39
where:
⁄ (
) is the cracking moment;
is the gross moment of inertia;
is the cross section height;
is the axial force;
is the gross cross section area;
is the concrete tensile strength;
is the column shear span;
is the yield curvature;
is the yield strain of the tension reinforcement;
is the distance between the tension and compression reinforcement;
is the bar diameter;
and are respectively the tension reinforcement yield stress and the concrete
compressive strength;
is a variable representative of the bar slip from their anchorage (1 indicates slip; 0
indicates no slip);
is the axial load ratio;
and are the transverse and longitudinal reinforcement ratios.
Because of the different geometric issues of the columns, four “material” typologies
are obtained in order to define different columns material (moment-rotation relations):
one for each belonging row; for the appendix another material group is defined. Then,
moment-rotation relationships in both X and Y direction and for both rectangular and
square cross sections are evaluated: twelve “material” types at all. Each “material” has
been evaluated with the help of a useful tool specifically realized (§3.3.1).
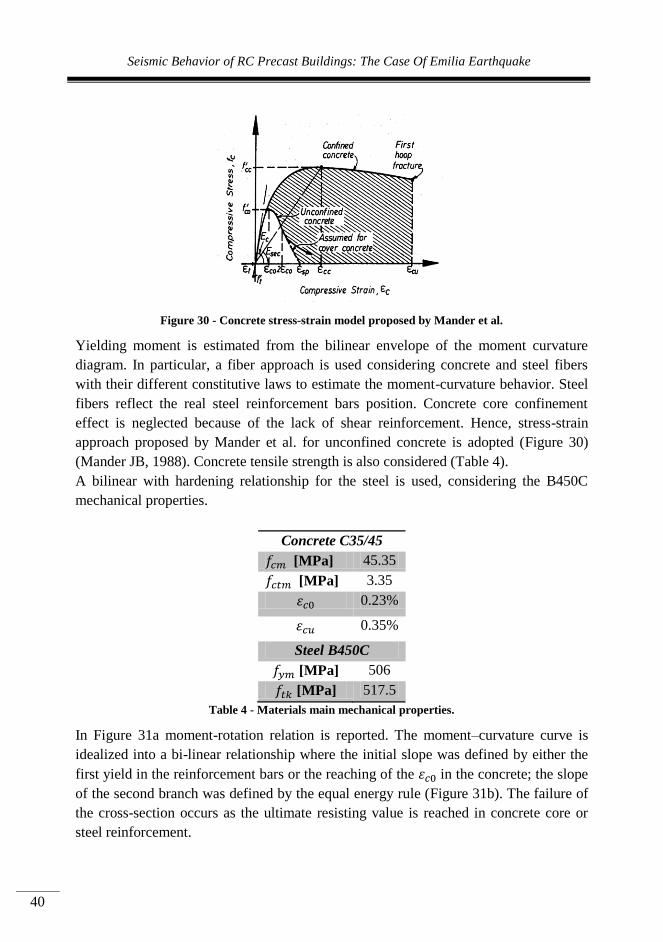
Seismic Behavior of RC Precast Buildings: The Case Of Emilia Earthquake
40
Figure 30 - Concrete stress-strain model proposed by Mander et al.
Yielding moment is estimated from the bilinear envelope of the moment curvature
diagram. In particular, a fiber approach is used considering concrete and steel fibers
with their different constitutive laws to estimate the moment-curvature behavior. Steel
fibers reflect the real steel reinforcement bars position. Concrete core confinement
effect is neglected because of the lack of shear reinforcement. Hence, stress-strain
approach proposed by Mander et al. for unconfined concrete is adopted (Figure 30)
(Mander JB, 1988). Concrete tensile strength is also considered (Table 4).
A bilinear with hardening relationship for the steel is used, considering the B450C
mechanical properties.
Concrete C35/45
[MPa] 45.35
[MPa] 3.35
0.23%
0.35%
Steel B450C
[MPa] 506
[MPa] 517.5
Table 4 - Materials main mechanical properties.
In Figure 31a moment-rotation relation is reported. The moment–curvature curve is
idealized into a bi-linear relationship where the initial slope was defined by either the
first yield in the reinforcement bars or the reaching of the in the concrete; the slope
of the second branch was defined by the equal energy rule (Figure 31b). The failure of
the cross-section occurs as the ultimate resisting value is reached in concrete core or
steel reinforcement.
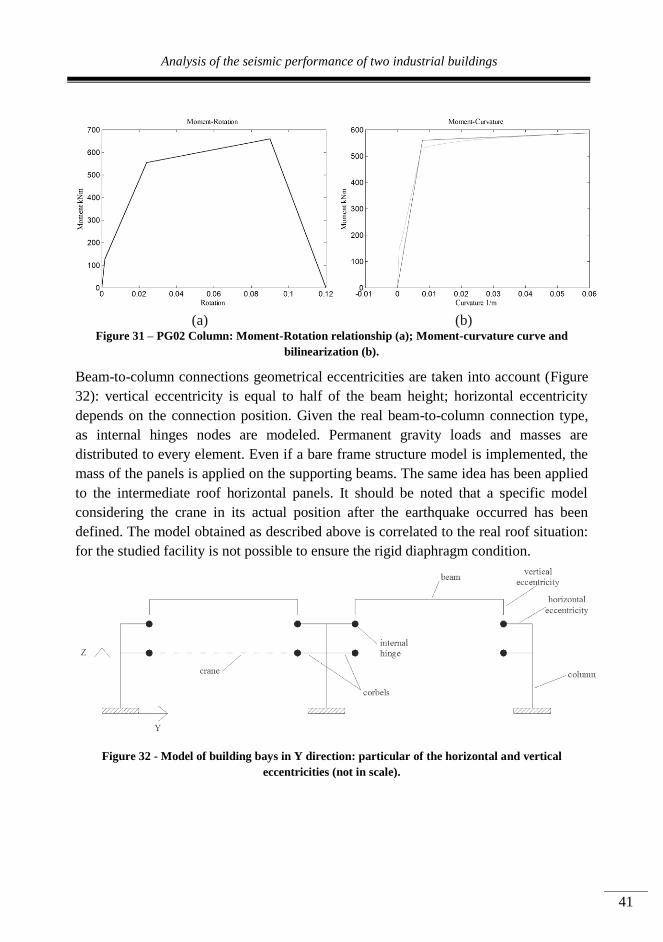
Analysis of the seismic performance of two industrial buildings
41
(a)
(b)
Figure 31 – PG02 Column: Moment-Rotation relationship (a); Moment-curvature curve and
bilinearization (b).
Beam-to-column connections geometrical eccentricities are taken into account (Figure
32): vertical eccentricity is equal to half of the beam height; horizontal eccentricity
depends on the connection position. Given the real beam-to-column connection type,
as internal hinges nodes are modeled. Permanent gravity loads and masses are
distributed to every element. Even if a bare frame structure model is implemented, the
mass of the panels is applied on the supporting beams. The same idea has been applied
to the intermediate roof horizontal panels. It should be noted that a specific model
considering the crane in its actual position after the earthquake occurred has been
defined. The model obtained as described above is correlated to the real roof situation:
for the studied facility is not possible to ensure the rigid diaphragm condition.
Figure 32 - Model of building bays in Y direction: particular of the horizontal and vertical
eccentricities (not in scale).
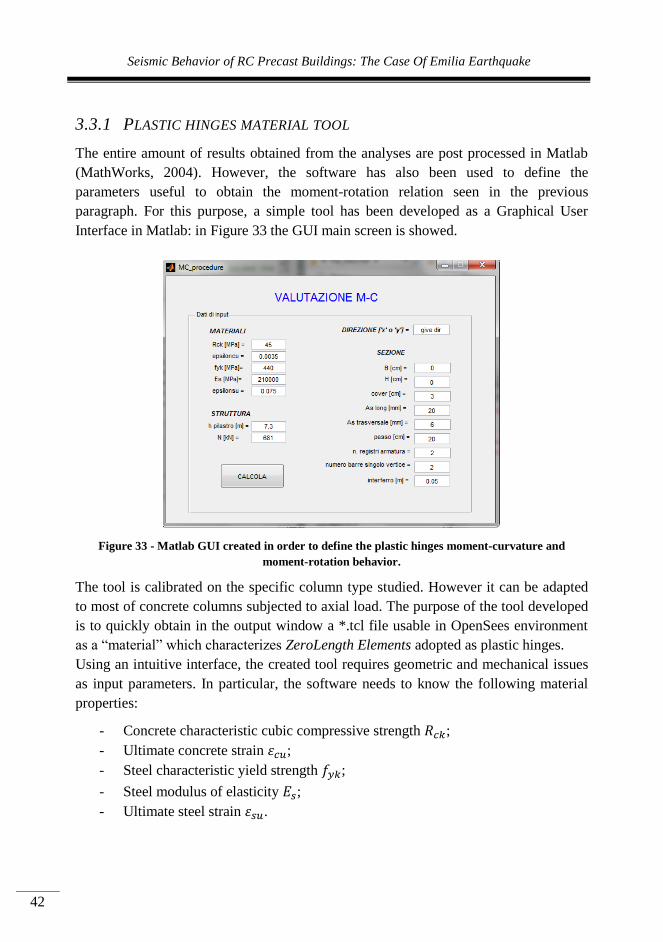
Seismic Behavior of RC Precast Buildings: The Case Of Emilia Earthquake
42
3.3.1 PLASTIC HINGES MATERIAL TOOL
The entire amount of results obtained from the analyses are post processed in Matlab
(MathWorks, 2004). However, the software has also been used to define the
parameters useful to obtain the moment-rotation relation seen in the previous
paragraph. For this purpose, a simple tool has been developed as a Graphical User
Interface in Matlab: in Figure 33 the GUI main screen is showed.
Figure 33 - Matlab GUI created in order to define the plastic hinges moment-curvature and
moment-rotation behavior.
The tool is calibrated on the specific column type studied. However it can be adapted
to most of concrete columns subjected to axial load. The purpose of the tool developed
is to quickly obtain in the output window a *.tcl file usable in OpenSees environment
as a “material” which characterizes ZeroLength Elements adopted as plastic hinges.
Using an intuitive interface, the created tool requires geometric and mechanical issues
as input parameters. In particular, the software needs to know the following material
properties:
- Concrete characteristic cubic compressive strength ;
- Ultimate concrete strain ;
- Steel characteristic yield strength ;
- Steel modulus of elasticity ;
- Ultimate steel strain .
Analysis of the seismic performance of two industrial buildings
43
Moreover, column height and axial load values are required. Concerning to the cross
section properties definition, the requested values are:
- Section dimensions;
- Concrete cover value;
- Longitudinal and transversal reinforcement bars diameter;
- Stirrups spacing;
- Number of steel bars layers;
- Number of steel bars placed in a single cross section quadrant;
- Bars spacing.
Finally, the direction indication is used in order to name the output file. Once inserted
the input values, the “CALCOLA” button allows to obtain a *.tcl file ready to be used
in OpenSees, for the material definition. In addition to the file, the described tool plots
moment-curvature and moment-rotation diagrams, along with stress-strain diagrams
for preselected concrete and stress fibers.
3.4 SEISMIC EVALUATION ACCORDING TO THE ITALIAN CODE
Seismic evaluation of the studied building is carried out to verify the structure safety
according to actual building codes. Moreover, for precast buildings with flexible
diaphragm it is not possible to find code specific assessments to be done. Question
arises as to whether nonlinear static analyses can be employed for this structural
typology.
According to the Italian code (NTC2008) (CS.LL.PP., 2008), both linear or nonlinear
static or dynamic analysis (NLSA and NLDA in the following) may be adopted to
evaluate the seismic vulnerability of existing buildings.
The aim of the performed analysis was to analyze the different obtained results, with
particular attention to the code verification of the building. Moreover, the idea to
perform nonlinear static analysis on a tridimensional building model is based on the
purpose to understand the role played by the control point displacement in this type of
facilities. In fact, according to national and international codes, nonlinear static
analyses supposed to be valid only when a series of important assumptions are made:
first of all, the irrelevance of the higher modes. Therefore, a further aim of the
conducted analysis concerns the comparison between static and dynamic procedures
results. NLSA is often implemented because offers a good compromise between results
accuracy and computational burden. However, it could lead to unacceptable
approximations in some cases.

Seismic Behavior of RC Precast Buildings: The Case Of Emilia Earthquake
44
3.4.1 NONLINEAR STATIC ANALYSIS
Nonlinear static (pushover) analysis is useful to evaluate the seismic capacity of
existing buildings. This type of analysis can be used only when the structure is
characterized by a predominant mode of vibration with a large participating mass
(CS.LL.PP., 2009). It consists in applying to the gravitational load model a specified
system of horizontal forces monotonically increasing till the building collapse.
As in (Fajfar et al., 2005a) confirmed, pushover analysis is a quite simple tool for
seismic assessment of existing buildings. The first method applications were limited to
the planarity of the models. In the years, a great intellectual effort has been made to
make the method applicable also to asymmetric structures, which needs tridimensional
analysis (Chopra and Goel, 2004; Fajfar et al., 2005b; Fujii, 2011; Magliulo et al.,
2012). In fact, one of the most important assumptions made in the N2 method (Fajfar,
2000) concerns the definition of the equivalent SDOF. The transformation from the
MDOF to an equivalent SDOF requires the displacement shape to be time-invariant.
This hypothesis is acceptable for regular buildings, where the influence of the higher
modes and the torsional effects are negligible, and the oscillations follow
predominantly the fundamental mode shape.
In the case study, there is a further peculiarity represented by the presence of
deformable roof. However, in order to assess the possibility of applying the code
procedure and eventually estimate its acceptability,, the analysis on the tridimensional
model is carried out according to the N2 method (Fajfar and Gašperšič, 1996) in both
X and Y direction.
As required by the code, two horizontal forces distributions to the structure are applied:
one proportional to the masses (“MASSA” distribution), the other proportional to the
product of masses and the principal vibration mode displacements (“MODO”
distribution). In particular, forces on the columns top joints are applied. Therefore,
eight capacity curves are obtained, four in each direction (X and Y), evaluated as base
shear-control node displacements relationships. In Figure 34 capacity curves in X
direction (E-W) are reported.

Analysis of the seismic performance of two industrial buildings
45
Figure 34 - Capacity curves in x direction (X+ and X-) for both "MASSA" and "MODO"
distributions.
The innovative aspect in applying this method to this kind of facility concerns the
displacement control point choice. Typically, the control point is considered as the
mass center on the upper roof of the building. In this case, since the rigid diaphragm is
not ensured, the control point is established in a different way for each plane direction.
One of the most interesting methods on evaluating the control displacement for flexible
diaphragms is reported in Casarotti and Pinho (Casarotti and Pinho, 2007) in the
definition of the Adaptive Capacity Spectrum Method (ACSM). In fact, the mentioned
method is proposed for the assessment of continuous concrete bridges with flexible
superstructure. As pointed out by Nakamura et al. (Nakamura et al., 2014), the most
significant aspects of the Adaptive Capacity Spectrum Method proposed by Casarotti
and Pinho is the fact that the control node doesn’t need to have a physical location: the
system displacement is evaluated according to energetic considerations.
In particular, the SDOF control point displacement is evaluated step by step as the
displacement which do the same amount of work of the MDOF. The system equivalent
displacement is evaluated at each load step as:
∑
∑
( 5 )
Therefore, the equivalent displacement as the inverse of the modal participation factor
is calculated.
-0.4 -0.3 -0.2 -0.1 0 0.1 0.2 0.3 0.40
500
1000
1500
2000
2500
3000
3500
Displacement E-W [m]
Sh
ear
E-W
[k
N]
Pushover dirX
MASSA X-
MASSA X+
MODO X-
MODO X+
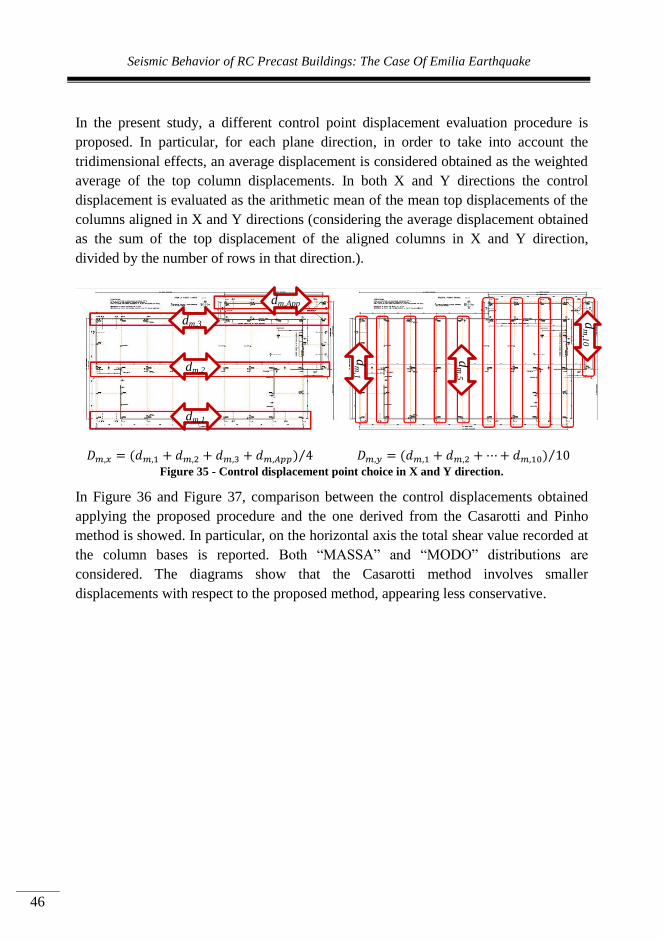
Seismic Behavior of RC Precast Buildings: The Case Of Emilia Earthquake
46
In the present study, a different control point displacement evaluation procedure is
proposed. In particular, for each plane direction, in order to take into account the
tridimensional effects, an average displacement is considered obtained as the weighted
average of the top column displacements. In both X and Y directions the control
displacement is evaluated as the arithmetic mean of the mean top displacements of the
columns aligned in X and Y directions (considering the average displacement obtained
as the sum of the top displacement of the aligned columns in X and Y direction,
divided by the number of rows in that direction.).
⁄
⁄
Figure 35 - Control displacement point choice in X and Y direction.
In Figure 36 and Figure 37, comparison between the control displacements obtained
applying the proposed procedure and the one derived from the Casarotti and Pinho
method is showed. In particular, on the horizontal axis the total shear value recorded at
the column bases is reported. Both “MASSA” and “MODO” distributions are
considered. The diagrams show that the Casarotti method involves smaller
displacements with respect to the proposed method, appearing less conservative.
dm,1
dm,App
dm,3
dm,2
dm
,1
dm
,5
dm
,10
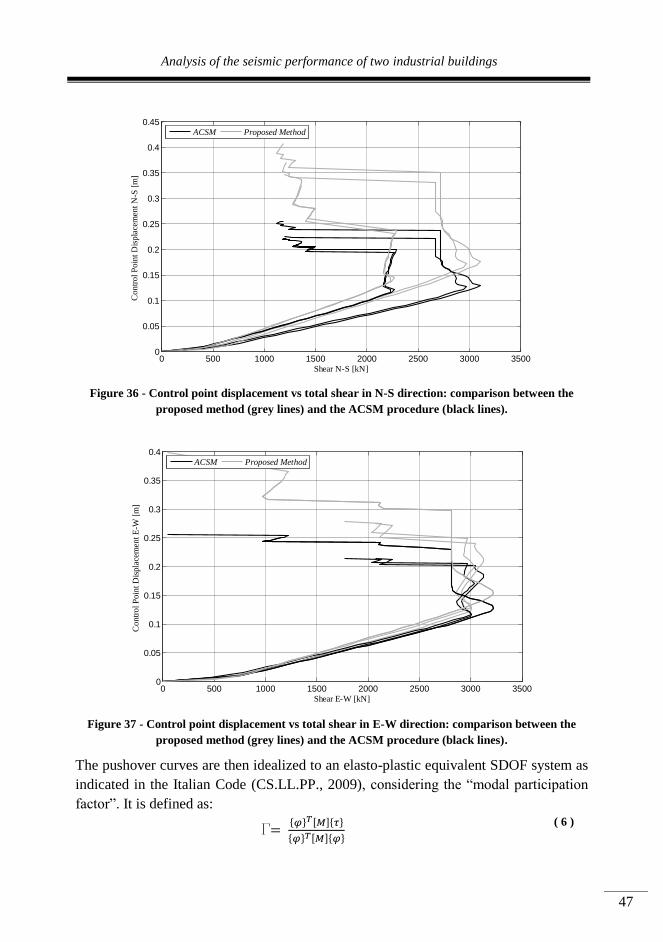
Analysis of the seismic performance of two industrial buildings
47
Figure 36 - Control point displacement vs total shear in N-S direction: comparison between the
proposed method (grey lines) and the ACSM procedure (black lines).
Figure 37 - Control point displacement vs total shear in E-W direction: comparison between the
proposed method (grey lines) and the ACSM procedure (black lines).
The pushover curves are then idealized to an elasto-plastic equivalent SDOF system as
indicated in the Italian Code (CS.LL.PP., 2009), considering the “modal participation
factor”. It is defined as:
G { } [ ]{ }
{ } [ ]{ }
( 6 )
0 500 1000 1500 2000 2500 3000 35000
0.05
0.1
0.15
0.2
0.25
0.3
0.35
0.4
0.45
Co
ntr
ol P
oin
t D
isp
lace
men
t N
-S [
m]
Shear N-S [kN]
ACSM Proposed Method
0 500 1000 1500 2000 2500 3000 35000
0.05
0.1
0.15
0.2
0.25
0.3
0.35
0.4
Contr
ol P
oin
t D
ispla
cem
ent E
-W [
m]
Shear E-W [kN]
ACSM Proposed Method

Seismic Behavior of RC Precast Buildings: The Case Of Emilia Earthquake
48
where { } is the influence vector, which represents the displacements of the masses
resulting from static application of a unit ground displacement. The denominator
represents the system’s generalized mass matrix.
Therefore, total shear–displacement relation of the equivalent SDOF model is obtained
from the MDOF system as:
( 7 )
( 8 )
where is the control displacement calculated as stated above. The equivalent
SDOF behavior is then idealized into a bilinear relation as shown in Figure 38, where
.is the maximum shear resistance of the equivalent system evaluated as:
( 9 )
and is the maximum shear resistance of the real system.
Figure 38 - Equivalent SDOF model and F-d bilinearization scheme.
Definitely, indicated the displacement characterized by a reduction in shear
resistance equal to , and forced the elastic graph section to pass through the

Analysis of the seismic performance of two industrial buildings
49
point were is equal to , the yielding point is obtained applying the equal
area method.
The SDOF demand displacement is evaluated considering the corresponding elastic
spectral displacement for a period:
√
( 10 )
according to the equal displacement assumption (valid if - where is the
transition period between the elastic design spectrum plateau and the constant velocity
section).
Checks in terms of both ductile and fragile mechanisms are performed considering the
Life Safety limit state (i.e. 475 years return period earthquake).
3.4.2 NONLINEAR DYNAMIC ANALYSIS – ACCELEROGRAMS SELECTION
Nonlinear dynamic analysis for the Life Safety limit state (i.e. 475 years return period
seism) are performed on the model of the building in order to compare the results with
the ones obtained from the nonlinear static analysis. A bidirectional input is taken into
account and the analysis is conducted as prescribed by EC8 (Normalisation, 2005).
As mentioned previously, the Emilian seismic sequence occurred in May 2012 was
characterized by two main shocks of local magnitudes 5.9 (20th May) and 5.8 (29th
May), respectively.
The case-study structure was very close to the epicenter of the second main shock,
whose hypocenter depth was equal to 10.2 km (ITACA, 2009).
The accelerograms selection with the software Rexel is made (Iervolino, 2010),
considering the geographic coordinates of Mirandola (MO) (longitude: 11,068°,
latitude: 44,900°) and a “C” soil type. In particular, for the soil characterization, many
works demonstrate that the lithology of the studied areas is mainly dominated by clays
and silts (Lombardi D., 2014; Presti et al.; Lo Presti et al., 2013). 7 pairs of natural
accelerograms are obtained.
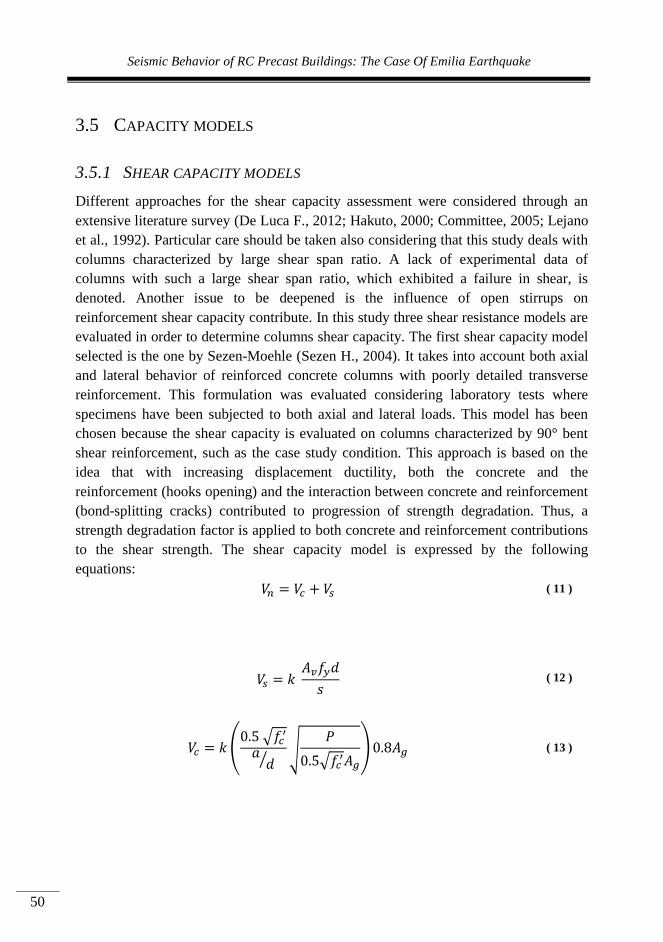
Seismic Behavior of RC Precast Buildings: The Case Of Emilia Earthquake
50
3.5 CAPACITY MODELS
3.5.1 SHEAR CAPACITY MODELS
Different approaches for the shear capacity assessment were considered through an
extensive literature survey (De Luca F., 2012; Hakuto, 2000; Committee, 2005; Lejano
et al., 1992). Particular care should be taken also considering that this study deals with
columns characterized by large shear span ratio. A lack of experimental data of
columns with such a large shear span ratio, which exhibited a failure in shear, is
denoted. Another issue to be deepened is the influence of open stirrups on
reinforcement shear capacity contribute. In this study three shear resistance models are
evaluated in order to determine columns shear capacity. The first shear capacity model
selected is the one by Sezen-Moehle (Sezen H., 2004). It takes into account both axial
and lateral behavior of reinforced concrete columns with poorly detailed transverse
reinforcement. This formulation was evaluated considering laboratory tests where
specimens have been subjected to both axial and lateral loads. This model has been
chosen because the shear capacity is evaluated on columns characterized by 90° bent
shear reinforcement, such as the case study condition. This approach is based on the
idea that with increasing displacement ductility, both the concrete and the
reinforcement (hooks opening) and the interaction between concrete and reinforcement
(bond-splitting cracks) contributed to progression of strength degradation. Thus, a
strength degradation factor is applied to both concrete and reinforcement contributions
to the shear strength. The shear capacity model is expressed by the following
equations:
( 11 )
( 12 )
( √
⁄
√
√
)
( 13 )

Analysis of the seismic performance of two industrial buildings
51
where Vn is the nominal shear strength, Vc represents the nominal concrete contribution
to shear strength, Vs is the nominal transverse reinforcement contribution to shear
strength and k is a ductility-related factor to account for effects of inelastic
displacement cycles on shear strength degradation.
The factor k is defined to be equal to 1.0 for displacement ductility less than 2, and 0.7
for displacement ductility exceeding 6. For displacement ductility between 2 and 6, the
factor k varies linearly.
According to this model, shear resistance increases with the axial force while it is
inversely proportional to the shear span.
The second shear resistance model considered is the Biskinis et al. shear formula
(Biskinis DE, 2004). This approach is based on a regression model calibrated on 239
specimens that failed in shear. Two different formulas are developed: one attempts to
give shear resistance in the case of RC members failing in shear due to diagonal
compression; the other is calibrated for RC elements failing in shear after yielding in
flexure. Both formulas consider shear cyclic degradation through the displacement
ductility factor
equal to the ratio of the plastic component of chord rotation at
failure to the calculated yield chord rotation .
The Biskinis formulas by EC8 part 3 are adopted suggesting the choice according to
the shear span ratio: for shear span ratio higher than 2, shear strength is controlled by
the stirrups.
Therefore shear resistance is given according to the formula:
( )
( ) [ ( (
))√
]
( 14 )
Where is the cross-section height; is the compression zone depth; ⁄ is the shear
span ratio; is the axial force; is the total reinforcement ratio of the element end
section; is the transverse reinforcement shear resistance contribute given as:
( 15 )
Where is the transverse reinforcement ratio; is the cross section width; is the
internal lever arm; is the reinforcement yield stress.
Seismic Behavior of RC Precast Buildings: The Case Of Emilia Earthquake
52
The last shear capacity model adopted is evaluated through the software Response2000
(Bentz, 2001). This software is based on the Modified Compression Field Theory by
Vecchio and Collins (Vecchio and Collins, 1986a). It makes a non-linear sectional
analysis of concrete reinforced elements subjected to axial force, shear and moment,
starting from simple input values. The interesting approach adopted by the software to
evaluate RC elements shear resistance, make possible a comparison between the
different results derived from the literature most widespread models.
3.5.2 CONNECTIONS CAPACITY MODELS
All the connections are modeled as internal hinges. However, checks in terms of
frictional forces are carried out at the end of the analysis. In particular, for each
connection, a safety factor SF is evaluated as the ratio between the frictional
connection capacity Vc and the maximum shear force acting Vd.
For each connection, friction capacity is evaluated as the product between the vertical
force N acting at the moment of maximum shear and the static friction coefficient μ,
whose value is taken from the literature (Capozzi et al., 2009).
The safety factor is evaluated as follows:
( 16 )
where t* is the time instant when shear force is maximum. Frictional coefficient μ
ranges from 0.09 to 0.13.
3.5.3 ROTATION CAPACITY MODELS
At the end of the analysis checks in terms of ultimate rotations at the column bases are
carried out. A safety factor SF as the ratio between the rotation capacity θc and the
maximum analysis recorded rotation θd is considered.
Two different rotation capacity models are considered.
According to EC8 (Normalisation, 2005), the value of total chord rotation capacity
under cyclic loading, following a mechanical approach, is given by:
[
]
(
)
(
)
( 17 )
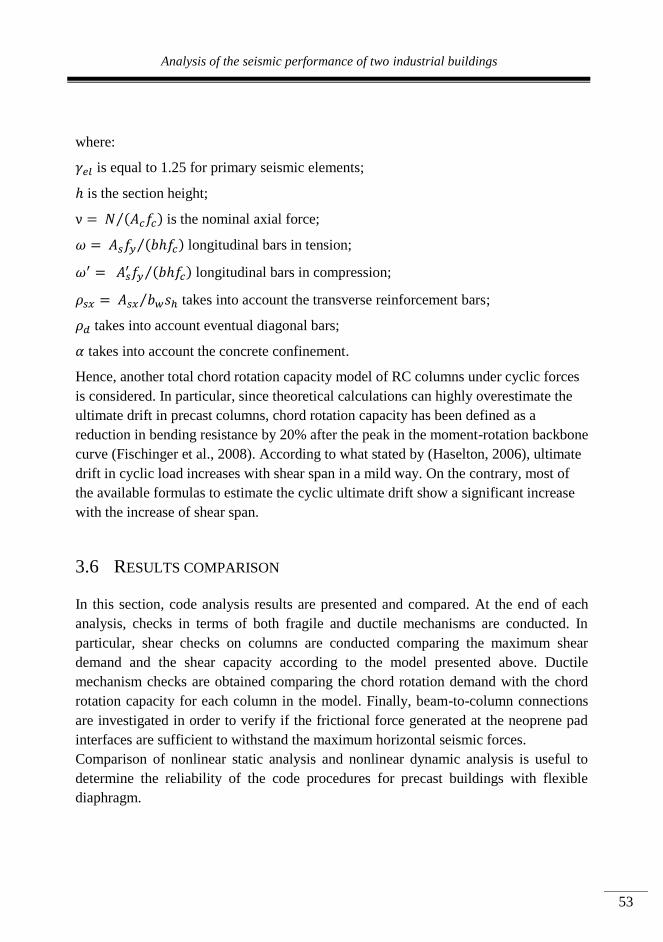
Analysis of the seismic performance of two industrial buildings
53
where:
is equal to 1.25 for primary seismic elements;
is the section height;
⁄ is the nominal axial force;
⁄ longitudinal bars in tension;
⁄ longitudinal bars in compression;
⁄ takes into account the transverse reinforcement bars;
takes into account eventual diagonal bars;
takes into account the concrete confinement.
Hence, another total chord rotation capacity model of RC columns under cyclic forces
is considered. In particular, since theoretical calculations can highly overestimate the
ultimate drift in precast columns, chord rotation capacity has been defined as a
reduction in bending resistance by 20% after the peak in the moment-rotation backbone
curve (Fischinger et al., 2008). According to what stated by (Haselton, 2006), ultimate
drift in cyclic load increases with shear span in a mild way. On the contrary, most of
the available formulas to estimate the cyclic ultimate drift show a significant increase
with the increase of shear span.
3.6 RESULTS COMPARISON
In this section, code analysis results are presented and compared. At the end of each
analysis, checks in terms of both fragile and ductile mechanisms are conducted. In
particular, shear checks on columns are conducted comparing the maximum shear
demand and the shear capacity according to the model presented above. Ductile
mechanism checks are obtained comparing the chord rotation demand with the chord
rotation capacity for each column in the model. Finally, beam-to-column connections
are investigated in order to verify if the frictional force generated at the neoprene pad
interfaces are sufficient to withstand the maximum horizontal seismic forces.
Comparison of nonlinear static analysis and nonlinear dynamic analysis is useful to
determine the reliability of the code procedures for precast buildings with flexible
diaphragm.

Seismic Behavior of RC Precast Buildings: The Case Of Emilia Earthquake
54
3.6.1 NLSA RESULTS
Results of nonlinear static analysis are presented in this section. The seismic demand
according to the N2 method is evaluated (Fajfar, 2000). Results of modal analysis in
terms of mass participation ratio show the larger stiffness of the building in EW
direction, where the participating mass is concentrated almost totally in the third mode
(translational). In NS direction the higher modes of vibration are not negligible, with a
discrete coupling between translational and torsional modes (Table 5).
DIRECTION VIBRATION
MODE
MASS PART.
RATIO G
N-S
1 79.8%
1.259 2 15.0%
3 3.4%
4 14.7%
E-W
1 1.1%
1.261 2 0.0%
3 96.8%
4 2.0%
Table 5 - Mass participation ratio and modal participation factor values in X (E-W) and Y (N-S)
directions.
A thorough study of literature highlighted the lack of appropriate methodologies
suggested to apply the non-linear static analysis to structures for which it is not
possible to consider the rigid diaphragm. As explained in Section 3.4.1, two methods
are herein proposed: one based on geometric considerations, the other based on the
ACSM method by Casarotti and Pinho (Casarotti and Pinho, 2007).

Analysis of the seismic performance of two industrial buildings
55
Figure 39 - Capacity curves in X direction derived from the proposed control displacement point
procedure (grey) vs the Casarotti and Pinho formulas (black).
In Figure 39 the comparison between the capacity curves obtained using the two
different methodologies to determine the control point displacement is showed. From
the graph is possible to asses that the Casarotti and Pinho method produces smaller
displacement. The same happens in the N-S direction (Figure 40).
Figure 40 - Capacity curves in Y direction derived from the proposed control displacement point
procedure (grey) vs the Casarotti and Pinho formulas (black).
-0.5 -0.4 -0.3 -0.2 -0.1 0 0.1 0.2 0.3 0.4 0.50
500
1000
1500
2000
2500
3000
3500
Displacement E-W [m]
Sh
ear
E-W
[k
N]
Pushover dirX
-0.5 -0.4 -0.3 -0.2 -0.1 0 0.1 0.2 0.3 0.4 0.50
500
1000
1500
2000
2500
3000
3500
Displacement N-S [m]
Sh
ear
N-S
[k
N]
Pushover dirY
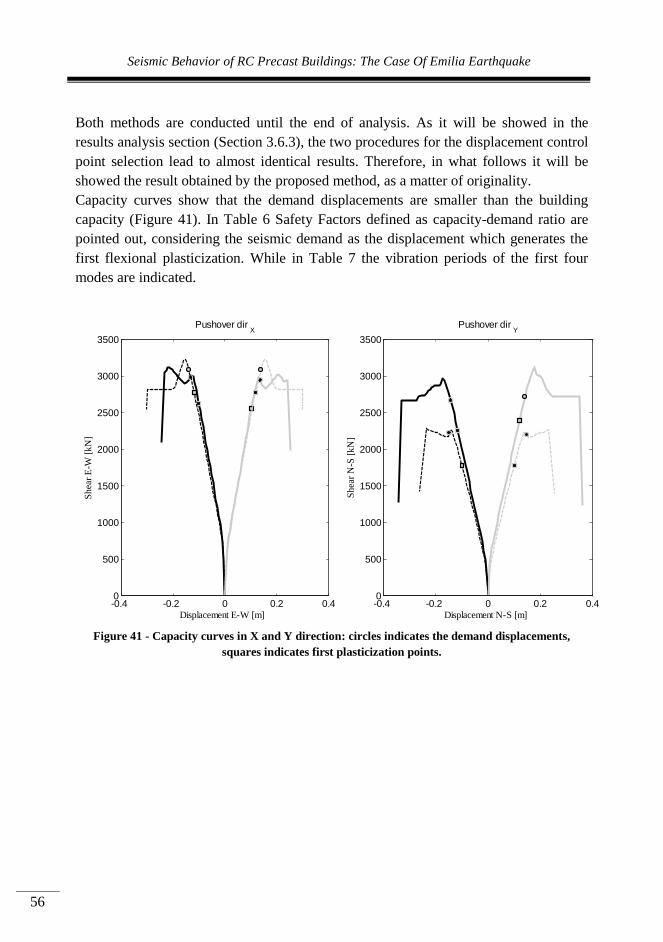
Seismic Behavior of RC Precast Buildings: The Case Of Emilia Earthquake
56
Both methods are conducted until the end of analysis. As it will be showed in the
results analysis section (Section 3.6.3), the two procedures for the displacement control
point selection lead to almost identical results. Therefore, in what follows it will be
showed the result obtained by the proposed method, as a matter of originality.
Capacity curves show that the demand displacements are smaller than the building
capacity (Figure 41). In Table 6 Safety Factors defined as capacity-demand ratio are
pointed out, considering the seismic demand as the displacement which generates the
first flexional plasticization. While in Table 7 the vibration periods of the first four
modes are indicated.
Figure 41 - Capacity curves in X and Y direction: circles indicates the demand displacements,
squares indicates first plasticization points.
-0.4 -0.2 0 0.2 0.40
500
1000
1500
2000
2500
3000
3500
Displacement E-W [m]
Shea
r E
-W [
kN
]
Pushover dirX
MASSA X-
1st Plasticization MASSA X-
Demand MASSA X-
MASSA X+
1st Plasticization MASSA X+
Demand MASSA X+
MODO X-
1st Plasticization MODO X-
Demand MODO X-
MODO X+
1st Plasticization MODO X+
Demand MODO X+
-0.4 -0.2 0 0.2 0.40
500
1000
1500
2000
2500
3000
3500
Displacement N-S [m]
Shea
r N
-S [
kN
]
Pushover dirY
MASSA Y-
1st Plasticization MASSA Y-
MASSA Y+
Demand MASSA Y-
1st Plasticization MASSA Y+
Demand MASSA Y+
MODO Y-
1st Plasticization MODO Y-
Demand MODO Y-
MODO Y+
1st Plasticization MODO Y+
Demand MODO Y+

Analysis of the seismic performance of two industrial buildings
57
Life Safety State Limit
Load
Distribution Dir
Capacity
[m]
Demand
[m] SF
MASSA
X- 0.24 0.10 2.4
X+ 0.25 0.10 2.4
Y- 0.33 0.12 2.8
Y+ 0.35 0.12 2.9
MODO
X- 0.30 0.11 2.7
X+ 0.30 0.12 2.5
Y- 0.25 0.10 2.5
Y+ 0.24 0.10 2.4 Table 6 - Checks in terms of displacements for the Life Safety Limit State considering the first
plasticization point (NLSA – Real System).
MODE T [sec]
1 0.83
2 0.74
3 0.73
4 0.61
Table 7 - Periods of vibration for the first four modes.
For the sake of completeness, in Figure 42 the building modes of vibrations are
depicted.
(a)
(b)
(c)
(d)
Figure 42 - Modes of vibration: 1st (a); 2nd (b); 3rd (c); 4th(d).
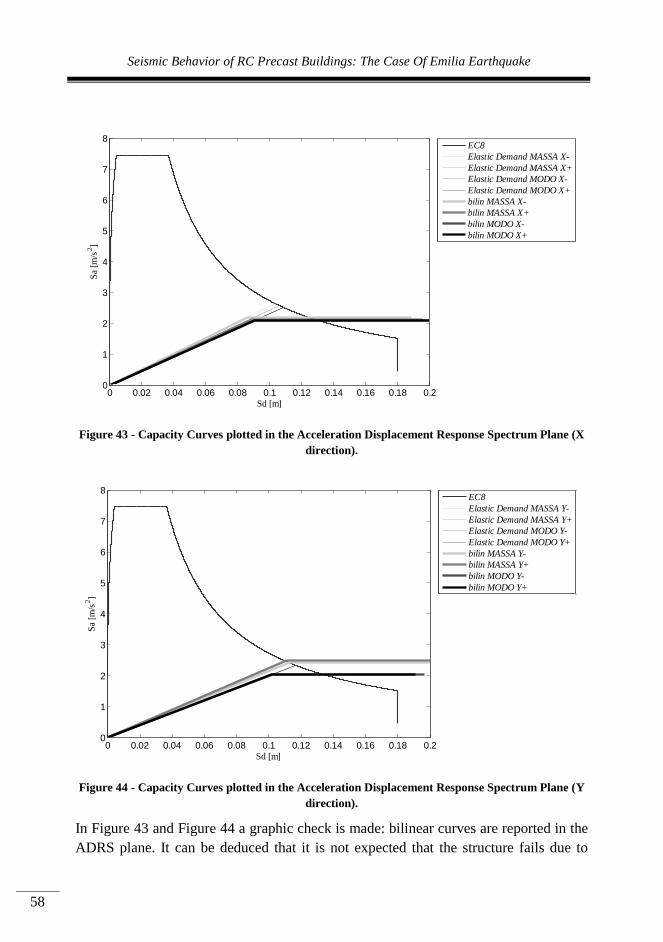
Seismic Behavior of RC Precast Buildings: The Case Of Emilia Earthquake
58
Figure 43 - Capacity Curves plotted in the Acceleration Displacement Response Spectrum Plane (X
direction).
Figure 44 - Capacity Curves plotted in the Acceleration Displacement Response Spectrum Plane (Y
direction).
In Figure 43 and Figure 44 a graphic check is made: bilinear curves are reported in the
ADRS plane. It can be deduced that it is not expected that the structure fails due to
0 0.02 0.04 0.06 0.08 0.1 0.12 0.14 0.16 0.18 0.20
1
2
3
4
5
6
7
8
Sd [m]
Sa
[m/s
2]
ADRS dirX
EC8
Elastic Demand MASSA X-
Elastic Demand MASSA X+
Elastic Demand MODO X-
Elastic Demand MODO X+
bilin MASSA X-
bilin MASSA X+
bilin MODO X-
bilin MODO X+
0 0.02 0.04 0.06 0.08 0.1 0.12 0.14 0.16 0.18 0.20
1
2
3
4
5
6
7
8
Sd [m]
Sa
[m/s
2]
ADRS dirY
EC8
Elastic Demand MASSA Y-
Elastic Demand MASSA Y+
Elastic Demand MODO Y-
Elastic Demand MODO Y+
bilin MASSA Y-
bilin MASSA Y+
bilin MODO Y-
bilin MODO Y+
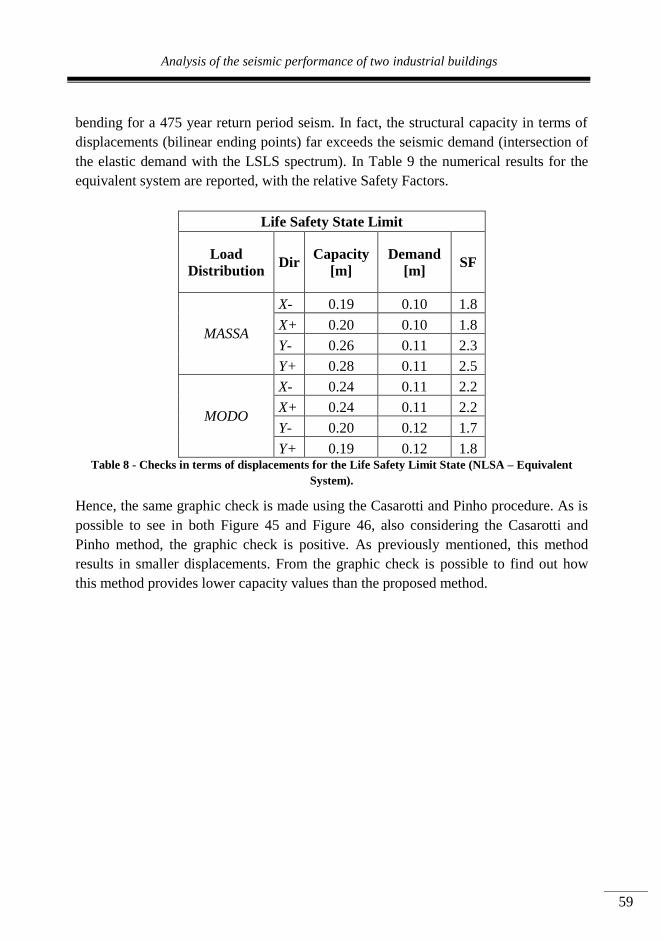
Analysis of the seismic performance of two industrial buildings
59
bending for a 475 year return period seism. In fact, the structural capacity in terms of
displacements (bilinear ending points) far exceeds the seismic demand (intersection of
the elastic demand with the LSLS spectrum). In Table 9 the numerical results for the
equivalent system are reported, with the relative Safety Factors.
Life Safety State Limit
Load
Distribution Dir
Capacity
[m]
Demand
[m] SF
MASSA
X- 0.19 0.10 1.8
X+ 0.20 0.10 1.8
Y- 0.26 0.11 2.3
Y+ 0.28 0.11 2.5
MODO
X- 0.24 0.11 2.2
X+ 0.24 0.11 2.2
Y- 0.20 0.12 1.7
Y+ 0.19 0.12 1.8 Table 8 - Checks in terms of displacements for the Life Safety Limit State (NLSA – Equivalent
System).
Hence, the same graphic check is made using the Casarotti and Pinho procedure. As is
possible to see in both Figure 45 and Figure 46, also considering the Casarotti and
Pinho method, the graphic check is positive. As previously mentioned, this method
results in smaller displacements. From the graphic check is possible to find out how
this method provides lower capacity values than the proposed method.

Seismic Behavior of RC Precast Buildings: The Case Of Emilia Earthquake
60
Figure 45 - ADRS spectrum graphic check using the Casarotti and Pinho method to establish the
control displacement point (X direction).
Figure 46 - ADRS spectrum graphic check using the Casarotti and Pinho method to establish the
control displacement point (Y direction).
In order to investigate the shear response, fragile mechanism checks are performed. In
Figure 47 nonlinear static analysis results in terms of shear are represented. For each
forces distribution the demand is evaluated as the shear acting in correspondence with
the demand displacement. Then, the maximum shear value obtained from the analyses
0 0.02 0.04 0.06 0.08 0.1 0.12 0.14 0.16 0.18 0.20
1
2
3
4
5
6
7
8
Sd [m]
Sa
[m/s
2]
ADRS dirX
EC8
Elastic Demand MASSA X-
Elastic Demand MASSA X+
Elastic Demand MODO X-
Elastic Demand MODO X+
bilin MASSA X-
bilin MASSA X+
bilin MODO X-
bilin MODO X+
0 0.02 0.04 0.06 0.08 0.1 0.12 0.14 0.16 0.18 0.20
1
2
3
4
5
6
7
8
Sd [m]
Sa
[m/s
2]
ADRS dirY
EC8
Elastic Demand MASSA Y-
Elastic Demand MASSA Y+
Elastic Demand MODO Y-
Elastic Demand MODO Y+
bilin MASSA Y-
bilin MASSA Y+
bilin MODO Y-
bilin MODO Y+
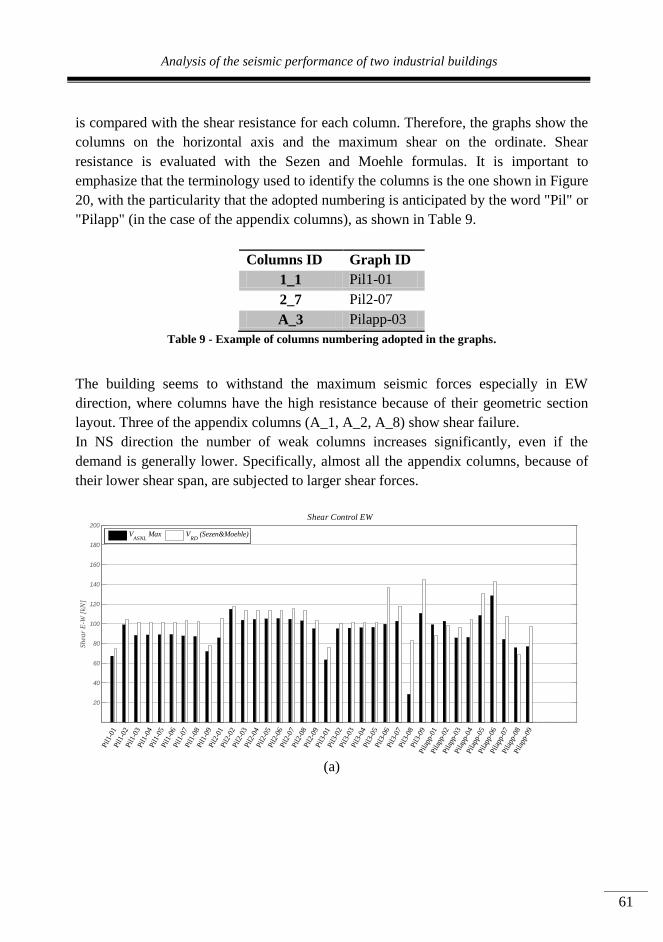
Analysis of the seismic performance of two industrial buildings
61
is compared with the shear resistance for each column. Therefore, the graphs show the
columns on the horizontal axis and the maximum shear on the ordinate. Shear
resistance is evaluated with the Sezen and Moehle formulas. It is important to
emphasize that the terminology used to identify the columns is the one shown in Figure
20, with the particularity that the adopted numbering is anticipated by the word "Pil" or
"Pilapp" (in the case of the appendix columns), as shown in Table 9.
Columns ID Graph ID
1_1 Pil1-01
2_7 Pil2-07
A_3 Pilapp-03
Table 9 - Example of columns numbering adopted in the graphs.
The building seems to withstand the maximum seismic forces especially in EW
direction, where columns have the high resistance because of their geometric section
layout. Three of the appendix columns (A_1, A_2, A_8) show shear failure.
In NS direction the number of weak columns increases significantly, even if the
demand is generally lower. Specifically, almost all the appendix columns, because of
their lower shear span, are subjected to larger shear forces.
(a)
20
40
60
80
100
120
140
160
180
200
Pil1-
01Pil1-
02Pil1-
03Pil1-
04Pil1-
05Pil1-
06Pil1-
07Pil1-
08Pil1-
09Pil2-
01Pil2-
02Pil2-
03Pil2-
04Pil2-
05Pil2-
06Pil2-
07Pil2-
08Pil2-
09Pil3-
01Pil3-
02Pil3-
03Pil3-
04Pil3-
05Pil3-
06Pil3-
07Pil3-
08Pil3-
09Pilap
p-01
Pilap
p-02
Pilap
p-03
Pilap
p-04
Pilap
p-05
Pilap
p-06
Pilap
p-07
Pilap
p-08
Pilap
p-09
Shea
r E
-W [
kN]
Shear Control EW
VASNL
Max VRD
(Sezen&Moehle)
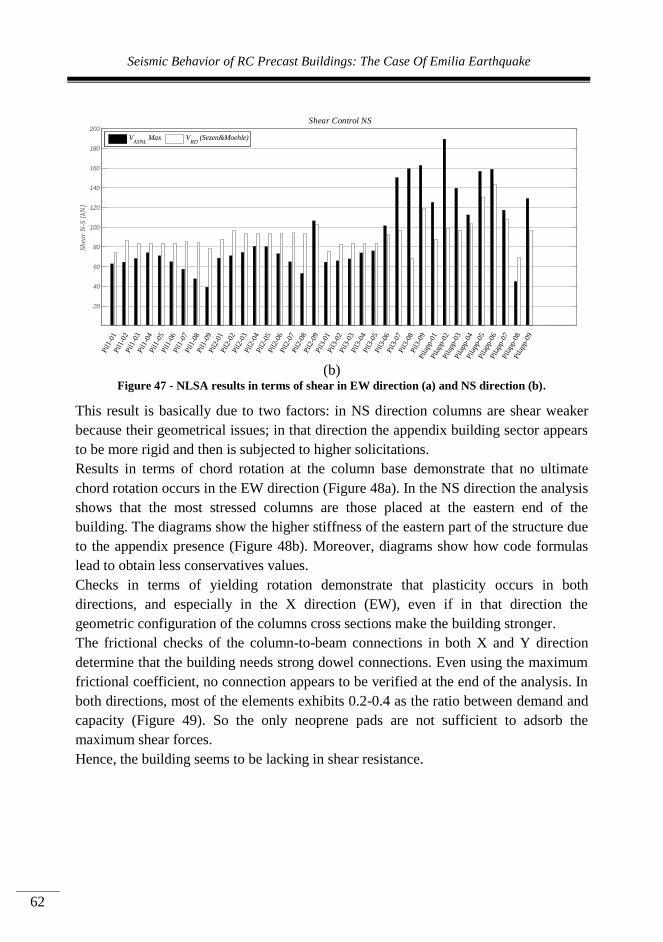
Seismic Behavior of RC Precast Buildings: The Case Of Emilia Earthquake
62
(b)
Figure 47 - NLSA results in terms of shear in EW direction (a) and NS direction (b).
This result is basically due to two factors: in NS direction columns are shear weaker
because their geometrical issues; in that direction the appendix building sector appears
to be more rigid and then is subjected to higher solicitations.
Results in terms of chord rotation at the column base demonstrate that no ultimate
chord rotation occurs in the EW direction (Figure 48a). In the NS direction the analysis
shows that the most stressed columns are those placed at the eastern end of the
building. The diagrams show the higher stiffness of the eastern part of the structure due
to the appendix presence (Figure 48b). Moreover, diagrams show how code formulas
lead to obtain less conservatives values.
Checks in terms of yielding rotation demonstrate that plasticity occurs in both
directions, and especially in the X direction (EW), even if in that direction the
geometric configuration of the columns cross sections make the building stronger.
The frictional checks of the column-to-beam connections in both X and Y direction
determine that the building needs strong dowel connections. Even using the maximum
frictional coefficient, no connection appears to be verified at the end of the analysis. In
both directions, most of the elements exhibits 0.2-0.4 as the ratio between demand and
capacity (Figure 49). So the only neoprene pads are not sufficient to adsorb the
maximum shear forces.
Hence, the building seems to be lacking in shear resistance.
20
40
60
80
100
120
140
160
180
200
Pil1-
01Pil1-
02Pil1-
03Pil1-
04Pil1-
05Pil1-
06Pil1-
07Pil1-
08Pil1-
09Pil2-
01Pil2-
02Pil2-
03Pil2-
04Pil2-
05Pil2-
06Pil2-
07Pil2-
08Pil2-
09Pil3-
01Pil3-
02Pil3-
03Pil3-
04Pil3-
05Pil3-
06Pil3-
07Pil3-
08Pil3-
09Pilap
p-01
Pilap
p-02
Pilap
p-03
Pilap
p-04
Pilap
p-05
Pilap
p-06
Pilap
p-07
Pilap
p-08
Pilap
p-09
Shea
r N
-S [
kN]
Shear Control NS
VASNL
Max VRD
(Sezen&Moehle)

Analysis of the seismic performance of two industrial buildings
63
(a)
(b)
Figure 48 - NLSA results in terms of chord rotation in EW direction (a) and NS direction (b):
maximum demand (black), Fischinger capacity (grey). EC8 capacity (white).
3.6.2 NLDA RESULTS
Nonlinear dynamic analyses with 5% damping have been performed using seven
accelerograms as seismic input signals (Table 10) in both horizontal directions. In
order to evaluate the building seismic performance, the demand is evaluated as the
mean of the most unfavourable effects obtained from the analyses.
0
0.01
0.02
0.03
0.04
0.05
0.06
0.07
Pil1-
01Pil1-
02Pil1-
03Pil1-
04Pil1-
05Pil1-
06Pil1-
07Pil1-
08Pil1-
09Pil2-
01Pil2-
02Pil2-
03Pil2-
04Pil2-
05Pil2-
06Pil2-
07Pil2-
08Pil2-
09Pil3-
01Pil3-
02Pil3-
03Pil3-
04Pil3-
05Pil3-
06Pil3-
07Pil3-
08Pil3-
09Pilap
p-01
Pilap
p-02
Pilap
p-03
Pilap
p-04
Pilap
p-05
Pilap
p-06
Pilap
p-07
Pilap
p-08
Pilap
p-09
N
-S
Base Rotation ASNL Control NS
ASNL
Max Rd Fischinger R
d EC8
0
0.01
0.02
0.03
0.04
0.05
0.06
0.07
Pil1-
01Pil1-
02Pil1-
03Pil1-
04Pil1-
05Pil1-
06Pil1-
07Pil1-
08Pil1-
09Pil2-
01Pil2-
02Pil2-
03Pil2-
04Pil2-
05Pil2-
06Pil2-
07Pil2-
08Pil2-
09Pil3-
01Pil3-
02Pil3-
03Pil3-
04Pil3-
05Pil3-
06Pil3-
07Pil3-
08Pil3-
09Pilap
p-01
Pilap
p-02
Pilap
p-03
Pilap
p-04
Pilap
p-05
Pilap
p-06
Pilap
p-07
Pilap
p-08
Pilap
p-09
E
-W
Base Rotation ASNL Control EW
ASNL
Max Rd Fischinger R
d EC8

Seismic Behavior of RC Precast Buildings: The Case Of Emilia Earthquake
64
Earthquake
Name Date Mw
PGA_X
[m/s2] PGA_Y [m/s2]
PGV_X
[m/s]
PGV_Y
[m/s]
EC8
Site
class
Alkion 24/02/1981 6.6 2.2566 3.0363 0.2234 0.2262 C
Umbria
Marche 26/09/1997 6 1.951 2.1834 0.1735 0.1399 C
Chenoua 29/10/1989 5.9 2.8302 2.2604 0.1311 0.1312 C
NE of Banja
Luka 13/08/1981 5.7 4.3397 3.9657 0.2633 0.1648 C
Komilion 25/02/1994 5.4 1.7162 1.9593 0.1283 0.1441 C
Ionian 04/11/1973 5.8 5.1459 2.4983 0.57 0.255 C
Dinar 01/10/1995 6.4 2.6739 3.1306 0.2937 0.4059 C
MEAN 5.9 2.9876 2.7191 0.2547 0.2095
Table 10 - NLDA: selected seismic input records.
Results of nonlinear dynamic analyses are herein reported. At the end of each analysis,
check diagrams have been made. As written above, particular attention is given to the
columns shear response. The analyses show that all the columns are verified against
shear failure (Table 11 and Table 12). Shear capacity is evaluated with the Sezen
formula. Demand in the Y direction are generally lower than the X direction ones. As
reported in Table 11 and Table 12, shear demand values appear to be lower than the
columns capacity. In X direction, the mean value of capacity demand ratios is about 2;
in Y direction the same value is about 2.2.
In terms of chord rotation, the building is well within the rotation limits, with a Safety
Factor in the range between 2 and 4 in both X and Y direction.
As reported in Figure 49, connections capacity in both directions is not sufficient to
absorb seismic forces; so the friction force is not sufficient to ensure the resistance to
horizontal shear forces.
Dir X (EW)
1st Column Row 2nd Column Row 3rd Column Row Appendix
Vc [kN] Vd [kN] Vc [kN] Vd [kN] Vc [kN] Vd [kN] Vc [kN] Vd [kN]
74.79 38.85 105.85 49.14 75.93 43.52 87.87 47.11
104.77 56.11 117.64 64.03 100.55 52.84 98.69 45.24
101.23 47.93 113.25 55.07 101.17 52.11 96.57 43.56
101.20 47.94 113.36 55.10 101.17 51.73 104.18 52.38
101.20 47.98 113.34 55.33 101.36 51.50 130.47 51.35
101.16 48.02 113.34 55.72 136.57 61.39 143.24 65.66
103.32 48.89 115.34 56.54 117.31 62.00 107.84 46.93
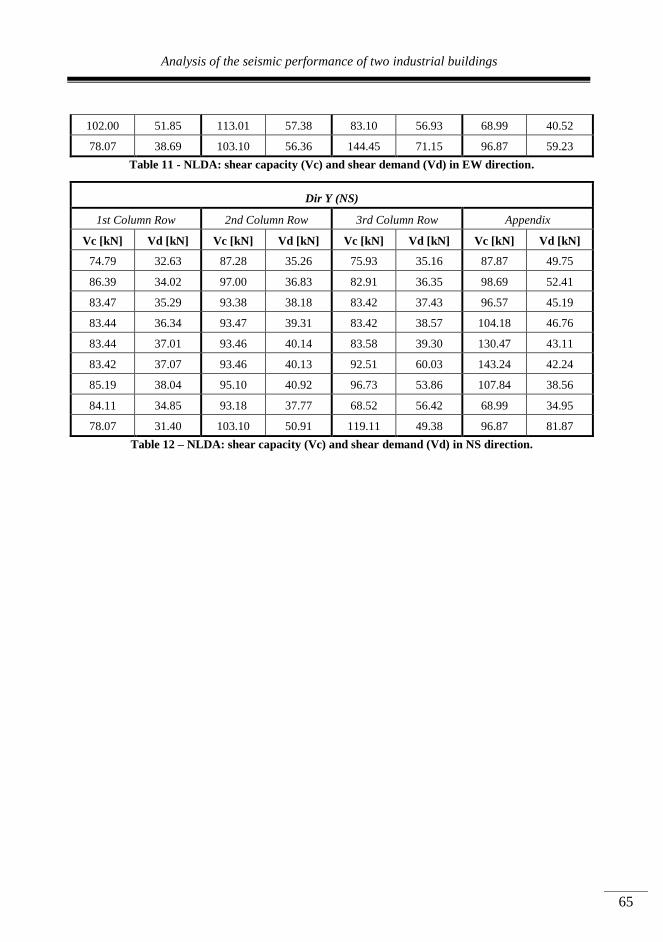
Analysis of the seismic performance of two industrial buildings
65
102.00 51.85 113.01 57.38 83.10 56.93 68.99 40.52
78.07 38.69 103.10 56.36 144.45 71.15 96.87 59.23
Table 11 - NLDA: shear capacity (Vc) and shear demand (Vd) in EW direction.
Dir Y (NS)
1st Column Row 2nd Column Row 3rd Column Row Appendix
Vc [kN] Vd [kN] Vc [kN] Vd [kN] Vc [kN] Vd [kN] Vc [kN] Vd [kN]
74.79 32.63 87.28 35.26 75.93 35.16 87.87 49.75
86.39 34.02 97.00 36.83 82.91 36.35 98.69 52.41
83.47 35.29 93.38 38.18 83.42 37.43 96.57 45.19
83.44 36.34 93.47 39.31 83.42 38.57 104.18 46.76
83.44 37.01 93.46 40.14 83.58 39.30 130.47 43.11
83.42 37.07 93.46 40.13 92.51 60.03 143.24 42.24
85.19 38.04 95.10 40.92 96.73 53.86 107.84 38.56
84.11 34.85 93.18 37.77 68.52 56.42 68.99 34.95
78.07 31.40 103.10 50.91 119.11 49.38 96.87 81.87
Table 12 – NLDA: shear capacity (Vc) and shear demand (Vd) in NS direction.
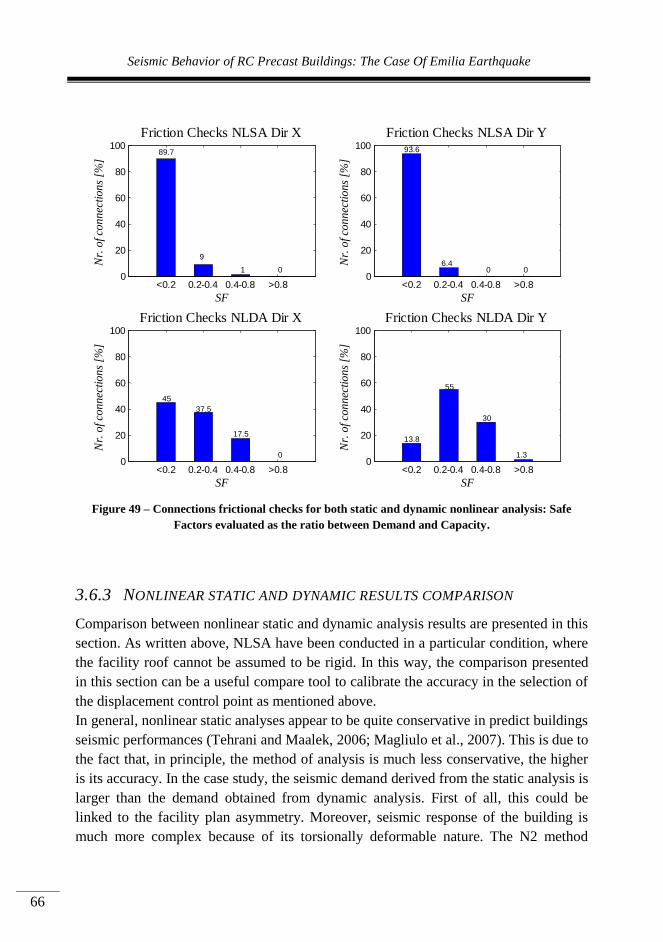
Seismic Behavior of RC Precast Buildings: The Case Of Emilia Earthquake
66
Figure 49 – Connections frictional checks for both static and dynamic nonlinear analysis: Safe
Factors evaluated as the ratio between Demand and Capacity.
3.6.3 NONLINEAR STATIC AND DYNAMIC RESULTS COMPARISON
Comparison between nonlinear static and dynamic analysis results are presented in this
section. As written above, NLSA have been conducted in a particular condition, where
the facility roof cannot be assumed to be rigid. In this way, the comparison presented
in this section can be a useful compare tool to calibrate the accuracy in the selection of
the displacement control point as mentioned above.
In general, nonlinear static analyses appear to be quite conservative in predict buildings
seismic performances (Tehrani and Maalek, 2006; Magliulo et al., 2007). This is due to
the fact that, in principle, the method of analysis is much less conservative, the higher
is its accuracy. In the case study, the seismic demand derived from the static analysis is
larger than the demand obtained from dynamic analysis. First of all, this could be
linked to the facility plan asymmetry. Moreover, seismic response of the building is
much more complex because of its torsionally deformable nature. The N2 method
<0.2 0.2-0.4 0.4-0.8 >0.80
20
40
60
80
10089.7
9
1 0
Nr.
of co
nn
ecti
on
s [%
]
SF
Friction Checks NLSA Dir X
<0.2 0.2-0.4 0.4-0.8 >0.80
20
40
60
80
100 93.6
6.40 0
Nr.
of co
nn
ecti
on
s [%
]
SF
Friction Checks NLSA Dir Y
<0.2 0.2-0.4 0.4-0.8 >0.80
20
40
60
80
100
45
37.5
17.5
0
Nr.
of co
nn
ecti
on
s [%
]
SF
Friction Checks NLDA Dir X
<0.2 0.2-0.4 0.4-0.8 >0.80
20
40
60
80
100
13.8
55
30
1.3
Nr.
of co
nn
ecti
on
s [%
]
SF
Friction Checks NLDA Dir Y
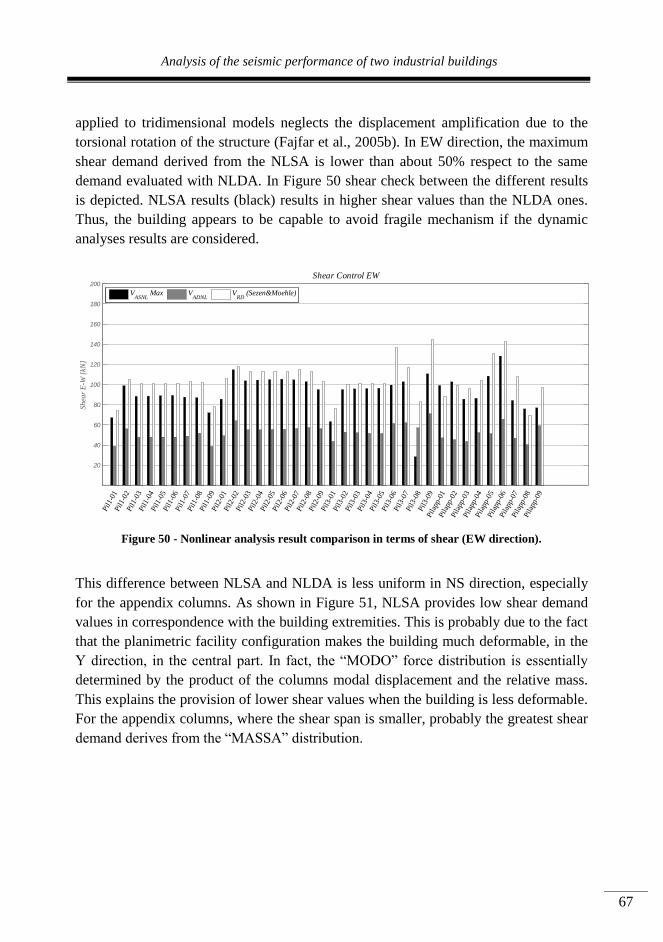
Analysis of the seismic performance of two industrial buildings
67
applied to tridimensional models neglects the displacement amplification due to the
torsional rotation of the structure (Fajfar et al., 2005b). In EW direction, the maximum
shear demand derived from the NLSA is lower than about 50% respect to the same
demand evaluated with NLDA. In Figure 50 shear check between the different results
is depicted. NLSA results (black) results in higher shear values than the NLDA ones.
Thus, the building appears to be capable to avoid fragile mechanism if the dynamic
analyses results are considered.
Figure 50 - Nonlinear analysis result comparison in terms of shear (EW direction).
This difference between NLSA and NLDA is less uniform in NS direction, especially
for the appendix columns. As shown in Figure 51, NLSA provides low shear demand
values in correspondence with the building extremities. This is probably due to the fact
that the planimetric facility configuration makes the building much deformable, in the
Y direction, in the central part. In fact, the “MODO” force distribution is essentially
determined by the product of the columns modal displacement and the relative mass.
This explains the provision of lower shear values when the building is less deformable.
For the appendix columns, where the shear span is smaller, probably the greatest shear
demand derives from the “MASSA” distribution.
20
40
60
80
100
120
140
160
180
200
Pil1-
01Pil1-
02Pil1-
03Pil1-
04Pil1-
05Pil1-
06Pil1-
07Pil1-
08Pil1-
09Pil2-
01Pil2-
02Pil2-
03Pil2-
04Pil2-
05Pil2-
06Pil2-
07Pil2-
08Pil2-
09Pil3-
01Pil3-
02Pil3-
03Pil3-
04Pil3-
05Pil3-
06Pil3-
07Pil3-
08Pil3-
09Pilap
p-01
Pilap
p-02
Pilap
p-03
Pilap
p-04
Pilap
p-05
Pilap
p-06
Pilap
p-07
Pilap
p-08
Pilap
p-09
Sh
ear
E-W
[kN
]
Shear Control EW
VASNL
Max VADNL
VRD
(Sezen&Moehle)
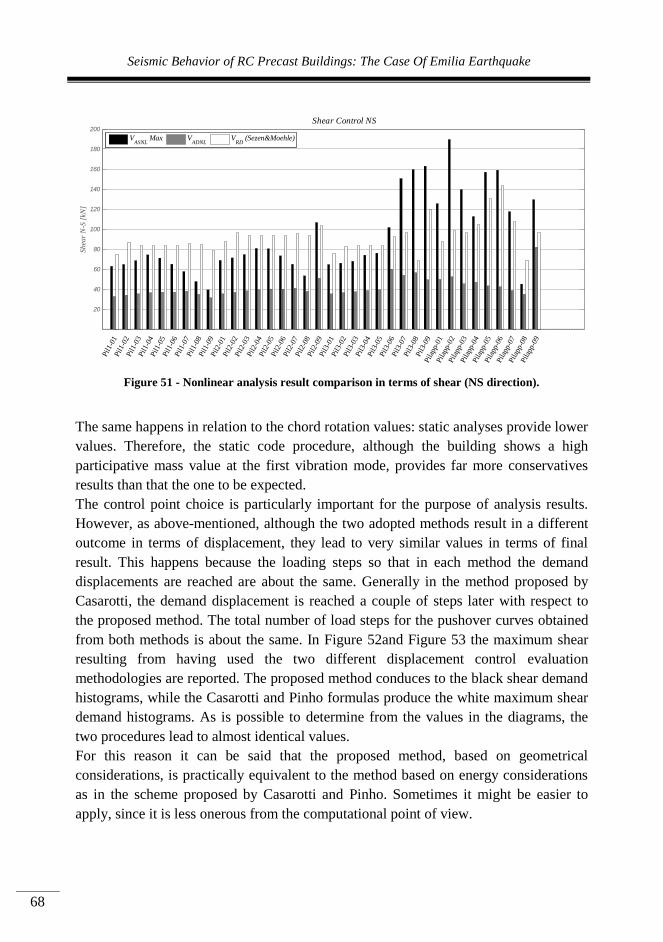
Seismic Behavior of RC Precast Buildings: The Case Of Emilia Earthquake
68
Figure 51 - Nonlinear analysis result comparison in terms of shear (NS direction).
The same happens in relation to the chord rotation values: static analyses provide lower
values. Therefore, the static code procedure, although the building shows a high
participative mass value at the first vibration mode, provides far more conservatives
results than that the one to be expected.
The control point choice is particularly important for the purpose of analysis results.
However, as above-mentioned, although the two adopted methods result in a different
outcome in terms of displacement, they lead to very similar values in terms of final
result. This happens because the loading steps so that in each method the demand
displacements are reached are about the same. Generally in the method proposed by
Casarotti, the demand displacement is reached a couple of steps later with respect to
the proposed method. The total number of load steps for the pushover curves obtained
from both methods is about the same. In Figure 52and Figure 53 the maximum shear
resulting from having used the two different displacement control evaluation
methodologies are reported. The proposed method conduces to the black shear demand
histograms, while the Casarotti and Pinho formulas produce the white maximum shear
demand histograms. As is possible to determine from the values in the diagrams, the
two procedures lead to almost identical values.
For this reason it can be said that the proposed method, based on geometrical
considerations, is practically equivalent to the method based on energy considerations
as in the scheme proposed by Casarotti and Pinho. Sometimes it might be easier to
apply, since it is less onerous from the computational point of view.
20
40
60
80
100
120
140
160
180
200
Pil1-
01Pil1-
02Pil1-
03Pil1-
04Pil1-
05Pil1-
06Pil1-
07Pil1-
08Pil1-
09Pil2-
01Pil2-
02Pil2-
03Pil2-
04Pil2-
05Pil2-
06Pil2-
07Pil2-
08Pil2-
09Pil3-
01Pil3-
02Pil3-
03Pil3-
04Pil3-
05Pil3-
06Pil3-
07Pil3-
08Pil3-
09Pilap
p-01
Pilap
p-02
Pilap
p-03
Pilap
p-04
Pilap
p-05
Pilap
p-06
Pilap
p-07
Pilap
p-08
Pilap
p-09
Sh
ear
N-S
[kN
]
Shear Control NS
VASNL
Max VADNL
VRD
(Sezen&Moehle)
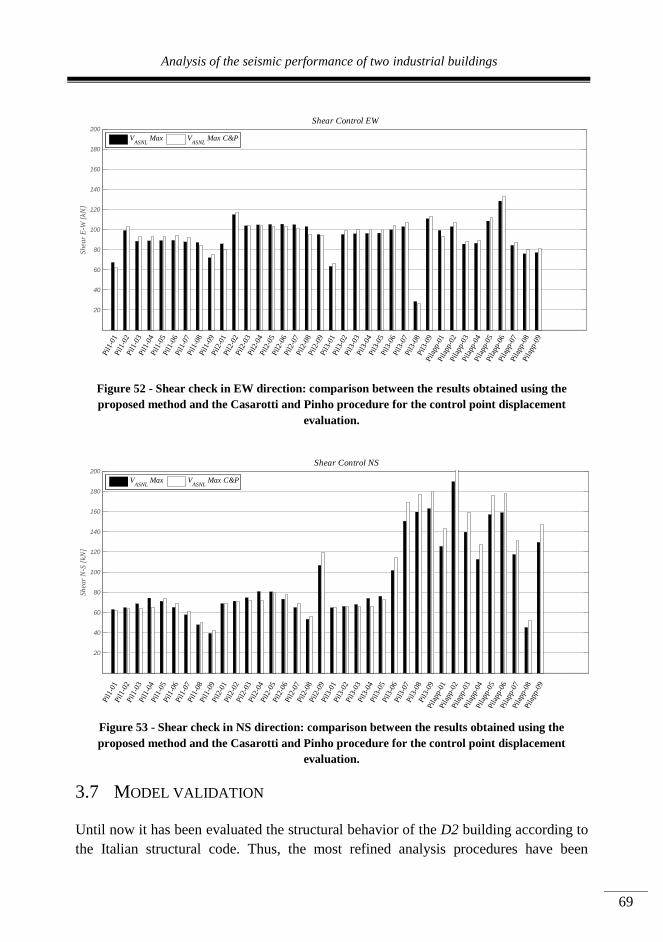
Analysis of the seismic performance of two industrial buildings
69
Figure 52 - Shear check in EW direction: comparison between the results obtained using the
proposed method and the Casarotti and Pinho procedure for the control point displacement
evaluation.
Figure 53 - Shear check in NS direction: comparison between the results obtained using the
proposed method and the Casarotti and Pinho procedure for the control point displacement
evaluation.
3.7 MODEL VALIDATION
Until now it has been evaluated the structural behavior of the D2 building according to
the Italian structural code. Thus, the most refined analysis procedures have been
20
40
60
80
100
120
140
160
180
200
Pil1-
01Pil1-
02Pil1-
03Pil1-
04Pil1-
05Pil1-
06Pil1-
07Pil1-
08Pil1-
09Pil2-
01Pil2-
02Pil2-
03Pil2-
04Pil2-
05Pil2-
06Pil2-
07Pil2-
08Pil2-
09Pil3-
01Pil3-
02Pil3-
03Pil3-
04Pil3-
05Pil3-
06Pil3-
07Pil3-
08Pil3-
09Pilap
p-01
Pilap
p-02
Pilap
p-03
Pilap
p-04
Pilap
p-05
Pilap
p-06
Pilap
p-07
Pilap
p-08
Pilap
p-09
Sh
ear
E-W
[kN
]
Shear Control EW
VASNL
Max VASNL
Max C&P
20
40
60
80
100
120
140
160
180
200
Pil1-
01Pil1-
02Pil1-
03Pil1-
04Pil1-
05Pil1-
06Pil1-
07Pil1-
08Pil1-
09Pil2-
01Pil2-
02Pil2-
03Pil2-
04Pil2-
05Pil2-
06Pil2-
07Pil2-
08Pil2-
09Pil3-
01Pil3-
02Pil3-
03Pil3-
04Pil3-
05Pil3-
06Pil3-
07Pil3-
08Pil3-
09Pilap
p-01
Pilap
p-02
Pilap
p-03
Pilap
p-04
Pilap
p-05
Pilap
p-06
Pilap
p-07
Pilap
p-08
Pilap
p-09
Shea
r N
-S [
kN]
Shear Control NS
VASNL
Max VASNL
Max C&P
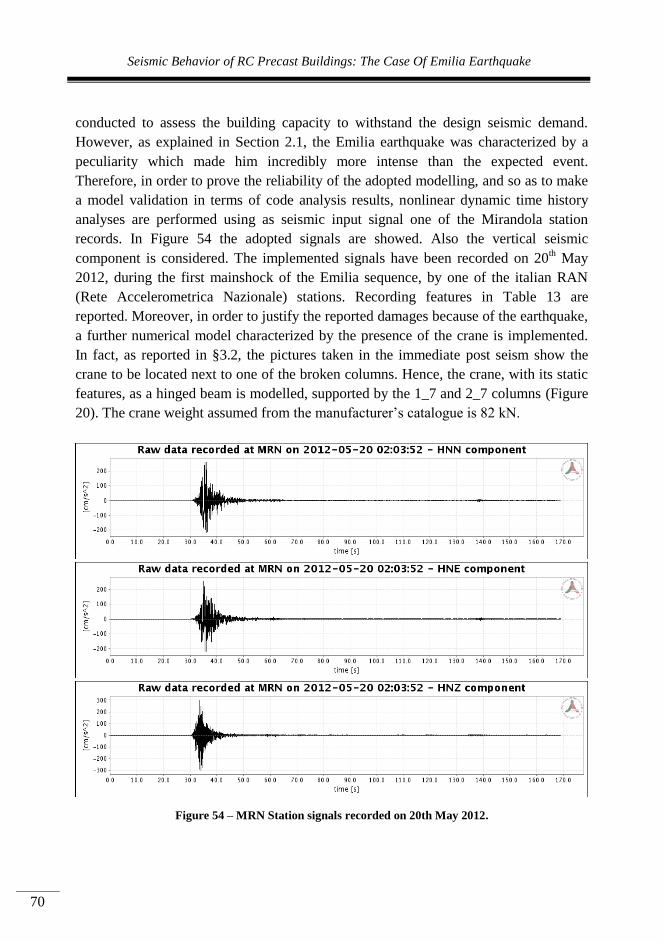
Seismic Behavior of RC Precast Buildings: The Case Of Emilia Earthquake
70
conducted to assess the building capacity to withstand the design seismic demand.
However, as explained in Section 2.1, the Emilia earthquake was characterized by a
peculiarity which made him incredibly more intense than the expected event.
Therefore, in order to prove the reliability of the adopted modelling, and so as to make
a model validation in terms of code analysis results, nonlinear dynamic time history
analyses are performed using as seismic input signal one of the Mirandola station
records. In Figure 54 the adopted signals are showed. Also the vertical seismic
component is considered. The implemented signals have been recorded on 20th May
2012, during the first mainshock of the Emilia sequence, by one of the italian RAN
(Rete Accelerometrica Nazionale) stations. Recording features in Table 13 are
reported. Moreover, in order to justify the reported damages because of the earthquake,
a further numerical model characterized by the presence of the crane is implemented.
In fact, as reported in §3.2, the pictures taken in the immediate post seism show the
crane to be located next to one of the broken columns. Hence, the crane, with its static
features, as a hinged beam is modelled, supported by the 1_7 and 2_7 columns (Figure
20). The crane weight assumed from the manufacturer’s catalogue is 82 kN.
Figure 54 – MRN Station signals recorded on 20th May 2012.

Analysis of the seismic performance of two industrial buildings
71
Event id IT-2012-0008 MW 6.1 ML 5.9 R epi. [km] 12.300
Late triggered
record? NO Instrument type Digital
Filter type BUTTERWORTH
Max PGA [cm/s2] 297.304 corrected horizontal 258.797 corrected vertical -297.304 uncorrected
303.29
6
Max PGV [cm/s] 46.333
Max PGD [cm] 10.376
Arias intensity
[cm/s]
86.869
Housner Int. [cm] 157.654
T90 Effective
duration [s]
5.985
Table 13 – Features of the 1st Emilia seismic mainshock recorded by the MRN station.
The primary objective to be pursuit concerns the assessment of model capacity to
predict the real building behavior. It was therefore carried out a detailed theoretical and
experimental comparison with a special focus on the columns shear strength. All the
considered shear capacity models have been considered to study the collapsed columns
numerical behavior.
3.7.1 DAMAGE PREDICTION
Nonlinear time history dynamic analyses considering the Mirandola station
acceleration recorded signal as seismic input are conducted (“MRN analysis” in the
following) in order to justify the real damages suffered by the building because of the
earthquake. In particular, in order to recreate the real seismic event conditions, the
structure model is completed taking into account the crane as explained in the previous
paragraph. The crane as a further link between the first and the second column rows is
modelled: it represents not only an additional connection element, but also a critic load
for the supporting columns. The increase in seismic mass because of the crane presence
makes higher seismic forces. But, on the other hand, an increase in axial force leads the
column to express a larger shear resistance.
In order to make an accurate shear evaluation, Biskinis (Biskinis DE, 2004) shear
resistance model is also evaluated and compared with the Sezen-Moehle (Sezen H.,
2004) shear predictions. Lastly, a further evaluation of column shear resistance is
carried on through the software Response2000 (Bentz, 2001).
As explained in §3.2, one of the most corroborated hypothesis to justify the partial
collapse is correlated to the decrease of columns resistance because of the reduction in
longitudinal reinforcement. In particular, as shown in Figure 55, the cross section of
the two collapsed columns passes from a value of longitudinal reinforcement ratio r
equal to 0.0126, to a value equal to 0.0084, at about 2.75 m from the ground.
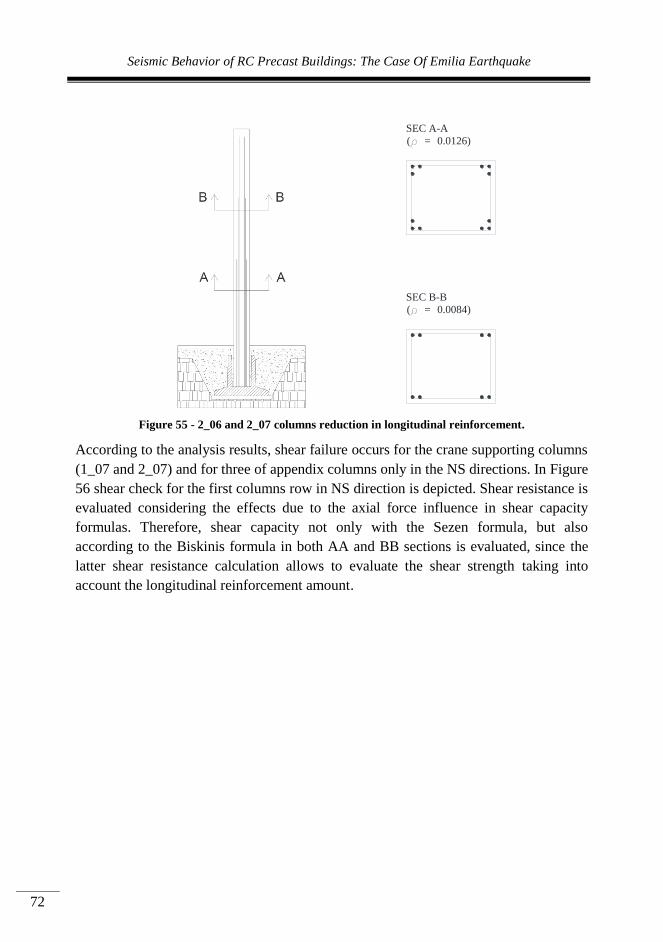
Seismic Behavior of RC Precast Buildings: The Case Of Emilia Earthquake
72
Figure 55 - 2_06 and 2_07 columns reduction in longitudinal reinforcement.
According to the analysis results, shear failure occurs for the crane supporting columns
(1_07 and 2_07) and for three of appendix columns only in the NS directions. In Figure
56 shear check for the first columns row in NS direction is depicted. Shear resistance is
evaluated considering the effects due to the axial force influence in shear capacity
formulas. Therefore, shear capacity not only with the Sezen formula, but also
according to the Biskinis formula in both AA and BB sections is evaluated, since the
latter shear resistance calculation allows to evaluate the shear strength taking into
account the longitudinal reinforcement amount.
SEC A-A
( = 0.0126)
SEC B-B
( = 0.0084)
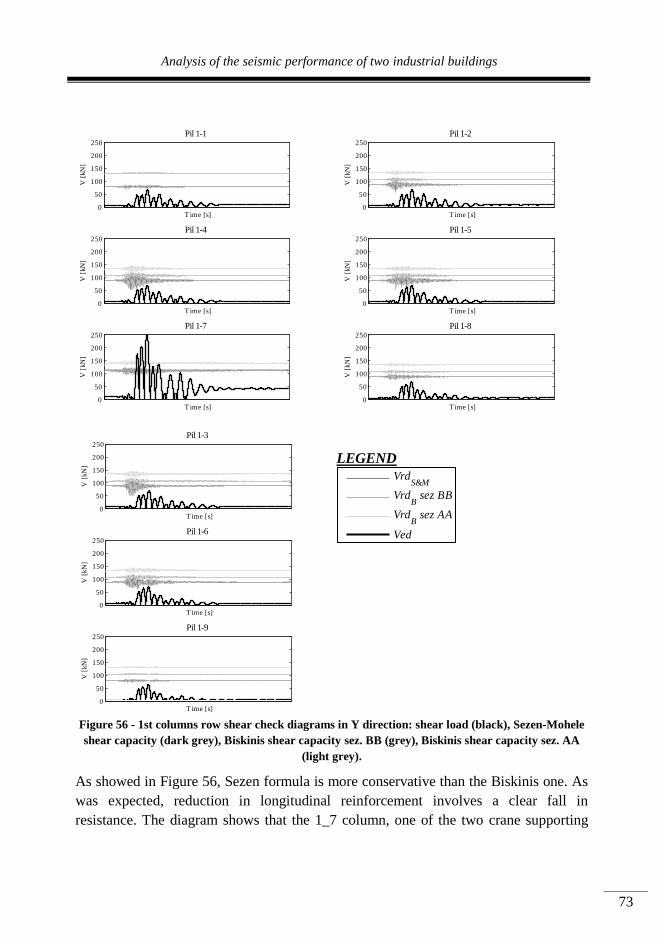
Analysis of the seismic performance of two industrial buildings
73
LEGEND
Figure 56 - 1st columns row shear check diagrams in Y direction: shear load (black), Sezen-Mohele
shear capacity (dark grey), Biskinis shear capacity sez. BB (grey), Biskinis shear capacity sez. AA
(light grey).
As showed in Figure 56, Sezen formula is more conservative than the Biskinis one. As
was expected, reduction in longitudinal reinforcement involves a clear fall in
resistance. The diagram shows that the 1_7 column, one of the two crane supporting
0
50
100
150
200
250
V [
kN
]
T ime [s]
Pil 1-1
0
50
100
150
200
250
V [
kN
]
T ime [s]
Pil 1-2
0
50
100
150
200
250
V [
kN
]
T ime [s]
Pil 1-3
0
50
100
150
200
250
V [
kN
]
T ime [s]
Pil 1-4
0
50
100
150
200
250
V [
kN
]
T ime [s]
Pil 1-5
0
50
100
150
200
250
V [
kN
]
T ime [s]
Pil 1-6
0
50
100
150
200
250
V [
kN
]
T ime [s]
Pil 1-7
0
50
100
150
200
250
V [
kN
]
T ime [s]
Pil 1-8
0
50
100
150
200
250
V [
kN
]
T ime [s]
Pil 1-9
0
50
100
150
200
250
V [
kN
]
T ime [s]
Pil 1-1
0
50
100
150
200
250
V [
kN
]
T ime [s]
Pil 1-2
0
50
100
150
200
250
V [
kN
]
T ime [s]
Pil 1-3
0
50
100
150
200
250
V [
kN
]
T ime [s]
Pil 1-4
0
50
100
150
200
250
V [
kN
]
T ime [s]
Pil 1-5
0
50
100
150
200
250
V [
kN
]
T ime [s]
Pil 1-6
0
50
100
150
200
250
V [
kN
]
T ime [s]
Pil 1-7
0
50
100
150
200
250
V [
kN
]
T ime [s]
Pil 1-8
0
50
100
150
200
250
V [
kN
]
T ime [s]
Pil 1-9
VrdS&M
VrdB sez BB
VrdB sez AA
Ved
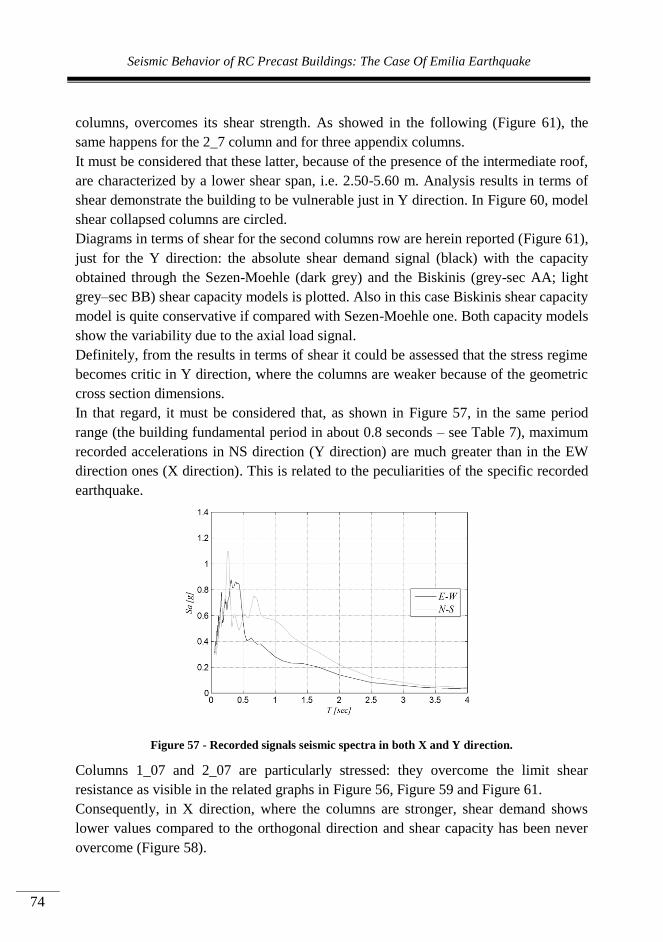
Seismic Behavior of RC Precast Buildings: The Case Of Emilia Earthquake
74
columns, overcomes its shear strength. As showed in the following (Figure 61), the
same happens for the 2_7 column and for three appendix columns.
It must be considered that these latter, because of the presence of the intermediate roof,
are characterized by a lower shear span, i.e. 2.50-5.60 m. Analysis results in terms of
shear demonstrate the building to be vulnerable just in Y direction. In Figure 60, model
shear collapsed columns are circled.
Diagrams in terms of shear for the second columns row are herein reported (Figure 61),
just for the Y direction: the absolute shear demand signal (black) with the capacity
obtained through the Sezen-Moehle (dark grey) and the Biskinis (grey-sec AA; light
grey–sec BB) shear capacity models is plotted. Also in this case Biskinis shear capacity
model is quite conservative if compared with Sezen-Moehle one. Both capacity models
show the variability due to the axial load signal.
Definitely, from the results in terms of shear it could be assessed that the stress regime
becomes critic in Y direction, where the columns are weaker because of the geometric
cross section dimensions.
In that regard, it must be considered that, as shown in Figure 57, in the same period
range (the building fundamental period in about 0.8 seconds – see Table 7), maximum
recorded accelerations in NS direction (Y direction) are much greater than in the EW
direction ones (X direction). This is related to the peculiarities of the specific recorded
earthquake.
Figure 57 - Recorded signals seismic spectra in both X and Y direction.
Columns 1_07 and 2_07 are particularly stressed: they overcome the limit shear
resistance as visible in the related graphs in Figure 56, Figure 59 and Figure 61.
Consequently, in X direction, where the columns are stronger, shear demand shows
lower values compared to the orthogonal direction and shear capacity has been never
overcome (Figure 58).

Analysis of the seismic performance of two industrial buildings
75
Figure 58 - Time history MRN analysis results: shear check in EW direction.
Figure 59 - Time history MRN analysis results: shear check in NS direction.
Figure 60 - Checks in terms of shear: shear failures in NS direction.

Seismic Behavior of RC Precast Buildings: The Case Of Emilia Earthquake
76
LEGEND
Figure 61 – 2nd columns row shear check diagrams in Y direction: shear load (black), Sezen-Mohele
shear capacity (dark grey), Biskinis shear capacity sez. BB (grey), Biskinis shear capacity sez. AA
(light grey).
In order to make a constructive comparison between different shear capacity models,
another shear capacity value is considered with the software Response 2000 (Bentz and
Collins, 2000). This software is based on the Modified Compression Field Theory by
0
50
100
150
200
250
V [
kN
]
T ime [s]
Pil 2-1
0
50
100
150
200
250
V [
kN
]
T ime [s]
Pil 2-2
0
50
100
150
200
250
V [
kN
]
T ime [s]
Pil 2-3
0
50
100
150
200
250
V [
kN
]
T ime [s]
Pil 2-4
0
50
100
150
200
250
V [
kN
]
T ime [s]
Pil 2-5
0
50
100
150
200
250
V [
kN
]
T ime [s]
Pil 2-6
0
50
100
150
200
250
V [
kN
]
T ime [s]
Pil 2-7
0
50
100
150
200
250
V [
kN
]
T ime [s]
Pil 2-8
0
50
100
150
200
250
V [
kN
]
T ime [s]
Pil 2-9
0
50
100
150
200
250
V [
kN
]
T ime [s]
Pil 1-1
0
50
100
150
200
250
V [
kN
]
T ime [s]
Pil 1-2
0
50
100
150
200
250
V [
kN
]
T ime [s]
Pil 1-3
0
50
100
150
200
250
V [
kN
]
T ime [s]
Pil 1-4
0
50
100
150
200
250
V [
kN
]
T ime [s]
Pil 1-5
0
50
100
150
200
250
V [
kN
]
T ime [s]
Pil 1-6
0
50
100
150
200
250
V [
kN
]
T ime [s]
Pil 1-7
0
50
100
150
200
250
V [
kN
]
T ime [s]
Pil 1-8
0
50
100
150
200
250
V [
kN
]
T ime [s]
Pil 1-9
VrdS&M
VrdB sez BB
VrdB sez AA
Ved

Analysis of the seismic performance of two industrial buildings
77
Vecchio and Collins (Vecchio and Collins, 1986b). The MCFT allows to predict the
response of RC elements subjected to in-plane shear and axial stresses just using
equilibrium conditions, compatibility requirements and stress-strain relationships, all
expressed in terms of average strains. In the shear capacity evaluation, the Vecchio and
Collins formulation takes into account the contribute of shear friction between cracks.
In fact, according to the method, the concrete contribution to the global shear element
strength is given by tensile stresses acting across diagonal cracks: this value is
determined by the aggregate interlock forces. Roughly, shear stress between cracks
depends on cracks width, as well as on concrete strength and aggregate size.
Based on this assumptions, Response 2000 makes possible to analyze reinforced
concrete elements subjected to axial force, shear and moment, starting from simple
input values. In particular, the software does the sectional analysis of concrete elements
starting from the cross section geometric and mechanic features. It also allows to make
incremental analysis. The principal software assumptions are the validity of plane
sections law (compatibility), and the absence of transverse clamping stress across the
depth of the beam.
Response2000 allows making both flexural and shear analysis on beam segments. In
each case, as the software is a sectional analysis tool, the appropriate section to verify
has to be chosen. Hence, on the bases of experimental evidence for the case study
facility, shear analysis of 2_07 column is carried out considering the column breaking
section (i.e. sec. BB in Figure 55). Thus, the base constraint has been defined as fixed
end. As mentioned above, the software needs a unique axial force value in the input
phase. So, in order to estimate the Response2000 shear strength of the 2_07 column,
the minimum and maximum axial values obtained from the analysis are considered.
Therefore, the section characterized by the reduction in longitudinal reinforcement has
been evaluated just in the Y direction (column weaker direction). Because of the
reduction in rebar amount, the cross section is characterized by 8 Ø20 longitudinal
bars. Mechanical characteristics of concrete and steel are also implemented (Figure
62). Basically, a five meters RC element has been considered, subjected to incremental
horizontal forces.
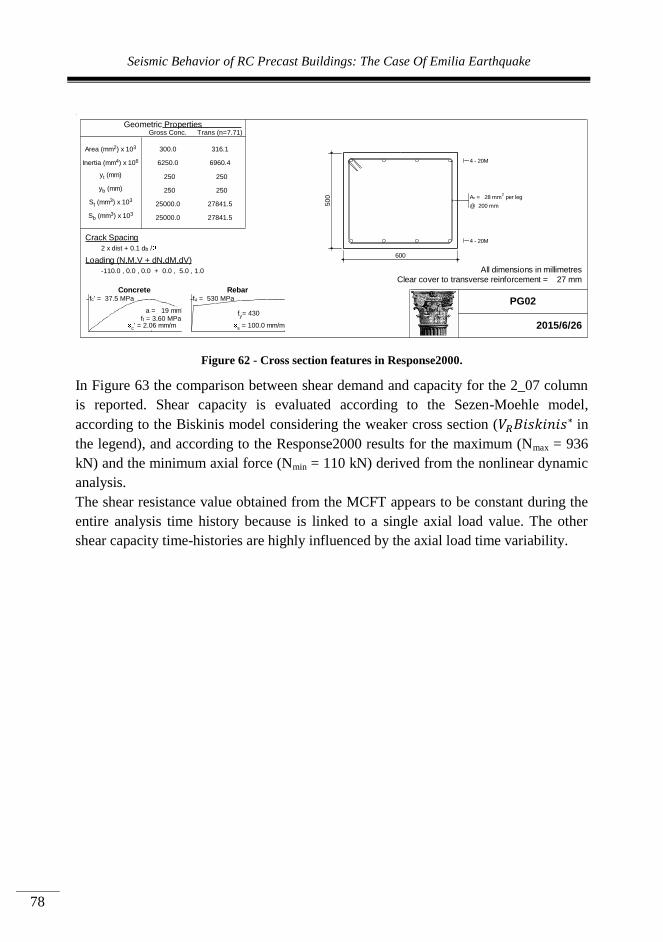
Seismic Behavior of RC Precast Buildings: The Case Of Emilia Earthquake
78
Figure 62 - Cross section features in Response2000.
In Figure 63 the comparison between shear demand and capacity for the 2_07 column
is reported. Shear capacity is evaluated according to the Sezen-Moehle model,
according to the Biskinis model considering the weaker cross section ( in
the legend), and according to the Response2000 results for the maximum (Nmax = 936
kN) and the minimum axial force (Nmin = 110 kN) derived from the nonlinear dynamic
analysis.
The shear resistance value obtained from the MCFT appears to be constant during the
entire analysis time history because is linked to a single axial load value. The other
shear capacity time-histories are highly influenced by the axial load time variability.
PG02
2015/6/26
All dimensions in millimetres
Clear cover to transverse reinforcement = 27 mm
Inertia (mm4) x 106
Area (mm2) x 103
yt (mm)
yb (mm)
St (mm3) x 103
Sb (mm3) x 103
300.0
6250.0
250
250
25000.0
25000.0
316.1
6960.4
250
250
27841.5
27841.5
Gross Conc. Trans (n=7.71)Geometric Properties
Crack Spacing
Loading (N,M,V + dN,dM,dV)
2 x dist + 0.1 db /
-110.0 , 0.0 , 0.0 + 0.0 , 5.0 , 1.0
600
500
4 - 20M
Av = 28 mm2 per leg
@ 200 mm
4 - 20M
Concrete
c' = 2.06 mm/m
fc' = 37.5 MPa
a = 19 mmft = 3.60 MPa
Rebar
s = 100.0 mm/m
fu = 530 MPa
fy= 430
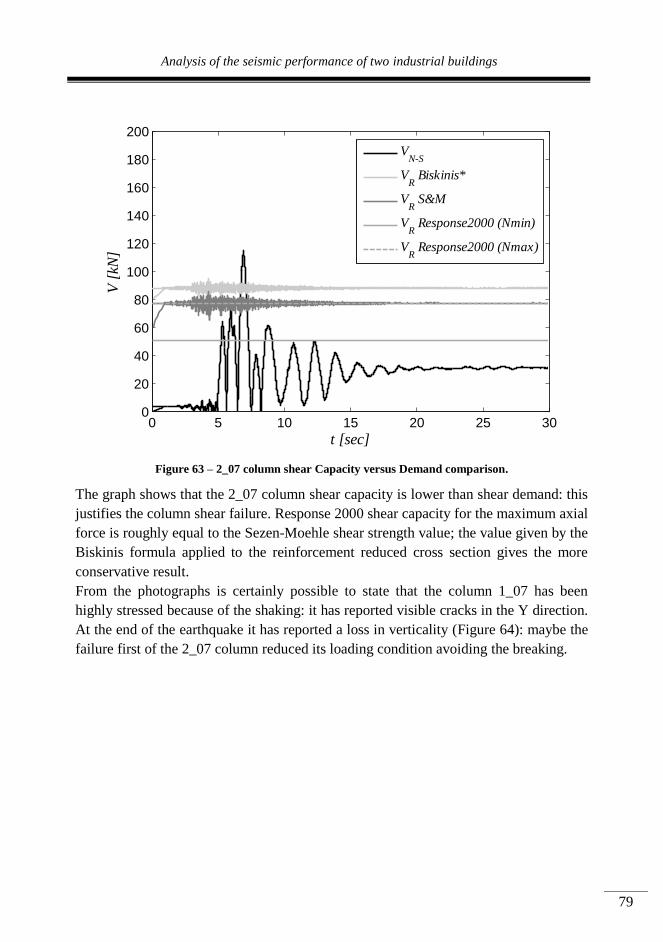
Analysis of the seismic performance of two industrial buildings
79
Figure 63 – 2_07 column shear Capacity versus Demand comparison.
The graph shows that the 2_07 column shear capacity is lower than shear demand: this
justifies the column shear failure. Response 2000 shear capacity for the maximum axial
force is roughly equal to the Sezen-Moehle shear strength value; the value given by the
Biskinis formula applied to the reinforcement reduced cross section gives the more
conservative result.
From the photographs is certainly possible to state that the column 1_07 has been
highly stressed because of the shaking: it has reported visible cracks in the Y direction.
At the end of the earthquake it has reported a loss in verticality (Figure 64): maybe the
failure first of the 2_07 column reduced its loading condition avoiding the breaking.
0 5 10 15 20 25 300
20
40
60
80
100
120
140
160
180
200
t [sec]
V [
kN]
VN-S
VR Biskinis*
VR S&M
VR Response2000 (Nmin)
VR Response2000 (Nmax)

Seismic Behavior of RC Precast Buildings: The Case Of Emilia Earthquake
80
Figure 64 - D2 building during the demolition phases: in the foreground on the right the 1_07
column.
Another important and useful feature of Response2000 is the capacity to predict the
crack pattern of the element. Hence, sectional analysis of AA section is carried on, in
order to compare the software prevision with the real crack pattern on the lower
column segment inferable from the photographs. In Figure 65 a comparison between
real damages suffered by the 2_07 column and Response 2000 cracks diagram is made.
It must be noted that the crack diagram is referred to the lower column segment, the
one characterized by the section AA features. The software crack pattern prevision
includes also the predicted angle and width of cracks in inches.
The cracks inclination seems to be compatible with the real crack pattern in the lower
column part. Thus, Response2000 cracks prediction show a compatibility with the real
damages.

Analysis of the seismic performance of two industrial buildings
81
(a)
(b)
Figure 65 - 2_07 column failure: comparison between real damages (a) and Response 2000 crack
prevision (b).
3.8 DI QUATTRO 1995 BUILDING
The inspection carried out shortly after the first Emilia mainshock exposed an evident
peculiarity: it has been highlighted as two typologically similar facilities, located a
short distance from one another, can have significantly different responses to the
earthquake. This paragraph introduces the second important case study of this thesis,
trying to give a reasonable explanation for the deep difference between the seismic
response of two similar buildings located in the same area.
3.8.1 STRUCTURAL DESCRIPTION AND TERRITORIAL CONTEXT
The Di Quattro 2 building (D2 building in the following, according to the convention
adopted in paragraph §2.3) is located in Mirandola (MO). It was built in 1995 in an
area not too far from the site that would be chosen for the construction, some years
later, of the D1 building. In fact, the distance between the facilities was equal to about
200 meters (Figure 66).
Cra
ck
Dia
gra
m
0.8
6
2.9
5
1.9
3
0.8
8

Seismic Behavior of RC Precast Buildings: The Case Of Emilia Earthquake
82
Figure 66 - Mirandola (MO) aerial view: D1(rectangular boundary) and D2 (circled boundary)
location.
D2 is a concrete precast industrial building, with a rectangular 50x20 meters plan,
characterized by a principal single-story area of about 800 mq and an intermediate roof
of about 200 mq in the western part of the whole building (Figure 67). The building
total height is 7.70 m. The structural layout is composed by principal 100x50 H beams
in the longitudinal direction, with shed roof tiles in the orthogonal direction. The
principal beams are supported by square 50x50 or 40x40 columns, 10 meters spaced in
the major direction, allocated in discrete socket foundations. Thirteen columns types
are used, characterized by different geometric issues.

Analysis of the seismic performance of two industrial buildings
83
Figure 67 - D2 plan taken from the building final design report.
Generally they are constituted by ∅20 longitudinal reinforcements and ∅6 stirrups
spaced each 200 mm in the central part of the column and 50 mm at the top. On the
superior face of each column are anchored threaded steel rods with a diameter of 20
mm, useful to obtain the design beam-to-column and beam-to-beam connections. In
fact, these steel bars have a predominantly constructive function, rather than structural.
As with the D1 building, also in this case the steel rods help to give stability to the
connections. Therefore, the bars positioned in the space between two consecutives
beams are locked on the top by a bolted steel plate. An integrative concrete casting
should assure the monolithic nature of the joint. All columns are characterized by ∅12
downpipe cast in the middle (Figure 68). The intermediate roof is composed by Greek-
pi roof tiles supported by secondary 60x70 T beams. The nature of intermediate roof
support is purely frictional, such as the shed roof tiles-to-beams connections. The
structural layout of the two-story building portion is completed by two 2.90 height
40x40 supporting columns. The outer cladding is made of horizontal panels. Concrete
equivalent to the present C35/45 has been used for the precast elements, while FeB44K
steel bars have been adopted for the elements reinforcement.
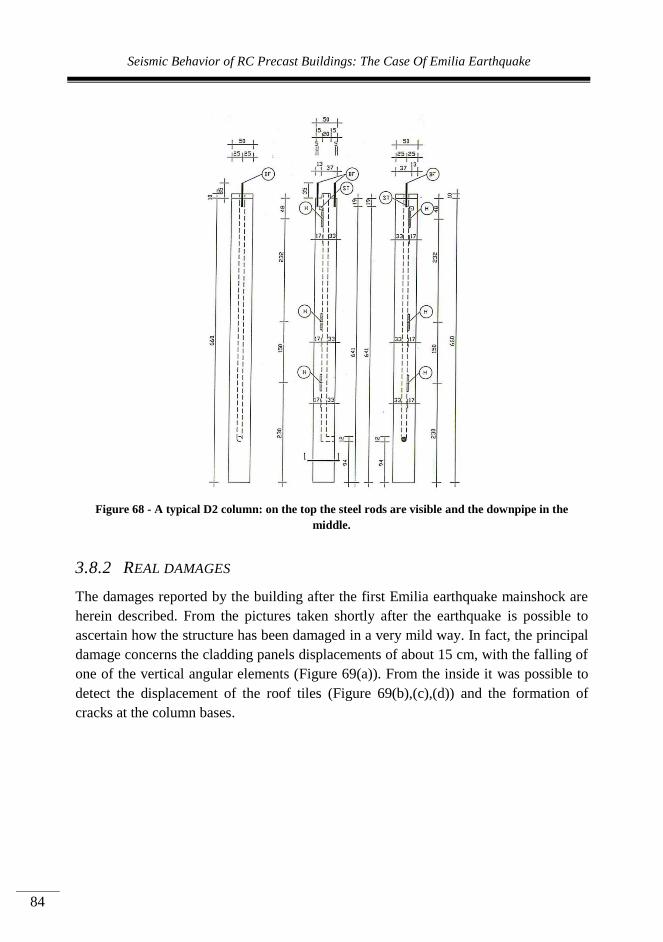
Seismic Behavior of RC Precast Buildings: The Case Of Emilia Earthquake
84
Figure 68 - A typical D2 column: on the top the steel rods are visible and the downpipe in the
middle.
3.8.2 REAL DAMAGES
The damages reported by the building after the first Emilia earthquake mainshock are
herein described. From the pictures taken shortly after the earthquake is possible to
ascertain how the structure has been damaged in a very mild way. In fact, the principal
damage concerns the cladding panels displacements of about 15 cm, with the falling of
one of the vertical angular elements (Figure 69(a)). From the inside it was possible to
detect the displacement of the roof tiles (Figure 69(b),(c),(d)) and the formation of
cracks at the column bases.
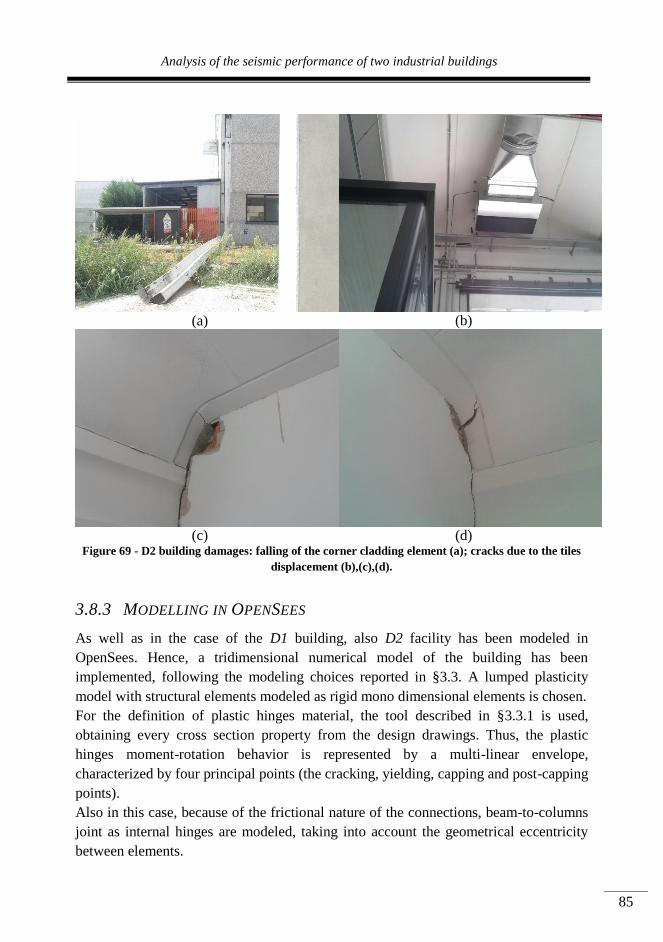
Analysis of the seismic performance of two industrial buildings
85
(a)
(b)
(c)
(d)
Figure 69 - D2 building damages: falling of the corner cladding element (a); cracks due to the tiles
displacement (b),(c),(d).
3.8.3 MODELLING IN OPENSEES
As well as in the case of the D1 building, also D2 facility has been modeled in
OpenSees. Hence, a tridimensional numerical model of the building has been
implemented, following the modeling choices reported in §3.3. A lumped plasticity
model with structural elements modeled as rigid mono dimensional elements is chosen.
For the definition of plastic hinges material, the tool described in §3.3.1 is used,
obtaining every cross section property from the design drawings. Thus, the plastic
hinges moment-rotation behavior is represented by a multi-linear envelope,
characterized by four principal points (the cracking, yielding, capping and post-capping
points).
Also in this case, because of the frictional nature of the connections, beam-to-columns
joint as internal hinges are modeled, taking into account the geometrical eccentricity
between elements.
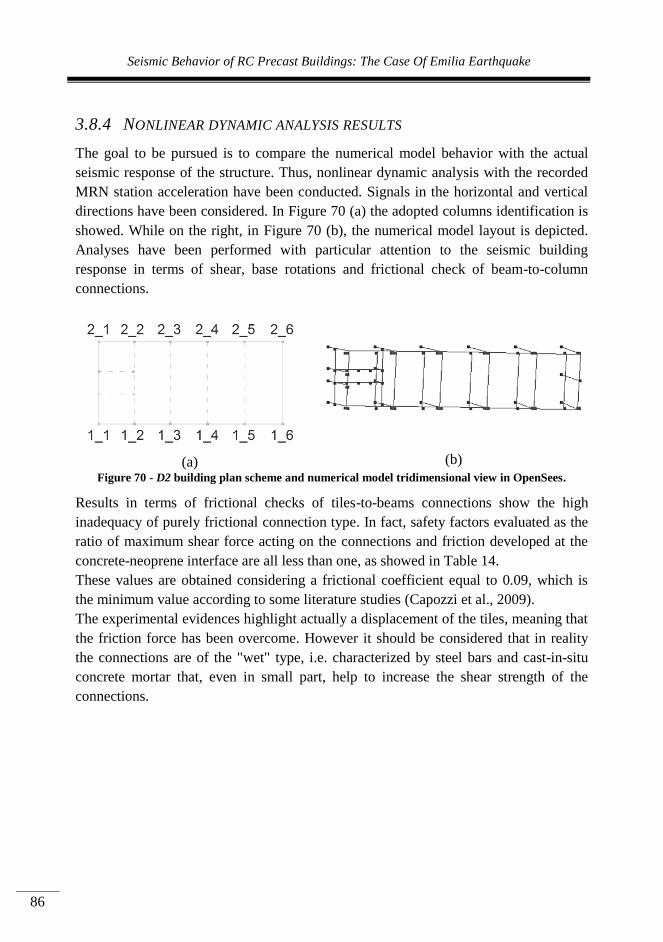
Seismic Behavior of RC Precast Buildings: The Case Of Emilia Earthquake
86
3.8.4 NONLINEAR DYNAMIC ANALYSIS RESULTS
The goal to be pursued is to compare the numerical model behavior with the actual
seismic response of the structure. Thus, nonlinear dynamic analysis with the recorded
MRN station acceleration have been conducted. Signals in the horizontal and vertical
directions have been considered. In Figure 70 (a) the adopted columns identification is
showed. While on the right, in Figure 70 (b), the numerical model layout is depicted.
Analyses have been performed with particular attention to the seismic building
response in terms of shear, base rotations and frictional check of beam-to-column
connections.
(a)
(b)
Figure 70 - D2 building plan scheme and numerical model tridimensional view in OpenSees.
Results in terms of frictional checks of tiles-to-beams connections show the high
inadequacy of purely frictional connection type. In fact, safety factors evaluated as the
ratio of maximum shear force acting on the connections and friction developed at the
concrete-neoprene interface are all less than one, as showed in Table 14.
These values are obtained considering a frictional coefficient equal to 0.09, which is
the minimum value according to some literature studies (Capozzi et al., 2009).
The experimental evidences highlight actually a displacement of the tiles, meaning that
the friction force has been overcome. However it should be considered that in reality
the connections are of the "wet" type, i.e. characterized by steel bars and cast-in-situ
concrete mortar that, even in small part, help to increase the shear strength of the
connections.
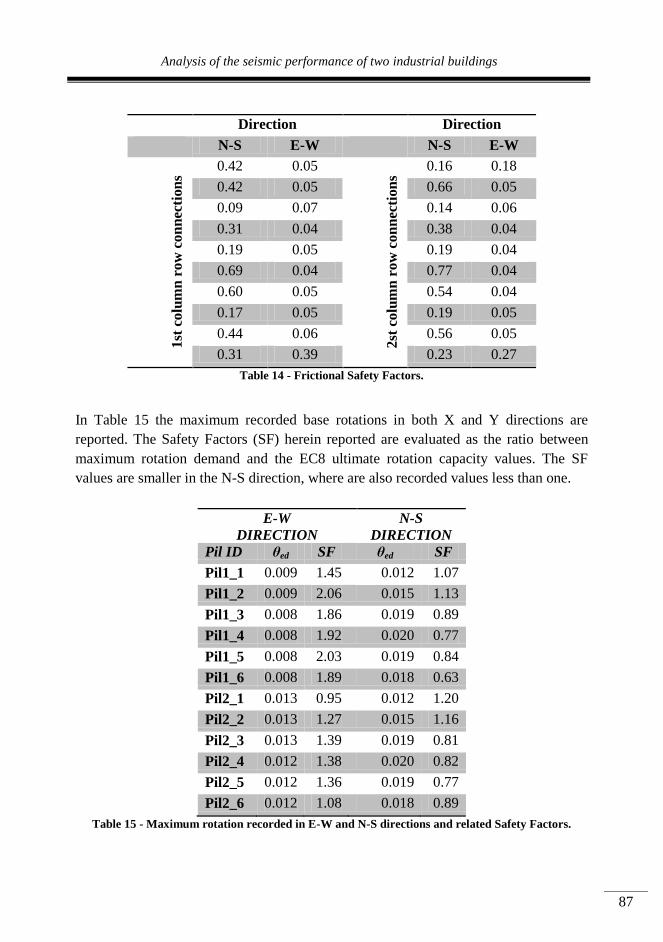
Analysis of the seismic performance of two industrial buildings
87
Direction Direction
N-S E-W N-S E-W
1st
colu
mn
row
co
nn
ecti
on
s 0.42 0.05
2st
colu
mn
row
co
nn
ecti
on
s
0.16 0.18
0.42 0.05 0.66 0.05
0.09 0.07 0.14 0.06
0.31 0.04 0.38 0.04
0.19 0.05 0.19 0.04
0.69 0.04 0.77 0.04
0.60 0.05 0.54 0.04
0.17 0.05 0.19 0.05
0.44 0.06 0.56 0.05
0.31 0.39 0.23 0.27
Table 14 - Frictional Safety Factors.
In Table 15 the maximum recorded base rotations in both X and Y directions are
reported. The Safety Factors (SF) herein reported are evaluated as the ratio between
maximum rotation demand and the EC8 ultimate rotation capacity values. The SF
values are smaller in the N-S direction, where are also recorded values less than one.
E-W
DIRECTION
N-S
DIRECTION
Pil ID θed SF θed SF
Pil1_1 0.009 1.45 0.012 1.07
Pil1_2 0.009 2.06 0.015 1.13
Pil1_3 0.008 1.86 0.019 0.89
Pil1_4 0.008 1.92 0.020 0.77
Pil1_5 0.008 2.03 0.019 0.84
Pil1_6 0.008 1.89 0.018 0.63
Pil2_1 0.013 0.95 0.012 1.20
Pil2_2 0.013 1.27 0.015 1.16
Pil2_3 0.013 1.39 0.019 0.81
Pil2_4 0.012 1.38 0.020 0.82
Pil2_5 0.012 1.36 0.019 0.77
Pil2_6 0.012 1.08 0.018 0.89
Table 15 - Maximum rotation recorded in E-W and N-S directions and related Safety Factors.
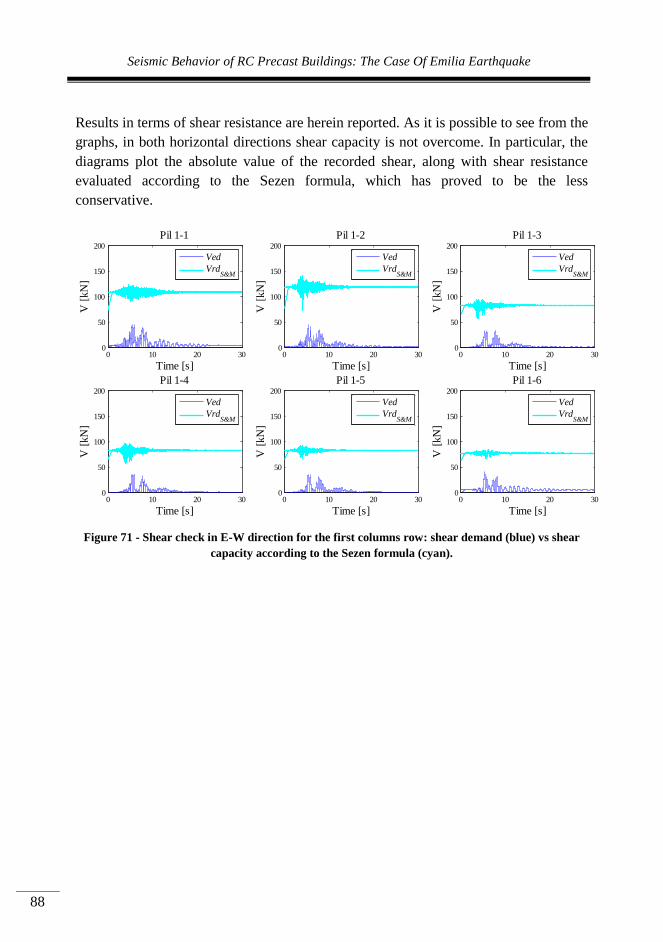
Seismic Behavior of RC Precast Buildings: The Case Of Emilia Earthquake
88
Results in terms of shear resistance are herein reported. As it is possible to see from the
graphs, in both horizontal directions shear capacity is not overcome. In particular, the
diagrams plot the absolute value of the recorded shear, along with shear resistance
evaluated according to the Sezen formula, which has proved to be the less
conservative.
Figure 71 - Shear check in E-W direction for the first columns row: shear demand (blue) vs shear
capacity according to the Sezen formula (cyan).
0 10 20 300
50
100
150
200
V [
kN
]
Time [s]
Pil 1-1
Ved
VrdS&M
0 10 20 300
50
100
150
200
V [
kN
]
Time [s]
Pil 1-2
Ved
VrdS&M
0 10 20 300
50
100
150
200
V [
kN
]
Time [s]
Pil 1-3
Ved
VrdS&M
0 10 20 300
50
100
150
200
V [
kN
]
Time [s]
Pil 1-4
Ved
VrdS&M
0 10 20 300
50
100
150
200
V [
kN
]
Time [s]
Pil 1-5
Ved
VrdS&M
0 10 20 300
50
100
150
200
V [
kN
]
Time [s]
Pil 1-6
Ved
VrdS&M

Analysis of the seismic performance of two industrial buildings
89
Figure 72 - Shear check in N-S direction for the first columns row: shear demand (blue) vs shear
capacity according to the Sezen formula (cyan).
Figure 73 - Figure 54 - Shear check in E-W direction for the second columns row: shear demand
(blue) vs shear capacity according to the Sezen formula (cyan).
0 10 20 300
50
100
150
200
V [
kN
]
Time [s]
Pil 1-1
Ved
VrdS&M
0 10 20 300
50
100
150
200
V [
kN
]Time [s]
Pil 1-2
Ved
VrdS&M
0 10 20 300
50
100
150
200
V [
kN
]
Time [s]
Pil 1-3
Ved
VrdS&M
0 10 20 300
50
100
150
200
V [
kN
]
Time [s]
Pil 1-4
Ved
VrdS&M
0 10 20 300
50
100
150
200
V [
kN
]
Time [s]
Pil 1-5
Ved
VrdS&M
0 10 20 300
50
100
150
200
V [
kN
]
Time [s]
Pil 1-6
Ved
VrdS&M
0 10 20 300
50
100
150
200
V [
kN
]
Time [s]
Pil 2-1
Ved
VrdS&M
0 10 20 300
50
100
150
200
V [
kN
]
Time [s]
Pil 2-2
Ved
VrdS&M
0 10 20 300
50
100
150
200
V [
kN
]
Time [s]
Pil 2-3
Ved
VrdS&M
0 10 20 300
50
100
150
200
V [
kN
]
Time [s]
Pil 2-4
Ved
VrdS&M
0 10 20 300
50
100
150
200
V [
kN
]
Time [s]
Pil 2-5
Ved
VrdS&M
0 10 20 300
50
100
150
200
V [
kN
]
Time [s]
Pil 2-6
Ved
VrdS&M

Seismic Behavior of RC Precast Buildings: The Case Of Emilia Earthquake
90
Figure 74 - Figure 54 - Shear check in N-S direction for the second columns row: shear demand
(blue) vs shear capacity according to the Sezen formula (cyan).
The obtained results seem to be consistent with the experimental evidence. In fact, the
facility did not show brittle crisis, but cracks at the column bases: this is supported by
the analysis results. In addition, the fall of the cladding corner element, as well as the
internal cracks visible between roof tiles are linked to displacements caused by the
inadequacy of frictional connections.
3.8.5 CASE STUDIES RESULTS COMPARISON
Comparison between D1 and D2 buildings analyses results is here reported. The
importance of this evaluation lies in the attempt to justify the real behavior of the
structures. As explained in §3.8.1, D1 and D2 buildings were located 200 meters apart.
They were characterized by the same plan orientation. Therefore it is absolutely
legitimate to ask why they showed different behaviors afterwards the same earthquake.
The question is further supported by the fact that the two facilities are not only both
characterized by the same structural typology, but have been designed and built by the
same prefabrication company. This means that the concrete precast elements have been
produced with the same constructive details, and have been assembled together
following the same construction technique. The first important note concerns the fact
that, although the two buildings were built almost 10 years apart, from the design point
of view there is no difference. The most recent one, built in 2004, in contrast to the
older, is regulated by the Italian DM 16/01/1996 - Technical standards for construction
0 10 20 300
50
100
150
200
V [
kN
]
Time [s]
Pil 2-1
Ved
VrdS&M
0 10 20 300
50
100
150
200
V [
kN
]Time [s]
Pil 2-2
Ved
VrdS&M
0 10 20 300
50
100
150
200
V [
kN
]
Time [s]
Pil 2-3
Ved
VrdS&M
0 10 20 300
50
100
150
200
V [
kN
]
Time [s]
Pil 2-4
Ved
VrdS&M
0 10 20 300
50
100
150
200
V [
kN
]
Time [s]
Pil 2-5
Ved
VrdS&M
0 10 20 300
50
100
150
200
V [
kN
]
Time [s]
Pil 2-6
Ved
VrdS&M

Analysis of the seismic performance of two industrial buildings
91
in seismic zones. According to the considerations reported in the second chapter of the
present thesis, at the time of the D2 building design, the site of construction resulted
already inserted in seismic zone 3. However, as already mentioned previously, because
of this seismic zonation becomes mandatory only after 23th October 2005, no seismic
resistance features have been applied. The loads analysis differs for the presence, in the
most recent facility, of the wind actions, evaluated as vertical actions. From a
geometrical point of view, the D2 building appears to be much larger than the other. In
fact, the plan area is four times larger. This explains the choice of larger elements, able
to cover high spans equal to about 22 meters. D2 building’s roof was in fact
characterized by 100 cm high tiles. In the case of D1 roof, elements 70 cm high have
been adopted.
(a)
(b) Figure 75 - Roof tiles adopted for D1(a) and D2(b) buildings.
Principal beams adopted as tiles support have to cover roughly the same spans (i.e. 10
meters) for the two buildings. D1 principal beams are H 100 cm high cross section
beams (Figure 76). For D2 building, principal beams were 70x50 rectangular beams.

Seismic Behavior of RC Precast Buildings: The Case Of Emilia Earthquake
92
Figure 76 - D1 facility H cross section principal beams.
As regards the column, in the case of D1 building only 50x50 cross section elements
have been used, while D2 building was characterized by both square and rectangular
cross section columns. For both cases, the designer used the same reinforcement bar
diameters and the same stirrups spacing. Also the longitudinal reinforcement reduction
is present in both structures. The two case-study buildings are characterized by an
intermediate roof which partially cover the whole plan. The presence of an “L”
appendix in the case of D2 building make it plan-irregular. In the following table a
comparison between D1 and D2 building features is reported.
D1 building D2 building
Year of Building 1995 2004
Design Code D.M. 14/02/1992 D.M. 16/01/1996
Plan [m] 50x20 90x45
Maximum Span [m] 19.5 22
Total Height [m] 7.70 8.80
Roof tiles V-shaped beams
(h=70)
V-shaped beams
(h=100)
Principal beams H beams (h=100) 50x70 beams
Columns 50x50 50x50; 50x60
Long. bar diameter
[mm]
20 20
Stirrups 6/20" 6/20"
Table 16 - Main D1 and D2 buildings general features.
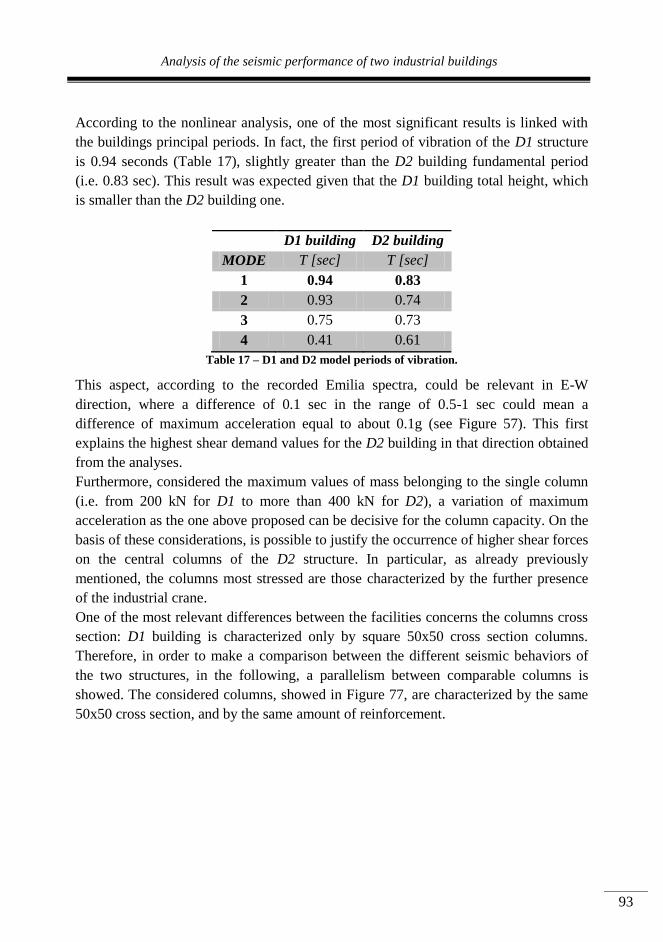
Analysis of the seismic performance of two industrial buildings
93
According to the nonlinear analysis, one of the most significant results is linked with
the buildings principal periods. In fact, the first period of vibration of the D1 structure
is 0.94 seconds (Table 17), slightly greater than the D2 building fundamental period
(i.e. 0.83 sec). This result was expected given that the D1 building total height, which
is smaller than the D2 building one.
D1 building D2 building
MODE T [sec] T [sec]
1 0.94 0.83
2 0.93 0.74
3 0.75 0.73
4 0.41 0.61
Table 17 – D1 and D2 model periods of vibration.
This aspect, according to the recorded Emilia spectra, could be relevant in E-W
direction, where a difference of 0.1 sec in the range of 0.5-1 sec could mean a
difference of maximum acceleration equal to about 0.1g (see Figure 57). This first
explains the highest shear demand values for the D2 building in that direction obtained
from the analyses.
Furthermore, considered the maximum values of mass belonging to the single column
(i.e. from 200 kN for D1 to more than 400 kN for D2), a variation of maximum
acceleration as the one above proposed can be decisive for the column capacity. On the
basis of these considerations, is possible to justify the occurrence of higher shear forces
on the central columns of the D2 structure. In particular, as already previously
mentioned, the columns most stressed are those characterized by the further presence
of the industrial crane.
One of the most relevant differences between the facilities concerns the columns cross
section: D1 building is characterized only by square 50x50 cross section columns.
Therefore, in order to make a comparison between the different seismic behaviors of
the two structures, in the following, a parallelism between comparable columns is
showed. The considered columns, showed in Figure 77, are characterized by the same
50x50 cross section, and by the same amount of reinforcement.
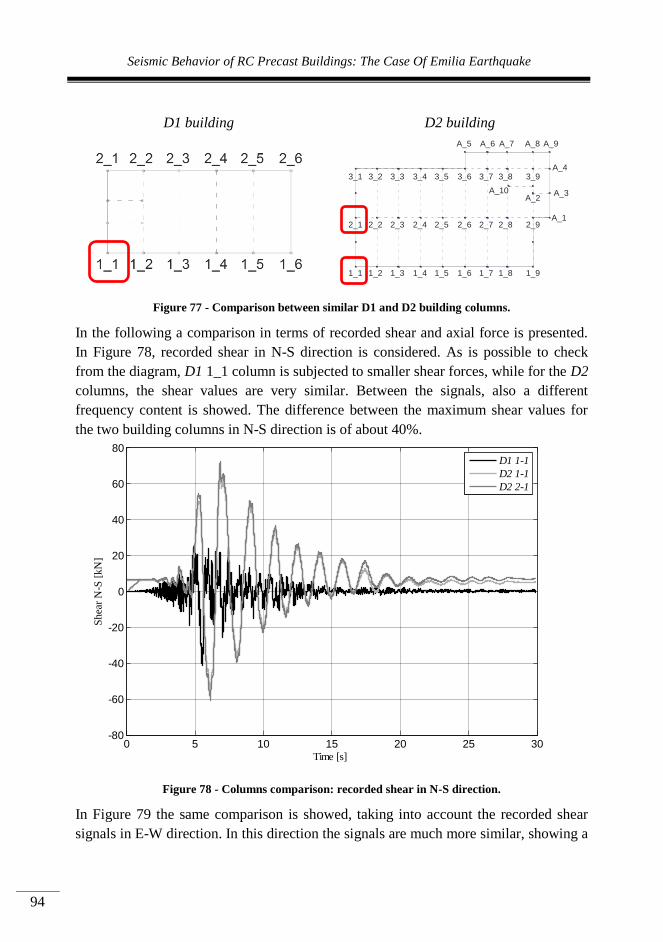
Seismic Behavior of RC Precast Buildings: The Case Of Emilia Earthquake
94
D1 building D2 building
Figure 77 - Comparison between similar D1 and D2 building columns.
In the following a comparison in terms of recorded shear and axial force is presented.
In Figure 78, recorded shear in N-S direction is considered. As is possible to check
from the diagram, D1 1_1 column is subjected to smaller shear forces, while for the D2
columns, the shear values are very similar. Between the signals, also a different
frequency content is showed. The difference between the maximum shear values for
the two building columns in N-S direction is of about 40%.
Figure 78 - Columns comparison: recorded shear in N-S direction.
In Figure 79 the same comparison is showed, taking into account the recorded shear
signals in E-W direction. In this direction the signals are much more similar, showing a
1_1 1_2 1_3 1_4 1_5 1_6 1_7 1_8 1_9
2_1 2_2 2_3 2_4 2_5 2_6 2_7 2_8 2_9
3_1 3_2 3_3 3_4 3_5 3_6 3_7 3_8 3_9
A_5 A_6 A_7 A_8 A_9
A_1
A_2A_3
A_4
A_10
0 5 10 15 20 25 30-80
-60
-40
-20
0
20
40
60
80
Time [s]
Sh
ear
N-S
[k
N]
D1 1-1
D2 1-1
D2 2-1
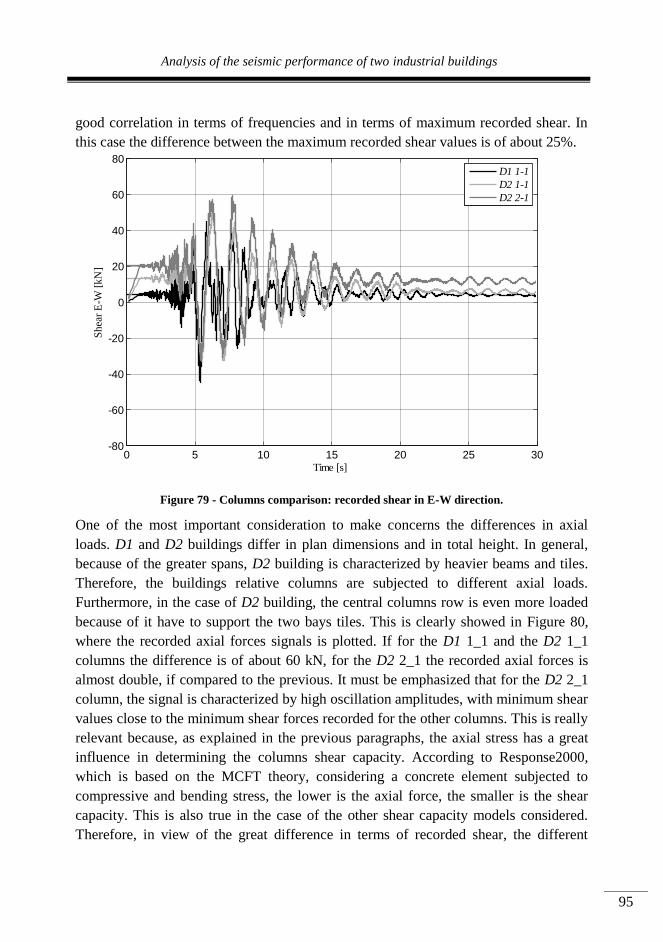
Analysis of the seismic performance of two industrial buildings
95
good correlation in terms of frequencies and in terms of maximum recorded shear. In
this case the difference between the maximum recorded shear values is of about 25%.
Figure 79 - Columns comparison: recorded shear in E-W direction.
One of the most important consideration to make concerns the differences in axial
loads. D1 and D2 buildings differ in plan dimensions and in total height. In general,
because of the greater spans, D2 building is characterized by heavier beams and tiles.
Therefore, the buildings relative columns are subjected to different axial loads.
Furthermore, in the case of D2 building, the central columns row is even more loaded
because of it have to support the two bays tiles. This is clearly showed in Figure 80,
where the recorded axial forces signals is plotted. If for the D1 1_1 and the D2 1_1
columns the difference is of about 60 kN, for the D2 2_1 the recorded axial forces is
almost double, if compared to the previous. It must be emphasized that for the D2 2_1
column, the signal is characterized by high oscillation amplitudes, with minimum shear
values close to the minimum shear forces recorded for the other columns. This is really
relevant because, as explained in the previous paragraphs, the axial stress has a great
influence in determining the columns shear capacity. According to Response2000,
which is based on the MCFT theory, considering a concrete element subjected to
compressive and bending stress, the lower is the axial force, the smaller is the shear
capacity. This is also true in the case of the other shear capacity models considered.
Therefore, in view of the great difference in terms of recorded shear, the different
0 5 10 15 20 25 30-80
-60
-40
-20
0
20
40
60
80
Time [s]
Sh
ear
E-W
[k
N]
D1 1-1
D2 1-1
D2 2-1

Seismic Behavior of RC Precast Buildings: The Case Of Emilia Earthquake
96
columns shear capacity is about the same. Hence, the D2 building columns had to
withstand great shear forces due to higher masses, with a shear capacity more
appropriate to lighter facilities such as the D1 building.
Figure 80 - Columns comparison: recorded axial forces.
3.8.6 D1 BUILDING CLADDING PANELS INFLUENCE
As the last starting point of reflection for this thesis, in this paragraph the influence of
the horizontal cladding panels on the seismic behavior of the D1 building numerical
model is studied. Its regularity and simplicity makes it a very common industrial
building model. Therefore, it seemed interesting to carry out this study. In particular, a
comparison has been made between the bare structure behavior and the infilled model
one.
(Ercolino et al., 2012) made an interesting study to assess the influence of vertical
cladding panels on the seismic behavior of precast buildings. A parametric study is
carried on considering a number of 288 case studies, in order to find a good correlation
between some important geometrical building features and the principal period of
vibration. Results of the study reveal a great influence of vertical cladding panels on
the vibration periods of the buildings: their influence results in a reduction of about
75%. Moreover, the study found out that the Italian code simplified formulas to
0 5 10 15 20 25 300
100
200
300
400
500
600
700
Time [s]
Axia
l F
orc
e [k
N]
D1 1-1
D2 1-1
D2 2-1

Analysis of the seismic performance of two industrial buildings
97
evaluate the principal vibration period seems to underestimate the bare buildings
period and highly overestimate the infilled structures one.
Hence, the influence of horizontal cladding panel on the seismic response of the
building is investigated. As widely explained above, cladding panels are anchored to
the building principal elements by means of steel corner braces, with bolt and nut
system (Figure 81).
Figure 81 - Cladding panels anchoring system.
These steel braces act as hooks and allow the panels anchoring. The anchor points are
located at the panels extremities, and coincide with the steel shelves positioned on the
concrete columns. An infill building model has been implemented in OpenSees (Figure
83). Panels are modeled as quadrangular element constituted by unidimensional beam
elements. The vertical elements as rigid beams have been implemented, while the
panels geometric and static features are associated to the horizontal segments. As it is
possible to verify from the photos and from the design drawings, the panels anchor
system is made of steel elements which inhibit slips and rotations. Generally, precast
beams and columns are produced with the predispositions for the panels anchoring.
Thus, the steel anchoring elements are an integral part of the structural concrete
elements.
Because of the importance of the constraints adopted to link the panels to the principal
building elements, two different constraint types are used: in the first case, the panels
are linked to the structure with constraints that do not allow relative slip between panel
and column (semi-rigid constraints), but only relative rotations out of the panel plane;
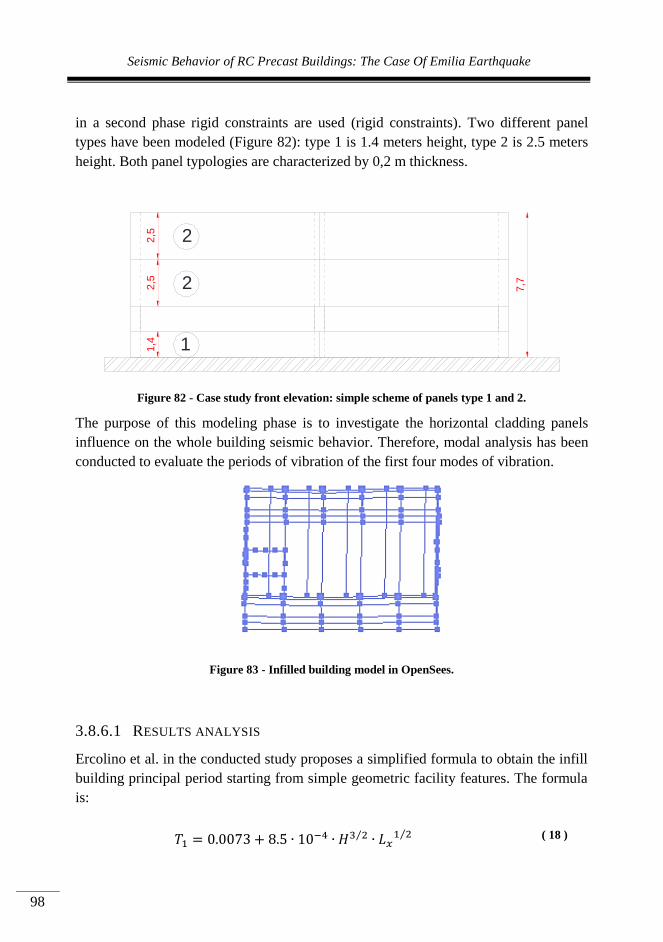
Seismic Behavior of RC Precast Buildings: The Case Of Emilia Earthquake
98
in a second phase rigid constraints are used (rigid constraints). Two different panel
types have been modeled (Figure 82): type 1 is 1.4 meters height, type 2 is 2.5 meters
height. Both panel typologies are characterized by 0,2 m thickness.
Figure 82 - Case study front elevation: simple scheme of panels type 1 and 2.
The purpose of this modeling phase is to investigate the horizontal cladding panels
influence on the whole building seismic behavior. Therefore, modal analysis has been
conducted to evaluate the periods of vibration of the first four modes of vibration.
Figure 83 - Infilled building model in OpenSees.
3.8.6.1 RESULTS ANALYSIS
Ercolino et al. in the conducted study proposes a simplified formula to obtain the infill
building principal period starting from simple geometric facility features. The formula
is:
⁄ ⁄ ( 18 )
7,7
1,4
2,5
2,5 2
2
1

Analysis of the seismic performance of two industrial buildings
99
where is the building total height and is the principal plan dimension of the
building.
For the considered building, the formula proposed by Ercolino et al. gives a principal
vibration period equal to 0.09 seconds. However it must be considered that the
proposed formula has been calibrated considering vertical cladding panels.
In Table 18 the modal analysis results are reported. The results obtained using rigid
constraints are compatible with the Ercolino et al. proposed formula for the principal
period of vibration. Semi-rigid constraints result in the same principal vibration period,
with a sensible reduction for the second, third and fourth vibration periods.
BARE
STRUCTURE
SEMI-RIGID
CONTRAINTS
RIGID
CONSTRAINTS
MODES T [sec]
1 0.83 0.83 0.10
2 0.74 0.36 0.10
3 0.73 0.27 0.10
4 0.61 0.27 0.09
Table 18 - Modal analysis results for the base structure and for the infill model structure.
As already mentioned above, this could be a preliminary study for future
developments, such as the study of a numerical model capable of predicting panels
collapse due to the earthquake.
3.8.7 REFERENCES
Bentz E (2001) Response-2000, Shell-2000, Triax-2000, Membrane-2000 User
Manual. Canada
Bentz E, Collins M (2000) Response-2000, Software Program for Load-Deformation
Response of Reinforced Concrete Section.
Biskinis DE RG, Fardis MN (2004) Degradation of shear strength of reinforced
concrete members with inelastic cyclic displacement. ACI Structural Journal
101 (6):773-783
Capozzi V, Magliulo G, Manfredi G (2009) Resistenza a taglio delle connessioni trave-
pilastro spinottate nelle strutture prefabbricate. Industrie Manufatti Cementizi
5 (9)
Casarotti C, Pinho R (2007) An adaptive capacity spectrum method for assessment of
bridges subjected to earthquake action. Bulletin of Earthquake Engineering 5
(3):377-390
Seismic Behavior of RC Precast Buildings: The Case Of Emilia Earthquake
100
Chopra AK, Goel RK (2004) A modal pushover analysis procedure to estimate seismic
demands for unsymmetric‐plan buildings. Earthquake Engineering &
Structural Dynamics 33 (8):903-927
CNR (1986) Apparecchi d'appoggio in gomma e PTFE nelle costruzioni (CNR
10018/85). Consiglio Nazionale delle Ricerche, Roma
Committee A Building code requirements for structural concrete (ACI 318-05) and
commentary (ACI 318R-05). In, 2005. American Concrete Institute,
CS.LL.PP. (2008) DM 14 Gennaio 2008: Norme tecniche per le costruzioni. vol 29.
Gazzetta Ufficiale della Repubblica Italiana,
CS.LL.PP. (2009) Istruzioni per l’applicazione delle norme tecniche delle costruzioni.
vol 47. Gazzetta Ufficiale della Repubblica Italiana,
De Luca F. VGM (2012) A practice-oriented approach for the assessment of brittle
failures in existing reinforced concrete elements. Engineering Structures
48:373-388. doi:10.1016/j.engstruct.2012.09.038
Ercolino M, Capozzi V, Magliulo G, Manfredi G Influence of cladding panels on
dynamic behavior of one-storey precast buildings. In: OpenSees Days, 2012.
Fajfar P (2000) A nonlinear analysis method for performance-based seismic design.
Earthquake Spectra 16 (3):573-592
Fajfar P, Gašperšič P (1996) The N2 method for the seismic damage analysis of RC
buildings. Earthquake Engineering & Structural Dynamics 25 (1):31-46
Fajfar P, Kilar V, Marusic D, Perus I, Magliulo G The extension of the N2 method to
asymmetric buildings. In: Proceedings of the 4th European workshop on the
seismic behaviour of irregular and complex structures, 2005a. vol 41.
Fajfar P, Marušić D, Peruš I (2005b) Torsional effects in the pushover-based seismic
analysis of buildings. Journal of Earthquake Engineering 9 (06):831-854
Fardis MN BD (2003) Deformation capacity of RC members, as controlled by flexure
or shear. Paper presented at the Kabeyasawa T, Shiohara H (eds) Performance-
based engineering for earthquake resistant reinforced concrete structures: a
volume honoring Shunsuke Otani, University of Tokyo, 8–9 September 2003
Fischinger M, Kramar M, Isaković T (2008) Cyclic response of slender RC columns
typical of precast industrial buildings. Bulletin of Earthquake Engineering 6
(3):519-534
Fujii K (2011) Nonlinear static procedure for multi-story asymmetric frame buildings
considering bi-directional excitation. Journal of Earthquake Engineering 15
(2):245-273
Hakuto S Seismic performance of reinforced concrete columns with 90 degree end
hooks for shear reinforcement under high speed loading. In: Proceedings of the
Twelfth World Conference on Earthquake Engineering. Auckland, New
Zealand, 2000. pp 1-7
Haselton CB (2006) Assessing seismic collapse safety of modern reinforced concrete
moment frame buildings. Stanford University,
Ibarra L.F. MRA, and Krawinkler H. (2005) Hysteretic models that incorporate
strength and stiffness deterioration. Earthquake Engineering and Structural
Dynamics 34 (12):1489-1511
Analysis of the seismic performance of two industrial buildings
101
Iervolino I, Galasso, C., Cosenza, E. (2010) REXEL: computer aided record selection
for code-based seismic structural analysis. Bulletin of Earthquake Engineering
8:339-362. doi:10.1007/s10518-009-9146-1
Data Base of the Italian strong motion data (2009) http://itaca.mi.ingv.it.
Lejano B, Shirai N, Adachi H, Ono A, Amitu S Deformation properties and shear
resistance mechanism of reinforced concrete column with high and fluctuating
axial force. In: Earthquake Engineering, Tenth World Conference, Balkema,
Rotterdam. Taylor & Francis, 1992. pp 3007-3012
Lo Presti D, Sassu M, Luzi L, Pacor F, Castaldini D, Tosatti G, Claudia C, Zizioli D,
Zucca F, Rossi G (2013) A Report On The 2012 Seismic Sequence In Emilia
(Northern Italy).
Lombardi D. BS (2014) Liquefaction of soil in the Emilia-Romagna region after the
2012 Northern Italy earthquake sequence. Natural Hazards 73 (3):1749-1770
doi:10.1007/s11069-014-1168-6
Magliulo G, Ercolino M, Petrone C, Coppola O, Manfredi G (2014) The Emilia
Earthquake: Seismic Performance of Precast Reinforced Concrete Buildings.
Earthquake Spectra 30 (2):891-912. doi:doi:10.1193/091012EQS285M
Magliulo G, Maddaloni G, Cosenza E (2007) Comparison between non-linear dynamic
analysis performed according to EC8 and elastic and non-linear static analyses.
Engineering Structures 29 (11):2893-2900.
doi:http://dx.doi.org/10.1016/j.engstruct.2007.01.027
Magliulo G, Maddaloni G, Cosenza E (2012) Extension of N2 method to plan irregular
buildings considering accidental eccentricity. Soil Dynamics and Earthquake
Engineering 43:69-84
Mander JB PM, Park R (1988) Theoretical stress–strain model for confined concrete. J
Struct Eng 114 (8):1804–1826
MathWorks T (2004) Matlab. The MathWorks, Natick, MA
Nakamura Y, Magenes G, Griffith M Comparison of pushover methods for simple
building systems with flexible diaphragms. In: Australian Earthquake
Engineering Society Conference (21 Nov 2014-23 Nov 2014: Lorne, Victoria),
2014.
Normalisation CEd (2005) Eurocode 8, Design of structures for earthquake resistance
— Part 3: Assessment and retrofitting of buildings. EN 1998-1, Brussels
PEERC (2007) OpenSees. University of California, Berkeley
Presti DCL, Sassu M, Luzi L, Pacor F, Castaldini D, Tosatti G, Meisina C, Zizioli D,
Zucca F, Rossi G A report on the 2012 seismic sequence in Emilia (Northern
Italy).
Sezen H. MJP (2004) Shear Strength Model for Lightly Reinforced Concrete Columns.
Journal of Structural Engineering 130:1692-1703. doi:10.1061/(ASCE)0733-
9445(2004)130:11(1692)
Tehrani P, Maalek S Comparison of nonlinear static and nonlinear dynamic analyses in
the estimation of the maximum displacement for structures equipped with
various damping devices. In: 4th International Conference on Earthquake
Engineering, Taipei, Taiwan, 2006.

Seismic Behavior of RC Precast Buildings: The Case Of Emilia Earthquake
102
Vecchio FJ, Collins MP (1986a) The modified compression-field theory for reinforced
concrete elements subjected to shear. ACI J 83 (2):219-231
Vecchio FJ, Collins MP The modified compression-field theory for reinforced concrete
elements subjected to shear. In: ACI Journal Proceedings, 1986b. vol 2. ACI,
Conclusions
103
Chapter 4 CONCLUSIONS
The Emilia earthquake occurred on 20 and 29 of May 2012 demonstrated one more
time the high vulnerability of concrete precast buildings. The low attitude in adsorbing
horizontal seismic forces is associated essentially to the inadequateness of the building
codes used during design and construction phases.
Some studies concerning the seismic response of industrial buildings highly damaged
during the mentioned earthquake are described in this thesis. Five existing buildings hit
by the earthquake, accompanied by their final designs, are firstly catalogued. A
classification is carried out, based on facilities geometrical and mechanical details, as
well as in terms of reported damages because of the earthquake.
The considered facilities have been constructed between 1990 and 2011 and, for four
out of five cases, have been designed for vertical loads only. Overall, the reported
damages have been: (a) breaking of infill precast panels; (b) plastic hinge development
at the column bases; (c) columns loss of verticality; (d) partial collapse due to the loss
of support of precast tiles or beams on columns.
A principal case-study building is individuated, as the most damaged among the
analyzed ones: the building, composed by a principal structure and an appendix,
exhibited a partial collapse because of the failure of two central columns. The study of
photographs taken immediately after the earthquake allows identifying the critical
issues of the building, in order to well estimate the collapse causes. It is found that the
failure of the columns occurred where there is a decrease of longitudinal
reinforcement. The presence of an industrial crane next to the collapsed columns
emphasize its significant influence in the failure mechanism. Columns did not show
plastic rotations, denoting that the collapse had a brittle nature. The seismic response of
the building is evaluated according to the current codes. In particular, nonlinear static
and dynamic analyses have been performed. The whole research program has been
conducted with the intention to use the real earthquake evidences in order to validate
capacity models currently available in the technical literature.
A tridimensional building model in OpenSees has been implemented, in order to
perform nonlinear codes procedures to evaluate the seismic response of the structure. A
lumped plasticity model has been implemented, considering a multi-linear moment-
rotation relationship. Because of their frictional nature, element connections as internal
hinges are modeled. Geometric eccentricities have also been considered. Mechanical
Seismic Behavior of RC Precast Buildings: The Case Of Emilia Earthquake
104
and geometric features of the building from the final design have been taken. Nonlinear
static analysis has been performed in both horizontal directions considering that rigid
diaphragm condition is not ensured. Thus, the analysis has been conducted considering
two different methods in order to evaluate the displacement control point: one is based
on geometric considerations, the other follows the Casarotti procedure defined in its
Adaptive Capacity Spectrum Method (ACSM). Both procedures follows the N2
method in order to evaluate the seismic demand. Nonlinear dynamic analysis
considering seven bidirectional acelerograms have been also performed.
After each analysis, checks in terms of both fragile and ductile mechanism are made.
Hence, capacity-demand comparisons have been carried on. Because of shear poor
detailed columns, with the combined presence of 90 degree hooks stirrups and axial
force, Sezen-Mohele capacity model has been considered to estimate the columns shear
resistance. Biskinis formula, adopted by EC8 to predict RC elements shear resistance,
is also implemented. Finally, since the most widespread literature shear capacity
models derived, in large part, from experimental evidences on ordinary concrete
elements, a more refined modeling has been used. In fact, software Response 2000 has
been used, which is based on the Modified Compression Field Theory by Collins and
Vecchio. To estimate the connections response, given its features, simple frictional
checks are conducted comparing shear and friction forces on connections, considering
literature values for the friction coefficient. Since EC8 procedure to estimate total
chord rotation capacity under cyclic loading for industrial precast concrete building
with cantilever columns can highly overestimate the real rotation capacity, the more
conservative Fischinger approach has been adopted.
Results deriving from the code analyses are firstly described. Nonlinear analyses
results, both static and dynamic, applied according to the NTC code, reveal the
frictional connections to be not sufficient to withstand horizontal seismic forces.
Comparison between code nonlinear static and dynamic analyses results shows the
former to be more conservatives. For instance, shear failure cases just in nonlinear
static analysis results are showed. Furthermore, comparison between the considered
shear capacity models shows that the Biskinis formula tends to overestimate the shear
resistance of slender columns. Moreover, technical literature is lacking in guidance on
selection of the displacement control point for pushover analysis in the case of flexible
roof structures.
Secondly, in order to justify the real damages suffered by the building during the
Emilia earthquake occurred on the 20, May 2012, and validate the implemented model,
dynamic time history analysis have been performed using as seismic input one of the
Italian RAN station recorded accelerograms during the first Emilia mainshock. The
vertical component is also considered. The crane, with its static features, as a hinged
Conclusions
105
beam is modeled and has been positioned where it was during the earthquake. Results
of analysis show strikingly how the crane has been decisive in the breaking
mechanism, justifying the collapse of the central columns. In this regard, the model
results comparison with and without the crane is essential. Therefore, neglecting the
crane in the model could represent a critical issue in validating the results.
Finally, a second case-study facility has been analyzed, following the same modeling
features above described. In particular, the considered building, with plan dimensions
equal to about one third of the above mentioned building, was located less than 200
meters from the latter one. Although it was characterized by the same structural
features of the first, no serious damages were reported because of the earthquake. A
comparison between similar columns belonging to both buildings show the second
case-study building to be characterized by lower masses, resulting in lower shear
forces on the columns. Furthermore, the highest axial loads on the first building
columns are correlated with very high signal amplitudes, with minimum values close to
the second building columns axial values. Hence, the two facility similar columns are
subject to the same shear capacity, even if the shear demand on the first building is
much greater. This explain the lower damage suffered by the second facility. The good
theoretical-experimental correlation confirms, also in this case, the validity of the
adopted modeling. As a last reflection, the influence of horizontal cladding panels on
the periods of vibration of the second case-study building is evaluated. Horizontal
cladding panels have been modeled as quadrilateral beam elements anchored to the
principal building elements by means of rigid and semi-rigid constraints (out-of-plane
rotations allowed). The influence of panels on the principal vibration period using
semi-rigid constraints is negligible. The use of rigid constraints results in a great
reduction of the vibration periods. This result could be used as the starting point for the
improvement of numerical modeling capable to take into account the cladding panels
influence and their collapse during the earthquake.

Seismic Behavior of RC Precast Buildings: The Case Of Emilia Earthquake
106