university of groningen off-line reaction monitoring of the …€¦ · · 2016-03-05... analyst,...
TRANSCRIPT
University of Groningen
Off-line reaction monitoring of the oxidation of alkenes in water using drop coating depositionRaman (DCDR) spectroscopyAbdolahzadeh, Shaghayegh; Boyle, Nicola M.; Draksharapu, Apparao; Dennis, Andrew C.;Hage, Ronald; de Boer, Johannes W.; Browne, WesleyPublished in:Analyst
DOI:10.1039/c3an00330b
IMPORTANT NOTE: You are advised to consult the publisher's version (publisher's PDF) if you wish to cite fromit. Please check the document version below.
Document VersionPublisher's PDF, also known as Version of record
Publication date:2013
Link to publication in University of Groningen/UMCG research database
Citation for published version (APA):Abdolahzadeh, S., Boyle, N. M., Draksharapu, A., Dennis, A. C., Hage, R., de Boer, J. W., & Browne, W. R.(2013). Off-line reaction monitoring of the oxidation of alkenes in water using drop coating depositionRaman (DCDR) spectroscopy. Analyst, 138(11), 3163-3171. DOI: 10.1039/c3an00330b
CopyrightOther than for strictly personal use, it is not permitted to download or to forward/distribute the text or part of it without the consent of theauthor(s) and/or copyright holder(s), unless the work is under an open content license (like Creative Commons).
Take-down policyIf you believe that this document breaches copyright please contact us providing details, and we will remove access to the work immediatelyand investigate your claim.
Downloaded from the University of Groningen/UMCG research database (Pure): http://www.rug.nl/research/portal. For technical reasons thenumber of authors shown on this cover page is limited to 10 maximum.
Download date: 08-06-2018

Analyst
PAPER
Publ
ishe
d on
28
Mar
ch 2
013.
Dow
nloa
ded
by U
nive
rsity
of
Gro
ning
en o
n 22
/05/
2013
13:
37:1
9.
View Article OnlineView Journal | View Issue
aStratingh Institute for Chemistry, Faculty
University of Groningen, Nijenborgh 4,
E-mail: [email protected]; Tel: +31 50363bAndor Technology, Millenium Way, Belfast,cCatexel BV, BioPartner Center Leiden, Galil
† Electronic supplementary information (additional spectral data. See DOI: 10.1039
Cite this: Analyst, 2013, 138, 3163
Received 16th February 2013Accepted 28th March 2013
DOI: 10.1039/c3an00330b
www.rsc.org/analyst
This journal is ª The Royal Society of
Off-line reaction monitoring of the oxidation of alkenesin water using drop coating deposition Raman (DCDR)spectroscopy†
Shaghayegh Abdolahzadeh,a Nicola M. Boyle,a Apparao Draksharapu,a
Andrew C. Dennis,b Ronald Hage,c Johannes W. de Boerc and Wesley R. Browne*a
The application of drop coating deposition Raman (DCDR) spectroscopy to the field of reaction progress
monitoring is addressed in this contribution. Although, DCDR spectroscopy has seen recent application
in the study of biological fluids, its application in other areas has not yet been explored. Here we apply
the technique to the catalysed oxidation of alkenes to epoxides in aqueous solutions at concentrations
<10 mM. The effect of surface characteristics, background interferences, homogeneity of distribution of
analytes, drying time, as well as instrumental limits of detection and calibration are discussed. We
demonstrate that reproducible spectra can be obtained routinely, with relatively little variance, with
short acquisition times and samples volumes of 2–10 ml and as little as 1 mg of analyte. The utility of the
technique compared with online reaction monitoring by 1H NMR and Raman spectroscopy is
demonstrated in the excellent correlation between data obtained off and on-line.
Introduction
Over the last decades Raman spectroscopy1 has proven to be aversatile and cost effective analytical method in all elds ofchemical sciences for qualitative and quantitative chemicalanalysis, in particular for multi-component samples.2 Thetechnique has developed rapidly over the last decade due to thedecrease in the cost of lasers and detectors and the increase indetector sensitivity. More importantly, the relatively weakRaman scattering cross-section of water and the spectrally rich‘chemical ngerprint’ presented by compounds and materialsallows for analysis of mixtures as complex as whole cells.Further advantages presented by Raman spectroscopy are theabsence of or only minimal sample preparation required, non-destructiveness and rapidity of both on- and off-line analyses.3
These characteristics have led to the extensive application ofRaman spectroscopy for reaction monitoring and, in particularin industrial settings, for process control.4
The inherent weakness of the Raman scattering, however,means that species present at low concentration are difficult todetect both qualitatively and quantitatively (e.g., <0.1 to 50 mM;the actual concentration limit being dependent both on the
of Mathematics and Natural Sciences,
9747AG, Groningen, The Netherlands.
4428
Northern Ireland
eiweg 8, 2333 BD Leiden, The Netherlands
ESI) available: Details of synthesis and/c3an00330b
Chemistry 2013
analyte in question and the system S/N characteristics). Severalapproaches can be taken to overcome this, includingenhancement either by excitation at a wavelength resonant withan analytes electronic absorption band, i.e. resonance Raman(RR) spectroscopy,5 surface enhanced Raman spectroscopy(SERS)6 or a combination of both, i.e. surface enhanced reso-nance Raman spectroscopy (SERRS).7 Although RR, SERS andSERRS are powerful methods to obtain valuable structuraland electronic information, they are not universallyapplicable methods and oen require the use of non-standardexcitation wavelengths and roughened metal surfaces or nano-particles exhibiting surface plasmon bands at the appropriatewavelength.
Recently, an alternative approach has been taken by severalgroups in the drop coating deposition Raman (DCDR) method.8
The DCDR method takes a relatively simple approach to over-coming the detection limit of Raman spectroscopy, by pre-concentration of dilute solutions (i.e. solvent removal) prior toanalysis. The technique is based on the well-known coffee staineffect;9,10 when a microdroplet is applied to a surface undercertain conditions, the majority of nonvolatile materialsconcentrate at the edge of an evaporating droplet,8,9,11 therebyallowing for an increase by several orders of magnitude in themass of the analyte present in the volume sampled by a Ramanmicrospectrometer. The DCDR method has been appliedrecently in the analysis of biomaterials including human,bovine, and porcine insulin,12 lysozyme,13 glucose, glycan, tax-ane,14 domoic acid,15 human tear uid16 and the synovial uid ofosteoarthritis patients, among other biomaterials that arepresent in serum at low concentrations.17 An important feature
Analyst, 2013, 138, 3163–3171 | 3163

Analyst Paper
Publ
ishe
d on
28
Mar
ch 2
013.
Dow
nloa
ded
by U
nive
rsity
of
Gro
ning
en o
n 22
/05/
2013
13:
37:1
9.
View Article Online
of the DCDR method was demonstrated by Zhang et al. in thesegregation of proteins and salts during the drying process,which further enhances the signal strength achievable incomplex biological matrices.12,14
Although increasingly applied in the qualitative and some-times quantitative analysis of biological serums and uids, theDCDR method presents potential opportunities in the analysisof synthetic and catalytic reaction mixtures also. This is espe-cially the case for reactions carried out in water where thesolubility of substrates is generally poor and in high-throughputscreening of, e.g., enzymatically, catalyzed reactions where thevolume and mass of analyte available are oen limited.Furthermore, when substrates are soluble in water, and espe-cially when they do not bear chromophoric moieties, theirpolarity oen presents problems in analysis with other tech-niques such as HPLC or GC.
In the present contribution, we explore the potential, to thebest of our knowledge for the rst time, of the DCDR techniqueto monitor reaction progress. As a test case we examine thecatalytic epoxidation of alkenes by manganese catalysts in waterquantitatively and qualitatively. This class of functional grouptransformation is especially suited for analysis by Ramanspectroscopy since scattering from the alkene stretching modeis relatively intense as are the ring breathing modes of theepoxide product. Here we show that the DCDR method is suit-able for such analysis and we address issues including the effectof surface characteristics, background interferents, homoge-neity of distribution of analytes as well as instrumental limits ofdetection and calibration. We demonstrate the utility of thetechnique in reaction monitoring by direct comparison with on-line monitoring by 1H NMR and Raman spectroscopy.
ExperimentalSynthesis
4-Vinyl benzoic acid (VBA), 4-(oxiran-2-yl)benzoic acid (OBA),and styrene sulfonate sodium salt [SS, 1H NMR (D2O, 400 MHz):7.79 (2H, d, 9 Hz), 7.62 (1H, d, 9 Hz), 6.85 (2H, dd, 11 Hz and 17Hz), 5.95 (1H, dd 1 Hz and 17 Hz), 5.43 (1H, dd 1 Hz and 11 Hz)ppm] were obtained from Sigma-Aldrich (Steinheim, Germany).Commercially available chemicals were used without furtherpurication unless stated otherwise. H2O2 was 50% w/w inwater (Acros Organics). [Mn2O3(tmtacn)2](PF6)2$H2O (1) and[Mn2(O)(OAc)2(tmtacn)2](PF6)2 (2) where tmtacn is N,N0,N0 0-tri-methyl-1,4,7-triazacyclononane (Fig. 1), were available fromearlier studies.18
Caution: The drying or concentration of solutions thatpotentially contain H2O2 should be avoided. Prior to drying or
Fig. 1 [Mn2O3(tmtacn)2](PF6)2$H2O (1), [Mn2O(OAc)2(tmtacn)2](PF6)2 (2) andthe ligand, tmtacn.
3164 | Analyst, 2013, 138, 3163–3171
concentrating, the presence of H2O2 should be tested for usingperoxide test strips followed by neutralization on solid NaHSO3
or another suitable reducing agent. When working with H2O2,suitable protective safeguards should be in place at all times.
Preparation of 4-(oxiran-2-yl)benzoic acid (OBA) from VBA
[Mn2O3(tmtacn)2](PF6)2$H2O (1, 0.8 mg, 1.0 mmol)19 in 1 mL ofwater was added to 4-vinylbenzoic acid (148 mg, 1 mmol) in100 mL of NaHCO3(aq.) (0.1 M) followed by addition of H2O2
(50% in water, 283 mL, 5 mmol, 5 equiv. w.r.t. VBA) with stirring.The reaction mixture was stirred overnight. Aer the H2O2 hadbeen consumed, the solution was acidied to pH 3 with diluteHCl and extracted into CH2Cl2. The organic layer was dried overNa2SO4 (anhydr.) and the solvent removed in vacuo. Elem. anal.found (calculated) C 65.7 (65.85)%, H 4.94 (4.91)%.
Preparation of 4-oxirane-phenyl-sulfonate (OS) from SS
The epoxide formed from the sodium salt of styrene sulfonate(SS) was prepared using a procedure adapted from thatdescribed earlier by de Boer et al.18b (see ESI also†). H2O2 (50%w/w, 7 mL) was added to a solution of 1 (2.0 mg, 2.5 mmol) andsalicylic acid (3.5 mg, 25 mmol) in acetonitrile (1 mL) at roomtemperature. The mixture was stirred for 20 min aer which0.4 mL was added to VS (206 mg, 1 mmol) in water–acetonitrile(6 mL, 7 : 3, v/v). The mixture was cooled to 0 �C and H2O2 (50%in water, 63 mL, 1.1 mmol, 1.1 equiv. w.r.t. substrate) was addedvia syringe pump at a rate of 7.8 mL h�1. The mixture was stirredand allowed to the reach room temperature over 16 h. 1H NMRanalysis of a 1 mL aliquot indicated approximately 50%conversion of SS. A second portion of freshly prepared catalystcontaining solution and a second portion of peroxide was added(by syringe pump) and stirring continued for a further 14 h. Thesolvent was removed by lyophilisation and the product waspuried by ash precipitation into acetonitrile, yielding theproduct 4-oxirane-phenyl-sulfonate, 130 mg, 0.59 mmol, 59%.1H NMR (D2O, 400 MHz): 7.82 (2H, d, J¼ 16 Hz), 7.49 (2H, d, J¼16 Hz), 4.14 (1H, t, 4 Hz), 3.32 (1H, t, 4 Hz), 3.08 (1H, dd 3 Hzand 4 Hz) ppm.
Preparation of 4-(1,2-dihydroxyethyl)phenylsulfonate sodiumsalt (DS) from SS
The diol (DS) formed from styrene sulfonate (SS) was syn-thesised according to a method described by Lam et al.20 Amixture of styrene sulfonate (340 mg, 1.65 mmol) and mCPBA(415 mg, 2.40 mmol) were dissolved in water–ethanol (40 mL,1 : 1, v/v). The mixture was stirred for 2 h at 65 �C at which pointall oxidant had been consumed (determined by testing withbromine water). The solution was allowed to cool and thesolvent was removed in vacuo. Residual m-chlorobenzoic acidwas dissolved in acetone (300 mL) and the remaining whiteproduct was isolated by ltration, dissolved in water and puri-ed by ash precipitation into acetonitrile, yielding theproduct; 378 mg, 1.57 mmol, 95%. 1H NMR (D2O, 400 MHz):7.83 (2H, d, J ¼ 9 Hz), 7.56 (2H, d, J ¼ 9 Hz), 4.89 (1H, t, J ¼ 5.5Hz), 3.79 (1H, m) ppm.
This journal is ª The Royal Society of Chemistry 2013

Paper Analyst
Publ
ishe
d on
28
Mar
ch 2
013.
Dow
nloa
ded
by U
nive
rsity
of
Gro
ning
en o
n 22
/05/
2013
13:
37:1
9.
View Article Online
Instrumentation1H NMR (400.0 MHz) and 13C NMR (100.6 MHz) spectra wererecorded on a Varian Avance400. Chemical shis are relative toDOH (4.79 ppm). Contact angles were measured on a DeviceDataphysics instrument with SCA20, soware version 3.60.2. A2 mL drop of doubly distilled deionized water was used as themeasuring liquid (sessile drop method). A minimum of vespots on each sample were probed and the contact anglesaveraged. Analysis consisted of applying a baseline and ellip-tical curve tting of the water–air contact prole. The uncer-tainty in the measurements is (�3�).
Raman spectra were recorded using a Raman microscope(Perkin Elmer Raman station with an Olympus BX-51 micro-scope and long working distance objectives) at 785 nm (typically20 mW at sample with a 50� long working distance objective) atroom temperature. Raman spectra were recorded typically with10 exposures of 8 s duration. Raman spectra at 532 nm wererecorded using a homebuilt system consisting of an AndorTechnology iDus-420-OE CCD camera, a Shamrock163 spec-trograph and a 532 nm (300 mW, Cobolt) laser, both brecoupled to an Inphotonics 532 nm Raman probe. Ramanspectra were recorded typically with 20 exposures of 2 s dura-tion. Reactions were carried out in a quartz 3 cm3 volume 1 cmpath length cuvette during on-line monitoring.
Catalyzed oxidation of VBA and SS
Oxidations of VBA and SS with H2O2 (50% w/w in water), cata-lysed by 1 or 2, were carried out in 50 mL round bottomed asksat 20 �C. pH was adjusted prior to addition of oxidant using withH2SO4(aq.) or NaOH(aq.) to pH 8.5.
Preparation of surfaces
Prior tomodication, quartz slides were rinsed in turn with 10%hydrochloric acid, water, acetone and then ethanol. The slideswere subjected to air plasma cleaning (Diener electronic, Femto)at 100 W, for 1 min (at 1.7 � 10�1 mbar air). Quartz slides werefunctionalized with a 4 mM solution of 1H,1H,2H,2H-per-uorooctyltriethoxysilane or octyltriethoxysilane in toluene withheating at reux overnight. Aer functionalization, the surfacewas rinsed with ethanol followed by dichloromethane and driedunder a nitrogen gas stream at r.t.
Scheme 1 Model reactions examined; the oxidation of 4-vinylbenzoic acid(VBA) and styrene-p-sulfonate (SS).
Analysis of Raman spectra obtained using DCDR
Spectra obtained following DCDR were analyzed in the spectralrange 1800 to 600 cm�1. The inconsistencies in the contributionof the carbonate buffer both spectrally and in terms of intensityprecluded the reliable use of chemometric analysis and insteada manual data reduction and tting approach using MicrosoExcel�was taken. Spectra of the main reaction components, i.e.the alkene, epoxide and diol, were recorded by DCDR fromcarbonate buffered solutions at the pH used under reactionconditions. Fitting of a weighted sum of the substrate andproduct spectra provided the mole fraction of each componentin a mixture.
This journal is ª The Royal Society of Chemistry 2013
The data analysis began with an offset correction followed bynormalization of the spectra to the area of the bands between1600 and 1650 cm�1, which includes contributions from thereactant and products only. The raw spectra of mixtures ofalkene and epoxide were then tted with a weighted sum of thespectra of the pure components and an offset correction toprovide the mole fraction of substrate and product in themixture. Spectral tting involved minimization of the bands ofthe substrate and product in the residual spectra (i.e. realspectrum – calculated spectrum) in spectral regions where thecarbonate or other components do not show signals. A cali-bration curve was constructed with mole fraction increments of0.05 for both VBA and SS. The advantage of this approach to theanalysis lies in the absence of a need to apply a baselinecorrection and the effect of spectrum to spectrum variations inabsolute intensity and background signals.
ResultsModel reactions
In the present study, the catalysts [Mn2O3(tmtacn)2](PF6)2$H2O(1) and [Mn2O(OAc)2(tmtacn)2](PF6)2 (2), where tmtacn isN,N0,N0 0-trimethyl-1,4,7-triazacyclononane (Fig. 1), were employed in theepoxidation of water soluble alkenes with H2O2.
Catalyst 1 was identied as a highly effective catalyst for lowtemperature bleaching of clothing and for the epoxidation ofstyrene in water in the 1990s21 and was later applied in a widerange of oxidative functional group transformations in organicsolvents.22 Currently our group is investigating the applicationof these catalysts in aqueous media for alkene oxidation. Formany substrates the relatively low solubility of the substrateand/or products in aqueous media has posed a considerablechallenge in terms of analysis, both on- and off-line, especiallyin large scale reaction conditions and in high-throughputscreening programs. This prompted us to investigate thepossibility of applying the DCDR method for both the analysisof overall conversion and also in obtaining kinetic data forreactions where the reaction times are >1 h.
We examined the oxidation of two model substrates(Scheme 1); i.e. 4-vinylbenzoic acid (VBA) and styrene-p-sulfo-nate (SS) in water with H2O2 catalyzed by 1.
Analyst, 2013, 138, 3163–3171 | 3165

Fig. 2 Solid state Raman spectra (lexc 785 nm) of (a) VBA and (b) its epoxideproduct OBA. Bands of most interest with respect to analysis are indicated.
Analyst Paper
Publ
ishe
d on
28
Mar
ch 2
013.
Dow
nloa
ded
by U
nive
rsity
of
Gro
ning
en o
n 22
/05/
2013
13:
37:1
9.
View Article Online
Reactions were carried out in a total volume of 3 mL ofaqueous NaHCO3 (10�1 M). Typical concentrations employedwere 10 mM substrate, 10 mM catalyst and 50 mM H2O2. In thecase of VBA, the substrate dissolved in the carbonate bufferonly upon addition of H2O2 and hence time zero is taken to bethe point at which the catalyst is added. Unless stated other-wise all reactions were performed at ambient temperature(20–23 �C).
Solid state Raman spectroscopy
Raman spectra of VBA and its epoxide product (OBA) are shownin Fig. 2 and those of SS and OS in Fig. 3. Of particular interestwith regard to analysis are the differences between the spectrain the ranges 1200–1300 cm�1 and 1600–1650 cm�1 and to alesser extent the range between 600 and 900 cm�1, as theseregions do not suffer interference from Raman scattering fromcarbonates (vide infra). The bands in the range 1600–1650 cm�1
are characteristic of C]C stretching vibrations of vinyl and arylgroups and in particular the band at 1630 cm�1 is useful inmonitoring reaction progress.
Fig. 3 Solid state Raman spectra (lexc 785 nm) of (a) SS and (b) its epoxideproduct OS. Bands of most interest with respect to analysis are indicated.
3166 | Analyst, 2013, 138, 3163–3171
Effect of surface pretreatment on drying pattern and Ramananalysis
A range of surfaces for DCDR studies have been employedpreviously by several groups, including quartz,12,23,24 calciumuoride,13 coated or uncoated glass, PTFE coated stainless steel,and gold foil.8 The primary consideration in the choice ofsurface is that it is chemically inert with regard to the analyteand solution, presents little or no background signal and has alow optical absorbance to limit sample heating duringmeasurements. Quartz slides are readily available and werechosen to avoid the uorescence at lexc 785 nm observed withborosilicate glass. The pattern formed by non-volatile reactioncomponents upon drying depends on the characteristics of thesurface used. Hence plasma treated quartz slides werecompared with slides that were subsequently silanised withalkyl or peruoroalkyl silanes.
Droplets of 10 mM solutions of the analytes (2 mL) wereallowed to dry on quartz slides to achieve solute deposition inpatterns that were found to be dependent on the type of surfacetreatment employed. Evaporation was accelerated by applying alow vacuum (10–20 mm Hg). The deposited analytes wereobserved by optical microscopy and in all cases the depositionwas in the shape of a ring (coffee stain pattern) with somematerial deposited in the centre of the ring (Fig. 4). Althoughthe shape of the deposition on the more hydrophobic surface isless uniform, the majority of the analyte was deposited on theoutermost edge of the ring, whereas on the hydrophilic surfacethe analyte is more thinly deposited in a series of thin rings. Anadditional factor affecting deposition is ionic strength. In thecase of the more water soluble SS, deposition from aqueoussolutions did not show the desired coffee stain pattern exceptwhen the ionic strength was increased by addition of NaHCO3
or NaCl.In general it can be concluded that uniform ‘coffee stain
patterns’ cannot be assumed for a particular system and careshould be taken to study not only the drying patterns underideal conditions but also the effect of side reactions and addi-tional reaction components.25 For example, the irregular shapeof the residue deposited upon drying of the droplet indicatesthat the droplet is not pinned during the drying process.
Fig. 4 Dependence of the drying pattern (2 mL of a 10 mM solution of VBA in0.1 M NaHCO3 (aq.), pH 8.5, mass of analyte ca. 3 mg) on surface pre-treatment (a)plasma cleaned surface (contact angle 41�) and (b) plasma cleaned surface fol-lowed by silanisation with alkyl silanes (contact angle 103�).
This journal is ª The Royal Society of Chemistry 2013

Fig. 6 Raman spectra (lexc 785 nm) recorded at eight points across a deposit.The spectra are overlaid in the lower panel and demonstrate the spectralconsistency at multiple points on the outer ring except for contributions (bothshape and intensity) from the carbonate buffer. The star indicates a spectralartefact.
Paper Analyst
Publ
ishe
d on
28
Mar
ch 2
013.
Dow
nloa
ded
by U
nive
rsity
of
Gro
ning
en o
n 22
/05/
2013
13:
37:1
9.
View Article Online
Raman spectra of compounds deposited on hydrophobicsurfaces
Solutions of VBA and OBA in NaHCO3 buffer were deposited onhydrophobic quartz surfaces and Raman spectra were recordedat the edges of the depositions (Fig. 5). The Raman confocalvolume (with a 50� objective) has a waist of approximately 5–10microns26 while the diameter of the deposition is approximately250–300 microns and the width of the ring is 40 microns(see Fig. 4).
The DCDR analysis method relies on uniform co-depositionof the reaction components. Hence it is essential to verify theuniformity or otherwise of the distribution of various compo-nents across the deposition and the reproducibility of spectraboth at the same point, at different points on a particulardeposition and over several depositions. The distribution wasinvestigated using solutions of a range of mole fractions of VBAand OBA. Three depositions were made at each of the threedifferent mole fractions, followed by recording Raman spectraat eight points across each of the nine depositions (Fig. 6). Eachsample point was recorded using a 100� objective and the laserspot size and therefore waist of the confocal volume was <5microns. Visual inspection of the dried spots of VBA, OBA andmixtures of both indicates that most of the material deposits ina 30–40micron wide ring with a diameter of 250 microns, whichis conrmed by comparison of Raman spectra recorded at theedge of the spot (i.e. points a–f) and at the centre (i.e. points gand h); the latter spectra being essentially featureless.
As expected, the absolute intensity of the individual spectrais highly variable due to the lack of uniformity in terms ofthickness of the deposited material in the deposition. Never-theless, aer normalisation (to the maximum in the 1600–1650 cm�1 region where carbonates do not contribute), thestandard deviation of the Raman spectra recorded at variouspoints around the ring of each sample and between severalspots for three mole fraction mixtures (0.2, 0.6 and 0.8) wasfound to be ca. 2–3%, which indicates that the distribution canbe treated as uniform for the two components VBA and OBA. Bycontrast, the distribution with respect to carbonates was notuniform as can be seen from the comparison of the average
Fig. 5 Raman spectra (lexc 785 nm) of (a) VBA and (b) OBA obtained on atreated hydrophobic surface. Regions of most interest are noted.
This journal is ª The Royal Society of Chemistry 2013
spectrum and the standard deviation at each wavenumber (seeESI Fig. S5†). Furthermore, the contributions of the variouscarbonate species to the spectra were found to be highly vari-able over the entire deposition.
The ratio of the two components (VBA and OBA) was calcu-lated by tting the average spectra with a model, based onspectra obtained using DCDR from (carbonate free) aqueoussolutions of VBA and OBA. The spectra were processed by offsetcorrection and normalization. Each spectrum was then ttedwith a model to obtain the best t in the region between (1600–1650 cm�1), which is dominated by the alkene and vinyl C]Cstretching modes and the 1100–1200 cm�1 region. Theseregions were selected since the variability in other regions (e.g.,between 1000 and 1100 cm�1) precluded their use in tting, dueto the presence of varying contributions from carbonates.Fitting of the average spectra at 20 mol%, 60 mol% and 80 mol% of OBA w.r.t VBA shows a good correlation with the expectedvalues, which indicated that a calibration curve can be preparedin this manner (vide infra).
Quantitative analysis
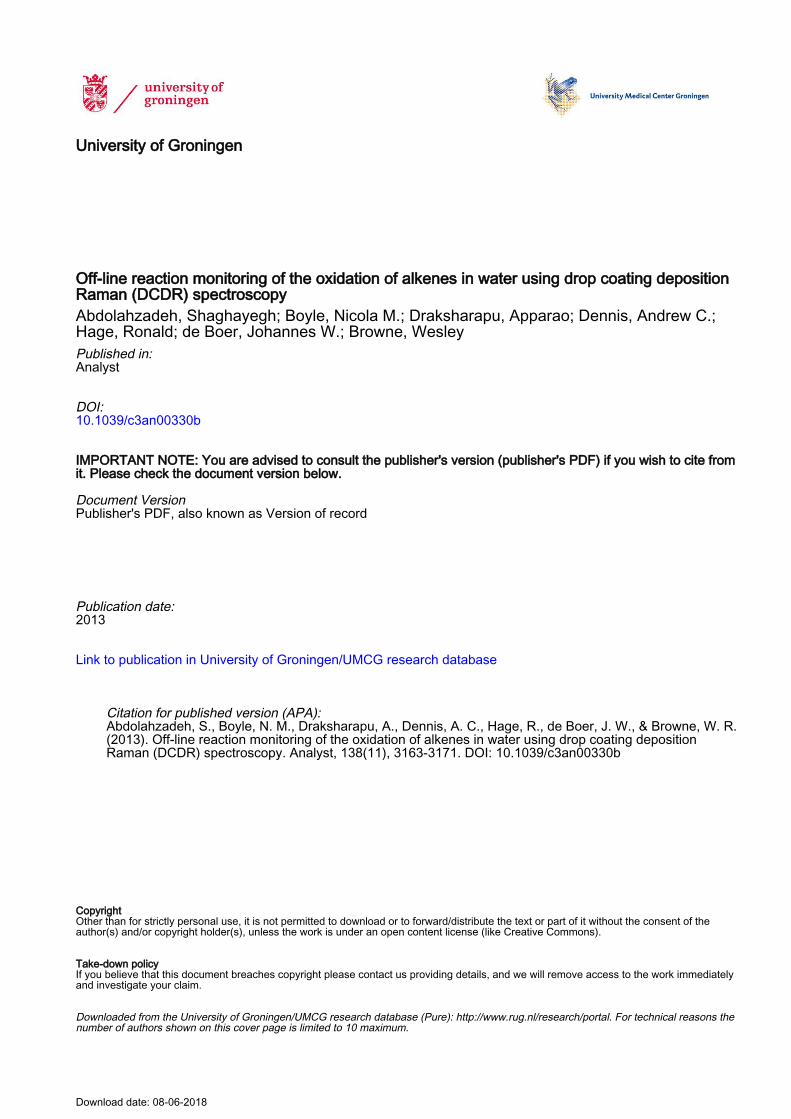
A calibration curve for VBA/OBA was prepared by the method ofcontinuous variation holding the total concentration tothat employed in the catalysed oxidation reactions (10 mM,vide infra). Samples were deposited on a hydrophobic surface(see Experimental section) and Raman spectra were obtained atlexc 785 nm. Fitting provided good agreement with the expectedvalues, albeit close to the extremes (<0.2 and >0.8) the accuracydecreases as the limits to detection of one of the componentsare approached (Fig. 7).
The detection limits in Raman spectroscopy are highlydependent on the power of the excitation laser, the efficiency ofthe light collection optics and the characteristics of the detectoremployed. Nevertheless it is informative to consider the effect ofinitial sample volume (2–10 mL) and concentration of the ana-lyte, VBA (0.1 mM to 10 mM), on the limits of detection in thepresence of 0.1 M NaHCO3 buffer (Fig. S5†). Depositing 10 mL ofa 0.5 mM solution of VBA (i.e. 740 ng of substrate) still allowedfor detection above the noise. The dependence of the nal spotsize aer drying on the sample volume is shown in Fig. 8. Ingeneral, a larger spot diameter is obtained with increased
Analyst, 2013, 138, 3163–3171 | 3167
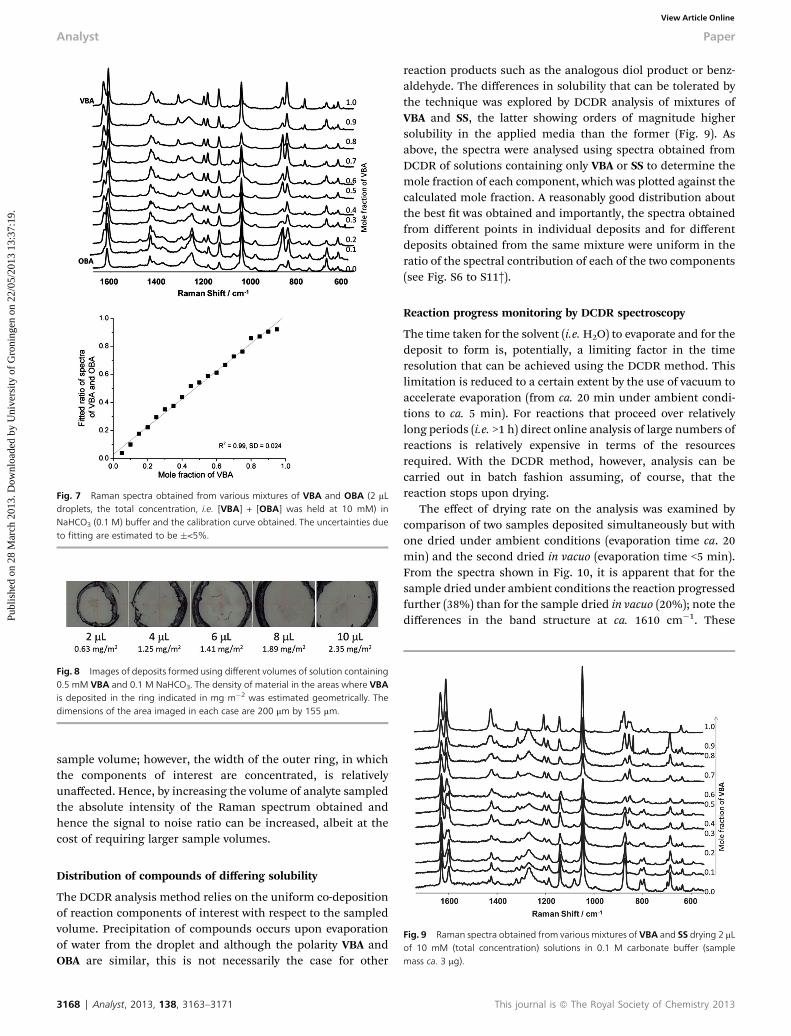
Fig. 7 Raman spectra obtained from various mixtures of VBA and OBA (2 mLdroplets, the total concentration, i.e. [VBA] + [OBA] was held at 10 mM) inNaHCO3 (0.1 M) buffer and the calibration curve obtained. The uncertainties dueto fitting are estimated to be �<5%.
Fig. 8 Images of deposits formed using different volumes of solution containing0.5 mM VBA and 0.1 M NaHCO3. The density of material in the areas where VBAis deposited in the ring indicated in mg m�2 was estimated geometrically. Thedimensions of the area imaged in each case are 200 mm by 155 mm.
Analyst Paper
Publ
ishe
d on
28
Mar
ch 2
013.
Dow
nloa
ded
by U
nive
rsity
of
Gro
ning
en o
n 22
/05/
2013
13:
37:1
9.
View Article Online
sample volume; however, the width of the outer ring, in whichthe components of interest are concentrated, is relativelyunaffected. Hence, by increasing the volume of analyte sampledthe absolute intensity of the Raman spectrum obtained andhence the signal to noise ratio can be increased, albeit at thecost of requiring larger sample volumes.
Fig. 9 Raman spectra obtained from various mixtures of VBA and SS drying 2 mLof 10 mM (total concentration) solutions in 0.1 M carbonate buffer (samplemass ca. 3 mg).
Distribution of compounds of differing solubility
The DCDR analysis method relies on the uniform co-depositionof reaction components of interest with respect to the sampledvolume. Precipitation of compounds occurs upon evaporationof water from the droplet and although the polarity VBA andOBA are similar, this is not necessarily the case for other
3168 | Analyst, 2013, 138, 3163–3171
reaction products such as the analogous diol product or benz-aldehyde. The differences in solubility that can be tolerated bythe technique was explored by DCDR analysis of mixtures ofVBA and SS, the latter showing orders of magnitude highersolubility in the applied media than the former (Fig. 9). Asabove, the spectra were analysed using spectra obtained fromDCDR of solutions containing only VBA or SS to determine themole fraction of each component, which was plotted against thecalculated mole fraction. A reasonably good distribution aboutthe best t was obtained and importantly, the spectra obtainedfrom different points in individual deposits and for differentdeposits obtained from the same mixture were uniform in theratio of the spectral contribution of each of the two components(see Fig. S6 to S11†).
Reaction progress monitoring by DCDR spectroscopy
The time taken for the solvent (i.e.H2O) to evaporate and for thedeposit to form is, potentially, a limiting factor in the timeresolution that can be achieved using the DCDR method. Thislimitation is reduced to a certain extent by the use of vacuum toaccelerate evaporation (from ca. 20 min under ambient condi-tions to ca. 5 min). For reactions that proceed over relativelylong periods (i.e. >1 h) direct online analysis of large numbers ofreactions is relatively expensive in terms of the resourcesrequired. With the DCDR method, however, analysis can becarried out in batch fashion assuming, of course, that thereaction stops upon drying.
The effect of drying rate on the analysis was examined bycomparison of two samples deposited simultaneously but withone dried under ambient conditions (evaporation time ca. 20min) and the second dried in vacuo (evaporation time <5 min).From the spectra shown in Fig. 10, it is apparent that for thesample dried under ambient conditions the reaction progressedfurther (38%) than for the sample dried in vacuo (20%); note thedifferences in the band structure at ca. 1610 cm�1. These
This journal is ª The Royal Society of Chemistry 2013

Fig. 10 Comparison of spectra obtained from (a) a reaction mixture form whichthe catalyst was omitted, a reactionmixture with catalyst present with the dropletsample dried (b) under ambient conditions and (c) dried in vacuo.
Paper Analyst
Publ
ishe
d on
28
Mar
ch 2
013.
Dow
nloa
ded
by U
nive
rsity
of
Gro
ning
en o
n 22
/05/
2013
13:
37:1
9.
View Article Online
differences can be understood by considering that the concen-tration of reactants increases upon drying and hence reactionrate should increase; however, the increase is counterbalancedto some extent by the simultaneous deposition of substrate andproduct that occurs.
Comparison of on-line vs. off-line (DCDR) methods
The utility of the DCDR method for off-line reaction progressmonitoring was assessed by direct comparison with on-linereaction monitoring by both Raman and 1H NMR spectroscopy.In Fig. 11, conversion calculated by the DCDR method and on-
Fig. 11 On-line reaction monitoring at 532 nm (ref. 27) (solid squares) overlaidwith results from off-line analysis with DCDR (open circles) of the same reactionmixture. Reaction conditions: VBA (10 mM), H2O2 (50 mM), NaHCO3 (0.1 M). t ¼0 is the point at which the catalyst (2, 2 mM) was added. Raman spectra wereacquired on-line with 4 min intervals. Samples for off-line analysis were taken atindicated time points, drying times were <4 min.
This journal is ª The Royal Society of Chemistry 2013
line reaction monitoring by Raman spectroscopy, show goodagreement and indeed both techniques allowed for the obser-vation of changes in reaction rates overtime (the inductionperiod is due to minor changes in pH as the reaction proceeds).A discrepancy (ca. <3%) in the conversion determined by bothmethods is ascribed to additional conversion which takes placeduring droplet drying (vide supra).
Comparison of reaction progress monitored by the DCDRmethod and by in situ 1H NMR spectroscopy, highlighted animportant point in regard to obtaining kinetic information bydirect measurement. Immediately aer addition of H2O2 to thereaction mixture a sample was withdrawn for on-line 1H NMRanalysis, with spectral acquisition at intervals equal to the rateof sampling of the reaction mixture by DCDR. The reactionprogress determined from the sample held in the NMR spec-trometer showed a signicant discrepancy to that determinedby DCDR. The origin of the discrepancy was identied by takinga second sample from the reaction mixture for 1H NMR analysisat the end of the monitoring period, which showed thatconversion in the NMR tube used for online analysis wasdifferent to that obtained in the bulk reaction mixture fromwhich DCDR analysis was performed. Sampling of the reactionmixture at set intervals for analysis by both techniques wastherefore performed to avoid this problem. Comparison of theconversion determined by both methods shows good agree-ment over the entire course of the reaction (Fig. 12).
Use of DCDR in high-throughput screening of reactionconditions
The application of DCDR for reaction progress monitoring isdemonstrated in the oxidation of VBA to OBA and in the oxida-tion of SS to OS with H2O2 catalysed by 1 or 2. The reaction rate
Fig. 12 Off-line monitoring of reaction progress in the oxidation of VBA(0.01 M) with H2O2 (0.05 M) catalysed by 2 (10 mM) in NaHCO3(aq.) (0.1 M) in D2O(the VBA was solubilised by addition of H2O2 prior to addition of 2). 700 mL and2 mL aliquots were removed at the times indicated for analysis by 1H NMR spec-troscopy (with tert-butanol as internal standard) and DCDR spectroscopy,respectively. Analysis of the Raman spectra employed fitting with the spectra ofVBA and OBA as described above.
Analyst, 2013, 138, 3163–3171 | 3169

Fig. 13 (a) Raman spectra of a reaction mixture obtained at 30 min timeintervals at 8 mM of 2. (b) Substrate conversion with time for catalyst 2 concen-trations between 0 and 8 mM. The reactions were performed in parallel andspectral acquisition for the entire DCDR sample set was carried out in approxi-mately 1 h.
Analyst Paper
Publ
ishe
d on
28
Mar
ch 2
013.
Dow
nloa
ded
by U
nive
rsity
of
Gro
ning
en o
n 22
/05/
2013
13:
37:1
9.
View Article Online
shows a dependence on catalyst concentration. The intensity ofthe Raman band at 1631 cm�1 can be seen to decrease as thereaction progresses where 8 mMof 1was used. Fitting the spectraobtained by DCDR as described above allows for determinationof the mole fraction of VBA at each time point. At lower catalystconcentrations the reaction rate decreases. The data obtained bythe DCDRmethod for ve reactions in parallel (55 data points intotal) is shown in Fig. 13. The data indicate that the reaction isnon-linearly dependent on catalyst concentration.
Conclusions
Previous studies have shown that inhomogeneous depositioncan be a problem in DCDR for large molecules such asproteins.16,21 For smaller molecules, our results conrm thatdrop coating deposition of compounds of substantially differingsolubility show essentially homogeneous deposition.26 Thespectra obtained in this study using the DCDR technique arereproducible with relatively little variance (<2%) and can beobtained with short acquisition times and small samplesvolumes. The time taken for the solvent (i.e. H2O) to evaporateand the deposit to form is a potentially limiting factor in the time
3170 | Analyst, 2013, 138, 3163–3171
resolution that can be achieved using the DCDR method.However, for reactions that proceed over relatively long periods(i.e. >1 h) off-line analysis of large numbers of reactions by theDCDR method offers a relatively inexpensive approach both interms of facilities required and time, in comparison withcommonly employed techniques such as GC andHPLC or onlinemonitoring. A key advantage in the catalytic reaction studied inthe present report in comparison with on-line Raman or off line1HNMRspectroscopy is that rapid drying results in quenching ofthe reaction, which allows for analysis aer the reaction at a latertime and that much lower sample volumes are required.
The catalysed reactions studied here are highly suited to theDCDR technique. For other reactions control experiments mustbe made to ensure that the observations made here hold forthose reactions also, especially with regard to homogenousdeposition of reaction components over the sampled area.Nevertheless, in many cases we expect that this approach toreaction monitoring can be applied generally to reactionscarried out under aqueous conditions. Extension of this methodto non-aqueous conditions will be explored in future studies.
Acknowledgements
The authors thank the Netherlands Organisation for ScienticResearch (VIDI Grant 700.57.428, WRB), the European ResearchCouncil (Starting Investigator Grant 279549, NMB, WRB), theUniversity of Groningen (Ubbo Emmius studentship, AD), theFoundation for Technology and Science (STW Grant No. 11059,SA, NMB, JWdB, WRB) for nancial support.
Notes and references
1 R. J. H. Clark, Analyst, 2013, 138, 729.2 Raman Spectroscopy for Chemical Analysis, ed. R. McCreery,John Wiley and Sons, New York, USA, 2005.
3 Handbook of Raman Spectroscopy, ed. I. R. Lewis and H. G. M.Edwards, Marcel Dekker, New York, 2001.
4 G. Fevott, Chem. Eng. Res. Des., 2007, 85, 906.5 (a) P. R. Carey, Biochemical Applications of Raman andResonance Raman Spectroscopies, Academic Press, NewYork, 1982; (b) T. G. Spiro and C. A. Grygon, J. Mol. Struct.,1998, 173, 79; (c) T. G. Spiro and R. S. Czernuszewicz,Methods Enzymol., 1995, 246, 416; (d) J. C. Austin, T. Jordanand T. G. Spiro, Adv. Spectrosc., 1993, 20, 55.
6 (a) J. A. Dougan and K. Faulds, Analyst, 2012, 137, 545; (b)I. R. Nabiev, K. V. Sokolov and M. Manfait, in BiomolecularSpectroscopy, ed. R. J. H. Clark and R. E. Hester, Wiley,Chichester, UK, 1993, ch. 7, vol. 21; (c) T. M. Cotton,J.-H. Kim and G. D. Chumanov, J. Raman Spectrosc., 1991,22, 729; (d) T. M. Cotton, in Spectroscopy of Surfaces, ed. R.J. H. Clark and R. E. Hester, Wiley, New York, 1988, ch. 3.
7 T. M. Cotton, S. G. Schultz and R. P. Van Duyne, J. Am. Chem.Soc., 1982, 104, 6528.
8 D. Zhang, Y. Xie, M. F. Mrozek, C. Ortiz, V. J. Davisson andD. Ben-Amotz, Anal. Chem., 2003, 75, 5703.
9 R. D. Deegan, O. Bakajin, T. F. Dupont, G. Huber, S. R. Nageland T. A. Witten, Nature, 1997, 389, 827.
This journal is ª The Royal Society of Chemistry 2013

Paper Analyst
Publ
ishe
d on
28
Mar
ch 2
013.
Dow
nloa
ded
by U
nive
rsity
of
Gro
ning
en o
n 22
/05/
2013
13:
37:1
9.
View Article Online
10 E. Kocisova, A. Vodakova and M. Prochazka, VibrationalSpectr., 2006, 42, 184.
11 D. Zhang, M. F. Mrozek, Y. Xie and D. Ben-Amotz, Appl.Spectrosc., 2004, 58, 929.
12 C. Ortiz, D. Zhang, Y. Xie, V. J. Davisson and D. Ben-Amotz,Anal. Biochem., 2004, 332, 245.
13 J. Filik and N. Stone, Analyst, 2007, 132, 544.14 P. Cipriani and D. Ben-Amotz, J. Raman Spectrosc., 2005, 36,
1052.15 Y. Djaoued, S. Balaji and S. Priya, Spectrochim. Acta, Part A,
2007, 67, 1362.16 J. Filik and N. Stone, J. Raman Spectrosc., 2009, 40, 218.17 K. A. Esmonde-White, G. S. Mandair, F. Raaii, J. A. Jacobson,
B. S. Miller, A. G. Urquhart, B. J. Roessler and M. D. Morris,J. Biomed. Opt., 2009, 14, 034013.
18 (a) J. W. de Boer, W. R. Browne, J. Brinksma, P. L. Alsters,R. Hage and B. L. Feringa, Inorg. Chem., 2007, 46, 6353; (b)J. W. de Boer, J. Brinksma, W. R. Browne, A. Meetsma,P. L. Alsters, R. Hage and B. L. Feringa, J. Am. Chem. Soc.,2005, 127, 7990.
19 K. Wieghardt, U. Bossek, B. Nuber, J. Weiss, J. Bonvoisin,M. Corbella, S. E. Vitols and J. J. Girerd, J. Am.Chem. Soc.,1988, 110, 7398.
20 P. K. H. Lam, M. H. George and J. A. Barry, Polymer, 1989, 30,2320.
21 R. Hage, J. E. Iburg, J. Kerschner, J. H. Koek,E. L. M. Lempers, R. J. Martens, U. S. Racherla,S. W. Russell, T. Swarthoff, M. P. van Vliet, J. B. Warnaar,L. van der Wolf and B. Krijnen, Nature, 1994, 369, 637.
This journal is ª The Royal Society of Chemistry 2013
22 G. De Faveri, G. Ilyashenko and M. Watkinson, Chem. Soc.Rev., 2011, 40, 1722; D. E. De Vos, B. F. Sels, M. Reynaers,Y. V. Subba Rao and P. A. Jacobs, Tetrahedron Lett., 1998,39, 3221; A. Berkessel and C. A. Sklorz, Tetrahedron Lett.,1999, 40, 7965; J. Brinskma, L. Schmieder, G. van Vliet,R. Boaron, R. Hage, D. E. De Vos, P. L. Alsters andB. L. Feringa, Tetrahedron Lett., 2002, 43, 2619; J. W. deBoer, W. R. Browne, S. R. Harutyunyan, L. Bini,T. D. Tiemersma-Wegman, P. L. Alsters, R. Hage andB. L. Feringa, Chem. Commun., 2008, 3747.
23 C. Ortiz, D. Zhang, Y. Xie, A. E. Ribbe and D. Ben-Amotz,Anal. Biochem., 2006, 353, 157.
24 R. A. Halvorson and P. J. Vikesland, Environ. Sci. Technol.,2011, 45, 5644.
25 R. D. Deegan, O. Bakajin, T. F. Dupont, G. Huber, S. R. Nageland T. A. Witten, Nature, 1997, 389, 827; T. Kajiya,E. Nishitani, T. Yamaue and M. Doi, Phys. Rev. E: Stat.,Nonlinear, So Matter Phys., 2006, 73, 011601.
26 The spot size was found to be sufficiently large to still allowfor acquisition of spectra representative of the bulk sampleeven where components crystallise separately.
27 A 532 nm Raman spectrometer was used for onlinemonitoring as the 785 nm system used for analysis of theDCDR system was not sufficiently sensitive to provide asufficient signal to noise ratio for reliable analysis (thelaser power at sample was 200 mW at sample at 532 nm incontrast to 80 mW at sample at 785 nm). In addition thedetector used has a higher sensitivity in the visible regionthan in the NIR.
Analyst, 2013, 138, 3163–3171 | 3171