university of birmingham mode shape curvature squares
TRANSCRIPT

University of Birmingham
Mode shape curvature squares method for crackdetection in railway prestressed concrete sleepersJaneliukstis, Rims; Rucevskis, Sandris; Kaewunruen, Sakdirat
DOI:10.1016/j.engfailanal.2019.07.020
License:Creative Commons: Attribution-NonCommercial-NoDerivs (CC BY-NC-ND)
Document VersionPeer reviewed version
Citation for published version (Harvard):Janeliukstis, R, Rucevskis, S & Kaewunruen, S 2019, 'Mode shape curvature squares method for crackdetection in railway prestressed concrete sleepers', Engineering Failure Analysis, vol. 105, pp. 386-401.https://doi.org/10.1016/j.engfailanal.2019.07.020
Link to publication on Research at Birmingham portal
Publisher Rights Statement:Checked for eligibility: 17/07/2019
General rightsUnless a licence is specified above, all rights (including copyright and moral rights) in this document are retained by the authors and/or thecopyright holders. The express permission of the copyright holder must be obtained for any use of this material other than for purposespermitted by law.
•Users may freely distribute the URL that is used to identify this publication.•Users may download and/or print one copy of the publication from the University of Birmingham research portal for the purpose of privatestudy or non-commercial research.•User may use extracts from the document in line with the concept of ‘fair dealing’ under the Copyright, Designs and Patents Act 1988 (?)•Users may not further distribute the material nor use it for the purposes of commercial gain.
Where a licence is displayed above, please note the terms and conditions of the licence govern your use of this document.
When citing, please reference the published version.
Take down policyWhile the University of Birmingham exercises care and attention in making items available there are rare occasions when an item has beenuploaded in error or has been deemed to be commercially or otherwise sensitive.
If you believe that this is the case for this document, please contact [email protected] providing details and we will remove access tothe work immediately and investigate.
Download date: 29. Dec. 2021
Mode shape curvature squares method for crack detection in railway
pre-stressed concrete sleepers
Rims Janeliukstisa, Sandris Rucevskis
a, Sakdirat Kaewunruen
b, c, *
a Institute of Materials and Structures, Riga Technical University, Latvia, Riga, Ķīpsalas street 6
b Department of Civil Engineering, The University of Birmingham, United Kingdom, Birmingham, Pritchatts
road 52
c Birmingham Centre for Railway Research and Education, The University of Birmingham, United Kingdom,
Birmingham, Pritchatts road 52
* Corresponding author email: [email protected] , tel. +44 121 414 2670
This unprecedented study aims to demonstrate the potential to locate crack damage in full-scale railway pre-
stressed concrete sleepers. The dynamic mode shape curvature squares method has been utilised. This approach
adopts structural deflection shapes extracted from experimental modal analysis using an impact excitation. The
railway concrete sleepers are exposed to the first crack and 1.5 times above the first-crack loads using
experimental setup in accordance with the British Standard. It is found that the first cracking of the sleepers has
caused non-significant stiffness reduction of the structural component evidenced from the fact that the natural
frequency shifts are only few percent and no visible differences in deflection mode shapes are observed. In
addition, the mode shape curvature alone cannot indicate the crack establishment in the railway sleepers.
However, a relatively sparse wireframe for deflection shapes enable the plausible density of sensor grids that
can be further analysed for damage detection. In this paper, the curvature square approach has been developed to
quantify and locate the damage in the railway sleepers. The standardized damage index distributions and
subsequent thresholding with different levels of confidence of damage localization have been firstly developed
to enhance the accuracy of crack localization. It is found that accurate locations of cracks mostly in the mid span
of the sleepers can be reasonably detected in accordance with the actual crack measurements from the
experimental data. The insight into this approach can enhance the development of on-board technology for
railway sleeper crack detection using operational modal signals.
Keywords: concrete sleeper; crack detection; deflection shape; curvature; damage index; modal
analysis
Highlights
Dynamic mode shapes of cracked railway concrete sleepers are extracted.
Mode shape curvature square method is used to identify cracks in railway sleepers.
Polynomial smoothing of mode shape curvature eliminates the need for baseline data.
Initial and further cracks in railway concrete sleepers are accurately detected.
1. Introduction
Sleeper is a critical component of railway track. The main functions of the sleepers include
transferring load from the rails to the ballast and the underlying substructure, securing track gauge
during train traffics and preventing movement of the track in longitudinal and lateral directions
ensuring a comfortable ride for the train passengers [1]. Such an important component of railway
infrastructure as sleeper has to be maintained properly in order to avoid accidents, for example, train
derailments, etc. Two main causes of failure of the concrete sleepers are the tensile cracking and
compressive crushing of the concrete [2]. The flexural capacity of railway concrete sleepers can be
assessed through the measurement of bending moment. For this purpose, in [3] authors equipped
concrete sleepers with strain gauge sensors in order to measure the sleeper-to-sleeper bending moment
variability. They found out that the value is between 0 kNm and 22.8 kNm. Authors in [4] used
numerical simulations to assess crack propagation in pre-stressed concrete sleepers. They found that
flexural performance of the sleepers is mostly influenced by the crack length rather than width.
Moreover, the first cracks usually appear in the centre position of the sleepers.
Innovative solution to minimizing probability of railway sleeper failure was proposed in [5]
consisting of embedding insulated rail joints into concrete sleepers themselves and further optimizing
the design. Long-term solution to this problem, however, would be adaptation of a structural health
monitoring concept, widely applied to bridges, high rise buildings and other structures. Acoustic
emission is a promising technique that is plausible for evaluation of crack location and severities be
examining and post-processing acoustic emission signatures, as demonstrated in [6], while flexural
capacity of pre-stressed concrete using electromechanical impedance spectroscopy was reliably
assessed in [7].
One of the most well-established vibration-based structural health monitoring techniques is based
on mode shape curvatures (MSC). Numerous studies exist where this methodology with slight
modifications was adopted to successfully indicate the damage in various types of structures, ranging
from composite plates, concrete beams to wind turbines and bridges. The success of MSC and related
methods is mainly attributed to the fact that, first of all, it is easy to implement, since only modal
analysis or operational modal analysis with natural excitation has to be performed and mode shapes
extracted. Secondly, once extracted, mode shapes and their transformations provide a valuable spatial
information about the structural condition as opposed to examination of resonance frequency shifts
when only the fact of existence of damage can be either confirmed or declined.
Vast number of studies exist on damage localization using MSC methods. In [8] MSC was applied
to locate the damage in wind turbine blades. Modal analysis was carried out to extract natural
frequencies, damping and mode shapes of healthy and damaged blades. The curvature of difference
between mode shapes at healthy and damaged states was computed as a distribution over blade for 3
damage scenarios. This approach managed to locate the damage in all cases. A hybrid damage
detection procedure for thick conical shells using both wavelet finite element and mode shape
curvature is proposed in [9]. The algorithm involved the detection of damage by calculating the
difference of curvature of mode shapes between healthy and damaged structures and estimation of
damage severity by constructing a wavelet finite element and solving for natural frequencies for
different damage severities (achieved by reducing the thickness of finite elements in numerical
simulation model). The damage localization procedure introduced in [10] is based only on the
information of damaged structure. Operational deflection shapes of beam and plate structures are
obtained using an operational modal analysis with a passing vehicle. Global Filtering of operational
shape curvature (calculated by central difference) yielded damage localization which is sensitive to
small damage and is fast to perform. Authors in [11] examined the impact damage detection
feasibility of 3 damage indices based on mode shapes, namely, differences in out of plane translations,
differences in slopes of the translations and differences in translation curvatures by comparing
structural signatures in healthy and damaged state of carbon epoxy laminated composite plates. Mode
shapes were obtained using TV pulsed holography with loudspeaker excitation and pulsed ruby laser
to read the structural displacements. Researchers in [12] proposed to base the choice of mode shapes
for the damage identification on the highest shifts of natural frequency imposed by damage. In this
work, damage localization procedure was carried out on numerically simulated cantilever and simply
supported steel plates by comparing slope of mode shapes in their healthy and damaged condition.
The location of damage in beam-like structures can be found by examining the natural frequency
shifts caused by damage as shown in [13]. Authors argued that these frequency changes are sensitive
to the location of damage for any particular vibration mode, therefore a larger number of mode shapes
should be studied. These findings have also been demonstrated experimentally on 12 steel beams in
different boundary conditions. Fibre Bragg grating optical fibre sensors were used to measure
distributed macrostrain in simply supported steel beams [14, 15]. Based on this data, normalized
modal macrostrain (MMS) was computed and compared between healthy and damages beams.
Essentially, it served as a damage index and authors claimed that the use of MMS data improves the
performance of MSC methods due to vulnerability to noise and use of numerical differentiation.
Dynamic parameters of reinforced concrete beams were extracted in healthy baseline and damaged
states using experimental modal analysis and their changes compared using traditional natural
frequency shifts and MAC in [16]. Researchers suggested to calculate CoMAC factors of modal
curvatures for better damage localization. Low-velocity impact damage identification in carbon epoxy
laminate plates using vibration characteristics was studied in [17]. Natural frequency shifts, mode
shape changes and curvature of mode shape changes due to damage were examined. Researchers,
however, commented that the earliest damage detection is possible if composite specimens’ strength
decreased by at least 27 %. Also, they concluded that the effect of number of degrees of freedom of

mode shapes and the number of mode shapes themselves on damage identification is unclear. The
progression of damage severity in reinforced concrete single-span bridge using extracted natural
frequencies and mode shapes from frequency response of harmonic excitation was reported in [18].
Modal curvatures calculated from lower order modes successfully pinpointed the location of damage.
Studies in [19] demonstrated that damage localization results in beam type structures based on
numerically computed modal curvatures by traditional means of central differences are improved by
incorporating Savitzky-Golay filter and cubic smoothing spline method. In paper [20] fibre optical
sensor system was adopted for performing modal analysis of beams under bending. Modal analysis
results were compared to the ones obtained with strain gauges and accelerometers. Fibre optical
sensor measurements were Cauchy wavelet-transformed to yield eigenfrequencies and damping ratios.
Authors argued that use of optical sensors has an advantage over conventional sensors, e.g.,
accelerometers, in terms of calculation of modal curvatures, which, in turn, are used in damage
localization. Authors in [21, 22] proposed to fuse wavelet transform and Teager energy operator and
to use complex-wavelets [23] to enhance the damage detection capabilities of the common mode
shape curvature. Authors claimed that this approach is able to tackle the problem of multiple damage
localization and is also relatively immune to measurement noise.
In this study, four railway concrete sleepers are subjected to 3-point bending load configuration in
order to artificially generate crack damages. Two out of four sleepers are loaded to failure, whereas
the remaining sleepers are subjected to a two-stage loading scheme – at the first stage the sleepers are
loaded until the first crack, while at the second stage the load reaches 1.5 times the load of the first
stage. At each of these states of structural integrity, the experimental modal analysis with an impact
excitation is conducted to extract and compare natural frequencies and deflection shapes. Afterwards,
the deflection shapes become the input for damage localization algorithm based on mode shape
curvature squares method. The standardization of damage indices and subsequent application of
thresholds corresponding to incremental levels of confidence of damage localization ensures more
accurate performance of the proposed algorithm. The results suggest that the algorithm has managed
to localize the cracks mostly in mid span region of the sleepers where the actual cracks are clustered
according to the crack measurements.
The presented paper is organized in the following manner: In Section 2, the proposed damage
localization algorithm based on mode shape curvature squares is introduced. In Section 3, description
of tested specimens and experimental equipment and techniques is provided. In Section 4, the results
of crack localization in railway concrete sleepers are presented.
2. Damage localization algorithm
The proposed algorithm exploits the fact that the flexural stiffness 𝐸𝐼 is locally decreased in the
zone of damage. As a response, the magnitude of mode shape curvature locally increases. Most
methods based on mode shape curvature found in the literature compare healthy or baseline data of
the structure with that of a damage structure. However, such an information often cannot be obtained
a priori to an actual event of damage and is difficult to obtain during the real service conditions of the
structure. In present paper, this shortcoming is avoided by using exclusively mode shape curvature
data of a damaged structure.
The basic idea of the method is that the mode shape curvature of the healthy structure has a smooth
surface, and it can be approximated by a polynomial. Using the mode shape curvature data of the
damaged structure and a regression analysis with a polynomial approximation, smooth mode shape
curvature surfaces of the healthy structure are estimated [24]. A locally weighted scatter plot smooth
using linear least-squares fitting is employed to build the smoothed surface [25]. The local regression
smoothing process follows these steps for each data point:
1. Compute the regression weights for each data point in the span. The weights are given by the tri-
cube function:
𝑤𝑖 = (1 − |𝑥−𝑥𝑖
𝑑(𝑥)|
3)
3
(1)

where 𝑥 is the predictor value associated with the response value to be smoothed, 𝑥𝑖 are the nearest
neighbours of 𝑥 as defined by the span, and 𝑑(𝑥) is the distance along the abscissa from 𝑥 to the most
distant predictor value within the span.
The weights have the following characteristics:
The data point to be smoothed has the largest weight and the most influence on the fit;
Data points outside the span have zero weight and no influence on the fit.
2. A weighted linear least-squares regression is performed.
3. The smoothed value is given by the weighted regression at the predictor value of interest.
The damage index is defined as the absolute difference between the measured curvature of the
damaged structure and the smoothed polynomial representing the healthy structure. The maximum
value indicates the location of damage. In this study, the mode shape curvatures and the
corresponding polynomial smoothing are computed only in 𝑥 direction, because in accordance with
the developed wireframe model for deflection shapes of concrete sleepers, only 2 nodes are present in
𝑦 direction and thus, it renders impossible to calculate mode shape curvatures in 𝑦 using the
difference relations from Eq. (3). Hence, the formulation of damage index in two dimensions found in
[24] is adapted for a one-dimensional space. This damage index for the 𝑛𝑡ℎ mode at grid point 𝑖 is
expressed as:
𝐷𝐼𝑖𝑛 = |(
𝜕2𝑤𝑛
𝜕𝑥2 )(𝑖)
2
− 𝜅𝑥𝑛2
(𝑖)| (2)
where 𝑤𝑛 is the measured transverse displacement of the structure, 𝜅𝑥𝑛 is smoothed mode shape
curvature surface in 𝑥 direction, 𝑛 is a mode number, and 𝑖 is a number of grid points in 𝑥 direction.
The mode shape curvature is calculated from the mode shapes by the central difference approximation
at grid point 𝑖 as:
(𝜕2𝑤𝑛
𝜕𝑥2 )(𝑖)
=𝑤𝑖+1
𝑛 −2𝑤𝑖𝑛+𝑤𝑖−1
𝑛
ℎ2 (3)
where ℎ is the distance between two successive nodes or measured points.
To deal with the problem of other smaller peaks, the concept of the statistical hypothesis testing
technique [26-29] is used. For this reason, the damage indices determined for each node are
standardized and the concept of the statistical hypothesis testing is used to classify damaged and
undamaged elements and to locate damage depending on the pre-defined damage threshold value. The
standardized damage index at grid point 𝑖 for every mode shape is obtained as follows:
𝑆𝐷𝐼𝑖𝑛 =
𝐷𝐼𝑖𝑛−𝜇𝐷𝐼
𝑛
𝜎𝐷𝐼𝑛 (4)
where 𝜇𝐷𝐼𝑛 and 𝜎𝐷𝐼
𝑛 are, respectively, mean value and standard deviation of damage indices from Eq.
(2) for every mode shape. The decision on the localization of damage is established based on the level
of significance used in the hypothesis test, which can be determined from a pre-assigned classification
criterion. The typical damage threshold values for the standardized damage index widely used in
literature include 1.28, 2, and 3 for 90 %, 95 %, and 99 % confidence levels for the presence of
damage.
3. Experimental procedure
3.1 Concrete sleepers
The railway concrete sleepers are an essential component in railway track. According to [30-32]
their function is to
redistribute the dynamic loads from the rail foot to the underlying ballast bed;
support and restrain the rail foot;
maintain the rail gauge;
withstand longitudinal, lateral and vertical rail movements;

provide insulation between parallel rails;
resist wear and endure extreme weather conditions.
The pre-stressed concrete sleepers are usually used in the standard gauge, heavy haul rail tracks [30].
Four railway pre-stressed concrete mono block sleepers of type G44 manufactured by CEMEX are
considered in this study. The physical dimensions of sleepers are as follows: length = 2500 mm, depth
at rail seat = 200 mm, nominal maximum weight = 309 kg + 3 kg for loose fastening components. A
total of six tendons are embedded within every sleeper. The photo of the sleepers is shown in Fig. 1.
Fig. 1. G44 concrete sleepers.
3.2 Experimental modal analysis
In order to simulate a real ballast condition, a polymeric material can be placed between the rail
seats of sleepers as an alternative test support specified in Australian Standard AS1085.19J [33-38]. It
is found that 5 layers of rubber conveyor matting used in the mining industry is enough to avoid
excessive vibrations from the floor. These free support conditions are shown in Fig. 2 (a).
Experimental modal analysis with impact hammer excitation is performed on concrete sleepers in
their healthy and damaged condition to extract the global dynamic parameters. Components of
experimental modal testing equipment are shown in Fig. 2 (b).
The equipment contains PROSIG P8004 acquisition box with 4 channels. The modally tuned
impact hammer (PCB Piezotronics, model 086D05, serial number 36223) is connected to the first
channel, while accelerometer – to the second channel. The hammer size, length, material and velocity
at impact determine the amplitude and frequency content of the force impulse. The impact cap
material determines energy content. In general, stiffer tips are suggested for higher frequency
responses. Plastic vinyl tip is used for the impact hammer (sensitivity 0.2509 mV
N). PCB Piezotronics
quartz shear accelerometer of model 352B, serial number 187846 (Fig. 2 (c)) is mounted on the
surface of sleepers using thin layer of wax. The sensitivity of accelerometer at 100 Hz is 99.7 mV
m
s2
, the
bias level of 11.2 V DC and the frequency range of 2 to 10 kHz.
(a) (b) (c)
Fig. 2. Modal analysis setup: (a) concrete sleeper on a rubber mat; (b) testing equipment; (c) accelerometer.
Roving impact excitation is performed over 26 points along the perimeter of the top surface of the
sleepers. Locations of excitation points are chosen to lie where slope of the surface relief experiences
changes. Dynamic response of the sleepers is measured near point No. 26 via uniaxial accelerometer

in Y direction (vertical direction). The wireframe model for experimental modal analysis of concrete
sleepers is shown in Fig. 3. The 𝑥 and 𝑦 coordinates of all 26 measurement nodes are also given. The
accelerometer is mounted at one of the corners of the sleepers and remains in a fixed position. Setup
information is passed to DATS software (PROSIG) where the following parameters are edited –
frequency bandwidth = 0:2048 Hz, resolution = 1 Hz, number of averaging for each impact: 10 times,
window functions: exponential window for response and force window for excitation. Frequency
response functions (FRFs) and coherence plots are recorded for every excitation point. Curve fitting
of collected raw FRFs employing Half-Power method is performed in DATS Modal Analysis package
in order to extract resonance frequencies, corresponding damping ratios and mode shapes. A total of
five first deflection shapes are extracted.
Fig. 3. Wireframe model for deflection shapes of sleepers (top view), units in milimeters.
3.3. Three-point bending
BS EN 13230 specifies the support conditions required for the 3-point bending test, instructing
point supports at the railheads for both positive and negative bending tests. This standard is
commonly used for performance benchmarking in industry [39-43]. The support must be 100 mm
wide and made from steel with a hardness Brinell: HBW > 240. For this study, a static load is applied at the mid span of the sleepers for both positive and negative
bending in order to create artificial cracks. It is important to note that the standard type testing setup is
commonly used for performance benchmarking in manufacturing quality control. The setup for
positive bending test is shown in Fig. 4 (a) and the loading controls in Fig. 4 (b).
(a) (b)
Fig. 4. Experimental setup for three-point bending tests: (a) test configuration; (b) loading controls.
The procedure of experimental testing along with the damage localization is shown in Fig. 5. At
first, experimental modal analysis is performed on all four sleepers at their healthy state using the
boundary conditions shown in Fig. 2 (a). Afterwards, sleepers are subjected to 3-point bending where
two sleepers are set for positive bending moment configuration and remaining two sleepers – for

negative. Two sleepers (one from each of two bending configurations) are loaded to failure and their
deflection shapes are extracted. These sleepers (sleepers 1 and 3) are not considered for damage
localization purposes, whilst for other two sleepers a two-stage procedure with the following steps is
employed:
1. At first, experimental modal analysis is performed on both sleepers at their healthy state at free
boundary conditions. FRF at each point of excitation is measured ten times and these FRFs are
later averaged over all nodes of excitation to obtain the FRF of the whole sleeper. This FRF is
post-processed (curve-fitting procedure) to extract natural frequencies, damping and deflection
shapes.
2. Sleepers are placed on 100 mm wide steel supports and a static load is applied at mid-span in a 3-
point bending configuration. Sleeper 4 is set for positive bending moment and sleeper 2 – for
negative. Sleepers are loaded till first crack.
3. Sleepers are taken off the steel supports, put on the rubber matting and an experimental modal
analysis is repeated.
4. Sleepers are set for bending test where the load is increased from 0 kN to load corresponding to
1.5 times the load of first crack.
5. Sleepers are put on the rubber matting once more for the final stage of experimental modal
analysis.
6. Resonance frequencies are extracted from FRF of a structure for healthy, cracked and 1.5 cracked
states of the sleepers.
7. A total of 5 deflection shapes (1st bending, 2
nd bending, 1
st torsion, 3
rd bending and 4
th bending) are
extracted for all health states of the sleepers. Torsional shape is dismissed, since, in our case, mode
shape curvature calculations are not possible in 𝑦 direction.
8. By inputting each of the extracted deflection shapes into damage localization algorithm separately,
a curvature (Eq. (3)) of the particular deflection shape in 𝑥 direction is calculated.
9. Polynomial fitting of curvature surfaces is computed to generate smooth surfaces 𝜅𝑥 representing
the healthy structure and thus eliminating the need for baseline data.
10. Damage index distribution according to Eq. (2) is calculated for both sleepers at their cracked and
1.5 cracked state.
11. Damage index is then standardized (refer to Eq. (4)) with the application of statistical hypothesis
testing.
12. Threshold levels of 1.28, 2 and 3 are applied to standardized damage indices to ascertain for crack
localization with confidence of 90 %, 95 % and 99 %, respectively.
13. The locations of peaks in thresholded standardized damage index profiles are then compared with
actual crack location measurements and the final decision on crack localization is made.

Fig. 5. Experimental testing and damage localization flowchart.
4. Results
4.1. Crack progression
The crack observations were marked on the sleepers as the experiment was ongoing Cracking
patterns corresponding to 1.5 times the first crack load for sleepers 2 and 4 are shown in Fig. 6 for one
side of each sleeper. In the same figure, one can see the failed sleepers 1 (negative bending moment
configuration) and 3 (positive bending moment configuration). These sleepers had reached the
ultimate load of 102 kN with a significant loss of tendon prestressed force and concrete disintegration
for sleeper 1 and 113 kN with a pronounced shear failure mode for sleeper 3.

(a)
(b)
(c)
(d)
Fig. 6. Cracking pattern of concrete sleepers after loading: (a) sleeper 2 at the first crack (53 kN) and 1.5 load of
the first crack load; (b) sleeper 4 at 1.5 load of the first crack load; (c) failed sleeper 1; (d) failed sleeper 3.
Measurements of crack locations for both sides of sleepers 2 and 4 are provided in Fig. 7. These
measurements are necessary for validation of damage localization. As expected, cracks are clustered
around mid-span corresponding to the largest bending moment.

Fig. 7. Measurements of crack locations after loading with force equal to 1.5 times the first crack load.
4.2. Modal analysis
DATS software has been used for recording and post-processing of experimental modal analysis
data. The following steps have been made on this matter. Frequency response functions (FRFs) and
coherence functions have been recorded for every node of excitation after an impact with a modal
hammer. Afterwards, a curve-fitting of FRFs using Half-Power method has been performed and
modal parameters (natural frequencies and damping ratios) extracted. Fitted FRFs and calculated
displacements have been superimposed on the wireframe model (Fig. 3). This fitted FRF along with
the corresponding coherence at healthy and cracked states of sleeper 2 are shown in Fig. 8. Relatively
small fluctuations of the coherence function around unity suggest satisfactory modal measurements
over the desired frequency range (excluding higher frequencies which are not of interest in this study).

The first and even further cracking has insignificant influence on stiffness of sleepers as indicated by
barely visible natural frequency shifts with the presence of crack. The extracted modal parameters,
averaged over all excitation nodes of the wireframe are shown in Table 1. The most marked difference
is in the first mode, decreasing by 5.4 %, with the other four modes having reductions of less than 0.7
%. Visibly, there is no discernible difference but the frequency reduction indicates that damage has
occurred.
(a) (b)
Fig. 8. Experimental modal analysis results for sleeper 2: (a) FRF; (b) coherence. Table 1
Extracted modal parameters of sleeper 2
Mode Healthy 1st Crack 1.5 × 1
st Crack
1st bending
𝑓̅ = 128.4 ± 0.2 𝐻𝑧
𝜉̅ = (2.13 ± 0.08) %
𝑓̅ = 121.4 ± 0.1 𝐻𝑧
𝜉̅ = (1.81 ± 0.03) %
𝑓̅ = 127.1 ± 0.3 𝐻𝑧
𝜉̅ = (2.07 ± 0.13) %
2nd
bending
𝑓̅ = 348.5 ± 0.1 𝐻𝑧
𝜉̅ = (0.94 ± 0.03) %
𝑓̅ = 346.2 ± 0.2 𝐻𝑧
𝜉̅ = (1.04 ± 0.07) %
𝑓̅ = 346.3 ± 0.2 𝐻𝑧
𝜉̅ = (1.02 ± 0.16) %
3rd
bending
𝑓̅ = 673.3 ± 0.7 𝐻𝑧
𝜉̅ = (0.69 ± 0.17) %
𝑓̅ = 670.2 ± 0.9 𝐻𝑧
𝜉̅ = (1.22 ± 0.21) %
𝑓̅ = 668.0 ± 0.2 𝐻𝑧
𝜉̅ = (0.81 ± 0.03) %
4th
bending
𝑓̅ = 1054.0 ± 0.6 𝐻𝑧
𝜉̅ = (0.86 ± 0.18) %
𝑓̅ = 1052.1 ± 0.6 𝐻𝑧
𝜉̅ = (0.73 ± 0.22) %
𝑓̅ = 1048.8 ± 0.6 𝐻𝑧
𝜉̅ = (0.89 ± 0.27) %
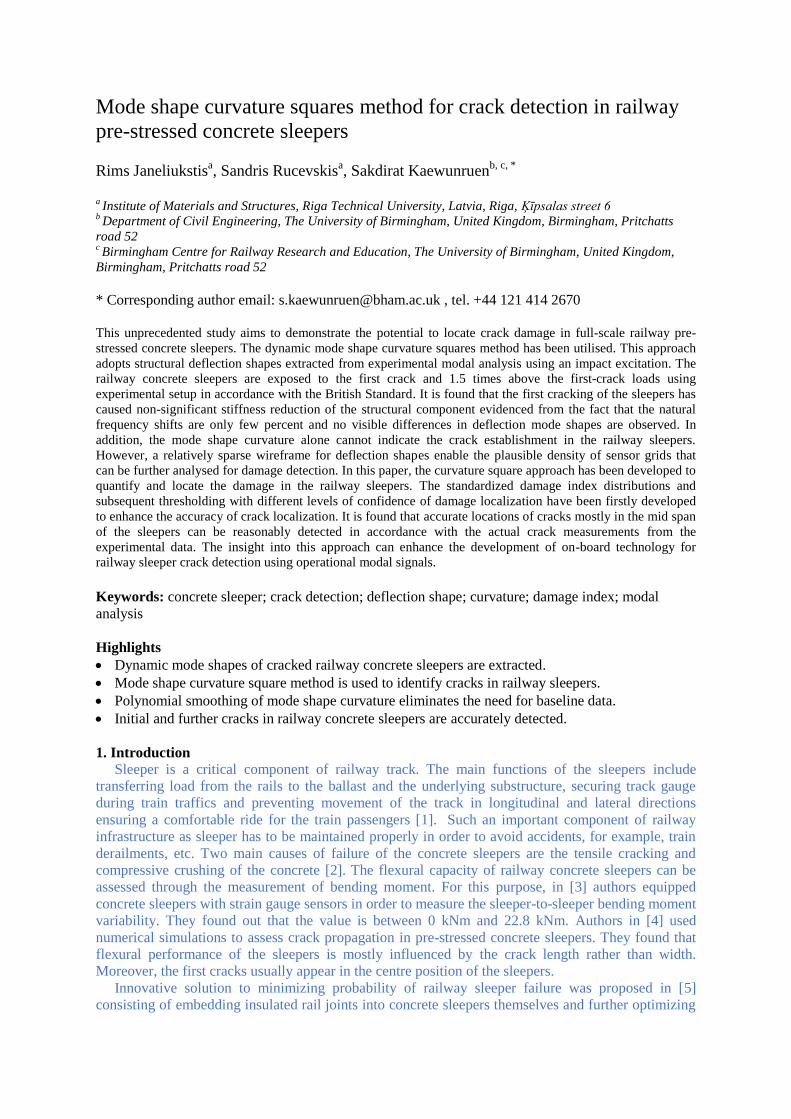
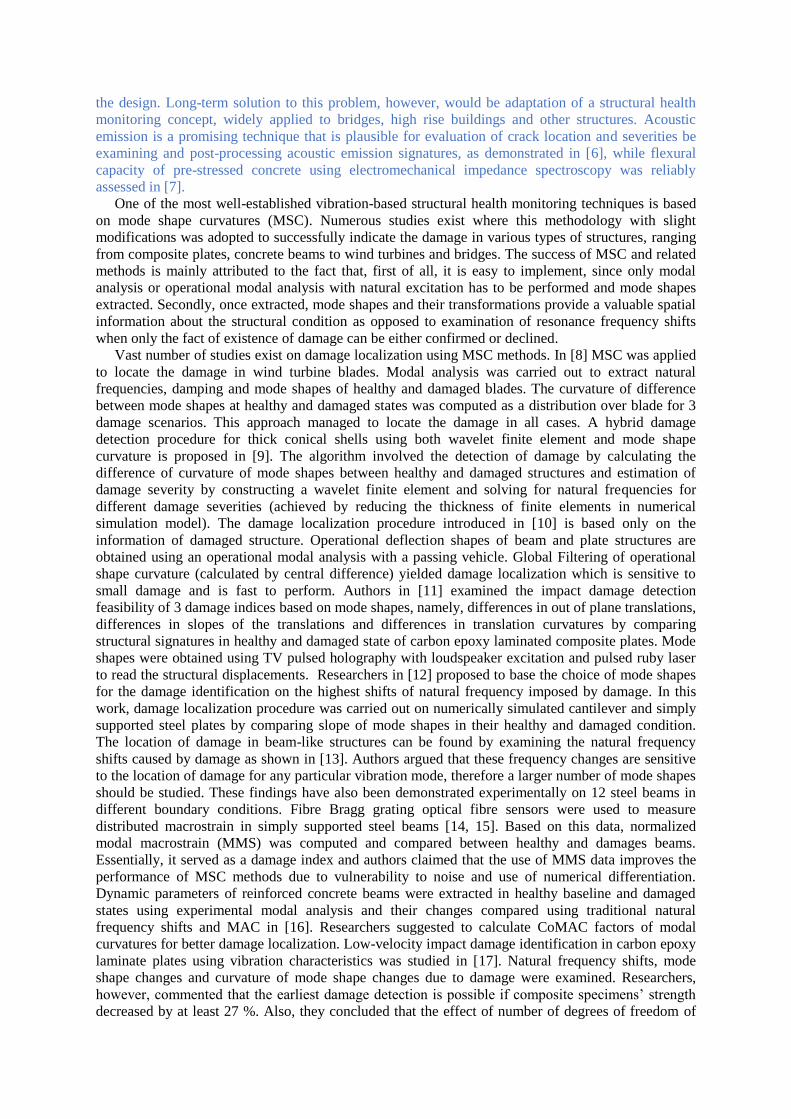
The corresponding experimental modal analysis results for sleeper 4 are shown in Fig. 9 and Table
2. As with sleeper 2, coherence functions remain relatively flat around unity, except for the highest
frequencies not considered in this study. The largest decrease of natural frequency value is for the first
deflection shape (3.1 %), pointing towards a slight overall reduction in global stiffness. The acquired
modal parameters for the positive and negative crack progressions suggests that the minor cracking
has negligible influence on the stiffness. As the cracks progressed and the load reached between 80
and 90 kN their influence on the dynamic properties start to become apparent. By just observing the
deflection shapes, it is difficult to discern any noticeable difference between healthy and damaged
state of the structure with development of cracks. On the other hand, frequency values show a trend
suggesting that it is possible to identify sleeper damage through modal analysis, however, the
magnitude of damage must reach a yet to be determined threshold.
(a) (b)
Fig. 9. Experimental modal analysis results for sleeper 4: (a) FRF; (b) coherence.
Table 2
Extracted modal parameters of sleeper 4
Mode Healthy 1st Crack 1.5 × 1
st Crack
1st bending
𝑓̅ = 123.9 ± 0.1 𝐻𝑧
𝜉̅ = (1.83 ± 0.07) %
𝑓̅ = 120.1 ± 0.1 𝐻𝑧
𝜉̅ = (1.90 ± 0.07) %
𝑓̅ = 125.0 ± 0.1 𝐻𝑧
𝜉̅ = (2.15 ± 0.12) %
2nd
bending
𝑓̅ = 344.9 ± 0.2 𝐻𝑧
𝜉̅ = (0.98 ± 0.20) %
𝑓̅ = 343.6 ± 0.4 𝐻𝑧
𝜉̅ = (1.03 ± 0.21) %
𝑓̅ = 344.7 ± 1.2 𝐻𝑧
𝜉̅ = (0.90 ± 0.19) %
3rd
bending
𝑓̅ = 665.5 ± 0.2 𝐻𝑧
𝜉̅ = (0.88 ± 0.03) %
𝑓̅ = 666.2 ± 0.5 𝐻𝑧
𝜉̅ = (1.26 ± 0.15) %
𝑓̅ = 665.0 ± 0.2 𝐻𝑧
𝜉̅ = (0.76 ± 0.02) %
4th
bending
𝑓̅ = 1044.8 ± 0.7 𝐻𝑧
𝜉̅ = (0.81 ± 0.31) %
𝑓̅ = 1046.1 ± 0.4 𝐻𝑧
𝜉̅ = (0.77 ± 0.36) %
𝑓̅ = 1045.0 ± 0.4 𝐻𝑧
𝜉̅ = (0.74 ± 0.32) %
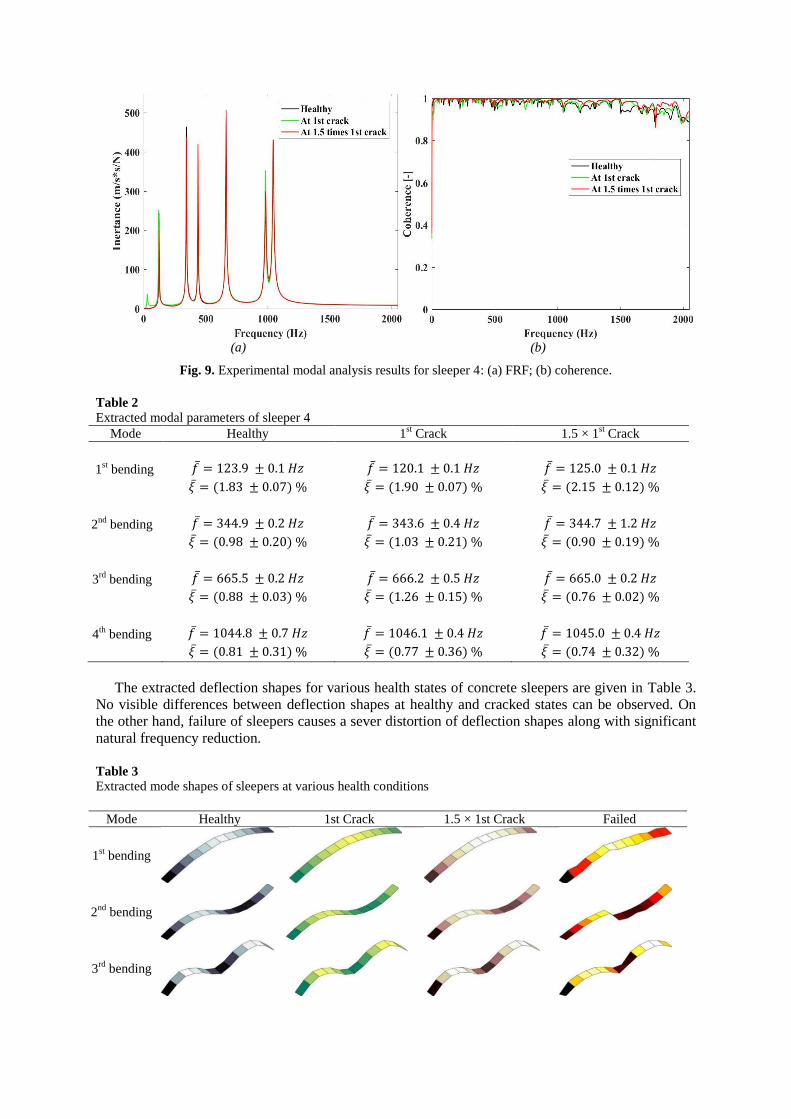
The extracted deflection shapes for various health states of concrete sleepers are given in Table 3.
No visible differences between deflection shapes at healthy and cracked states can be observed. On
the other hand, failure of sleepers causes a sever distortion of deflection shapes along with significant
natural frequency reduction.
Table 3
Extracted mode shapes of sleepers at various health conditions
Mode Healthy 1st Crack 1.5 × 1st Crack Failed
1st bending
2nd
bending
3rd
bending

4th
bending
4.3. Damage localization
Standardized damage index profile along with an application of threshold of 3, curvature in 𝑥
direction and polynomial smoothing of this curvature 𝜅𝑥 for the first deflection shape of sleeper 4 are
shown in Fig. 10.
(a) (b)
(c) (d)
Fig. 10. Standardized Damage Index distribution for sleeper 4 (1st bending mode), cracked: (a) no threshold; (b)
with a threshold of 3, (c) curvature in 𝑥 direction, (d) polynomial fit of curvature in 𝑥 direction.
Curvatures of all extracted bending deflection shapes for all health states of sleepers 2 and 4 are
depicted in Table 4. The curvatures are not computed in 𝑦 direction as deflection shapes comprise of
only two data points in this direction. According to Eq. (3), two neighbouring points are required to
calculate central difference approximation between these points. Therefore, instead of 2 × 13 data
points the signal size of deflection shapes is 2 × 11. The difference of curvature values (in %) with
each progression of damage with respect to healthy state is given below the curvature plots. These
values are organised to match the excitation nodes in the wireframe model (Fig. 3). The largest
differences are highlighted in dark green. According to the results for the first bending mode, the most
notable differences are at node No. 22 for sleeper 2 and No. 21 for sleeper 4 (ignoring the end of the
sleeper), for the second bending mode – at node No. 20 for sleeper 4, while there is no consensus
regarding sleeper 2 – cracking may be initiated at node No. 7 but further cracking is more pronounced
at node No. 23. For the third bending mode – again node No. 21 and for the fourth bending mode – at
node No. 20 for sleeper 4. These findings suggest that most likely the structural integrity has been
disrupted at nodes No. 20 and/or 21 for sleeper 4. On the other hand, the respective results do not
show a clear trend for sleeper 2 as for different deflection shapes the calculated curvature changes are
not of the same level of magnitude for initial and further cracking.
Table 4
Curvature of bending modes of sleepers 2 and 4 under various states of health and relative difference of
curvature (in %) with respect to healthy state for every node healthy cracked cracked 1.5

1st bending mode
sleeper 2
sleeper 4
sleeper 2
healthy → cracked
423.2 22.8 8.2 53.7 3.3 5.5 -50.5 114.3 -48.1 97.8 -3.4
455.9 170.0 0.5 180.0 -22.0 33.8 -44.8 27.1 -2.2 35.0 60.1
healthy → cracked 1.5
111.1 -529.5 214.8 907.7 -3.5 16.2 19.7 -414.6 223.6 -180.5 83.2
84.7 -379.3 64.1 -1441.0 -136.8 -25.2 -338.5 1066.7 23.3 -191.8 45.6
sleeper 4
healthy → cracked
68.2 9.6 23.6 175.1 46.6 -20.8 71.6 562.7 32.6 -647.6 17.7
-1245.5 -47.2 27.8 105.1 387.1 59.0 -61.7 198.4 18.3 6.1 -103.7
healthy → cracked 1.5
2.4 11.2 23.5 73.2 -11.0 10.1 42.9 568.1 17.9 -794.5 26.1
-1522.5 160.6 -6.4 90.1 389.3 54.1 -69.5 191.6 16.7 -46.8 121.0
2nd
bending mode
sleeper 2
sleeper 4
healthy → cracked
-188.6 -1.5 -3.9 0.3 -15.4 94.6 4.1 -3.2 -14.4 13.9 27.7
-303.6 30.8 -17.5 -6.1 4.8 21.2 -11.1 3.4 -14.6 15.5 31.8
healthy → cracked 1.5
99.5 -39.6 -7.5 243.0 14.8 -29.0 68.3 -42.5 51.6 99.5 -39.6
187.9 137.6 -267.9 50.5 -199.8 220.0 183.4 -179.7 23.8 187.9 137.6

sleeper 4
healthy → cracked
-14.7 -4.7 10.4 -6.7 15.3 167.5 -27.3 2.9 15.2 -53.0 31.4
-97.7 14.1 -19.6 -6.7 22.3 378.6 -39.0 19.6 3.5 -19.7 25.3
healthy → cracked 1.5
-16.3 -4.8 8.0 -13.3 26.7 128.0 -1.7 -4.6 6.1 -36.5 25.7
-228.7 26.7 -10.2 -8.2 9.1 327.8 -27.2 6.5 5.4 -19.2 23.8
3rd
bending mode
sleeper 2
sleeper 4
sleeper 2
healthy → cracked
-58.7 5.5 1.9 -15.0 -0.5 -7.9 11.5 -22.7 0.7 0.5 18.1
-81.0 16.0 -15.5 -15.4 -7.7 -13.6 33.4 -6.9 -12.5 2.2 22.5
healthy → cracked 1.5
-26.4 16.5 -69.0 83.3 27.1 11.3 -15.6 143.2 -104.1 7.6 35.2
-31.1 -52.4 205.3 -29.9 62.1 -13.0 48.0 -127.2 238.8 -82.5 19.1
sleeper 4
healthy → cracked
-5.4 6.2 -8.4 -46.2 -38.2 -7.6 14.8 11.4 -3.6 -15.5 7.6
-28.9 8.3 -24.8 -10.6 -93.1 11.6 19.6 14.1 -2.8 -4.1 6.2
healthy → cracked 1.5
-1.8 1.6 -8.5 -36.5 -39.6 0.3 16.6 18.3 8.0 -14.3 4.6
-66.6 10.5 -28.6 -23.4 -121.7 14.8 22.1 22.7 -10.7 -6.8 12.7
4th
bending mode
sleeper 2
sleeper 4

sleeper 2
healthy → cracked
-30.4 -1.8 -1.5 9.3 -2.3 -386.9 -11.0 0.2 1.6 -12.0 9.4
-35.3 2.2 138.5 -3.4 -5.6 -88.2 -7.3 -4.0 511.9 -3.2 9.9
healthy → cracked 1.5
-38.0 39.7 1511.3 -106.5 -5.2 -34.8 1.1 -155.6 2161.2 32.4 14.1
-10.6 -2.5 -435.2 142.8 -55.9 -67.0 -56.1 200.0 -2596.9 -8.3 0.5
sleeper 4
healthy → cracked
-0.4 4.2 61.0 -4.7 -3.7 -30.3 -1.1 -5.0 -74.2 -2.6 -4.1
-3.9 4.6 106.2 -25.4 2.2 124.3 -10.1 -9.7 120.8 0.4 0.6
healthy → cracked 1.5
-2.0 5.6 71.9 -7.6 -4.8 29.6 3.1 -8.0 387.8 -6.6 -3.0
-28.2 2.4 68.4 -17.9 2.5 143.5 -13.0 -0.3 111.7 -0.6 5.0
Standardized damage index (with thresholds) profiles are computed for both sleepers using all five
deflection shapes as an input according to procedure from subsection 3.3. The thresholded
standardized damage index distributions are further analysed with respect to location of peaks. If these
peaks are in the same position as the measured locations of cracks, the algorithm has successfully
managed to localize the cracking damage. The thresholded standardized damage index distributions
for every deflection shape along with the excitation node with nonzero amplitude are given in Table 5.
Table 5
Thresholded standardized damage index distributions for both concrete sleepers calculated for different
deflection shapes Sleeper 2 Sleeper 4
cracked cracked 1.5 cracked cracked 1.5
1st bending shape
Node 18: 2.70
Node 19: 2.17 Node 10: 3.19 Node 7: 3.85 Node 23: 3.11
2nd
bending shape
Node 19: 2.64 Node 19: 2.66 Node 8: 2.09
Node 19: 2.89 Node 19: 2.79
3rd
bending shape

Node 16: 3.09
Node 24: 2.61
Node 7: 2.19
Node 20: 2.65
Node 7: 2.15
Node 20: 2.56 Node 20: 2.35
4th
bending shape
Node 19: 2.93
Node 21: 2.13
Node 3: 1.41
Node 8: 1.42
Node 11: 1.54
Node 3: 1.30
Node 8: 1.30
Node 11: 1.53
Node 11: 1.74
Node 19: 1.31
All nodes with nonzero amplitude of thresholded standardized damage indices are summed up over all
5 deflection shapes and the fraction of occurrence is provided in Table 6.
Table 6
Node counts over all 5 deflection shapes for both sleepers
Sleeper 2,
cracked
Node 19:
3/5
Node 18:
1/5
Node 23:
1/5
Node 17:
1/5
Node 16:
1/5
Node 24:
1/5
Node 21:
1/5
Sleeper 2,
cracked 1.5
Node 10:
1/5
Node 19:
1/5
Node 25:
1/5
Node 7:
1/5
Node 20:
1/5
Node 3:
1/5
Node 8:
1/5
Node 11:
1/5
Sleeper 4,
cracked
Node 7:
2/5
Node 8:
2/5
Node 19:
1/5
Node 5:
1/5
Node 18:
1/5
Node 20:
1/5
Node 3:
1/5
Node 11:
1/5
Sleeper 4,
cracked 1.5
Node 23:
1/5
Node 19:
2/5
Node 12:
1/5
Node 20:
1/5
Node 11:
1/5
Measured crack locations in conjunction with the developed sleeper wireframe model are used to
establish a correspondence between particular excitation nodes and crack coordinates. These results
for both sleepers are shown in Tables 7 and 8. As expected, all crack location nodes lie between two
successive nodes. Therefore, nodes that are closer to the cracks are underlined. At the bottom of the
table, the highlighted nodes are summed up over all cracks for both sides of sleepers and the
likelihood of the node to be the closest to any of these cracks is computed.
Table 7
Correspondence between crack locations in sleeper 2 and nodes of a sleeper wireframe Sleeper 2 side 1: 𝑦 = 0 mm Sleeper 2 side 2: 𝑦 = 200 mm
1066 mm → nodes 6/7 1054 mm → nodes 20/21
1073 mm → nodes 6/7 1135 mm → nodes 20/21
1173 mm → nodes 6/7 1261 mm → nodes 19/20
1263 mm → nodes 7/8 1309 mm → nodes 19/20
1346 mm → nodes 7/8 1403 mm → nodes 19/20
1442 mm → nodes 7/8 1491 mm → nodes 18/19
Node 6: 2/6
Node 7: 3/6
Node 8: 1/6
Node 19: 2/6
Node 20: 2/6
Node 21: 2/6
Table 8
Correspondence between crack locations in sleeper 4 and nodes of a sleeper wireframe
Sleeper 4 side 1: 𝑦 = 0 mm Sleeper 4 side 2: 𝑦 = 200 mm
1065 mm → nodes 6/7 1020 mm → nodes 21/22

1125 mm → nodes 6/7 1160 mm → nodes 20/21
1230 mm → nodes 6/7 1196 mm → nodes 20/21
1311 mm → nodes 7/8 1315 mm → nodes 19/20
1448 mm → nodes 7/8 1503 mm → nodes 18/19
Node 6: 2/5
Node 7: 2/5
Node 8: 1/5
Node 19: 1/5
Node 20: 3/5
Node 21: 1/5
The results from Tables 7 and 8 are to be compared with the results of proposed experimental
damage localization approach (Table 6). It is found that cracks are mostly localized around node No.
19 for sleeper 2 considering both damage states of the sleeper. In Table 6, the likelihood for crack to
be near node No. 19 is 2/6 or 1/3 with the same likelihood for crack to lie near nodes No. 19 and 21.
Unfortunately, no reliable localization results are obtained for row of nodes at 𝑦 = 0 mm. Crack
should have been localized near node No. 7 as there is a 50 % likelihood for crack tie lie near that
node according to measurements. It can be concluded that for sleeper 2 the algorithm has managed to
locate crack at coordinates (1403: 1491, 200) mm with a relatively high level of confidence. As for
sleeper 4, crack localization results from Table 5 match the measured crack positions for nodes No. 19
and 20 (Table 7). Crack measurements indicate that for node No. 19 there is only 20 % likelihood for
crack to lie near this node, but for node No. 20 – 60 %. By combining all crack localization results for
sleeper 4, it is found that node No. 19 has the largest likelihood to contain a crack in it’s vicinity,
while nodes No. 11 and 20 have the same likelihood. However, node No. 11 is not identified in crack
measurements. The proposed algorithm has located cracks near nodes No. 7 and 8 for initially cracked
state, however these results are not consistent with results for further cracking where these particular
nodes do not appear in localization results. Therefore, it can be concluded that the proposed damage
localization algorithm has located two cracks for sleeper 4 at coordinates (1160: 1315, 200) mm and (≅ 1503, 200) mm.
The proposed damage localization techniques has successfully detected the most prominent cracks
in the prestressed railway concrete sleepers despite the following factors that limit the accuracy of
damage localization:
non-significant reduction of stiffness caused by concrete cracking;
the effect of measurement noise;
sparsity of deflection shape signals.
Nevertheless, it was chosen to do so in order to test the proposed damage localization algorithm in
real life service conditions of the structure in an early stage of structural deterioration and when dense
sensor grid for extraction of highly detailed deflection shapes is not available or plausible.
5. Conclusions
In this study, the well-known mode shape curvature square method is applied to cracking
localization in pre-stressed railway concrete sleepers. Cracks are introduced through application of
load at mid-span in two different sleeper configurations – positive and negative bending moments.
Experimental modal analysis with impact excitation of upper surface of the sleepers is conducted to
extract the first five natural frequencies and deflection shapes at various integrity states – healthy, the
first crack and at load corresponding to 1.5 times the first crack load. Visually, no noticeable
differences can be observed by examining the deflection shapes, although the natural frequency shifts,
especially for the first bending mode suggest indicate the presence of damage. The mode shape
curvature square method with the application of standardization of damage indices with various
confidence levels of damage localization has revealed that the highest likelihood of crack location is
at mid-span in accordance with the actual crack measurements for both configurations of sleepers.
Unfortunately, the limitation of this method is that no damage can be localized at edges of the
structure as mode shape curvature computation requires 2 neighbouring data points and thus the
outermost data points of mode shapes are eliminated. However, this was not the case in the current
study as cracking occurred at mid span of the sleepers. The challenges of accurate localization of
cracks lie particularly in the existence of measurement noise, non-significant reduction of structural
stiffness imposed by damage and sparsity of mode shape wireframe data points so that the actual
damage lies between 2 successive nodes and may even be relatively far from each of them. The
insight derived from this study will lead to the development of on-board monitoring technology for
sleeper crack detection using displacement sensors. Throughout the service life of the sleepers, the
displacement distribution would be measured and deflection shapes extracted. These shapes would be
post-processed using the proposed methodology to locate the damage.
Acknowledgements
The research leading to these results was partially supported by the Latvia State Research
Programme under grant agreement "Innovative Materials and Smart Technologies for Environmental
Safety, IMATEH". Authors sincerely wish to thank CEMEX for providing the railway concrete
sleepers, as well as David Cope and other staff of technical team for valuable assistance in civil lab.
Also, authors would like to thank European Commission for H2020-MSCA-RISE Project No. 691135
“RISEN: Rail Infrastructure Systems Engineering Network,” which enables a global research network
that tackles the grand challenge in railway infrastructure resilience and advanced sensing under
extreme conditions (www.risen2rail.eu) [44].
References [1] Janeliukstis R, Kaewunruen S. A Novel Separation Technique of Flexural Loading-Induced Acoustic
Emission Sources in Railway Prestressed Concrete Sleepers. IEEE Access 2019;7:51426-51440.
[2] Rezaie F, Farnam SM. Fracture mechanics analysis of pre-stressed concrete sleepers via investigating
crack initiation length. Eng Fail Anal 2015;58:267-280.
[3] Edwards JR, Gao Z, Wolf HE, Dersch MS, Quian Y. Quantification of concrete railway sleeper bending
moments using surface strain gauges. Measurement 2017;111:197-207.
[4] Farnam SM, Rezaie F. Simulation of crack propagation in prestressed concrete sleepers byfracture
mechanics. Eng Fail Anal 2019;96:109-117.
[5] Zong N, Dhanasekar M. Sleeper embedded insulated rail joints for minimising the number of modes of
failure. Eng Fail Anal 2017;76:27-43.
[6] Janeliukstis R, Clark A, Papaelias M, Kaewunruen S. Flexural cracking-induced acoustic emission peak
frequency shift in railway prestressed concrete sleepers. Eng Struct 2019;178:493-505.
[7] Ai D, Luo H, Zhu H. Numerical and experimental investigation of flexural performance on pre-stressed
concrete structures using electromechanical admittance. Mech Syst Signal Pr 2019;128:244-265.
[8] Wang Y, Liang M, Xiang J. Damage detection method for wind turbine blades based on dynamics analysis
and mode shape difference curvature information. Mech Syst Signal Pr 2014;48:351-67.
[9] Xiang J, Matsumoto T, Wang Y, Jiang Z. Detect damages in conical shells using curvature mode shape
and wavelet finite element method. Int J Mech Sci 2013;66:83-3.
[10] Zhang Y, Lie ST, Xiang Z. Damage detection method based on operating deflection shape curvature
extracted from dynamic response of a passing vehicle. Mech Syst Signal Pr 2013;35:238–54.
[11] Araújo dos Santos JV, Lopes HMR, Vaz M, Mota Soares CM, Mota Soares CA, de Freitas MJM.
Damage localization in laminated composite plates using mode shapes measured by pulsed TV
Holography. Comp Struct 2006;76:272-81.
[12] Abdo MAB, Hori M. A numerical study of structural damage detection using changes in the rotation of
mode shapes. J Sound Vib 2002;251(2):227-39.
[13] Gillich GR, Praisach ZI. Modal identification and damage detection in beam-like structures using power
spectrum and time-frequency analysis Signal Process 2014;96:29-44. [14] Adewuji AP, Wu Z. Vibration-Based Damage Localization in Flexural Structures Using Normalized
Modal Macrostrain Technique from Limited Measurements. Comput Aided Civ Inf 2011;26:154–72. [15] Adewuyi AP, Wu ZS. Modal macro-strain flexibility methods for damage localization in flexural structures
using long-gage FBG sensors. Struct Control Hlth 2011;18:341-60. [16] Baghiee N, Esfahani MR, Moslem K. Studies on damage and FRP strengthening of reinforced concrete
beams by vibration monitoring. Eng Struct 2009;31:875-93. [17] Pérez MA, Gil L, Oller S. Impact damage identification in composite laminates using vibration testing.
Comp Struct 2014;108:267-76. [18] Dilena M, Morassi A. Dynamic testing of a damaged bridge. Mech Syst Signal Pr 2011;25:1485–07.
[19] Quaranta G, Carboni B, Lacarbonara W. Damage detection by modal curvatures: numerical issues. J Vib
Control 2016;22(7):1913-27. [20] Cumunel G, Delepine-Lesoille S, Argoul P. Long-gage optical fiber extensometers for dynamic evaluation
of structures. Sensor Actuat A-Phys 2012;184:1-15.
[21] Cao M, Radzieński M, Xu W, Ostachowicz W. Identification of multiple damage in beams based on robust
curvature mode shapes. Mech Syst Signal Pr 2014;46:468–80.

[22] Cao M, Xu W, Ostachowicz W, Su Z. Damage identification for beams in noisy conditions based on
Teager energy operator –wavelet transform modal curvature. J Sound Vib 2014;333:1543-53.
[23] Cao M, Xu W, Ren WX, Ostachowicz W, Sha GG, Pan LX. A concept of complex-wavelet modal
curvature for detecting multiple cracks in beams under noisy conditions. Mech Syst Signal Pr 2016;76-
77:555–75.
[24] Rucevskis S, Janeliukstis R, Akishin P, Chate A. Mode shape based damage detection in plate structure
without baseline data. Struct Control Hlth 2016;23(9):1180-93.
[25] Matlab R2014a documentation on smoothing scatter plot.
http://se.mathworks.com
(accessed 04.010.15).
[26] Fan W, Qiao P. A 2-D continuous wavelet transform of mode shape data for damage detection of plate
structures. Int J Solids Struct 2009;46:4379–95.
[27] Bayissa WL, Haritos N, Thelandersson S. Vibration-based structural damage identification using wavelet
transform. Mech Syst Signal Pr 2008;22:1194–15.
[28] Rucevskis S, Sumbatyan MA, Akishin P, Chate A. Tikhonov’s regularization approach in mode shape
curvature analysis applied to damage detection. Mech Res Commun 2015;65:9-16.
[29] Liu J, Wang W, Ma F. Bearing system health condition monitoring using a wavelet cross-spectrum analysis
technique. J Vib Control 2011;18(7):953–63.
[30] Kaewunruen S, Remennikov AM. Experiments into impact behaviour of railway prestressed concrete
sleepers. Eng Fail Anal 2011;18:2305-15.
[31] Remennikov AM, Kaewunruen S. Experimental load rating of aged railway concrete sleepers. Eng Struct
2014;76:147-62.
[32] Remennikov A, Kaewunruen S. Experimental investigation on dynamic railway sleeper/ ballast interaction.
Exp Mech 2006;46:57-6.
[33] Standards Australia. Railway track material – Part 19: Fastening system. Australian Standard: AS1085.14-
2001;2001.
[34] Kaewunruen S, Remennikov AM. Experimental simulation of the railway ballast by resilient materials and
its verification by modal testing. Exp Techniques 2008;32(4):29-5.
[35] Remennikov AM, Kaewunruen S. A review of loading conditions for railway track structures due to train
and track vertical interaction. Struct Control Hlth 2008;15(2):207-34.
[36] Kaewunruen S, Remennikov AM. Progressive failure of prestressed concrete sleepers under multiple high-
intensity impact loads. Eng Struct 2009;31(10):2460-73
[37] Kaewunruen S, Remennikov AM. Dynamic properties of railway track and its components: recent
findings and future research direction. Insight Non Destr Test Cond Monit 2010;52(1):20-2.
[38] R. You, K. Goto, C. Ngamkhanong, and S. Kaewunruen, Nonlinear finite element analysis for structural
capacity of railway prestressed concrete sleepers with rail seat abrasion, Eng. Fail. Anal. 95, 2019, 47-65.
[39] D. Li and S. Kaewunruen, Effect of extreme climate on topology of railway prestressed concrete sleepers,
Climate. 7, 2019, 17.
[40] R. You and S. Kaewunruen, Evaluation of remaining fatigue life of concrete sleeper based on field loading
conditions, Eng. Fail. Anal. 105, 2019, 70-86.
[41] C. Ngamkhanong, D. Li, A.M. Remennikov, S. Kaewunruen, Dynamic capacity reduction of railway
prestressed concrete sleepers due to surface abrasions considering the effects of strain rate and prestressing
losses, Int J. Struct Stab. Dyn. 19, 2019, 1940001.
[42] S. Kaewunruen, D. Li, A.M. Remennikov, T. Ishida, Dynamic resistance and rational design of railway
prestressed concrete sleepers, Proceedings of the fib Symposium 2019: Concrete - Innovations in
Materials, Design and Structures, 2019, 1477-1484.
[43] S Kaewunruen, MH Bin Osman, HCE Wong, Risk-based maintenance planning for rail fastening systems,
ASCE-ASME J.of Risk and Uncertainty in Eng. Systems, Part A: Civil Eng., 5, 2019, 04019007.
[44] S. Kaewunruen, J.M. Sussman, A. Matsumoto, Grand challenges in transportation and transit systems,
Front. in Built Env. 2, 2016, 55.