university microfilms international - open...
TRANSCRIPT

EMPIRICAL GRAVITIES AND TEMPERATURESFOR DA TYPE WHITE DWARFS
Item Type text; Dissertation-Reproduction (electronic)
Authors Tapia Perez, Santiago
Publisher The University of Arizona.
Rights Copyright © is held by the author. Digital access to this materialis made possible by the University Libraries, University of Arizona.Further transmission, reproduction or presentation (such aspublic display or performance) of protected items is prohibitedexcept with permission of the author.
Download date 18/05/2018 05:54:53
Link to Item http://hdl.handle.net/10150/298396
I
INFORMATION TO USERS
This material was produced from a microfilm copy of the original document. While the most advanced technological means to photograph and reproduce this document have been used, the quality is heavily dependent upon the quality of the original submitted.
The following explanation of techniques is provided to help you understand markings or patterns which may appear on this reproduction.
1.The sign or "target" for pages apparently lacking from the document photographed is "Missing Page(s)". If it was possible to obtain the missing page{s) or section, they are spliced into the film along with adjacent pages. This may have necessitated cutting thru an image and duplicating adjacent pages to insure you complete continuity.
2. When an image on the film is obliterated with a large round black mark, it is an indication that the photographer suspected that the copy may have moved during exposure and thus cause a blurred image. You will find a good image of the page in the adjacent frame.
3. When a map, drawing or chart, etc., was part of the material being photographed the photographer followed a definite method in "sectioning" the material. It is customary to begin photoing at the upper left hand corner of a large sheet and to continue photoing from left to right in equal sections with a small overlap. If necessary, sectioning is continued again — beginning below the first row and continuing on until complete.
4. The majority of users indicate that the textual content is of greatest value, however, a somewhat higher quality reproduction could be made from "photographs" if essential to the understanding of the dissertation. Silver prints of "photographs" may be ordered at additional charge by writing the Order Department, giving the catalog number, title, author and specific pages you wish reproduced.
5. PLEASE NOTE: Some pages may have indistinct print. Filmed as received.
University Microfilms International 300 North Zeeb Road Ann Arbor, Michigan 48106 USA
St. John's Road, Tyler's Green High Wycombe, Sucks, England HP10 8HR

7 8 2 3 7 7 6
T A P I A P E R E Z # S A N T I A G O E M P I R I C A L G R A V I T I E S A N D T E M P E H A T U H E S F O R D A T Y P E W H I T E D W A R F S ,
T H E U N I V E R S I T Y O F A R I Z O N A , P H . D . , 1 9 7 8
University MicrcSilms
International 300 N. 2EED ROAD, ANN ARB0F1, Ml 48106

EMPIRICAL GRAVITIES AND TEMPERATURES FOR
DA TYPE WHITE DWARFS
by
Santiago Tapia Perez
Dissertation Submitted to the Faculty of the
DEPARTMENT OF ASTRONOMY
In Partial Fulfillment of the Requirements For the Degree of
DOCTOR OF PHILOSOPHY
In the Graduate College
THE UNIVERSITY OF ARIZONA
19 7 8

THE UNIVERSITY OF ARIZONA
GRADUATE COLLEGE
I hereby recommend that this dissertation prepared under my
direction by Santiago Tapia Perez
entitled Empirical Gravities and Temperatures of
DA Type White Dwarfs s
be accepted as fulfilling the dissertation requirement for the
degree of Doctor of Philosophy.
As members of the Final Examination Committee, we certify
that we have read this dissertation and agree that it may be
presented for final defense.
Dissertation Director Date
i
Final approval and acceptance of this dissertation is contingent on the candidate's adequate performance and defense thereof at the final oral examination.

STATEMENT BY AUTHOR
This dissertation has been submitted in partial fulfillment of requirements for an advanced degree at The University of Arizona and is deposited in the University Library to be made available to borrowers under rules of the Library.
Brief quotations from this dissertation are allowable without special permission, provided that accurate acknowledgment of source is made. Requests for permission for extended quotation from or reproduction of this manuscript in whole or in part may be granted by the head of the major department or the Dean of the Graduate College when in his judgment the proposed use of the material is in the interests of scholarship. In all other instances, however, permission must be obtained from the author.
SIGNED; . ' • >

ACKNOWLEDGMENTS
The investigation reported here was made possible
and pleasant by the help and suggestions of the faculty
and staff of Steward Observatory. Sincere thanks are
expressed to:
R. McCallister and the mountain personnel for
their tireless concern with the equipment and the tele
scope during observing runs;
M. Reed for advice on the electronic components.
His help made sailing through rough waters easy and ele
gant, even if it took some tacking into the wind;
T. Sargent for coming to the rescue of several
observing runs with his expert support. Each occasion
was also a demonstration that computers do indeed obey
him;
P. A. Strittmatter and R. J. Weymann for their
marvelous impersonations of Ernie and Bert (respectively),
and for the numerous opportunities to do research that
they give the students of astronomy at The University of
Arizona;
G. V. Coyne, T. Gehrels, and K. Serkowski for
support and encouragement during the last three years.
iii

iv
It is also a pleasure to acknowledge the stimula
tion and encouragement I have been afforded during this
work by the many discussions with P. A. Strittmatter.
Especially appreciated are his frequent departures from
a busy administrative schedule to discuss research, and
his cheerful skepticism.
During the early part of this work, the author
benefited from an AURA, Inc. Fellowship. Later, partial
support was provided by the National Science Foundation.

TABLE OP CONTENTS
Page
LIST OP TABLES vii
LIST OP ILLUSTRATIONS ix
ABSTRACT X
CHAPTER
1. INTRODUCTION 1
DA White Dwarfs 2 Suitable Photometric Bands 10 Background and Motivation 11
2. INSTRUMENTATION 20
Components of the Photometer 20 Filter Wheel 21 Chopper 22 Cryostat 24
Computerized Controls 26 Interface 27 Software 28
Photomultiplier Operation 29 Settings 31 Tests 33
Radiometric Calibration 36 Mirrors 36 Filters 38 Detector 39
3. OBSERVATIONS 4l
Observing Program 41 Standards 42 Routine 42
Data Reduction 45 Extinction 46 Transformations 49
v
vi
TABLE OF CONTENTS—Continued
Page
Photometric Results 53 Uncertainties 57
4. GRAVITY AND TEMPERATURE DETERMINATION . . 60
Model Atmospheres 60 Convection 62
Synthetic Colors 63 Reddening-free Indices 65
Empirical-theoretical Match 74 Other Stars 79
5. INTERRELATIONS 83
Effective Temperature Frequencies . . 83 Bolometric Magnitude-temperature
Relation 87 Parallaxes 87 Apparent Magnitudes 90 Mv versus log(Tpff) 91 Mbol versus log(Teff) 98
Mass-radius Relation 101
6. DISCUSSION AND CONCLUSIONS 107
APPENDIX A: SPECTRAL RESPONSIVITIES 123
APPENDIX B: VISUAL MAGNITUDES COMPILATION .... 128
APPENDIX C: STROMGREN COLORS 131
REFERENCES 134
LIST OF TABLES
Table Page
1. Filters' characteristics 39
2. Extinction coefficients 47
3. Zero-point-check stars .... 52
4. The u, s3 6, and y photometry of DA white dwarfs 54
5. The u, s, 8j and y photometry of non-DA white dwarfs . 56
6. External errors of the V magnitude .... 59
7. Synthetic colors obtained with Wickramasinghe's models 66
8. Synthetic colors obtained with Wehrse's models 67
9. Reddening-free indices and derived atmospheric parameters for 46 DA white dwarfs, 76
10. Reddening-free indices for 16 non-DA white dwarfs 80
11. Trigonometric parallaxes 88
12. Variables for the H-R diagram 92
13. Radius, gravity, and mass for selected DA white dwarfs 102
14. Variables of the brighter crystallization sequence 113
15- The u, s, 6, and y spectral responsi-vities 124
vii
viii
LIST OF TABLES—Continued
Table Page
16. Visual magnitudes of selected DA white dwarfs 129
17. Reproduction of Graham's data 132
LIST OF ILLUSTRATIONS
Figure Page
1. The u, s3 3, and y photometric bands ... 5
2. Overlapping of Hg and the Stromgren b band 7
3. Theoretical strength of Hg in DA atmospheres 9
4. Sequence of star and sky observations ... 44
5. The w versus d diagram for high temperatures 70
6. The w versus d diagram for low temperatures from Wickramasinghe's model atmospheres . 72
7. The w versus d diagram for low temperatures from Wehrse's model atmospheres . . 73
8. Effective temperatures histogram 85
9. The M versus log(T ) diagram for DA whitevdwarfs 95
10. The versus log(Tef»f) diagram for DA white dwarfs * 99
11. The mass-radius diagram 105
12. Absolute magnitude versus Stromgren colors 133
ix

ABSTRACT
A sample of 46 DA white dwarfs were observed
with a four band photometric system designed to improve
the determination of surface gravities and effective
temperatures of this class of stars. The spectral sensi
tivity of the photometric bands was derived by independent
measurements of the transmission optics and filters, and
the relative response of the detector. The spectral
sensitivity of each band was convolved with the energy
distribution of DA white dwarfs model atmospheres to
compute synthetic color indices. The synthetic and ob
served colors were matched on the plane defined by two
reddening-free indices in order to derive gravities and
temperatures. The results indicate that a majority of
DA white dwarfs are characterized by a narrow range of
gravities around log(g) = 8. Combination of the effec
tive temperatures with bolometric magnitudes for a subset
of stars with accurate trigonometric parallax lends
support to the existence of two sequences of degenerate
dwarfs on the H-R diagram.

CHAPTER 1
INTRODUCTION
Consistent interpretation of the energy distri
bution emitted by stellar atmospheres indicates that the
observed spectral features can be parameterized in terms
of the chemical composition, the surface gravity, and
the effective temperature. Observational evidence re
stricts the range of effective temperature to
3-3 <. log(Te£,f) £ 5, and the range of chemical composi
tions to 0.001 £ Z/H _< 0.04, where Z/H is the mass ratio
of elements heavier than helium to hydrogen. Hydrostatic
equilibriums between the gravitational force and the
pressure force of a perfect gas, restricts the gravity
to log(g) _< 5 for the majority of the stars. For a
highly reduced group of stars the gravitational force is
balanced by the pressure force provided by electron de
generacy. In this equilibrium regime the surface gravity
appears to be restricted to 7*5 5 log(g) <_ 8.5. The low
gravity group—characterized as the ordinary stars—
includes subdwarf, main sequence, giant, and supergiant
stars. Only degenerate dwarfs populate the large gravity
1

group. Due mainly to this large difference in surface
gravity, there is only a remote resemblance between
the spectra of degenerate dwarfs and ordinary stars, As
was recognized earlier in the study of these stars, such
differences require different observational techniques
in order to isolate the effects of a given atmospheric
parameter. Very satisfactory results have been obtained
with photometric systems planned to study ordinary stars.
However, consideration of a system for special applica
tion to degenerate dwarfs has been long delayed. The
need for an improved photometric system for degenerate
dwarfs was first suggested by Luyten (1963). Graham
(1972), and more recently Bessell and Wickramasinghe
(1978), have documented the observational problems with
the Stromgren system due to the broad spectral features
of the DA white dwarfs.
The purpose of this work is to describe the re
sults of observations with a photometric system designed
to optimise the derivation of gravity and temperature of
a particular class of degenerate dwarfs.
DA White Dwarfs
In terms of the original spectral classification
of degenerate dwarfs (Luyten 1945)> the most prominent
type is formed by DA white dwarfs. According to Liebert
(1976), in a catalogue of 424 degenerate dwarfs with

absolute magnitude brighter than 11.75 mag, 75 percent
of the entries have DA identification. The rest of the
catalogue is formed essentially by DB and DO white
dwarfs. In principle all these stars are available for
observational studiesj however, the intrinsic low lumi
nosity of the degenerate dwarfs seriously reduces the
number from which accurate observations can be obtained
after moderate efforts. Only from the relatively large
number of DA white dwarfs it is possible to draw a sample
with statistical significance.
Aside from their larger population, these stars
are characterized by a simple spectrum which leaves a
very small margin for misidentification. In the optical
region there are only features due to hydrogen opacity.
The Balmer series is typically present only up to about
Hg, and the lines exhibit strong effects of pressure
broadening. The combination of these two character
istics results in a distinctive spectrum reflecting the
high surface gravity of the degenerate stars.
Although the pressure and the gravity in a
stellar atmosphere are connected by a complicated rela
tionship, to a first approximation both the gas and the
electron pressure are proportional to the square root of
the gravity (Unsold 1955)• Accordingly, degenerate
4 dwarfs, with 10 times the gravity of main sequence stars,
2 will have 10 times more atmospheric pressure or about
105 dyn cm-2 in absolute values. In such dense atmo
spheres, perturbation of the atomic energy levels by
nearby particles becomes very important. If the disturb
ing particles are charged, i.e., electrons and/or ions,
the electric field of interaction is proportional to the
inverse square of the distance between the neutral atom
and the charged particle. This type of perturbation of
the energy levels is known as statistical Stark effect.
Encounters between neutral atoms are less important be
cause the interaction is achieved through the dipole
field, which is proportional to the inverse cube of the
distance.
If the binding energy of an atomic electron is
smaller than the perturbation caused by the surrounding
ions, the energy level is destroyed, producing what is
known as pre-ionization. This effect plays a significant
part in the premature ending of the Balmer series ob
served in DA white dwarfs. An example of this effect is
observed in the energy distribution of EG 42 HZ 14),
presented in Figure 1.
The energy levels that are not destroyed are
shifted. Due to the small mean free path in the dense
atmospheric plasma of degenerate dwarfs, the atoms are
almost permanently embedded in static fields. Therefore,

Figure 1. The u, s, 3, and y photometric bands, — Wavelength in the abscissa, and normalized flux density for the energy distribution or normalized responsivity for the spectral bands and the photometer in the ordinate. The passbands, with dashed lines, are presented as fraction of the photomultiplier responsivity; this one marked with dots. The u and the y bands are defined by the respective Stromgren filters. The two new bands are s and 3, For reference, the energy distribution of the DA white dwarf EG b2 is presented with a solid line. In the rest of this work, reference is made to the white dwarfs in terms of the EG numbers. Cross references can be found in the catalog prepared by McCook and Sion (1977).

0.8 EG 42
0.6
0.4
beta
0.2
o.o 0.47 0.51 0.43 0.39 0.3S jim
Figure 1. The u, s, 3, and y photometric bands.

6
the energy levels remain shifted longer than the time
needed for an electronic transition. In this case, in
order to compute the profile of the lines observed from
the transitions in a collection of atoms, it is only
necessary to calculate the probability that an atom finds
itself in a static field of a given intensity. This
approach, developed by Holtsmark (1931), is known as the
statistical Stark broadening. It can be shown that this
type of broadening is proportional to the 2/3 power of the
2 pressure. Consequently, white dwarfs with about 10
times the pressure of main sequence stars show about 20
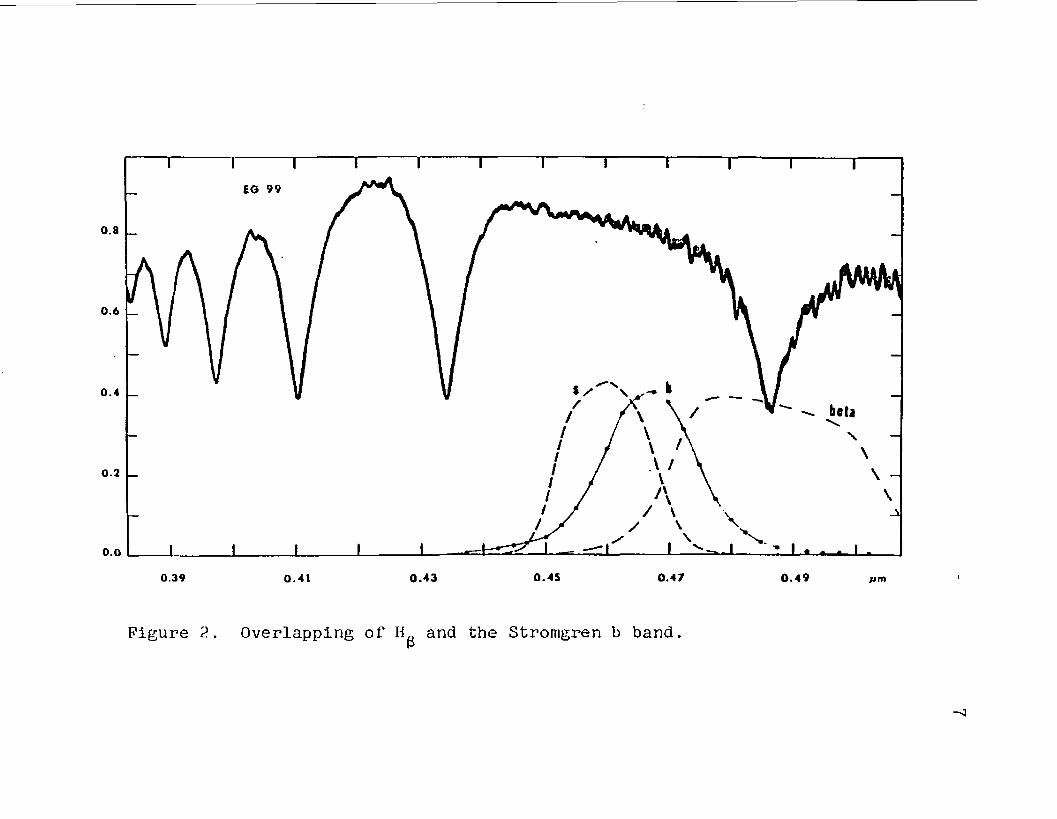
times stronger Stark broadening. Figure 2 illustrates
the Stark broadening in the absorption lines of the DA
white dwarf EG 99 (= G14-58).
According to the statistical Stark broadening,
the line opacity in the wings (i.e., for |AX| > 30 A) _ c /p
decreases as |AA| . Overlapping of the wings is
reached between H and H^, and merging of the lines is
observed at about Hg. Pre-ionization and line merging
cause the apparent absence of the higher members of the
Balmer series observed in DA white dwarfs.
As in the main sequence stars the Balmer lines
In degenerate dwarfs are relatively weak at high and
low atmospheric temperatures, reaching maximum strength
in between. The maximum is caused by the onset of H~

Figure 2. Overlapping of HR and the Stromgren b band. — Abscissa and ordinate as in Figure 1. The advantages of the s band over the Stromgren b band are illustrated in relation to the energy distribution of the DA white dwarf EG 99- The spectrophotometric data for EG 42 (presented in Figure 1) and EG 99 were obtained by John W. Robertson and Peter A. Strittmatter with a *JO-element Digicon system attached to the Cassegrain spectrograph at the Steward Observatory 228-cm telescope. The detector system has been described by Beaver and Mcllwain (1971) and the data reductions have been outlined by Carswell et al. (1975)-
EG 99
0.8
0.6
0.4
beta
0.2
0.0
0.47 0.43 0.39 0.41 pm
Figure 2 . Overlapping of and the Stronigren b band.

8
opacity and the strength of the gravity force. In main
sequence stars, the maximum occurs near 8500 K, However,
as documented by Weidemann (1963)* the higher gravity of
DA white dwarfs shift the maximum strength to atmospheric
temperatures near 13000 K. For a large number of DA
white dwarfs, the variation of the observed equivalent
width of H with respect to the (U-V) color, a fairly
good temperature indicator, has been published by Eggen
and Greenstein (1965a). Such variation is reproduced,
in general terms, by blanketed model atmospheres for high
gravities. The grid of model atmosphere published by
Wickramasinghe (1972) has been used to derive the total
width of H0 at O. 8 5 residual intensity as a function of p
temperature and gravity, and the results are presented in
Figure 3. Dots are used to represent the data derived
from the theoretical models, with continuous lines
representing free hand interpolations.
Consequently, a photometric study of DA white
dwarfs should consider the spectroscopic characteristics
illustrated in Figures 1-3, namely: the extension of the o
Balmer continuum to longer wavelengths (3850 A), the
overlapping of the line wings due to strong pressure
broadening, and the variation of the lines strength with
temperature.

Figure 3- Theoretical strength of Hg in DA atmospheres. — The width of Hg measured in Angstrom units, at 0.85 residual intensity, as a function of temperature and gravity. These results were obtained with the high gravity, blanketed model atmospheres published by Wickramasinghe (1972).

9
250
200
Log(g)
150
100
50
12 25 10 15 20 -3
Figure 3. Theoretical strength of H» in DA atmospheres.

10
Suitable Photometric Bands
An analysis of several attempts to derive atmo
spheric parameters of degenerate dwarfs using the Johnson
broad-band and the Stromgren intermediate-band system led
Wickramasinghe and Strittmatter (1972) to suggest photo
metric bands in accordance with the spectral character
istics of DA white dwarfs. The bands were chosen to
provide both a temperature and a gravity indicator.
Prom the study of early type main sequence stars
it is well known that, at high temperatures when the
effects of H~ opacity are insignificant, the ratio of
intensities between the Balmer and Paschen continua
provides a good index of temperature. In line with these
ideas, Wickramasinghe and Strittmatter (1972) suggested
to observe the Balmer continuum with one band, and the
Paschen continuum with two bands located between the
first three members of the Balmer series. In order to o
measure the flux shortward of 3800 A and between and
Hg the Stromgren u and y bands were retained. A new o o
band, centered at 4600 A and half width of about 200 A,
was proposed to observe the Paschen continuum between
H and Hg. In Figure 1, this band (herein referred to
as the s band) is illustrated in relation to the u and
y bands. As indicated in Figure 2, the Stromgren b band
is contaminated by the blue wing of therefore, a

11
measure of the continuum in the spectral region of the
b band becomes difficult to interpret.
The gravity index suggested by Wickramasinghe and
Strittmatter (1972) is based on the strength of , For
this purpose they propose a photometric band centered o o
at 4861 A with a half width of approximately 350 A.
A comparison of the flux measured by this band with the
flux measured by the s and y bands provides an index of
the strength of and consequently of the surface
gravity.
Approximated passbands of u, s, 6, and y were
used by Wickramasinghe and Strittmatter (19 72) to investi
gate the temperature and gravity indicators derived from
the grid of model atmospheres published by Wickramasinghe
(1972). The results were encouraging because the separa
tion of the theoretical iso-gravity and iso-temperature
curves was found to be larger than the estimated photo
metric errors. Following these tentative results, the
four bands were implemented as described in Figures 1 and
2 in order to obtain systematic observations of DA white
dwarfs.
Background and Motivation
The internal structure and evolution of degener
ate dwarfs can be understood, in a first approximation,
in terms of the theory developed by Fowler (1926) and

12
Chandrasekhar (1939) - Several theoretical items, still
under investigation, have been reviewed by Ostriker
(1971). A controversy has developed around one such item
due to the lack of observational verification. It con
cerns the balance of energy in degenerate dwarfs.
It is generally accepted that nuclear reactions
are not possible in degenerate stars because the Coulomb
barriers of the available nuclei are too high at the
existent internal temperature and density. Consequently,
nuclear energy is not available and only remaining
sources of energy need to be considered. The original
theory analyses first the case of a degenerate star at
zero temperature for which only the gravitational
energy ft and the exclusion energy of the degenerate elec
trons U, are available. If the velocities of the d
electrons are not relativistic it is possible to demon
strate that = -Q/2. According to this result the
star has reached an equilibrium state corresponding to
half the gravitational energy, and an equal amount of
energy has been used to bring all the electrons into the
degenerate regime. A more common way to express this
result is that degenerate electrons provide the
temperature-independent pressure supporting the star
against gravity. There is no dissipation of energy from
stars with these characteristics; they are referred to
as black dwarfs.

13
If the velocities of the degenerate electrons
are relativistic the total energy of a black dwarf is
still finite; however, such conditions are possible for
the upper limit of the mass only. For a non-rotating
black dwarf, Chandrasekhar (1939) found that such limit
corresponds to 1.44 solar masses.
Salpeter (1961) introduced the next approxima
tion in the energy balance for a black dwarf by consider
ing the influence of the ions in the internal structure.
To the extent that the exclusion energy of the electrons
is the only form (or at least the dominant form) of in
ternal energy in a black dwarf, ions must be forced into
their lowest energy state. In such state ions are at
rest in a body-centered cubic lattice. The sum of
Coulomb interactions between the ionic lattice and a
uniform charge of electrons provides a small but signifi
cant contribution to the total energy. According to
Salpeter (1961) this contribution is also the potential
energy of an inverse square law of force and can enter
in the energy balance as a correction to the gravita
tional energy. Consequently, in this approximation
Ud = ~(fi+V)/2 where V is the energy due to Coulomb
interactions. In this condition some gravitational
energy has been transformed into Coulomb energy and the
equilibrium of the star is maintained by the pressure of

in
degenerate electrons plus the small contribution of
electrostatic interactions. The fact that the ratios
V/U^ and V/Q are much smaller than unity makes
Chandrasekhar's model a good approximation up to this
point.
A more realistic model is found in the degener
ate dwarfs with temperature above sero: the white dwarfs.
In the interior of these stars all but a very small
fraction of the electrons are degenerate, ions are not
degenerate, and an incipient lattice is present in the
core. The main difference with black dwarfs is that ions
are provided with thermal energy. Therefore, the energy
balance of white dwarfs takes the form
2U. + 2U, + n + V = 0 (1) i a
where represents the thermal energy of the ions.
Because the heat capacity of the few nondegenerate
electrons is negligible next to that of ions their con
tribution can be ignored. It can be shown that the
equilibrium of a white dwarf is maintained in essentially
the same way as black dwarfs. Consequently, the thermal
energy of the ions amounts to = -(JHV)/2. In other
words, the potential and the Coulomb energies of a white
dwarf are equally divided into the exclusion energy of

15
degenerate electrons and the thermal energy of the ions.
This last form of energy is dissipated from the star and
part of it is observed as radiation in the optical region.
While this energy is consumed white dwarfs cool down, at
approximately constant radius, evolving to the black
dwarf stage.
It is clear now that if a star reaches the stage
of white dwarf without a lattice in the core, at some
point during the dissipation of thermal energy from the
ions Coulomb interactions became sufficiently strong to
hinder the motion of nuclei ensuing the formation of a
lattice. After that point, crystallization originates
in the core of the white dwarf and further cooling brings
a large fraction of the stellar interior into crystal
lization.
A detailed analysis of the energy balance in a
white dwarf near the transition to black dwarf was made
by Mestel and Ruderman (.1967). They considered the
effects of slight contraction with cooling and the re
lease of small amounts of gravitational energy, the
contributions of kinetic and Coulomb energies due to
oscillations of the lattice, and the changes of heat
capacity as the lattice grows. The results indicate
that near zero temperature dissipation of thermal plus
Coulomb energy is comparable to the variation of

16
gravitational energy. However, the gravitational energy
released by the white dwarf is almost entirely absorbed
by the increase in exclusion energy of degenerate
electrons.
Mestel and Ruderman (1967) also deduced that over
the temperature range relevant to white dwarfs the heat
capacity is dominated by Coulomb contributions from the
ionic lattice. Consequently, the Dulong-Petit law
c =: 3k, where k is the Boltzmann constantj gives a
better approximation to the specific heat per ion than
the value for a classical gas cv - 3/2k
Variations of the heat capacity due to crystalli
zation have been investigated in terms of two different
hypotheses. In the first case Mestel and Ruderman
(1967) considered crystallization as the result of a con
tinuous transition between liquid and solid at essentially
constant volume. Under these conditions degenerate
dwarfs maintain the same heat capacity before and after
the lattice formation. For a total mass M containing
ions of molecular weight y the heat capacity can be
determined from

17
where H Is the unit of atomic mass. It follows then that
the luminosity of the degenerate dwarfs is given by
L -(3)
which corresponds to the rate of change of the thermal
energy of the nondegenerate ions.
an abrupt change in the symmetry of the distribution of
ions during crystallization. In this case there Is a
reduction in the average Coulomb interaction energy per
particle due to the transition to the solid phase. The
energy released Is the latent heat of crystallization,
amounts to about kT per ion, and adds to the internal
energy. The net result is an increase in the heat
capacity with the corresponding increase of the lumi
nosity. As derived by Van Horn (1968), the luminosity
of a partially crystallized degenerate dwarf is given by
where f > 0 depends on the fraction of the mass affected
by crystallization and the molecular weight of the ions
involved.
Van Horn (1968) adopted the alternative case of
(4)

18
In principle the increase in luminosity may be
significant enough to allow detection of crystallization
sequences in the H-R diagram. Degenerate dwarfs with
ions of larger molecular weight should release more
latent heat and consequently such stars may populate
brighter sequences in the H-R diagram. Van Horn (1968)
documented the characteristics of crystallization
sequences for white dwarfs of different chemical composi
tion. On the log(L) versus log(diagram crystal
lization sequences display a shallower slope than the
lines of constant radius, a characteristic that is
supported by the observational data published by Eggen
and Greenstein (1965a). The existence of crystallization
sequences was denied later by Weidemann (1975) with
arguments based on Stromgren photometry obtained by
Graham (1972).
As mentioned in the former section the b band of
the Stromgren system may contain significant contamina
tion from Hg which makes the (b-y) color a poor tempera
ture indicator for white dwarfs. In general, the strong
spectral features of most degenerate dwarfs produce
adverse effects in the color indices obtained with the
standard systems (see Weidemann 19&3 for effects in the
UBV bands) rendering inconclusive results.

19
In order to examine the distribution of degener
ate dwarfs on the H-R diagram an accurate temperature
calibration is required. At a time when the uncertainty
in the luminosity of the degenerate stars is being re
duced drastically by several parallax programs now in
progress, an improved temperature calibration becomes
compelling.
It Is expected that the u, s, $, and y system can
provide a satisfactory temperature calibration in order
to study the observable effects of the energy balance
in white dwarfs, especially those effects resulting from
the crystallization hypothesis.

CHAPTER 2
INSTRUMENTATION
At the end of 1971 Dr. Donald J. Taylor finished
the construction and tests of an area and spectrum scanner
of his own design. Observational results obtained with
that instrument have been published by Spinrad, Smith and
Taylor (1972). By removing the monochromator the same
instrument can be used as a single channel photometer
capable of star-sky chopping and rapid alternation of
the filters. The optical characteristics and the dimen
sions of the photometer were fitted to the F/9 focal
ratio of the Steward Observatory 228-cm reflector.
During 1973 the photometer was equipped with a computer
interface. The observational data for this investigation
were obtained with the instrument operated via a mini
computer. A description of its main features and con
trols, plus the calibration of the spectral bands, is
presented in this chapter.
Components of the Photometer
The optical system of this photometer is conven
tional. A diaphragm is placed in the focal plane of the
20

21
telescope followed by a small-angle removable microscope
used to inspect the centering of the observed object in
the diaphragm. With the microscope out of the light-
beam the next elements in the optical path are a filter
and a field (Fabry) lens. This last element images the
telescope primary onto the cathode of an end-on photo-
multiplier .
The instrument was designed to reduce two time-
dependent errors commonly present in photometric observa
tions: (1) rapid change of the sky background, and (2)
instrumental drift due to temperature effects in the
detector. The first type of error is reduced by rapid
change of the filters and frequent samples of the sky
background. The second one can be reduced by placing
the detector in a stable refrigeration system.
Filter Wheel
Rapid and repeated cycling of the filters was
achieved by mounting them on a wheel geared to a stepping
motor that drives the rotation. The filter wheel has
room for six filters of 2.6 cm square and up to 0.8 cm
thick. Change from one filter to the next can be done
in 20 steps of the motor in a minimum time of 0.240 s.
The origin of the sequence of filters is marked by a
fiducial point on the wheel. During the time that the
first filter of the sequence is in the light-beam the

22
fiducial point closes a circuit that carries an electric
signal. That signal is used to start counting the steps
of the driving motor. After the signal from the fiducial
point has been read once the stepping motor can drive
the wheel forward or backward, from the position of any
filter, for an indefinite time.
The filter wheel was located 4 cm below the focal
plane. At this distance the F/9 beam illuminates an area
of about 4 mm in diameter on the filters.
Chopper
Frequent observations of the sky background were
made using the area scanner as a chopper., i.e.., only
discrete linear scans in three positions were allowed.
The driving mechanism of the scanner is provided by a
loud speaker coll and a permanent magnet. The coil is at
the end of a steel shaft, the diaphragm is at the other
end. When the coil is energized the shaft slides through
two oilite bearings. Position feedback is obtained with
a linear variable differential transformer (LVDT). The
transformer core is attached to the reciprocating steel
shaft. Essentially, the LVDT provides a DC voltage pro- •
portional to the displacement from the center position.
This voltage is subtracted from a fixed voltage produced
by an independent power supply and the difference is fed
to a DC power amplifier that energizes the coil.

23
Accordingly, for a given setting of the independent power
supply there is a rest position of the coil. If the coil
is forced to a different position the LVDT generates a
DC voltage that is used to generate the required power
for a return to the rest position. Different rest posi
tions can be repeated to within 0.05 nun; at the 228 cm
reflector, in the F/9 mode, such uncertainty corresponds
to 0.5".
Three rest positions were defined for the chopper:
the center one for observationof the star, and the other
two for observations of the sky on both sides of the
star. A diaphragm 10" in diameter was used in all the
observations, while the separation between the star and
sky position was set at 15".
In order to maintain the exit pupil of the opti
cal system immobilized on the detector, a 2.5 cm diameter
(F/2.5) Fabry lens was placed 6.4 cm above the cathode.
The distance between the focal plane and the Fabry lens
is 8.2 cm approximately. When the 10" diaphragm is in
the optical axis (star position) a spot 9 nun in diameter
is illuminated on the center of the Fabry lens. A dis
placement of few millimeters on the focal plane produces
a similar displacement on the Fabry lens. Sky observa
tions during daytime were performed in order to determine
the limit for off axis observations. The results indicate

24
that the chopper can be displaced 4 mm from the center
(40" off the optical axis) without reduction in the
signal.
Cryostat
Besides the well-known thermal dark current, there
are other thermal effects in photomultipliers that can
reduce the accuracy of astronomical photo-electric
photometry. In general these effects produce a multi
plicative noisej in contrast to the thermal dark current
that is an additive noise (Young 1974) . One example of
multiplicative noise is variations in the spectral re-
sponsivity of the cathode and the dynodes. Temperature
coefficients of +15? per degree centigrade in the red end
are characteristic of many cathode materials. The varia
tions become important on cooling far below the tempera
ture of the surrounding environment, when thermal
stability is difficult. Another example of multiplica
tive noise is variations in the collection efficiency of
the dynode string. This happens when the cathode and
the dynodes lose electric conductivity at low temperatures
and the electric field configuration between the different
components is altered. The net effect is a shift in the
statistic average of collected electrons.

25
On these grounds3 current ideas in the use of
photomultipliers favor more stable and less extreme
cooling temperatures.
The observations required in this investigation
were obtained with a photomultiplier refrigerated by a
thermoelectric (Peltier effect) cryostat. This particu
lar cryostat was tested in the laboratory to determine the
lowest temperature of the cooling walls and the amplitude
of the temperature fluctuations in the steady state of
the thermoelectric system. With the photometer at room
temperature (the approximate temperature of summer nights
on Kitt Peak) the cooling walls reached -19 C, with hourly
fluctuations less than 0.5 C in amplitude. With the
instrument in 0 C ambient, the lowest temperature was
-22 C. Slow fluctuations of almost 1 C were recorded in
this case. The time necessary to reach minimum tempera
ture ranged between three and ten hours. These changes
are certainly caused by different rates of heat dissi
pation of the Peltier elements in different ambient
temperatures.
The photomultiplier is hermetically sealed inside
the cryostat. A heated window is located about 3.8 cm
in front of the cathode. The supports of the window are
connected to the body of the cryostat3 where the
temperature takes an intermediate value between those

of the environment and the cooling walls. The heater
dissipates 5 W (at 110 V) and in steady state most of
the heat is lost by conduction, leaving the window at
about 15 C. The Fabry lens is located 2.6 cm above the
window. Due to its proximity to the heated window the
Fabry lens was always warmer than 0 C. The thermo
electric system of the cryostat and the window heater
were energized at least 20 hours' before an observing run
started. To preserve temperature stability they were
kept working, day and night, until the observing run
ended.
The observational results, obtained throughout
the four seasons of the year, indicate that the use of
the thermoelectric cryostat was sufficient to avoid
drifts of the zero point during one night. Changes of
0.01 to 0.03 mag were recorded between different runs.
Computerized Controls
Coordination between the position of the filter
wheel, the star-sky chopper, and the integration times
was maintained with a Nova 800 minicomputer with 20,000
memory words. Registration of the signal, labeling and
storage of the data was also done with the computer.
Permanent peripherals used in these tasks were a disk
unit, a magnetic tape driver, and a teletype.

27
Interface
Digital signals between the computer and the
photometer were transferred by an electronic interface.
One unit of the interface was assigned to link the
stepping motor and the fiducial point of the filter
wheel with the computer. A second unit was used to drive
the chopper. The digital signals from the computer were
processed in this unit and transformed into analog
signals to feed the voice coil. Another unit was attached
to the binary counter used to register the signal from
the photomultiplier. The capacity of this unit was 64,000
counts with a maximum counting speed equivalent to
10 MHz.
The main unit of the interface was connected to
two control panels. One panel was placed on the observ
ing platform, and the other one in the computer room.
Both panels were composed of ten push buttons and a
numerical display. Each button was assigned a specific
command to control the observations. For instance, one
button was used to start and stop an observation; a
second one was used to obtain a printout on the teletype
of the data from the last observation; a third button
produced a pause during an observation in order to check
the position of the star in the diaphragm. Several
buttons were used to monitor different data (such as

28
star counts, sky counts, and total integration time) on
the numerical displays.
Software
Programming of the controls and the data handling
was done in FORTH language (Moore 197*0- A basic dic
tionary of 27 definitions was produced to operate the
photometer. Most of these definitions were instructions
to be executed by the components of the photometer. They
were coded to the Nova 800 to be interpreted by the FORTH
assembler. The basic dictionary could be used to pro
gram a wide range of observing routines and data handling
modes.
In order to provide a permanent access to these
definitions, once the basic dictionary was loaded, two
major tasks were run simultaneously in the computer.
One task was to sense the push buttons every 0.1 s,
independently of the teletype. The second task was to
perform the observing routine. At the moment that the
start push button was "on," the second task was initiated.
Then, data acquisition was performed in repeated cycles.
When the start push button was sensed "off" by the first
task, the second task stopped at the end of a cycle.
This programming mode is suitable for the opera
tion of the photometer by only one person located next
to the instrument or in the computer room.

29
Photomultiplier Operation
A photomultiplier with a S-20 spectral respon-
sivity and manufacturer designation D 224 was used in
the photometer. This tube is an adaptation of the EMI
9558 photomultiplier, with a focusing electrode that
funnels photoelectrons from a circle (up to 1 cm in
diameter) in the center of the cathode into the first
dynode. Thermionic emission from outside the active
center of the cathode is screened by a mask in front of
the first dynode. Under a given set of operational con
ditions, the optimum voltage for the focusing electrode
corresponds to the collection of photoelectrons from the
illuminated area of the cathode only. The anode signal-
to-noise ratio is highly dependent on this effect and
can be used to determine the optimum voltage. Regulation
of the focusing electrode is provided by a.reostat
placed in the socket of the tube.
The principal detection methods used with photo-
multipliers have been analyzed by Young (1969) . The
methods used in astronomical observations are (1) dc
current or voltage measurements, (2) charge integration,
and (3) pulse counting. These methods are possible,
and in fact, they are not far from the optimum detection,
because the anode output is a pulsed current. The essen
tial difference between these detection schemes is the

30
weighting function applied to the pulse registration.
In dc techniques each pulse is weighted by its height
(measured as charge or voltage); in pulse counting all
pulses within a range of heights are given weight unity,
and the remaining pulses are ignored. When digital
techniques are used in the general operation of a
photometer it is advantageous to use pulse counting.
The operation of our D 22H photomultiplier was in
the pulse counting mode. A Spacom-135 voltage sensitive
pulse amplifier and discriminator was connected to the
anode of the photomultiplier. Maximum and minimum
sensitivities of the amplifier are 0.11 and 3.16 mV
respectively. At maximum gain the discriminator is
recommended for frequencies below 12 MHz, according to
the manufacturer. This implies that the resolution time
of the discriminator is about 83 ns. The amplifier
discriminator system produces one standard output pulse
of 2.9 V amplitude and 53 ns width. The output pulse was
carried to the counter by a coaxial cable with matched
impedance at both ends. The threshold of the discrimi
nator can be monitored with special output voltage that
ranges between 0 and +4 V. The actual threshold is
approximately proportional to the inverse square of the
output voltage. No discriminator is provided for high
pulses.
31
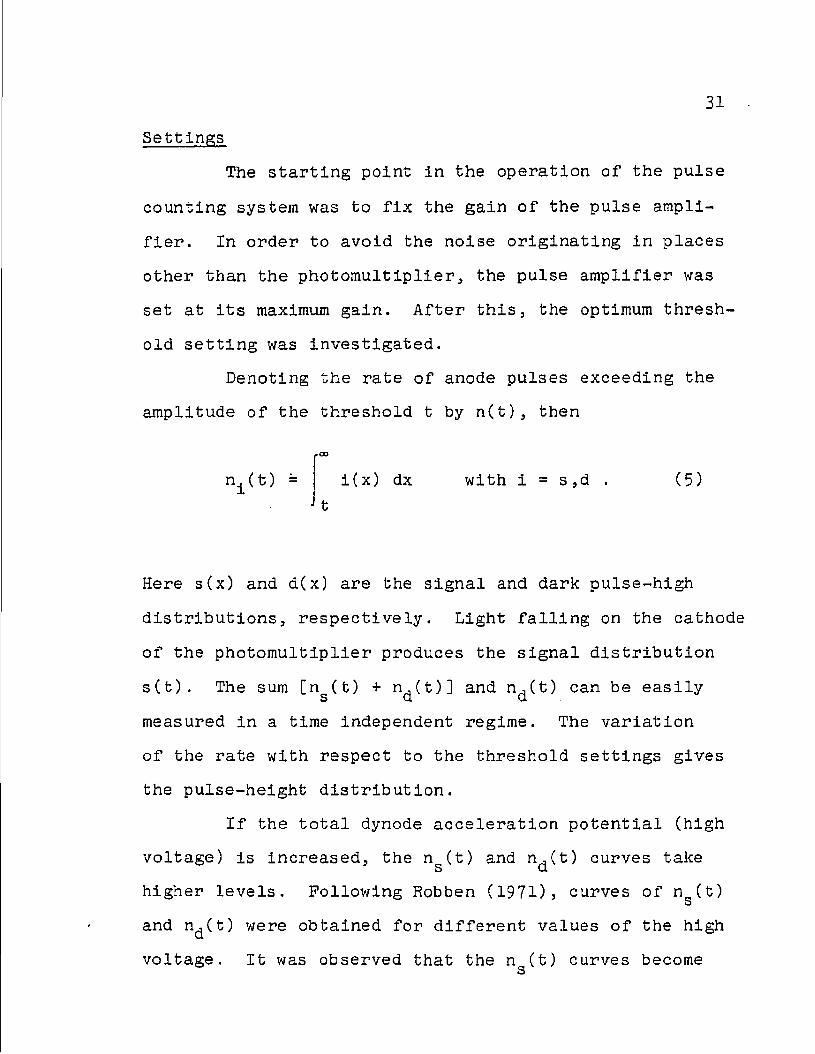
Settings
The starting point in the operation of the pulse
counting system was to fix the gain of the pulse ampli
fier. In order to avoid the noise originating in places
other than the photomultiplier, the pulse amplifier was
set at its maximum gain. After this, the optimum thresh
old setting was investigated.
Denoting the rate of anode pulses exceeding the
amplitude of the threshold t by n(t), then
n±(t) = i(x) dx with i = s,d . (5)
t
Here s(x) and d(x) are the signal and dark pulse-high
distributions, respectively. Light falling on the cathode
of the photomultiplier produces the signal distribution
s(t). The sum [ns(t) + n^(t)] and n^(fc) can be easily
measured in a time independent regime. The variation
of the rate with respect to the threshold settings gives
the pulse-height distribution.
If the total dynode acceleration potential (high
voltage) is increased, the n (t) and n,(t) curves take S CL
higher levels. Following Robben (1971), curves of n (t)
and n^(t) were obtained for different values of the high
voltage. It was observed that the n (t) curves become s

32
almost independent of the threshold t at 1500 y. For
higher acceleration potentials n (t) increases very slowly s
in comparison with the increase of n^(t); therefore,
1500 V was chosen as the operating high voltage.
The optimum threshold level was determined with
the method derived by Young (.1969). In the framework of
this method, the threshold that allows maximum signal-
to-noise ratio is given by the relation
2 s(6i _ nS(t) (61 2 HTtT " H^TtT - c '
The value of t that satisfies this relation can be easily
found by plotting both ratios with respect to the thresh
old settings. The average of several determinations,
with the D 224 tube at 1500 V, indicates that the optimum
threshold is 3.0 0.1 V in terms of the monitoring
voltage. If the actual threshold is proportional to the
inverse square of the monitoring voltage, the uncertainty
of 0.1 V is equivalent to less than 2% error in the
threshold.
On October 7> 197^, after the observing program
was almost completed, the tube and the pulse counting
system were tested at the Kitt Peak National Observatory
Photomultiplier Laboratory. The tests were made inde
pendently by Mr. David Stultz using an automatic pulse

33
analyzer. He found that the optimum high voltage was
1500 V and that the threshold setting should be 2.96 V.
These results corroborate the early determinations and
Indicate that the detection system was very stable.
Tests
Aside from the several operational tests mentioned
above the performance of the photomultiplier was investi
gated for linearity and polarization effects with obser
vations at the telescope.
Deviations from linear response in a pulse count
ing system are due to finite resolving time of the circuit.
At low signal levels the rate of registered pulses is
given by
n . „ = , (7) reg 1 + nr
where T is the resolving (dead) time and n is the rate
of pulses available for counting (Kelley 1964).
The maximum frequencies allowed in our system
have been mentioned above. They correspond to dead times
of 80 ns in the amplifier-discriminator and 100 ns in
the counter. It seems safe to accept 100 ns as the re
solving time of the system in order to determine the
maximum rate allowed by the system before the number of
lost pulses become comparable to the statistical error
3^
of the signal. According to Equation 7 after an inte
gration time t the number of lost pulses is (n - n )t
= nt tn . If we request that the statistical error reg
of the Incoming pulses, /nt, is about ten times larger
than the number of lost pulses, then
/nt > 10 nt tn . (8) — reg
— 2 Requesting a relative error /nt / nt = 10~ , we find
that the maximum rate of registered pulses should be ii
10 counts s . The combined optical efficiency of the
228 cm reflector and the photometer, with the Stromgren
4 y filter, is 2. 5 approximately. Therefore 10 counts
s"1 are produced by illumination corresponding to
V = 11 mag.
The brightest white dwarf in the observing pro
gram was 40 Eri B (EG 33) with V = 9-52 mag. The signal
4 -1 rate of this star was 5 x 10 counts s . For this rate
/n - (n - n ) =* 240 counts s~^. However, the statisti-reg
cal error is negligible in comparison with the signal,
and deviations of linearity, at this level, are un-
noticeable. Analysis of the relation between log n
(obtained with the y filter) and the V magnitude of
stars in the photometric sequences of 3C 48 (Penston,
Penston and Sandage 1971) and the Selected Area No. 60

35
(Priser 197*0 proved that, between 9-5 and 16.8 mag,
response Is linear to an accuracy of 0.01 mag. Fainter
stars were not observed; however, there is no reason to
question an extrapolation of the linear relation for low
signals.
Deviations in the response can also be produced
by polarized Illumination of the photomultiplier. Light
transmitted Into the first dynode, or simply anisotropy
of the cathode can produce significant differences in
the response If the polarization has the right orienta
tion (Young 1974). Although it appears that linear
polarization Is not a common property of white dwarfs,
especially in the DA type, interstellar or intrinsic
polarization can be significant in standard stars. For
this reason several tests were performed to determine
the effect of linear polarization in the D 224 photo-
multiplier. Observations of several BL Lacertae objects
(with intrinsic linear polarizationof about 10%, gen
erally) were obtained changing the orientation of the
photometer by 45 degrees. The results indicate that no
significant effect was present. Nevertheless, these
results were declared Inconclusive after linear polariza
tion observations of some BL Lacertae objects by
Serkowski (1974) revealed that their polarized flux can
change by significant factors in time scales of 30

36
minutes. A second test was performed with a beam almost
completely polarized. A polarizer sheet, type HN-32,
was placed in the telescope beam just above the focal
plane. For this polarizer the transmitted beam is 97# o
polarized at 4000 A, and more polarized at other wave
lengths. Several stars were observed eight' times each,
with the orientation of the photometer changed in 45
degree steps. The results contain no variations above
statistical error of the signal, in the four spectral
bands used. After these measurements it was concluded
that the photometer is not sensitive to linear polariza
tion .
Radiometric Calibration
The spectral bands used in this investigation
are described by their relative spectral responsivity as
presented in Appendix A. They were determined by measur
ing the reflectance of the mirror in the telescope, the
filters transmittance, and the detector spectral re
sponsivity normalized to its peak value. These three
factors were measured independently and in different
dates as described below.
Mirrors
According to the empirical results derived by
Hass and Waylonis (1961), the main factors affecting the

37
reflectance of evaporated aluminum are: the rate of
deposition, pressure during the evaporation, and thick-
_<5 ness of the deposited film. Pressures above 2 x 10
mmHg and evaporation times longer than one minute produce
a significant reduction of the reflectance in the ultra-o
violet. Also, films thinner than 600 A are highly trans-o
parent, while thicker than 1000 A show excessive surface
roughness. In both cases the result is low reflectance
over the ultraviolet and optical spectrum.
The two mirrors of the Steward Observatory 228 cm
telescope were aluminized on July 29, 197^. Several
pieces of glass were simultaneously aluminized in order
to have sample mirrors to measure the reflectance. The
aluminization conditions, for the telescope and sample
mirrors, were set at their optimum values: evaporation
- 6 0
time 30 s; pressure 5 x 10 mmHg; thickness 700 A.
Two weeks after the deposit the reflectance of
the sample mirror was measured in a Cary spectrometer
at Kitt Peak National Observatory. The results confirmed
high ultraviolet reflectance and a maximum of about 87% O
reflectance at 5000 A. The samples were kept in the dome
with the telescope and remeasured after six months.
Although the maximum reflectance was only 85% this time
(apparently due to deposits of dust) the wavelength
dependence was unchanged. The square of the reflectance,

38.
i.e., the effect of reflections by two mirrors, was de
rived and is presented in Appendix A.
Filters
The u and y filters used were u and y ones of the
Stromgren four-color system. The Steward Observatory set
is one of the 50 matched sets distributed by Kitt Peak
National Observatory in 1970. Detailed transmittance of
these two filters have been published by Crawford and
Barnes (1970). The s (A-4600 A) and 8 filters were pur
chased specially for this investigation. Both are inter
ference filters with no transmission leaks in the 3000 o
to 9000 A region, where the detector described below is
more sensitive.
The transmittance of these four filters were
measured several times during 197^, with the Gary
spectrometer at Kitt Peak National Observatory. In two
occasions the filters were measured after a day of cool
ing, to about 0 C, in a refrigerator. Variations up to
4% in the transmission with respect to the transmittance
obtained at room temperature were measured. These
results indicate a mild effect of temperature in the
four filters, at least in the 0 to 25 C range. Prom the
several measurements it was concluded that the trans
mittance is known within 2% for any of the four filters.
Individual parameters of the filters are presented in

39
Table 1. Half bandwidth corresponds to the width at 50%
transmittance and the equivalent width corresponds to
the width of a band with 100# transmittance, centered
at the peak wavelength, with integrated transmission
equal to the integrated transmission of the filter.
Table 1. Filters' characteristics.
Filter Parameter u s 6 y
Peak wavelength o A 3 4 5 0 4 6 0 7 4 8 5 0 5 5 1 5
Half bandwidth o A 3 9 0 1 7 0 3 5 0 2 2 0
Equivalent width o A 1 6 9 1 1 0 2 4 0 2 1 4
Peak transmittance % 4 2 6 4 6 5 8 7
Detector
The relative spectral responsivity of the de
tector was measured by Mr. David Stultz (19 7*0 at the
Kitt Peak National Observatory Photomultiplier Laboratory.
The D 224 tube was maintained in the thermoelectric
cryostat; therefore, the resultant responsivity includes

40
the transmittance factors of the window and the Fabry
lens. The normal operational conditions were used:
cooling temperature at 20 C; high voltage at 1500 V;
threshold monitor at 3 V. Measurements were made at five o
wavelengths between 4000 and 8000 A. The source of radia
tion was an incandescent lamp at 2000 K, with narrow
band filters selecting the calibration wavelengths.
The relative radiation transmitted by each narrow band
was compared with the signal of the detector to obtain
monochromatic responsivity.
For the ultraviolet region the spectral re-
sponsivity was obtained from data provided by the manu-
facturer. Although the manufacturer measurements were
made at room temperature, there are no reasons to suspect
significant changes for low temperatures. For trialkali
cathodes (S-20 responsivity) the ratio of -18 C to room-
temperature sensitivity has been found to be almost
independent of wavelength in the ultraviolet region
(Young 1963) .
The data from the two spectral regions were o
matched at 4000 A in order to produce interpolated values
In Appendix A the spectral responsivity, relative to its o
maximum valuej is listed from 3100 to 7700 A.

CHAPTER 3
OBSERVATIONS
The observations were obtained on 16 different
dates between February 197^ and January 1975. Only nights
that started with good photometric conditions were used.
On three dates the observations were suspended due to
suspected or evident deterioration of the photometric
quality of the atmosphere. The final results are presented
in this chapter preceded by a description of the observing
program and a discussion of the reduction techniques.
Observing Program
The original observing program was assembled from
well-known DA white dwarfs selected according to two
levels of priority: first, stars with measured trigono
metric parallax larger than 0."040, and second3 stars
brighter than 15th magnitude. With the program in pro
gress other degenerate stars were also observed; they
include DO, DC, and circularly polarized stars. The
results obtained with these stars demonstrate the advan
tages of a photometric system tailored to DA white dwarfs.
Ml

42
Standards
In order to monitor the stability of the equip
ment, determine the atmospheric extinction, and transform
the y magnitude into the standard V system, a series
of bright (V = 10 mag) stars were chosen as standards.
They were selected from; the list given by Peterson (1970),
the Selected Area stars observed by Priser (197*0, and
the secondary standards published by Philip and Philip
(1973)• Although none of these stars are primary stand
ards their visual magnitude is expressed in the standard
V system and there is no indication that any of them is
variable. Special care was taken to include stars in
a wide range of color indices. The bluest star selected
was BD +28° 4211 (spectral type sd 07p and (B-V) =
-0.37 mag). These pseudo standard stars were observed
at regular intervals between the observations of white
dwarfs; therefore, all the parameters derived with their
observations should be applicable to the program stars.
Routine
The same observing routine was employed through
out the program. The four filters were alternated in
cycles according to the sequence: y, 8, s, u, u, s, 6, y.
An observation was ended only after the y filter was
sampled an even number of times. During the time that
a given filter was in the beam the sky was sampled 15"

43
north and 15" south of the star. The sequence followed
in the observation of the star and the sky is illustrated
in Figure 4.
The total observing time of the star equals the
observing time of the sky (= 4 x DT). This sampling
mode over-observes the sky when bright stars are measured
For optimum efficiency the star observing time and the
sky observing time should be proportional to the statisti
cal errors of their respective signals (Young 1974).
Accordingly, equal observing times correspond to stars
that are as bright as the portion of the sky included in
the diaphragm. This situation is approached if observa
tions of faint stars are obtained during occasions of
significant scattered moonlight in the atmosphere. In
our program such occasions were encountered very often,
and mainly for this reason it was decided to maintain
equal observing time for the star and the sky.
Common values of DT were: 0.25, 0.5, 1, 2, and
4 s. The longer intervals were used with fainter stars
in order to reduce the amount of time spent on filter
changes and motion of the chopper.
During the course of one observation, the
statistical error, i.e., square root of the star counts
integrated in the least efficient spectral band, was
monitored. Normally, after it reached 1% of the

44
+ 15
i/i a z O KJ 114 V) U QC <
-15
i i i i i i i I i I r
I- DT -I
I I I 1 I I I 1 I I T I M E - +
Figure 4. Sequence of star and sky observations. — The line shows, schematically, the position of the diaphragm during the observation with a given filter. The star is observed in position 0 arc seconds. Sampling of the sky was made 15 arc seconds north and south of the star. The dotted lines indicate observations with a different filter.

45
integrated signal the observation was stopped. The data
collected were stored by the computer on the disk and
after the observation ended t.he data from the four bands
were displayed for inspection. For each observation the
computer stored also the Universal Time of start and
end, and the Local Siderial Time corresponding to the
mean.
At the end of an observing run, the complete body
of observations was copied into a magnetic tape for more
permanent storage. As a backup, a printout of the obser
vations was also obtained. This printout was later used
to start the reductions.
Data Reduction
The reductions were performed with a Hewlett
Packard 9810A calculator. The first step was to trans
form the data of each observation into magnitudes and
colors. For this purpose the following relations were
used:
m = 2.5 log(n ) + 22.0 (9) y
and
(i-j) = 2.5 logt^/n.) (10)
with i ^ j; i - u, s, B and j = s, 6, y. Here ny, n±,
and n^ are the registered rate of counts from the star

46
free of sky background. The magnitude observed in the y
band is denoted by m and (i-j) represents the color index
between two different bands. In a second step, the air
mass of each observation was computed with the (corrected)
formulae given by Schulte and Crawford (1961).
The rest of the reductions were made with equa
tions that redress the effect of atmospheric extinction
and place the magnitude and color in homogeneous scales.
To determine the coefficients of those equations only
the observations of the stars considered as standard
were used.
Extinction
The extinction coefficients were determined with
the method derived by Stock (1969) for wide-band photome
try. This method assumes that the extinction is linearly
dependent on the colors, and requires observations of
stars separated by about four hours of Right Ascension
in order to obtain data at optimum air masses. For this
purpose the photometric sequences in Selected Areas
(Priser 197*0 were used. Determination of the extinction
coefficients was pursued every observing night of the
program. Independent determinations were obtained in
13 of the 16 dates. Values of the coefficients are pre
sented in Table 2, Mild color-dependence of the extinc
tion (b = -0.015) was found in the magnitude m and the

Table 2. Extinction coefficients.
y (u-s) (s-y) (s-g) (3—y) a ba ba ba a mag mag mag mag mag mag mag mag
197^ Feb 2 0.213 -0.014 Feb 3 0.199 -0.013 Mar 11 0.236 -0.012 Apr 30 0.222 -0.011 May 1 0.234 -0.012 Jun 8 0.194 -0.020 Jun 9 0.194 -0 .021 Jun 28 0.210 -0.015 Jun 29 0.210 -0.015
Aug 28 0.208 -0.004 Sep 9 0.335 -0.018 Nov 4 0.165 -0.020 Nov 5 0.168 -0.005 Nov 25 0.186 -0.015 Dec 3 0.206 -0.015
1975 Jan 22 0.186 -0.015
0.44 -0 . 0 1 0 r 0 6 1 - 0 . 0 3 0 0 . 0 5 8 0.044 0.44 -0 .02 0 . 0 6 1 T-0 . 0 3 0 0 .046 0.047 0.49 - 0 ,014 0.104 r-0 . 0 3 4 0 .070 0.059 0 f 482 - 0 . 0 1 6 0 . 0 9 4 - 0 . 0 2 9 0 .058 0,047 0.483 - 0 .024 0 . 1 0 6 -0 . 0 2 7 0 . 0 6 6 0.048 0.452 -0 .032 0 . 0 9 5 -0 .033 0 .059 0.049 0.465 -0 • 035 0 . 1 0 3 - 0 . 0 3 3 0 .069 0.044 0.49 -0 . 0 1 0.100 -0 . 0 3 3 0 .037 0.050 0. 4 9 -0 . 0 1 0.100 -0 ? 033 0 .036 0.050
0.50 - 0 .01 0 . 1 0 3 -0 . 04l 0 .051 0.049 0.62 - 0 .01 0 . 1 6 5 - 0 .041 0 .066 O . O 8 7 0.475 - 0 . 0 2 8 0 . 0 8 0 -0 .020 0 .054 0.031 0.45 - 0 . 0 1 3 0 . 0 7 0 - 0 .032 0 .056 0.021 0.45 -0 .01 0 . 0 8 7 -0 .025 0 .068 0.064 0.44 -0 .01 0 . 0 8 9 - 0 .022 0 .064 0.050
0. 5 8 -0 .04 0 . 0 8 2 -0 .025 0 .064 0.055

48
(u-s) color. Significant dependence (b - -0.030) is
present in the extinction of (s-y).
The extinction color dependence of (s-B) and
(B-y) was found insignificant when derived with observa
tions of standard stars. However, due to the strong
absorption lines of the white dwarfs it was uncertain
that the color independence could apply to the program
stars also. Therefore, the extinction coefficients for
(s-6) and (B-y) were determined with observations of
white dwarfs. The result in this case was similar to that
found with the standard stars; hence it was decided that
b = 0.0 for the two color indices involving 3.
In the lines of the Stock method, values of the
magnitude m and the color indices free of atmospheric
extinction were obtained with the following equations.
mQ = m - {a + b (s-y) } X (11)
and
(l-j)0 * ff + Ci-J)> e"bX - | (12)
with i J* j; i = u, s, 8, and j = s, B, y. In these two
equations the subindex zero labels the values at air
mass X = 0.0 (i.e., free of atmospheric extinction).

49
Trans format 1 oris
The resultant values of m and (i-j) were o o
analyzed for night-to-night drift of the zero point in the
scale of magnitudes. A clear relative shift was found in
the observations obtained after the realuminization
(29 July 1974), evidently caused by the new reflectance
of the telescope mirrors. For a finer analysis of the
night-to-night drift the data were divided into those
observations obtained before and after the alumlnization
date.
Relative shifts in the zero point of mo as large
as 0.03 mag were found in both periods. For each period
the night with more observations of standard stars was
selected as a reference night and the rest of the nights
were corrected by their zero point shift. After that,
the following transformations of mQ to the standard V
system were found. For observations of the first period
(labeled with the superscript I):
V = moI - 1.741 - 0.07 (s-y)oI; (13)
and for observations of the second period (super
script II) :
V = moI]C - 0.682 - 0.06 (s-y)oX1 (14)

50
The situation with the color indices is of simi
lar character. However, in this case it was decided to
transform the data from the first period to the zero
point and scale of the observations obtained in the
second period. The transformation equations were the
following:
(u-s) 11 = -0.052 + 1.102 (u-s) 1 s o o
(s-y)Q11 = -0.074 + 1.044 (s-y)0I 3
(s-B)o11 = -0.026 + 0.955 ,
C0-y)q11 = -0.084 + 0.945 (6-y)QI . (15)
A final transformation step is required in order
to eliminate zero point shifts due to the arbitrary
values assumed for the zenith air mass and the neutral
extinction. Observations obtained outside the atmosphere
should be free of such systematic error and a direct
comparison with our colors would be sufficient to derive
the amount of the shift. At the present time a possible
way to determine the zero point shift is to make use of
the energy distributions of several white dwarfs ob
served by Oke (1974) and Greenstein (1974a). Those

51
energy distributions have been published at numerous
wavelengths and can be integrated in our four spectral
bands (see Appendix A) to derive outside of the atmo
spheric colors. However, the data is based on the abso
lute calibration of Vega provided by Oke and Schild
(1970), which, as documented by Mihalas (1975), is
affected by overestimated ultraviolet extinction. The
necessary correction has been derived by Hayes and Latham
(1975) after an apparently accurate consideration of the
different components in the atmospheric extinction.
Accordingly, the data of the seven stars listed
in Table 3 were corrected by the amount prescribed by
Hayes and Latham (1975) and the resultant energy distri
butions were integrated in the u, s, 6, and y bands to
produce outside of the atmosphere colors. As expected,
the differences between the synthetic and the observed
colors were found to be independent of the stars' colors.
The final transformations to outside of the atmosphere
are given by the following equations.
(u—s) = (u-s)oI3: + 0.095 ,
(s-y) = (s-y)o11 - 0 . 3 1 4 ,
(s-B) = (s-a)011 - 0.041 ,
(S-y) = (6-y)Q11 - 0.375 . (16)

Table 3. Zero-point-check stars.
52
EG No. Sp. T. (B-V) Energy Distribution Ref.
50 DA
CO o
S •
o I Oke (1974)
86 DO -0.36 Oke (1974)
98 DA wk
O
*—1
*
o 1 Oke (1974)
139 DA -0.07 Oke (1974)
148 DC + 0.17 Oke (1974)
247 DA wk -0 .32 Oke (1974)
2 9 0 DCP +0.62 Greenstein (1974a)
The uncertainties of the zero point for the colors
as derived from the seven stars in Table 3, are +0.021 mag
for the (u-s) color and less than +0.010 mag for the
other three colors. A possible cause for the larger
uncertainty in the ultraviolet region could be an in
correct spectral responsivity of the detector. At the
present time practical difficulties with the calibration
of the photomultiplier preclude a reduction of the uncer
tainty attached to the u band.

53
Photometric Results
The resultant V magnitudes and the four color
indices of the DA white dwarfs included in our program
are presented in Table 4. The first column gives the
number of the star in the sequence established by
Greenstein (1974b). A cross reference to original names
and other designations has been published by McCook and
Sion (1977). The uncertainties quoted for the V magni
tude and the colors correspond to the standard deviation
of one observation. The last two columns give the number
of observations and the spectral type3 respectively.
Spectral types are reproduced from the series of papers
by Greenstein. Only individual observations obtained in
different nights have been considered to derive the re
sultant data. When one star was observed more than once
during a night, the observation with the smallest air
mass was selected as representative of that night. The
averages of the values of V were obtained with weight
unity for each observation. In the case of the colors
the averages were computed by weighting the individual
observations with the inverse square of the air mass.
This weighting mode is dictated by the variation of the
statistical error of the signal with air mass (Stock 1969)
Table 5 presents the photometric results of the
non-DA degenerate dwarfs included in our observing program

Table 4. The u3 s, 3, and y photometry of DA white dwarfs.
EG No. V + 0 (u--s) + CT (s-y) + 0 (s -e) + a (3-y) + a n Sp.T
10 14.17 -0. .325 -0.708 0. 262 -1.049 1 (DA) 11 12.86 0, .01 -0 .399 0 .020 -0.412 0 .020 0. 506 0 .030 -1.017 0, .030 5 DAs 15 13.21 0 .01 -0 .816 0 .016 -0.827 0 .016 0. 293 0 .015 -1.214 0, .017 3 (DA) 17 13.59 -0 -905 -0.852 0. 290 -1.261 1 (DA) 26 14.46 0 .01 -0 • 509 0 .016 -0.804 0 .014 0. 251 0 .005 -1.145 0 .010 3 DA
28 13.74 0 .01 -0 .445 0 .016 -0.720 0 .012 0. 286 0 .004 -1.099 0 .016 4 DA 29 15.24 0 .02 -0 • 551 0 .020 -0.782 0 .018 0. 251 0 .011 -1.137 0 .021 2 DA 30 14.11 -0 .405 -0.752 0. 257 -1.129 1 DA 33 9.49 0 .02 -0 .581 0 .030 -0 .802 0 .047 0. 276 0 .003 -1.170 0 .002 5 DA 34 15.65 -0 -375 -0.756 0. 326 -1.205 1 DAs
36 14.26 0 .01 -0 .839 0 .032 -0.819 0 .019 0. 298 0 .025 -1.220 0 .009 2 (DA) 37 13-99 0 .01 -1 .023 0 .032 -0.847 0 .013 0. 301 0 .019 -1.257 0 .005 2 (DA) 38 13.78 -0 .555 -0.468 0. 396 -0.970 1 DAe 39 14.14 -0 .895 -0.838 0. 328 -1.263 1 DA 42 13.82 0 .04 -1 .152 0 .046 -0.872 0 .026 0. 319 0 .035 -1.300 0 .088 2 DAn
46 13.49 0 .05 -1 .097 0 .038 -0.850 0 .031 0. 311 0 .020 -1.281 0 .034 3 DA 50 11.85 0 .02 -0 .926 0 .038 -0.861 0 .022 0. 292 0 .003 -1.245 0 .019 4 DAn 67 13.29 0 .02 -0 .379 0 .012 -0.778 0 .012 0. 279 0 .009 -1.156 0 .014 6 DA 70 13.01 -1 .075 -0.892 0. 305 -1.285 1 DAn 76 13.06 0 .02 -0 .559 0 .020 -0.788 0 .001 0. 273 0 .009 -1.174 0 .003 4 DA
83 13.68 0 • 03 -0 .565 0 .007 -O.792 0 .012 0. 289 0 .014 -1.168 0 .030 4 DAs 87 13.25 0 .03 -0 .157 0 .040 -0.349 0 .021 0. 379 0 .024 -0.860 0 .025 4 (DA) 99 13.33 0 .03 -0 .479 0 .039 -0.773 0 .020 0. 262 0 .021 -1.162 0 .025 6 DA 102 12.81 0 .03 -0 .890 0 .040 -0.860 0 .060 0. 302 0 .021 -1.247 0 .025 6 DA 115 14.38 0 .01 -0 • 345 0 .011 -0.665 0 .007 0. 312 0 .008 -1.073 0 .015 5 DA

Table 4. — Continued.
EG No. V + a (u--s) + a (s-- y ) + a 0 3-3) + 0 (3-y) + a n Sp.T.
123 14 .36 0 .02 -0 .343 0 .012 -0 .753 0 .012 0 . 2 7 0 0 . 0 0 8 - 1 . 1 2 5 0 .005 3 DA 125 13 .94 0 .04 -0 .355 -0 .789 0 . 2 8 5 - 1 . 1 7 0 1 DA 130 14 .11 0 .01 - 0 .397 0 .015 - 0 .816 0 .019 0 .248 0 . 0 1 9 - 1 . 1 5 8 0 .017 2 DAn 131 12 .28 0 .01 - 0 .921 0 .003 - 0 .611 0 .001 0 . 5 0 1 0 . 0 2 8 -1.204 0 .002 2 DAwk 135 13 .62 0 .05 -0 .418 0 .039 -0 .453 0 .025 0 . 4 3 9 0 .020 - 1 . 0 7 1 0 .028 3 DAs
139 11 .55 0 .03 - 0 .843 0 .040 - 0 .852 0 .020 0 . 2 9 8 0 .020 -1.242 0 .027 5 DA 150 12 .84 0 .07 - 0 .711 0 .037 - 0 .828 0 .029 0 . 2 6 7 0 .033 - 1 . 2 2 8 0 .022 5 DA 155 14 .34 0 .01 - 0 .546 0 .026 - 0 .639 0 .017 0 . 3 3 9 0 .034 - 1 . 0 8 5 0 .040 4 DA 159 12 • 97 0 .04 - 0 .433 0 .031 - 0 .717 0 .003 0 . 2 7 5 0 .007 - 1 . 0 7 7 0 .013 3 DA l 6 l 15 .32 - 0 .415 - 0 .615 < i
' J 0 .286 - 0 . 9 8 9 1 DAn
162 12 .94 0 .02 - 0 .425 0 .035 - 0 .748 0 .001 0 .260 0 .019 -1.199 0 . 0 2 2 2 DA 168 14 .47 0 .01 - 0 .416 0 .017 - 0 .436 0 . 0 0 7 0 .496 0 .009 -1.063 0 .007 3 DAs 184 12 .51 0 .04 - 0 .909 0 .004 - 0 .851 0 . 0 2 6 0 .270 0 .021 -1.221 0 .030 4 DAwk 199 14 .28 0 .04 - 0 .314 0 .030 - 0 .342 0 . 0 2 6 0 .502 0 .035 -0.985 0 .038 2 DAss 201 12 .97 0 .04 - 0 .482 0 .038 - 0 • 794 0 .022 0 .248 0 .025 -1.138 0 .030 4 DAn
203 13 • 79 0 .06 - 1 .360 0 .013 - 0 .908 0 .020 0 .337 0 .010 -1.348 0 .037 2 DAwk 232 13 .67 0 .01 - 0 .867 0 .025 - 0 .720 0 .039 0 .305 0 .008 -1.144 0 .026 2 DA 247 11 .75 0 .01 - 1 .456 0 .042 -0 • 932 0 .008 0 .347 0 .006 -1.381 0 .007 2 DAwk 261 13 .10 0 .08 - 0 .426 - 0 .780 0 .249 -1. 0 9 7 0 .048 1 DA 283 15 .51 0 .02 + 0 .025 0
o o * - 0 .166 0 .017 0 .615 0 .014 -0.908 0 . 0 1 1 4 DF
G 6 9 -31 16 .15 - 0 .57 - 0 • 554 0 .369 -1.014 1 DA G76 -48 15 • 96 - 0 • 34 - 0 .392 0 .460 -0.941 1 DAwk

Table 5. The u, s, £, and y photometry of non-DA white dwarfs.
EG No. V + o (u-s) + 0 (s-- y ) + a (s - e ) + a (B-y) + a n Sp .T.
9 13.74 0 .03 - 0 . 754 0 .046 -0 .531 0 . 0 2 8 0 . 459 0,035 -1.127 0 . 0 3 8 2 DC 45 14.45 + 0 . 511 - 0 .730 0 . 775 - 0 . 8 3 1 1 DKe 52 14.59 0 .03 + 0 . 897 0 .063 - 0 .756 0.028 0 . 6 6 7 0.031 -0.784 0 .025 4 DC 54 12.94 0 .03 - 0 . 545 - 0 . 0 8 5 0.025 0 . 4 4 5 0.059 -1.048 0 .034 1 DF 71 11.21 0 .03 - 1 . 517 0 .005 - 0 • 913 0.017 0 . 378 0.021 -1.371 0 .026 4 DO
86 14.75 0 .07 - 1 . 479 0 .026 - 0 .884 0.040 0 . 371 0.042 -1.369 0 .108 4 DO 95 15.73 0 .04 +0. 535 0 .025 - 0 .072 0.030 0 . 611 0.020 -0.883 0 .037 3 DC 129 13-21 0 .01 - 0 . 937 0 .008 - 0 .598 0.008 0 . 493 0.005 - 1 . 2 1 1 0 .009 4 X4135 148 13.24 0 . 04 - 0 . 716 0 • 037 - 0 • 521 0.010 0 . 511 0.004 -1.109 0 .037 5 DC 180 12.34 0 .04 - 0 . 444 0 .031 - 0 .376 0.024 0 . 549 0.039 -1.067 0 .029 3 DC
202 16.64 0 .07 + 1 . 455 +0 .203 0.061 0 . 734 0.032 -0.604 0 .032 3 DC 250 13.80 0 .03 - 0 . 4l8 0 .020 - 0 . 412 0.008 0 . 542 0.009 -1-059 0 .010 6 DC 290 14.10 - 0 . 045 - 0 . 1 6 7 0 . 637 -0.916 1 DAP 329 15-08 0 .01 - 0 . 425 0 .021 - 0 .445 0. 0 0 5 0 . 506 0.031 -1.091 0 .030 2 DC-DF 374 15-51 0 .06 - 0 . 185 0 .020 - 0 .242 0.070 0. 616 -1.003 0 .028 3 DXP
VJi CT\

57
Uncertainties
In Tables 4 and 5 we have quoted the precision of
our observations, i.e., how reproducible are the data
registered by our instrument. The standard deviation
attached to one observation was computed after all the
reductions were made; therefore, random errors introduced
by the extinction corrections and the transformations are
included in the quoted uncertainty.
The average of the quoted standard deviations for
the colors provides an estimate of the uncertainty for
those stars with only one observation. These uncertain
ties are: 0.022 mag in (s-y); 0.030 mag in (u-s);
0.020 mag in (s-6); and 0.029 mag in (S-y).
In the case of the V magnitude, it is possible
to estimate an external error by comparison with photo
metric results found in the literature. For this pur
pose we have selected three different sets of observa
tions obtained under apparently independent conditions.
They are: (1) the V magnitudes published by Eggen and
Greenstein (1965a, 1965b, 1967) and Greenstein (1969);
(2) the V magnitudes obtained at the Naval Observatory,
Flagstaff station, and published by Priser (197*0,
Routly (1972), and Harrington et al. (1975); and (3)
the observations obtained by Graham (1972). This last
set of observations was obtained with the y filter of the

58
Stromgren system; however, the corresponding magnitude
is by definition the standard V magnitude. Comparison
of these sets of observations with our data has been
made in terms of the average absolute difference, defined
as A = J|V - V^|/N, where N is the number of common
stars in the two sets which visual magnitudes have been
labeled V and respectively. The results are pre
sented in Table 6. They indicate that an absolute differ
ence of about four hundredths of a magnitude is found in
the comparison of any two sets of observations. The
moderate increase of the absolute difference with the
number of common stars appears to be caused by the inclu
sion of fainter stars. Therefore, for the sample of
white dwarfs included in this investigation the external
error of the V magnitude is 0.04 mag approximately.

59
Table 6. External errors of the V magnitude.
V V. A N a b
(mag)
E and G This work 0.058 42
Graham This work 0.045 27
Naval Obs. This work 0.049 19
E and G Graham 0.044 28
E and G Naval Obs. 0 .040 17
Graham Naval Obs. 0 .030 10

CHAPTER 4
GRAVITY AND TEMPERATURE DETERMINATION
Several attempts to analyze photometric observa
tions of DA white dwarfs with computed model atmospheres
are registered in the literature. Terashita and
Matsushima (1969), and Strittmatter and Wickramasinghe
(1971) have investigated the UBV photometry. Stromgren's
uby colors have been analyzed by Wickramasinghe and
Strittmatter (1972), and recently by Wehrse (1975).
The same problem was attacked by Shipman (1972) using
low resolution scanner observations. Our attempt is
presented in this chapter. Gravities and effective
temperatures are derived, for 46 DA white dwarfs, from
the comparison of observed and computed reddening-free
indices.
Model Atmospheres
After the preliminary calculations carried out by
Schatzmann (1958), model atmospheres for DA white dwarfs
have been computed by several authors in a progressive
sequence of refinements. Early computations (Weidemann
1963) assumed a gray temperature distribution and chemical
60

61
composition of pure hydrogen or hydrogen and helium.
The ratio, by number, between these two elements was
approximated to the value of the (normal) composition
observed in the solar system (Cameron 1973). Non-gray
model atmospheres, with normal hydrogen and helium com
position, were computed by Terashita and Matsushima
(1966) in which they included the effects of pressure
ionization to determine the emergent flux and the Balmer
line profiles. Improved models, considering hydrogen
blanketing and a small amount of metals in the composi
tion, were also computed by Terashita and Matsushima
(1969).
The following generation of models for DA white
dwarfs included: more sources of continuous opacity,
accurate corrections to the temperature stratification
in order to maintain a constant flux of energy, and the
effect of pressure ionization on the density of ionized
atoms. As pointed out by Shipman (1972), failure to
account for this last effect produces a reduction of the
electron density which in turn generates weaker absorp
tion lines. At this level of elaboration we now find
three independent calculations of model atmospheres for
DA white dwarfs. First, Shipman (1972) published eight
models where the ratio, by number, of hydrogen to helium
was made equal to 99/1; second, a series of models for

62
high temperatures (25000 K _> Teff _> 10000 K) , with prac
tically normal composition published by Wickramasinghe
(1972); and third, a series of models at low temperatures
(12000 K >_ >_ 7000 K), published by Wehrse (1976)
where the abundance of elements heavier than oxygen was
reduced by 1/100 with respect to the normal composition.
These last two sets of models share, however, a signifi
cant degree of homogeneity because in the high tempera
ture set the heavy metals contribution to opacity was not
included. Consequently, a reduction in the metal
abundance will have insignificant influence on the emer
gent flux of DA models with T > 12000 K (Wickramasinghe SIX
( 1 9 7 2 ) .
Convection
Schatzmann (1958) suggested that a convective
zone can exist in some white dwarfs, beginning in the
atmosphere near the surface and extending towards the
interior. Theoretical corroboration for convective
transport of energy in white dwarfs was provided with the
precursory envelope models computed by Van Horn (1970).
Wickramasinghe and Strittmatter (1970) examined the
convective instability in the atmospheric layers of DA
models with log(g) = 8. According to their results, DA
atmospheres are stable between 25000 and 18000 K. At
lower temperature, the incomplete ionization of hydrogen

produces an increase in the opacity and reduction of the
adiabatic gradient, causing some convective transport
of the energy flux. At effective temperatures about
13000 K the atmosphere regains stability as the convec
tive zone descends below the last observable layers. For
temperatures ranging between 13000 and 8000 K the effect
of internal convection causes an increase of the tempera
ture in the predominantly radiative atmosphere and
reduces the temperature in the deep convective layers.
As shown by Wichramasinghe and Strittmatter (1970), and
Wehrse (1975) convective models produce bluer color
indices due to the heating of the surface layers.
Nevertheless, the corrections, with respect to pure
radiative models, amount to one or two hundredths of a
magnitude in the UBV and Stromgren colors . According to
these results, convection has a significant influence in
the atmospheric structure of DA white dwarfs; however,
it can be neglected in the analysis of color indices
without important loss of accuracy.
Synthetic Colors
In order to pursue this investigation the grids
of models published by Wickramasinghe (1972) and Wehrse
(1976) were selected to compute theoretical color indices.
These models have been used to investigate the derivation

64
of atmospheric parameters by Strittmatter and
Wickramasinghe (1971) and Wehrse (1975). A useful aspect
of these models is that the emergent monochromatic fluxes
has been published in a very fine sequence of wavelengths
This detail is indispensable when accurate theoretical
colors are needed to investigate observational results.
For purpose of our use, the theoretical monochromatic
fluxes F , published by Wickramasinghe (1972), were trans
formed into flux per unit wavelength.
r(X) are available, the theoretical colors are computed
with the relation
and the integrals are taken from zero to infinity, or at
least over all wavelengths for which the relative re-
sponsivitles r(X) do not vanish. These integrations
were performed numerically on the University of Arizona
CDC 6400 computer. In a first step F^(X) and r^(X) were
interpolated at intervals of 5 A with the double para
bolic interpolation routine PARCOE described by Kurucz
(1970). For this method, at least four points of a
When well known relative spectral responsivities
(i-J)c = -2.5 logC Fx(X)r±(X)dX]
(17)
O

65
discrete function are needed. The coefficients of the
interpolation parabola are determined by weighting for
ward and backward parabolas inversely by their second
derivatives. Subsequently the terms F^(^) x r^(X) were
formed and the integration was obtained with the routine
QSP described in the IBM/360 Scientific Subroutine Pack
age (197^). According to the available number of sample
points, QSP performs the integration with the Simpson's
rule, the Newton's 3/8 rule, or a combination of both.
Several tests were made to investigate the accumulated
errors of this integration method. The results indicate
that the uncertainty in (i—J)c is of the order 0.001 mag
if the discrete function is given at intervals smaller o
than 10 A.
Values of (i—J) are presented in Table 7 for the
models computed by Wickramasinghe (19 72) and in Table 8
for the Wehrse (19 76) models.
Reddening-free Indices
It is well known that the interstellar extinction
in the solar neighborhood is not negligible. In a study
of the interstellar reddening within 200 pc of the sun,
Stromgren (1972) found that for a group of 47 AO type
stars the values of E(b-y) range between 0.014 and 0.040
mag in some cases, and larger than 0.040 mag in others.
The large values appear to be concentrated in the

Table 7. Synthetic colors obtained with Wlckrainaslnghe's models.
Log(g) T e f f K (u-s)c (s-y)c d (s-e)c (3-y)c w
6 10000 0.025 -0.694 1.069 0 . 3 7 7 -1.071 0.871 12000 -0.142 -0.768 1.013 0 . 3 6 9 -1.137 0 .894 15000 -0.493 -0.800 0.710 0 . 3 9 4 -1.194 0.946 2 0 0 0 0 -0.845 -0.534 0.409 0.408 -1.242 0.982 25000 -1.051 -0.856 0.236 0.420 -1.276 1.009
7 10000 -0.242 -0.637 0.716 0.394 -1.031 0.870 12000 -0.209 -0.750 0.919 0.315 -1.065 0.807 1 5 0 0 0 -0.509 -0.798 0.691 0.349 -1.147 0.879 20000 -0.854 -0.834 0.400 0.377 -1.212 0.937 25000 -1.043 -0.563 0.255 0.391 -1.254 0.970
8 10000 -0.495 -0.589 0.391 0.430 -1.019 0.901 12000 -0.359 -0.696 0.688 0.294 -0.990 0.751 15000 -0.549 -0.784 0.630 0.288 -1.072 0 . 7 8 3 20000 -0.869 -0.829 0.378 0.334 -1.163 0.871 25000 -1.058 -0.860 0.235 0.356 -1.215 0.971
9 10000 -0.673 -0.558 0. 1 6 6 0.45^ -1.012 0. 9 2 2 12000 -0 .590 -0.624 0 .348 0.327 -0.951 0.766 15000 -0.636 -0.724 0.453 0.234 -0.958 O. 6 7 6 20000 -0 .904 -0. 8 0 9 0.312 0.279 -1.088 0.782 25000 -1.085 -0.848 0.190 0.310 -1.158 0.845
o\ o \

Table 8. Synthetic colors obtained with Wehrse's models.
Log(g) Teff K <u-s)c Cs-y)c d (s~^c ^~y*c -
7000 -0.489 -0.120 0.143 0.572 -0.993 1.031 8000 -0.506 -0.497 0.241 0.512 -1.009 0.978 9000 -0.458 -0.562 0.387 0.453 -1.015 0.921 10000 -0.108 -0.600 0.494 0.409 -1.008 0.875 12000 -0.390 -0.683 0.639 0.313 -0.997 0.773
7000 -0.558 -0.212 -0.239 0.627 -0.839 1.015 8000 -0.557 -0.275 -0.144 0.572 -0.846 0.963 9000 -0.5*13 -0.219 -0.214 0.628 -0.847 1.020 10000 -0.505 -0.359 0.035 0.501 -0.860 0.899 12000 -0.165 -o.o4o 0.196 0.431 -0.871 0.834

68
Scorpio-Ophiuchus and Taurus areas, while the smaller
reddenings are common outside these regions. More
recently, Turon and Mennessier (1975) have studied the
possibility that the Taurus and Ophiucus clouds are linked
by a thin elongated cloud passing about six parsecs from
the sun. The average reddening produced by such clouds
appears to be E(B-V) = 0.08 + 0.04 mag. Color excess of
such magnitude will produce significant discrepancies in
the observed colors of DA white dwarfs, therefore
reddening-free indices are needed in the derivation of
atmospheric parameters.
In order to determine the effect of the inter
stellar extinction in the colors obtained with the u,
s, 3, y bands the observed energy distributions of four
stars (EG 50, 86, 98, and 2^7; see Oke 197*0 were modi
fied with the Cygnus extinction law, and the reddened
color computed by numerical integration. Nandy (1968)
has investigated the extinction curves in several galac
tic regions and concluded that the Cygnus curve appears
to be the average extinction law for the majority of the
stars. In the computations, the Cygnus curve was normal-o
ized at 4500 A, and normalization values of one and two
magnitudes were used. The computed color excesses define
straight reddening lines in the (u-s) versus (s-y), and
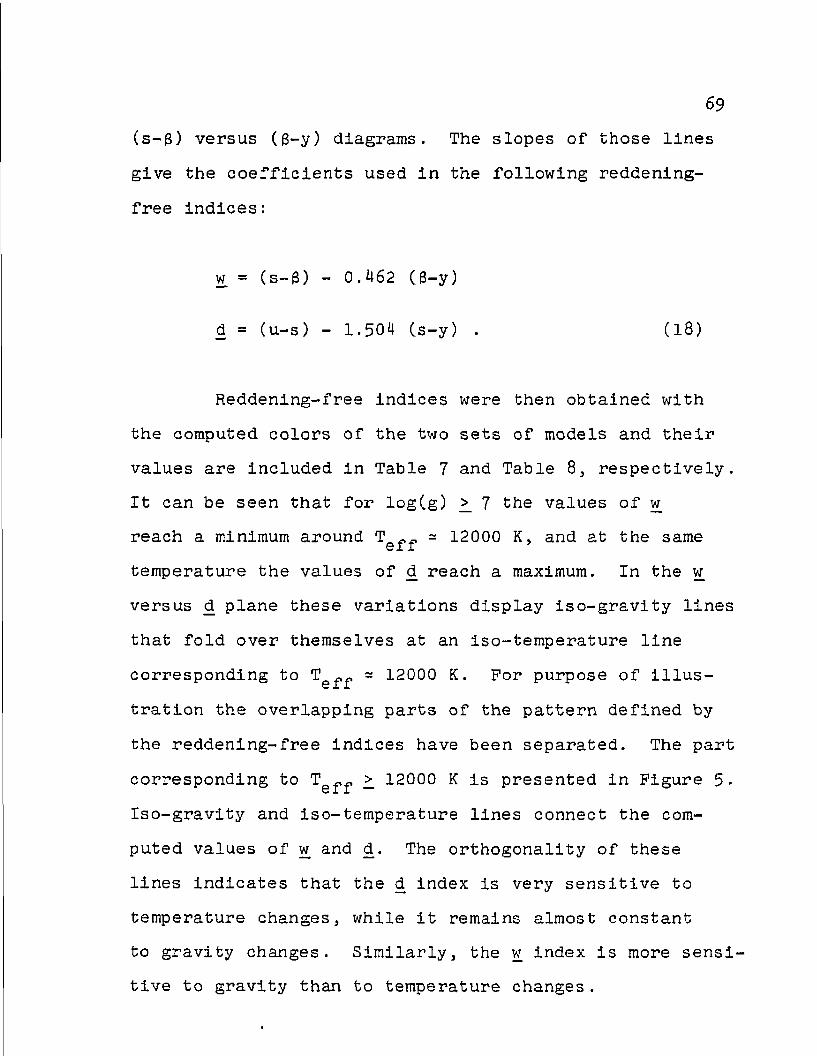
69
(s-fj) versus (6-y) diagrams. The slopes of those lines
give the coefficients used in the following reddening-
free indices:
w = (s-S) - 0.462 (6-y)
d = (u-s) - 1.504 (s-y) . (18)
Reddening-free indices were then obtained with
the computed colors of the two sets of models and their
values are included in Table 7 and Table 8, respectively.
It can be seen that for log(g) >_ 7 the values of w
reach a minimum around Tg^^, =* 12000 K, and at the same
temperature the values of d reach a maximum. In the w
versus d plane these variations display iso-gravity lines
that fold over themselves at an iso-temperature line
corresponding to = 12000 K. For purpose of illus
tration the overlapping parts of the pattern defined by
the reddening-free indices have been separated. The part
corresponding to T ̂ >_ 12000 K is presented in Figure 5.
Iso-gravity and iso-temperature lines connect the com
puted values of w and d. The orthogonality of these
lines indicates that the d index is very sensitive to
temperature changes, while it remains almost constant
to gravity changes. Similarly, the w index is more sensi
tive to gravity than to temperature changes.

Figure 5- The w versus d diagram for high temperatures.— Units in the abscissa and the ordinate are magnitudes. Thick lines connect computed points of the reddening-free index. Squares are used to mark the observed points of some DA white dwarfs. Circles are used for two DO degenerate stars. The EG number has been added for identification. The short thin line in the lower left side indicates the points computed with power law (Fv « v-n) spectra in the -0.5 £ n £ 3 range. The long line with small dots corresponds to the computed points of black-bodies in the 3000 K < T £ 500,000 K range. The uncertainty associated with one observation (CJw = 0.02*J and = 0.0*15) is presented in the upper left corner.

Figure 5- The w versus d diagram for high temperatures -j o
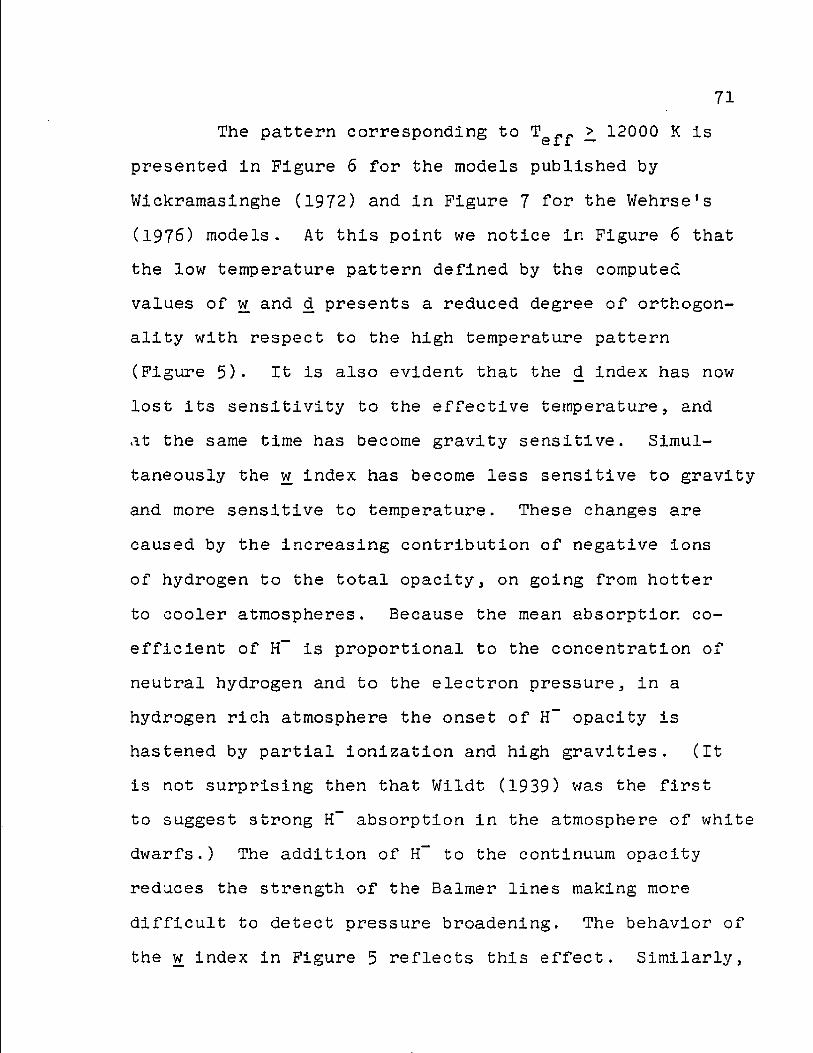
71
The pattern corresponding to Tef.f _> 12000 K is
presented in Figure 6 for the models published by
Wickramasinghe (1972) and in Figure 7 for the Wehrse's
(1976) models. At this point we notice in Figure 6 that
the low temperature pattern defined by the computed
values of w and d presents a reduced degree of orthogon
ality with respect to the high temperature pattern
(Figure 5). It is also evident that the d index has now
lost its sensitivity to the effective temperature, and
at the same time has become gravity sensitive. Simul
taneously the w index has become less sensitive to gravity
and more sensitive to temperature. These changes are
caused by the increasing contribution of negative ions
of hydrogen to the total opacity, on going from hotter
to cooler atmospheres. Because the mean absorption co
efficient of H~ is proportional to the concentration of
neutral hydrogen and to the electron pressure, in a
hydrogen rich atmosphere the onset of H~ opacity is
hastened by partial ionization and high gravities. (It
is not surprising then that Wildt (1939) was the first
to suggest strong H~ absorption in the atmosphere of white
dwarfs.) The addition of H~ to the continuum opacity
reduces the strength of the Balmer lines making more
difficult to detect pressure broadening. The behavior of
the w index in Figure 5 reflects this effect. Similarly,

Figure 6. The w versus d diagram for low temperatures from Wickramasinghe1s model atmospheres. — Units, computer points, and the representation of the observed points of DA white dwarfs as in Figure 5. Circles are used for DC degenerate stars. Dark squares for circular polarized stars. The triangle represents the observed point of EG 129 (spectral type X*J135) • A cross is used for the observed point of EG 283 (spectral type DF). Small digits under the black-body line represent the temperature in thousands of Kelvin degrees.
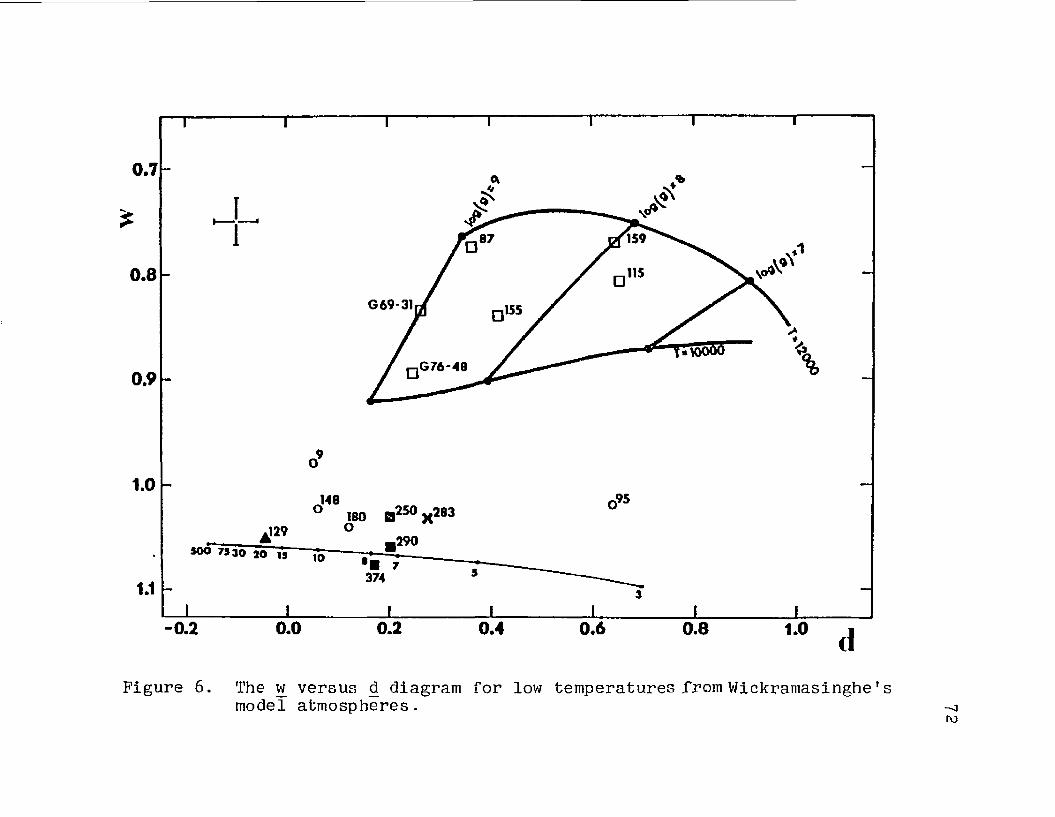
0.7
0.8
0.9
1.0 148
WO H250 X283
.290
.95
73 30 20 IS
Figure 6. The w versus d diagram for low temperatures from Wickramasinghe': model atmospheres.

Figure 7- The w versus d diagram for low temperatures from Wehrse's model atmospheres. — Units3 computed points, and the representation of the observed points of DA white dwarfs as in Figure 5- Dashed lines are used to connect points of equal temperature. Thin lines reproduce the low temperature diagram from Wlckramasinghe's model atmospheres, for purpose of reference. Satisfactory agreement between the two sets of models is found for log(g) = 8. Deviation of Wehrse's published fluxes for log(g) = 8.5 is clearly visible. The point located below the line for 7000 K corresponds to the published fluxes for log(g) = 8.5 and log(T ff.) = 9000 K.

= 8000
I = 7000
Figure 7- The w versus d diagram for low temperatures from Wehrse's model atmospheres.
UJ

74
H~ in the continuum opacity makes the Balmer jump gravity
dependent as indicated by the d index in the same figure.
The effects of H~ absorption in the standard UBV bands
have been analyzed by Weidemann (19&3, 1966).
In Figure 7 we note that the values of d obtained
with Wehrse's (1975) models for log(g) =8.5 are too blue
with respect to the respective values of d obtained with
the models for log(g) = 8. The effect is produced by the
(s-y) color that, as shown in Table 8 is about 0.2 mag
redder. The same difference is found in the (b-y)
color when the monochromatic fluxes published by Wehrse
(1976) are integrated into the u, b, and y bands according
to the precepts described by Wehrse (1975). It appears,
therefore, that there are some printing errors in the
published monochromatic fluxes for the series of models
with log(g) = 8.5. In what follows, this series of
models will be ignored.
On the other hand, Figure 7 displays remarkable
agreement between the models published by Wickramasinghe
(19 72) and the overlapping (T = 12000 and 10000 K)
Wehrse's (19 76) models for log(g) = 8.
Empirical-theoretical Match
Determination of gravities and temperatures for
the observed DA white dwarfs was made on the w versus d
plane. Observed reddening-free colors were derived with

Equation 13 and the color indices presented in Tables 4
and 5- The resultant values fix the coordinates in the
w versus d plane from which values of log(g) and
can be read.
The overlapping regions of the high temperatures
(Figure 5) and low temperatures (Figure 6) diagrams
create an ambiguity if no previous information on the
effective temperature is available. This situation be
comes critical for those stars with effective temperature
about 12000 K. However, this apparent difficulty is
eliminated by the additional information collected by
the u, s, 3, y bands. In fact, the (u-s) color is
strongly dependent on the effective temperature, and can
be used to choose the right diagram. No ambiguity is
found in Figure 7, where four DA degenerate stars of un
mistakably low temperature appear to cluster next to the
log(g) = 8 line.
Table 9 presents the observed reddening-free
colors and the derived log(g) and T^ for the DA white
dwarfs of our program. The uncertainties quoted for the
reddening-free colors are the propagated standard devia
tions of the observed color indices presented in Table 4.
For stars with only one observation of the color indices
the corresponding uncertainties are 0.024 mag in w and
0.045 mag in d. Error bars that illustrate these two
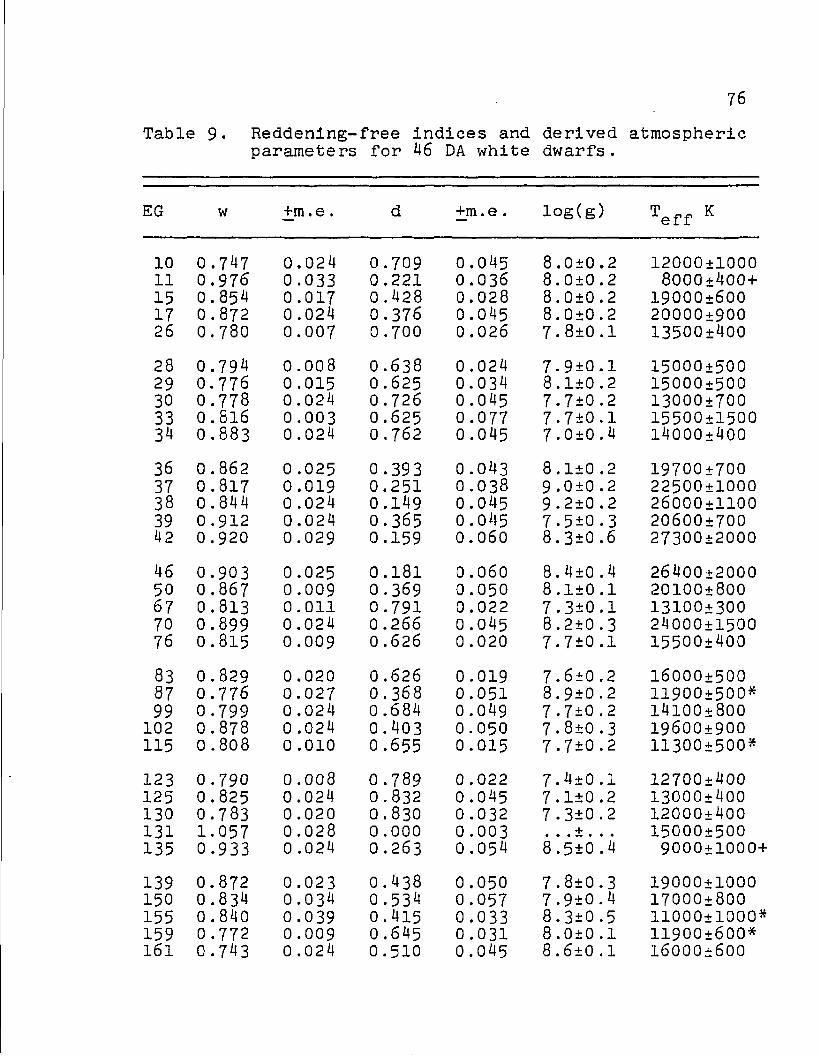
76
Table 9 . Reddening-free indices and derived atmospheric parameters for 46 DA white dwarfs.
EG w +m .e . d +m. e . log(g) Teff K
10 0 .747 0 .024 0 .709 0 .045 8. 0±0 .2 12000±1000 11 0 .976 0 .033 0 .221 0 . 0 3 6 8.0±0 .2 8000±400+ 15 0 .854 0 .017 0 .428 0 . 0 2 8 8. 0±0 .2 19000±600 17 0 . 872 0 .024 0 .376 0 .045 8.0+0 .2 20000±900 26 0 . 780 0 .007 0 .700 0 . 0 2 6 7. 8±0 .1 13500+400
28 0 .794 0 .008 0 .638 0 .024 7 - 9±0 .1 15000+500 29 0 • 776 0 .015 0 .625 0 .034 8. 1±0 .2 15000±500 30 0 .778 0 .024 0 .726 0 .045 7. 7±0 .2 13000 ±700 33 0 .816 0 .003 0 .625 0 .077 7. 7±0 .1 15500±1500 34 0 .883 0 .024 0 .762 0 .045 7. 0±0 .4 14000 ±400
36 0 .862 0 .025 0 .393 0 .043 8 . 1±0 .2 19700±700 37 0 .817 0 .019 0 .251 0 .038 9 .0±0 .2 22500±1000 38 0 .844 0 .024 0 .149 0 .045 9 . 2±0 .2 26000±1100 39 0 .912 0 .024 0 .365 0 .045 7 • 5±0 .3 20600+700 42 0 .920 0 .029 0 .159 0 .060 8. 3±0 .6 27300±2000
46 0 .903 0 .025 0 . 1 8 1 0 .060 8. 4±0 .4 26400+2000 50 0 .867 0 .009 0 .369 0 .050 8 .1±0 .1 20100±800 67 0 .813 0 .011 0 • 791 0 .022 7. 3±0 .1 13100±300 70 0 .899 0 .024 0 .266 0 .045 8.2 + 0 • 3 24000±1500 76 0 .815 0 .009 0 .626 0 .020 7 • 7±0 .1 15500+400
83 0 .829 0 .020 0 .626 0 .019 7. 6±0 .2 l6000±500 87 0 .776 0 .027 0 .368 0 .051 8. 9±0 .2 11900±500* 99 0 .799 0 .024 0 .684 0 .049 7 • 7±0 .2 l4l00± 800 102 0 .878 0 .024 0 .403 0 .050 7. 8±0 .3 19600±900 115 0 .808 0 .010 0 .655 0 .015 7 • 7±0 .2 11300±500*
123 0 .790 0 .008 0 .789 0 .022 7.4+0 .1 12700±400 125 0 .825 0 .024 0 .832 0 .045 7. 1±0 .2 13000±400 130 0 .783 0 .020 0 .830 0 .032 7 • 3±0 .2 12000±400 131 1 .057 0 .028 0 .000 0 .003 . . . ± . * * 15000+500 135 0 .933 0 .024 0 .263 0 .054 8 .5±0 .4 9000±1000+
139 0 .872 0 .023 0 .438 0 .050 7. 8±0 .3 19000±1000 150 0 .834 0 .034 0 • 534 0 .057 7 .9±0 .4 17000+800 155 0 .840 0 .039 0 .415 0 .033 8.3±0 .5 11000+1000* 159 0 .772 0 .009 0 .645 0 .031 8.0 + 0 .1 11900±600* 161 0 • 743 0 .024 0 .510 0 .045 8. 6±0 .1 l6000±600

77
Table 9. — Continued.
EG W +m.e. d CD log(g) Teff K
162 0 .814 0 .021 0 .700 0 . 0 3 5 7.8±0 . 2 14000±500 168 0 .987 0 .010 0 .240 0 .020 8 . 0±0 . 2 8000±500+ 184 0 .987 0 .010 0 .240 0 .020 8. 4±0 . 3 19700+700 199 0 .957 0 .039 0 .200 0 .049 8.5±0. 4 8500±400+ 201 0 .774 0 .028 0 .712 0 .050 7.8±0 . 2 13000±1000
203 0 .960 0 .020 0 .006 0 • 033 8: >30000 232 0 .833 0 .014 0 .216 0 .064 9.0±0 . 2 23900±500 247 0 .985 0 .007 -0 .054 0 .044 8: >30000 261 0 .755 0 .030 0 .747 0 .045 7.8±0 . 3 12000±1000 G69 -31 0 .837 0 .024 0 .263 0 .045 9.0±0 . 2 11000±500*
G76 -48 0 .895 0 .024 0 .250 0 .045 8.8+0 . 2 10200±500*
* Atmospheric parameters obtained with the diagram for Te;pf < 12000 K, presented in Figure 6.
+ Atmospheric parameters obtained with Wehrse's models for log(g) = 8 according to Figure J.

78
values have been Included in Figures 5, 6, and J. It
should be noted that for a given uncertainty of the
reddening-free colors the w versus d plane renders dif
ferent uncertainties of the atmospheric parameters
depending on the convergency of the iso-gravity and iso-
temperature lines. Due to the fact that, in our approach,
the strength of Hg is the sole indicator of the gravity
the iso-gravity lines converge toward high and toward
low temperatures. In Figure 5 we have Included points
for two very hot DA white dwarfs (EG 203 and EG 2^7) and
two DO stars (EG 86 and EG 71) in order to illustrate the
tendency of the iso-gravity lines. These four stars
also help to illustrate the small separation of the
iso-temperature lines above 30000 K.
Similar effects are apparent in Figures 6 and 7
where low temperatures are considered.
These properties of the w versus d plane hinder
attempts to extrapolate values of the atmospheric parame
ter for those stars with observed reddening-free colors
falling-outside the grid defined by the computed model
atmospheres. For this reason, the listed atmospheric
parameters (Table 9) of some very hot (T _> 27000 K)
stars are only estimates and no uncertainties are
attached.

79
Other Stars
The u, s, $, y photometry of non-DA stars (Table
5) was used to compute reddening-free colors and the
results are presented in Table 10, Included in this set
of stars is EG 283 (G 128-7), whose spectrum was classi
fied as DASjWk by Greenstein (1970), and later revised
to DF, also by Greenstein C1975). For these stars, the
w and d colors take values that are clearly out of the
region defined by the grid of theoretical models and
consequently, the derivation of gravity is not possible
while the indicated temperature is rather uncertain.
In Figure 6 we have plotted the points correspond
ing to some stars that appear to have reddening-free
colors somewhat similar to the black-body. We notice
that the A4135 star EG 129 (Grw + 70° 8247) has colors
that indicate a temperature of about 18000 K. However,
for this star the w and d colors are not good indicators
of the temperature. Significant linear and circular
polarization has been observed in EG 129 (Landstreet and
Angel 1975) and the optical spectrum displays broad
features that are very likely due to atomic helium. One O
of the absorption features is located near 4600 A, the
region of our s photometric band; another absorption
feature appears inside the region covered by the u
photometric band. In the presence of these absorption

80
Table 10. Reddening-free indices for 16 non-DA white dwarfs.
EG Sp .T. w +m .e. d +m .e .
71 DO 1.011 0 .024 -0.144 0 .026
86 DO 1.003 0 .065 -0 .149 0 .065
283 DP 1.034 0 .015 0.275 0.047
54 DP 0 .929 0 .061 -0.417 0 .048
329 DC, DP 1.010 0 .034 -0.144 0 .022
9 DC 0 .980 0.039 0 .045 0 .062
52 DC 1.029 0.033 2 .034 0 .076
95 DC 1.019 0.026 0 .643 0.053
148 DC 1.023 0 .017 0 .067 0 .040
180 DC 1.042 0.041 0 .121 0 .047
202 DC 1.013 0.035 1.150 0 .095
45 DK 1.159 0.024 1. 609 0 .045
129 \ 4135 1.052 0 .006 -0.038 0.014
250 DC 1.031 0 .010 0 .202 0 .023
290 DAP 1.060 0 .024 0. 206 0.045
374 DXP 1.079 0.024 0.179 0 .022

81
features the reddening-free color d becomes spuriously"
small and indicates a larger temperature. According to
Wickramasinghe, Thompson and Strittmatter (1972), pure
helium atmospheres that approximate the observed spectrum
of EG 129 require an effective temperature of less than
12000 K. o
Spectral features around 4600 A have strong in
fluence upon the determination of temperature due to the
fact that the magnitude measure with our s band enters
with weight 2.5, relative to the u and y bands, in the
d index. The effect is clearly observed in the DCP star
EG 374 (= G227-35) • Greenstein (1974b) has observed an O
absorption band, about 0.1 mag dip, centered at 4550 A
in the spectrum of this star. The absorption feature
produces a redder (s-y) color that in turn reduces the
value of the d index. According to Figure 6, our obser
vations indicate a temperature of about 7900 K for EG 374
However, the color temperature, derived in the spectral
range between 3400 and 8000 A, is only 7000 K
(Greenstein 1974b).
An Interesting case is presented by the observa
tions of the DAP star EG 290 (= G99-47). Low resolution
spectrum scans of this star show a smooth continuum that
is closely matched by a 5600 K black-body (Greenstein
1974b). However, the w and d colors indicate a

82
temperature of about 7000 K. Liebert, Dugel and
Landstreet (1975) have obtained spectrum scanner observa-o
tions with improved resolution (approximately 8 A) that
confirm the smooth spectrum of EG 290 from 3900 to 7000 o A, except for a weak absorption that appears to be con
sistent with the Zeeman pattern of Ha in a longitudinal
magnetic field of few million gauss. Very broad and
shallow featuresj commonly found in the spectra of
polarized degenerate dwarfs, are not excluded, however,
by the scanner observations (Liebert 1976) . The similar
ity between the broad band colors of EG 290 and EG 283
(Greenstein, Gunn and Kristian 1971) is also found in the
w versus d plane. The reddening-free colors of these two
stars support the idea of almost equal effective tempera
tures; moreover, EG 283 is separated from the black-body
line (in Figure 6) due to the effect of the weak
absorption in the w color.
In resume, the returns of our u, s, $, y photome
try of non-DA degenerate stars are generally influenced
by information of difficult interpretation. Therefore,
unless significant a priori information on the spectral
charactersitics is available, the u, s, 8, y bands
should not be used to derive atmospheric parameters of
stars other than DA white dwarfs .

CHAPTER 5
INTERRELATIONS
The atmospheric parameters, derived in Chapter 4,
are combined here with data on apparent magnitude,
distance, and bolometric correction for a number of DA
white dwarfs to investigate details in (a) the luminosity-
temperature relation, and (b) the mass-radius-composition
relation. Furthermore, the 46 stars with data in Table
9 provide a propitious sample to examine the number
distribution with respect to effective temperature.
Effective Temperature Frequencies
The observed frequencies of effective temperature
in DA white dwarfs gained in importance after Strittmatter
and Wickramasinghe (1971) proposed the accretion-
convection hypothesis of evolution. According to this
hypothesis, a large portion of white dwarfs have helium-
rich envelopes to which hydrogen, from interstellar
material, is accreted. The DA spectrum of the white
dwarfs is given by high temperatures and atmospheric
layers in radiative equilibrium. As the stars cool,
helium located in the inner layers begins to recombine
83
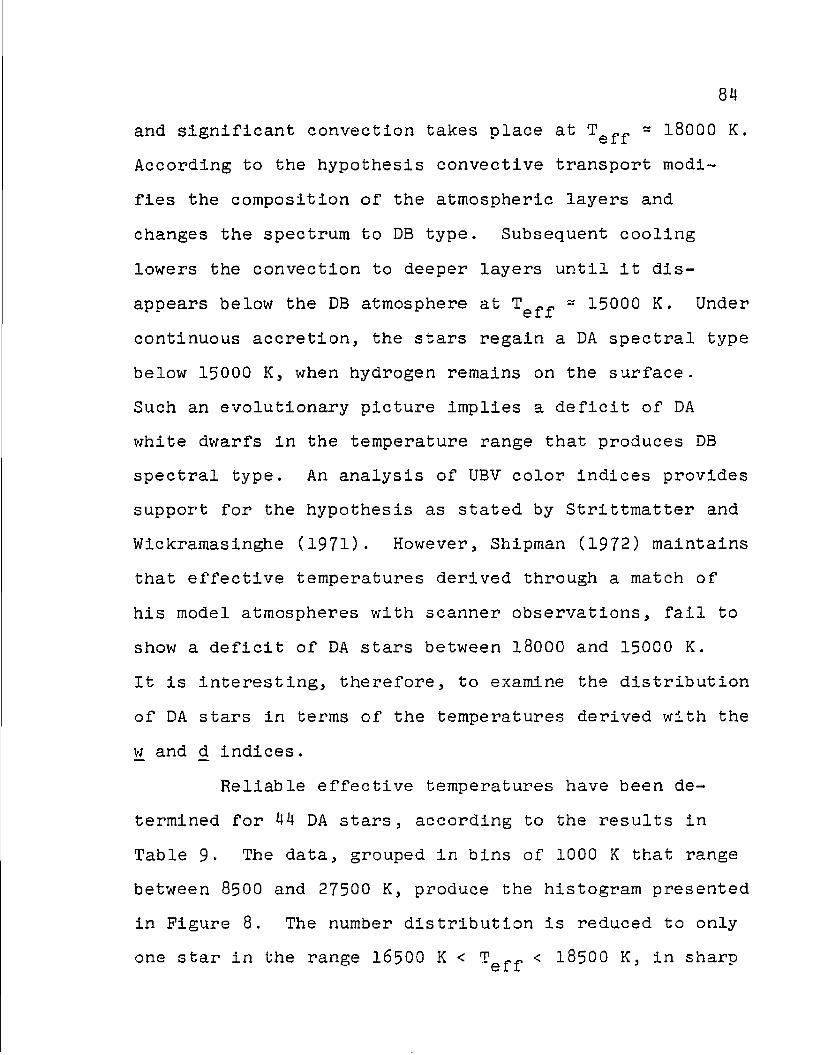
84
and significant convection takes place at - 18000 K.
According to the hypothesis convective transport modi
fies the composition of the atmospheric layers and
changes the spectrum to DB type. Subsequent cooling
lowers the convection to deeper layers until it dis
appears below the DB atmosphere at T^ K 15000 K. Under
continuous accretion, the stars regain a DA spectral type
below 15000 K, when hydrogen remains on the surface.
Such an evolutionary picture implies a deficit of DA
white dwarfs in the temperature range that produces DB
spectral type. An analysis of UBV color indices provides
support for the hypothesis as stated by Strittmatter and
Wickramasinghe (1971). However, Shipman (1972) maintains
that effective temperatures derived through a match of
his model atmospheres with scanner observations, fail to
show a deficit of DA stars between 18000 and 15000 K.
It is interesting, therefore, to examine the distribution
of DA stars in terms of the temperatures derived with the
w and d indices.
Reliable effective temperatures have been de
termined for 44 DA stars, according to the results in
Table 9. The data, grouped in bins of 1000 K that range
between 8500 and 27500 K, produce the histogram presented
In Figure 8. The number distribution Is reduced to only
one star in the range I65OO K < T rf. < 18500 K, in sharp 6 X X

< Q
o Z
1
T—i—i—i—i—i—i—i—i—i—i—i—i—i—i—i—i—i—i—i—r
111111111 I'J
• • • • * » • * • * + * * • • • • * * »
• » i • * > « * *
— » • i • * « * . • •
:::::::::: IvXv IvXv vMv! vX-X vV«V ;ava ,vMv .;,v!v
!v!v!r tt»I#: v.%v •*!*!vl' VAV
» • • « • • • » * • <
,vXv Vt'iVi
,v,v/. iV/.'.',
w& • » 4 « •
li
i'IV.V y.v.v V.V.V
• v!'!v ,v,vX V«ViV
v.v.v k'AV/i »%v*v. •IvMv
!vXy! v£;:£ VAVI' i i I * * Yi n i _
J I I I l I 1 L_l I I I I I l I i I l I I 12 15 18
Teff • 10000 °K
21 24 27
Figure 8. Effective temperatures histogram. — The frequencies of effective temperatures, derived with the w and d indices, for a group of ^ DA white dwarfs indicates a gap at 18000 K.
00 \ n

contrast with the adjacent ranges where frequencies of
four or five stars are present. The small sample of DA
white dwarfs available for this analysis is insufficient
to derive conclusive results with a statistical test;
however, it appears that there is a deficit of DA stars
in approximately the same temperature range indicated by
the UBV color indices. The clear exception is EG 150
with T ̂ = 17000 + 800 K. Pour other stars, EG 33, 76,
83, and l6l, populate the range 15500 K < T ̂ < 16500 K.
At the present time there are no reports of anomalies
in the observed characteristics of these five stars.
Nevertheless, it is interesting to notice that EG 33
and 83 are members of binary systems,
A comparison of our temperatures with the tempera
tures derived by Shipman (1972), for 15 stars in common,
reveals that our determinations run generally lower by
about 1000 K. The difference is very likely produced by
the systematic error present in the absolute calibration
employed to reduce the scanner observations (see Mihalas
1975)- According to his data, Shipman (1972) finds six
DA white dwarfs in the range 15000 K < T ̂ < 18000 K.
However, if an arbitrary correction of -1000 K is added
to those temperatures, only two stars, vis. EG 29 and 33,
remain in the same range.

87
Bolometrlc Magnitude-temperature Relation
An analysis of the H-R diagram, as traced by the
data available to DA white dwarfs included in our sample,
is presented in this section. For the abscissa of the
H-R diagram we use here the logarithm of the effective
temperature derived with the reddening-free indices. In
a first approach to the luminosity, the absolute magni
tude is used in the ordinate. The determination of
absolute magnitudes is preceded by short reviews of the
parallaxes and apparent magnitudes available for the
stars in our sample. The information provided by the
versus logCT^^) diagram, and its comparison with early
studies, leads to a consideration of the second approxi
mation for the luminosity, namely the bolometric
magnitude. This section is ended with the examination
of the Mbol versus log(Tei,f) diagram.
Parallaxes
Twenty-eight DA white dwarfs listed in Table 11
have individual measurements of trigonometric parallax.
Early measurements were obtained from the General
Catalogue of Trigonometric Stellar Parallaxes (GCTSP)
and its supplement (Jenkins 1952, 1963). More recent
determinations were found in publications by Wagman
(1967), Riddle (1970), van Altena (1971a, 1971b), Routly

88
Table 11. Trigonometric parallaxes.
„r M , Relative Values (x 0."001) EG No" abs ±m-e- and Weights
10 0."017 0 . "002 14N(40) 11 0 .064 0 .013 62C(6) 15 0 .027 0 . 0 0 5 18A(20) , 29N(40) 28 0.037 0 .003 36N(40) 33 0 .206 0 .002 198A(20), 194C(7), 207M(10),
200Yk(10)
34 0.013 0 .004 13N(40) 46 0 .033 0 .003 31.93(40) 50 0.064 0 .005 6lM(8), 68NC40), 92St(3), 67V(7),
39W(7), 54Yk(10) 67 0 .027 0 .008 28N(40), OV(IO), 37W(7) 70 0 .032 0 .012 30A(7)
83 0.033 0 .003 30N(40) 87 0 .021 0 .007 18N(20) 99 0.061 0 .007 71C(7), 47M(4), 62N(40), 27Yk(6) 115 0 .031 0 .007 19A(28)j 34N(40) 123 0.024 0 .004 2 3N(30)
125 0 .015 0 .001 15A(20) , 14N(40) 131 0 .101 0 .003 92A(20), 98N(40), 121Yk(10) 135 0.086 0 .004 94A(20)3 82N(40)3 76W(7) 139 0.071 0 .003 69A(40)s 92M(70), 66M(40), 693(40),
52W(16), 75Yk(8) 150 0 .040 0 .002 39N(40)
155 0.052 0 .004 50N(40) 159 0 .074 0 .004 71N(40) 161 0 .027 0 .004 25N(40) 162 0 .061 0 .005 66A(20)a 56N(40) 168 0.057 0 .012 64N(40), 39Yk(20)
199 0.061 0 .002 57N(40) , 60.8Yk(35) 247 0 .023 0 .002 21N(40) G76-48 0.041 0 .005 39N(30)

89
(1972), Heintz (1973), Beardsley et al. (1973), Llppincott
(1973), Thomas (1973), and Harrington et al. C1975)-
Parallaxes for EG 10, 87, 123, and G76-48 were kindly
communicated, in advance of publication, by Dr. Conard
C. Dahn (1976) of the Naval Observatory, Flagstaff sta
tion, Arizona.
For each star the collected relative parallaxes
are listed in the fourth column of Table 11. The source
of individual values is indicated by the usual observa
tory abbreviations, and the corresponding weight is given
in parenthesis. Parallaxes found in the GCTSP retain the
weight given there. For parallaxes given in other publi
cations the general precepts for weight computation
described in the GCTSP were used, except that the uncer
tainties were not adjusted as recommended by Jenkins
(1952). This procedure could produce a weighted average
slightly biased toward the more recent determinations of
the parallax. Nevertheless, modern measurements of
trigonometric parallax have more than twice the accuracy
of the parallaxes compiled in the GCTSP at the end of
1962, and preference for the newer determinations is
desirable.
The weighted average of the relative parallaxes
was reduced to absolute and presented in the second column
of Table 11. Corrections from relative to absolute

9°
parallax were interpolated from the mean parallaxes com
puted by van Altena (197*0. The third column of Table
11 presents the mean errors of the average relative
parallax.
Seven white dwarfs in our program are highly
probably Hyades cluster members. Unfortunately, no
individual parallaxes have been measured for any of these
stars. Upgren (1974) and Klemola et al. (1975) have
determined an accurate mean parallax for the cluster.
The results are 0."0219 + Q."00l8 (m.e.) and 0."0230 +
0."0015 (m.e.), respectively. However, the distance
modulus appear to be known with better accuracy. Hanson
(1975) derived a mean distance modulus for the Hyades
cluster of 3-29 + 0.08 mag. For the seven white dwarfs
mentioned above we adopt here 3*29 + 0.20 mag, where
the uncertainty is consistent with the mean error of the
cluster's mean parallax.
Apparent Magnitudes
Visual magnitudes of the white dwarfs in our pro
gram have been obtained by numerous observers. A
compilation of all the published results would include
early observations with unknown accuracy and poorly
defined photometric bands. In order to derive more
accurate V magnitudes we have decided to compile the
results of only homogeneous systems with observations of

91
a significant number of DA white dwarfs. Accordingly,
we selected the photometry obtained by Eggen and
Greenstein (1965a), the results of Graham (1972), and the
photometry carried out at the Naval Observatory
(Harrington et al. 1975). A list of these results is
presented in Appendix B. The V magnitude of those four
systems has been combined with our data presented in
Table 4 to produce a weighted average, where the weight
is given by the number of observations in the respective
systems. This average contains a degree of uncertainty
that represents the external errors in photoelectric
photometry. From our discussion in Chapter 3 we estimate
that uncertainty at 0.0 4 mag.
M versus log(T ff1
In order to facilitate the analysis the stars
with measured trigonometric parallax and good determina
tion of the effective temperature have been listed in
Table 12. The second column presents the absolute magni
tude Mv = V + 5 + 5 l°g() • The third column presents
the uncertainty of Mv computed with the relation
a = + a* , where a is the uncertainty of the apparent
magnitude and = 5 x log(e) x [relative error of
Because in general > av the uncertainty of is given
mainly by a. The next two columns present the values
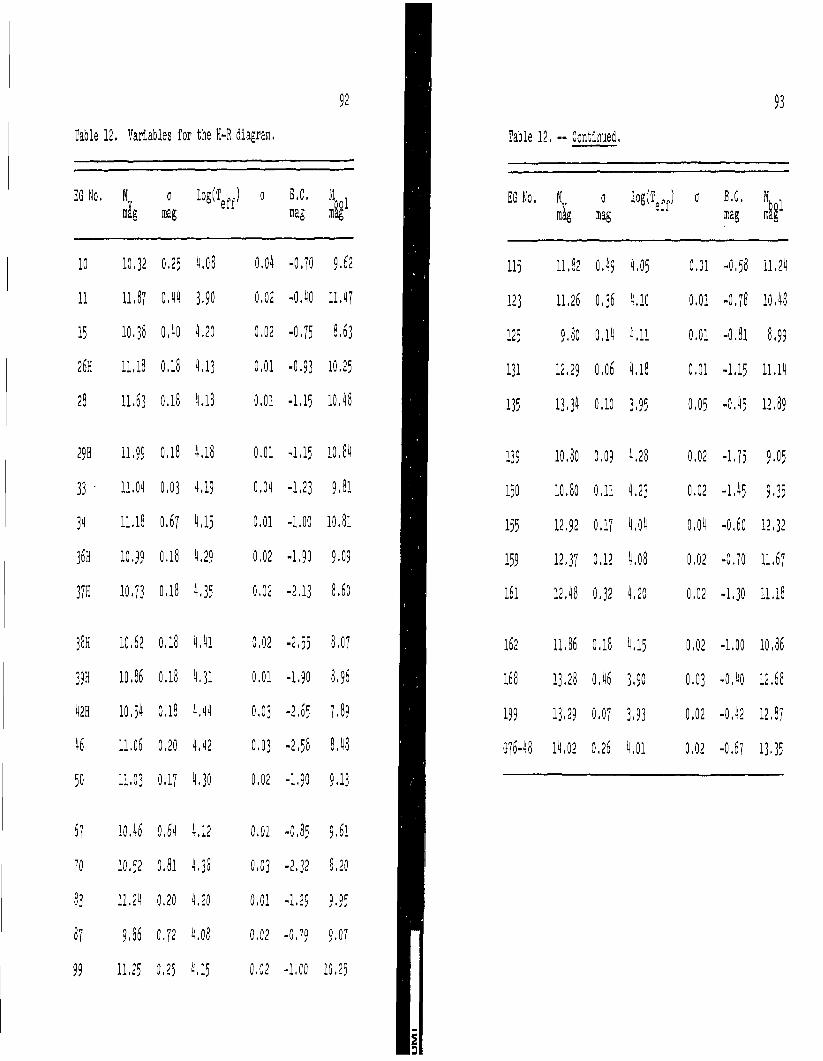
92
Table 12, Variables for the H-R diagram. Table 12. - Continued.
93
EG No. H mlg
a mag
log(Teff) a B.C. mag k
10 10,32 0,25 1,08 0,01 -0,70 9.62
11 11,87 0,11 3.90 0,02 -0.10 11,17
15 10,38 0,10 1,20 0,02 -0.75 8.63
26H 11.18 0,18 1,13 0,01 •0.93 10,25
28 11.63 0.18 1,18 0,01 •1.15 10.18
W 11.99 0,18 1.18 0,01 -1.15 10,81
33 • 11.01 0,03 1,19 0,01 •1,23 9,81
31 11.18 0,67 1,15 0,01 -1,00 10,81
36H 10.99 0,18 1,29 0,02 -1,90 9.09
37H 10,73 0,18 1.35 0,02 -2,13 8.60
38H 10.62 0,18 1,11 0,02 -2.55 8,07
39H 10,86 0,18 1,31 0,01 •1,90 8,96
12H 10,51 0,18 1.11 0,03 -2,65 7.89
16 11,06 0,20 1.12 0,03 -2,58 8,18
50 11,03 0,17 1,30 0,02 -1,90 9.13
67 10.16 0,61 1,12 0,01 -0,85 9.61
70 10,52 0,81 1,38 0,03 -2J2 8,20
83 11.21 0,20 1.20 0,01 -1,29 9.95
87 9,86 0,7 2 1,08 0,02 -0,79 9.01
99 11.25 0,25 1,15 0,02 -1,00 10,25
EG Ho. Ilg
0 mag
log(Teff) (i B.C. mag
1 i
115 11.82 0,19 1,05 0,01 -0,58 11,21
123 11.26 0,36 1.10 0,01 -0,78 10,18
125 9,80 0,11 1,11 0.01 -0,81 8,99
131 12.29 0,06 1.18 0.01 -1.15 11,11
135 13.31 0.10 3.95 0,05 -0,15 12.89
139 10,80 0,09 1.28 0,02 -1.75 9.05
150 10.80 0,11 1.23 0.02 -1,15 9.35
155 12.92 0,17 1,01 0,01 -0,60 12,32
159 12,37 0,12 1,08 0,02 -0,70 11,67
161 12,18 0,32 1,20 0,02 -1,30 11,18
162 11,86 0,18 1,15 0,02 -1,00 10,86
168 13.28 0,16 3.90 0,03 -0,10 12,68
199 13.29 0,07 3.93 0,02 -0,12 12,87
G76-18 11,02 0,26 1,01 0,02 -0.67 13.35
£ b
94
of log(Te^) and the respective uncertainty given by
a = log(e) x [relative error of T
Those DA white dwarfs for which modern determina
tion of the parallax indicate tt > 0."025 have been in
cluded in the M versus log(T ««) diagram presented in V © X 1
Figure 9. This condition excludes EG 11 for which only
one early determination is available. Nine stars for
which >. 0."060 are presented with circles. Squares
are used for the seven Hyades white dwarfs. As indicated
by the dotted lines in Figure 9, the distribution of the
points appears to define two sequences. In the upper
sequence, containing six Hyades white dwarfs, the dotted
line represents the relation
= 20.75 - 2.3 log(Teff) . (19)
Aside from the smaller number of stars considered,
Figure 9 bears a strong resemblance with the M versus
(U-V) diagram obtained by Eggen and Greenstein (1965a
in Figure 4 of their work, p. 95)* The upper sequence
derived by these authors is well represented by the re
lation
Mv = 11.65 + 0.85 (U-V) ( 2 0 )

95
Figure 9. The Mv versus log(Teff) diagram for DA white dwarfs. — Data for stars with tt >_ 0."025 and Hyades members is presented. Only stars with it >_ 0. "06 (presented with circles) and Hyades members (with squares) were used to derive the slope of the dotted lines. Except for EG 15, 67, and 80, the stars included in the diagram have absolute magnitude uncertainty equal or lower than 0.25 mag.

corresponding to a set of about 20 degenerate stars hav
ing (U-V) between -0.9 and 0.0 mag. An inventory of
these stars reveals that most of the DA white dwarfs
used to derive Equation 20 were also used to
derive Equation 19- Therefore, the clear match
between both diagrams cannot be considered unex
pected .
There is, however, a net contribution. Elimina
tion of the absolute magnitude between both relations
renders an independent calibration of the effective
temperature in terms of the (U-V) color, for the stars
in the upper sequence. The result can be expressed as
(U-V) = 2.7 log( e ) + 0.68 (21)
where the reciprocal temperature, 0 = 5040/T is used
for purpose of comparison with the calibrations compiled
by Shipman (1972, in Figure 4 of his work, p. 735). In
the range 0.18 _< 9 £ 0.35, corresponding to the range
of log(To^,£,) where the upper sequence is well defined in
Figure 9, this new calibration runs between Shipman's
own calibration and the original calibration by Terashita
and Matsushima (1969). The implications of this agree
ment will be discussed in the next chapter.
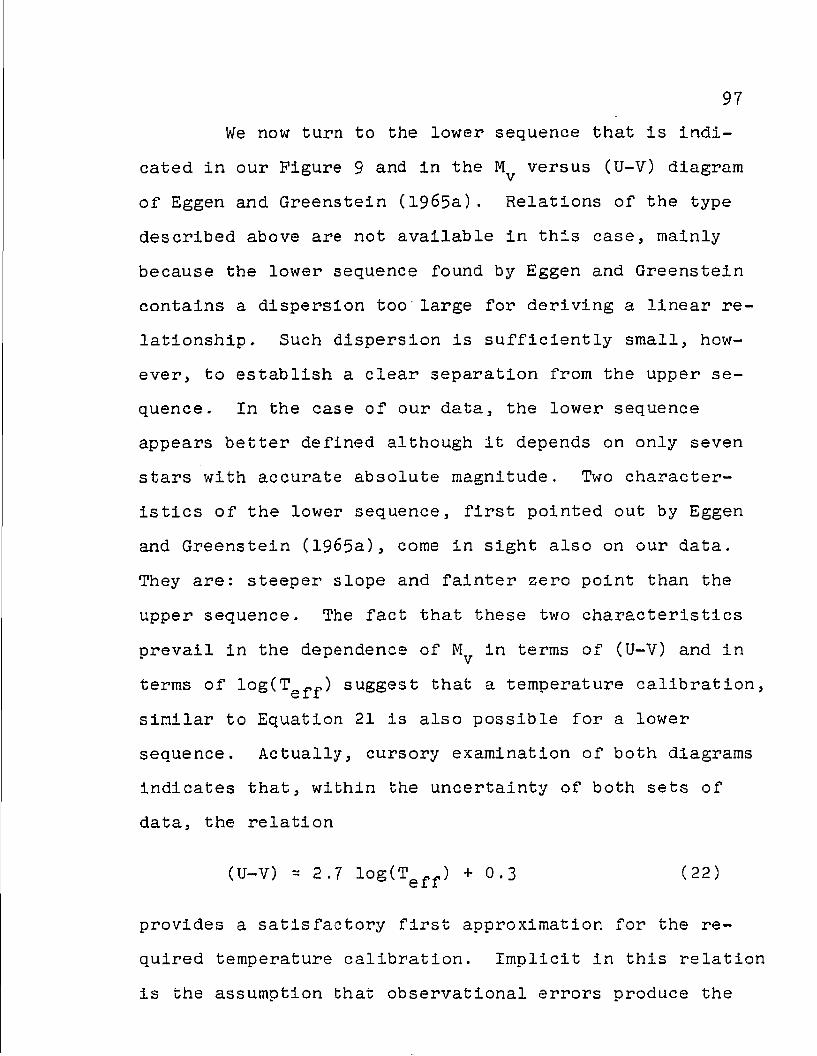
97
We now turn to the lower sequence that is indi
cated in our Figure 9 and in the Mv versus (U-V) diagram
of Eggen and Greenstein (1965a). Relations of the type
described above are not available in this case, mainly
because the lower sequence found by Eggen and Greenstein
contains a dispersion too'large for deriving a linear re
lationship. Such dispersion is sufficiently small, how
ever, to establish a clear separation from the upper se
quence. In the case of our data, the lower sequence
appears better defined although it depends on only seven
stars with accurate absolute magnitude. Two character
istics of the lower sequence, first pointed out by Eggen
and Greenstein (1965a), come in sight also on our data.
They are: steeper slope and fainter zero point than the
upper sequence. The fact that these two characteristics
prevail in the dependence of M in terms of (U-V) and in
terms of log(Tef>f) suggest that a temperature calibration,
similar to Equation 21 is also possible for a lower
sequence. Actually, cursory examination of both diagrams
indicates that, within the uncertainty of both sets of
data, the relation
(U-V) = 2.7 log(Teff) + 0.3 (22)
provides a satisfactory first approximation for the re
quired temperature calibration. Implicit in this relation
is the assumption that observational errors produce the

98
dispersion observed in the lower sequence of the
versus (U-V) diagram. If such dispersion is an intrinsic
characteristic of the stars, the last term in Equation 22
should be a variable"in the range between 0.2 and 0.6
mag.
Independent of this uncertainty, the comparison
of the versus (U-V) diagram derived by Eggen and
Greenstein (1965a) and the M versus log(T diagram
presented in Figure 9 provides substantial support for
the existence of a second sequence of degenerate stars.
Q± versus log(TQffI
Adding the bolometric corrections to the absolute
magnitudes produces a homologous transformation of these
two sequences into the versus log(T diagram.
The bolometric corrections, derived by interpolation in
the tables published by Strittmatter and Wickramasinghe
(1971), are listed in Table 12. The results are illus
trated in Figure 10, where nine stars with parallax
tt >_ 0."06 and seven Hyades members are included. The two
sequences appear to have similar slope in the ^ versus
log(Tef>f) presented in Figure 10. For these 16 stars
the bolometric magnitude is known with uncertainty
equal or smaller than 0.2 mag. Although the two sequences
are still indicated when all the stars used in Figure 9
are included, only the stars with high quality

99
o -o 3
"c 10 o
S
^ IT ® E o O 12
ffl
13
i-, "i r" "" i i r i
, "F. - -
* -
\ °X,
ax° '-••••.. o X N
14
* %
o ox NX 'V
X
i i i i I t %
1 4.5 4.3 4.1 3.9
log Te„
Figure 10. The Mb versus log(Te^.f) diagram for DA white awarfs. — Data from 16 stars with trigonometric parallax it > 0."06 plus Hyades members have been plotted with the symbols as in Figure 9. For comparison, the crystallization sequences computed by Van Horn (1968) have been plotted with dashed and dotted lines. As presented here, the 32s and 2%g sequences are restricted to degenerate dwarfs in the 0.88 < M/M0 <_ 0.40 range, with the larger mass at the upper end.

100
bolometric magnitude have been retained in Figure 10
because they present a closer alignment without excep
tion. The similarity with Figure 9 allows an easy
identification of the EG numbers for these 16 stars.
For purpose of reference four crystallization sequences,
theoretically derived by Van Horn (1968)3 have been out
lined on the same diagram. The upper observational
sequence is defined by ten DA white dwarfs, six of them
members of the Hyades cluster. Only six stars define
the lower observational sequence. The apparent coinci-
12 dence of the two observational sequences with the C
and S crystallizationsequences is not surprising,
however. It was noticed first by Van Horn (1968) in his
analysis of the UBV photometry of degenerate dwarfs
published by Eggen and Greenstein (1965a).
In terms of the uncertainties of the bolometric
magnitudes, the separation of the two sequences in
Figure 10 is well established. The uncertainty reaches
0.25 mag for only one star (EG 99 at ^ = 10.25,
log(Tef£.) = 4.15). The 15 DA white dwarfs remaining
have uncertainties equal to or smaller than 0.18 mag.
Although identification of the observational data
12 12 with the C and/or S sequences is not straightforward,
the results presented in Figure 10 lend strong support

101
to the suggestion that cooling white dwarfs proceed along
more than one crystallization sequence.
Mass-radius Relation
In the original sample of DA white dwarfs observed
with the u, s, 3, and y bands there are 34 stars for
which, aside from log(Tg;p^) and log(g)j the bolometric
magnitude is also available. For this subset of stars,
listed in Table 12, the respective radius and mass was
derived. Computation of the radius was made with the
relation
log R R , v o-' = -2 log(Teff) - 0.2 M
42 .36 bol
(23)
and the result is presented in Table 13- Analytic propa
gation of the errors (listed in Table 12) was employed
to derive the uncertainty of the computed radii.
Similarly, determination of the mass was obtained
with the relation
log 'Mj M J rv 2 log R R
+ log S_ U n J
(24)
and the results, together with the propagated errors,
are presented in Table 13.

102
Table 13. Radius, gravity, and mass for selected DA white dwarfs.
IG NO. log(R/Ro) a log(g) a log(M/MQ) a
10 -1.61 o o
VO
8.0 0.2 +0. 34 0.27
11 -1.63 0 .10 8.0 0.2 + 0 , 30 0.28
15 -1.81 0.08 8.0 0.2 -0.06 0.26
26
^r CO i—t 1 0.04 7.8 0.1 -0 . 32 0.13
28 -1.98 0 .05 7-9 0.1 -0 . 49
o
in o
29 -2 .05 0 .05 8.1 0.2 -0.43 0.22
33 -1.87 0.08 7.7 0.1
CO ^r o r 0.19
34 -1.98 0 .14 7-0 0.4 -1. 40 0 .49
36 -1.93 0.0 5 8.1 0.2 -0.21 0.22
37 -1.95 0.05 9.0 0.2 +0.66 0 .22
38 -1.97 0.05 9.2 0.2
C\J CO o
+ 0.22
39 -1.95 0.05 7.5 0.3 -0.83 0 .32
42 -1.98 0 .07 8.3 0.6 -0 .09 0 .62
46 -2.07 0.08 8.4 0 .4 -0.17 0.43
50 -1.96 0 .05 8.1 0.1 -0 .26 0.14
67 -1.68 0.13 7.3 0 .1 -0.51 0.28
70 -1.93 0 .17 8.2 0.3 -0 .09 0 .45
83 -1.93 0 .05 7.6 0.2 -0 .69 0 .22
87 -1.49 0 .15 8.9 0.2 +1.48 0 . 36
99 -1.88 0 .07 7.7 0.2 -0.49 0 . 24

103
Table 13. — Continued.
EG No. log(R/R0) a l o g C g ) a log(M/MQ) a
115 -1.88 0 .10 7.7 0.2 -0.50 0. 28
123 -1. 83 0.07 7.4 0.1 -0. 7 0 0 .17
125 -1.55 0.04 7.1 0.2 -0 .44 0 .21
131 -2.11 0.03 « « • • • • • « • « • •
135 -2.01 0.10 8.5 0.4 + 0.03 0 . 4 5
139 -1.89 0. 0 5 7.8 0.3 -0.43 0.32
150 -1.86 0.05 7.9 0.4 -0.26 0 .41
155 -2.07 0.09 8.3 0.5 -0. 2 9 0.53
159 -2.01 0. 0 5 8.0 0.1 -0.46 0 .14
161 -2.17 0. 0 7 8.6 0.1 -0 .18 0 .17
162 -1.99 0 . 0 5 7.8 0.2 -0. 6 2 0.22
168 -1.87 0 .11 8.0 0.2 -0 .18 0 .30
199 -1.96 0.04 8.5 0.4 +0 .15 0 .41
G76 -48 -2.21 0. 0 6 8.8 0.2 -0 .06 0. 2 3

104
For a majority of the stars included in Table
13 the uncertainty in the logarithm of the mass is less
than 0.50, indicating a relative improvement with respect
to earlier mass determinations. Stars for which uncer
tainty in the logarithm of the mass is less than 0.30
have been included in the mass-radius diagram presented
in Figure 11. Two stars with accurate determinations of
the mass due to their binary character (40 Eri B and
Sirius B) are shown with error bars.
The resulting mass-radius diagram displays two
main characteristics: (1) the DA white dwarfs appear to
follow the theoretical mass-radius relation as derived
by Hamada and Salpeter (1961) for heavy metals, and (2)
there is a significant concentration of stars in the
range 0.16 £ M/M £ 0.98.
Four stars (EG 10, 11, 37 and 3 8 ) appear to follow
the mass-radius relation for pure hydrogen internal
composition. An attempt to explain the location of
these stars in terms of anomolous characteristics has
been partially successful in the case of EG 11 only.
The absolute luminosity determination of EG 11 is based
on one measurement of the trigonometric parallax, with
relatively large error (see Table 11). For a DA white
dwarf with effective temperature near 7900 K,

Figure 11. The mass-radius diagram. — The masses and radii obtained in this chapter are plotted for DA white dwarfs. Circles are used to represent the data with uncertainty < 0.2 in the logarithm of the mass. Triangles represent stars where the uncertainty ranges between 0.2 and 0.3- The crosses correspond to 40 Eri B and Serius B, with masses derived from their respective binary orbits. Theoretical curves are due to Chandrasekhar (1939) (H) and to Hamada and Salpeter (1961) (Mg, Fe) . The lower curve, without label, is the mass radius relation for stars with neutron core as given by Hamada and Salpeter (i961).

-1.5
o Q£
D) O
-2.0
-2.5
.125
Mg
- Fe .67
*:io V
I '.123 **•.. •—t— ° w3-'o
26 A 15
to
A "s A ••• . . . 5 0^a -
.162 159 ' - .Q
36
**•
161 *.
*0 .G76-48 A .
j—i—i—i—I—i—i—i i ! i i i i I I'I i * I
-1.0 -0.5 0.0 +0.5
log(^ /M 0 )
Figure 11. The mass-radius diagram.

the absolute magnitude of EG 11 is too bright, as indi
cated by other white dwarfs with similar temperatures.
Further investigations of EG 10, 11, 37 and 38
are required before their location in the mass-radius
diagram can be established conclusively.

CHAPTER 6
DISCUSSION AND CONCLUSIONS
The analysis contained in the previous chapter
indicates that the temperatures derived in this investi
gation lend support to two results already known from
UBV colors as temperature indicators. These results are
(1) the reduced number of DA white dwarfs with T beef f
tween 16000 K and 18000 K detected by Strittmatter and
Wickramasinghe (1971) and (2) the two sequences in the
H-R diagram found by Eggen and Greenstein (1965a).
Corroboration of these results with the u, s, B and y
bands may appear surprising in first instance since
elaborate analysis of the UBV colors of DA white dwarfs
indicates that atmospheric parameters derived with these
broad bands are unreliable (Weidemann 1975). However,
we have also found that there is an accurate linear rela
tion (see Equation 16) between the (U-V) color and the
effective temperatures derived fromthe w versus d plane.
Such a result can be anticipated because a comparison
between the Paschen and Balmer continua (although mea
sured with the U and V bands) is necessarily dependent
107

108
on the temperature. Furthermore, the compilation of
effective temperature calibrations published by Shipman
(1972) indicates that the dependence of (U-V) on the
temperature is very strong in the 14000 K £ Teff £ 28000 K
range.
Here we discuss the two results referred to above
under the assumptionthat the scale of temperature derived
with both photometric systems represents adequately the
actual temperatures of DA white dwarfs.
Let us consider first the deficiency In the number
of DA white dwarfs observed at effective temperatures be
tween 16000 K and 18000 K. As indicated in Chapter 5, an
arbitrary correction of -1000 K in the scale of tempera
tures derived by Shipman (1972) reveals that only two
stars of his sample populate the mentioned range. Instead
of contradicting the results of this work, or the data
analyzed by Strittmatter and Wickramasinghe (1971),
Shlpman's (1972) result points to some uncertainty in the
zero point of the temperature calibrations. Independent
of such uncertainty, the three results appear to be
consistent with the accretion-convection hypothesis
invoked by Strittmatter and Wickramasinghe (1971) to
account for the existence of the pure helium atmosphere,
DB white dwarfs.

109
The main drawback of these three results is the
small statistical sample of DA white dwarfs included in
each instance. It may be that the shortage of DAs is
only a statistical fluctuation in such a small sample.
Sion and Liebert (1977) have examined a sample of 424
spectroscopically identified white dwarfs and find no
apparent deficiency in the number of DAs in the interval
of absolute magnitude populated by most of the DB stars .
This result seems to be in agreement with the quantita
tive analysis of the accretion-convection hypothesis
carried out by D'Antona and Mazzitelli (1975) which indi
cates that the difference between DA and DB atmospheres
cannot be due to accretion and mixing processes only,
and that for high effective temperatures the existence
of accretion is questionable. However, the final word
on these matters has not been written. The most recent
contribution to this problem is some empirical evidence
that mixed atmospheres exist: Wickramasinghe and Whelan
(1977) have discovered that weak hydrogen lines are
observed in the spectrum of the helium rich (spectral
type DB) white dwarf EG 153- Estimated relative abun-
4 5 dances give a helium to hydrogen ratio between 10 and 10 ,
and the effective temperature appears to be in the range
between 15000 K and 20000 K. Further study of EG 153 >
and perhaps the discovery of other similar stars, may

110
provide some conclusive evidence on the role of accre
tion in the evolution of white dwarfs.
Let us examine now the two sequences observed
on the H-R diagram. The origin of the controversy over
the existence of two observational sequences for de
generate dwarfs can be traced to the single band apparent
in the versus (b-y), i.e., the H-R diagram in terms
of the Stromgren color used by Graham (1972). The
discrepancy between this single band and the two bands
evident in the versus (U-V) diagram (Eggen and
Greenstein 1965a) is far too great to be attributed to
observational errors, as indicated by Eggen (1969).
However, it has been shown in this work that the (b-y)
color is not a good temperature indicator due to contami
nation by the board absorption of H^. Furthermore, the
slope of the Paschen continuum becomes less and less
sensitive to temperatures above 10000 K. A better tem
perature indicator for DA white dwarfs should be the
Stromgren (u-y) color, for the same reason that the
Johnson (U-V) color is a good temperature indicator.
Due to the large difference between the Paschen and Balmer
continua near the Balmer jump one can predict that even
the (u-b) color is a better temperature indicator than
(b-y). In effect, a plot of M versus (u-b) with the
data published by Graham (1972) reveals two clear bands

Ill
resembling the results obtained by Eggen and Greenstein
(1965a) and Figure 9 of this work. The Mv versus (u-b)
diagram obtained with Graham's data is presented in
Appendix C. It appears, therefore, that the two bands
of degenerate dwarfs on the H-R diagram have been observed
by three independent photometric systems.
The brightness along the crystallization sequences
is strongly dependent on the mass of the stars. More
massive degenerate dwarfs should populate the brighter
end of each individual sequence, with a monotonic de
crease of the mass toward the faint end. In Figure 10
24 12 the theoretical sequences corresponding to Mg and S
have been drawn for the mass range 0.88 <_ M/MQ <_ 0.40..
The faint ends of these sequences outline the slope of
lines of equal mass. The steeper slope corresponding to
the lines of equal mass indicates that at a given effec
tive temperature only a small section of the crystalli
zation sequences will overlap if the masses of most white
dwarfs are concentrated in a narrow mass range. The
12 ^2 small overlap of the C and S sequences is clearly
observed in Figure 10. This result is consistent with
the narrow range of masses (0.16 < M/M < 0.98) for a — o —
most of the white dwarfs included in the mass-radius
diagram presented in Figure 11.
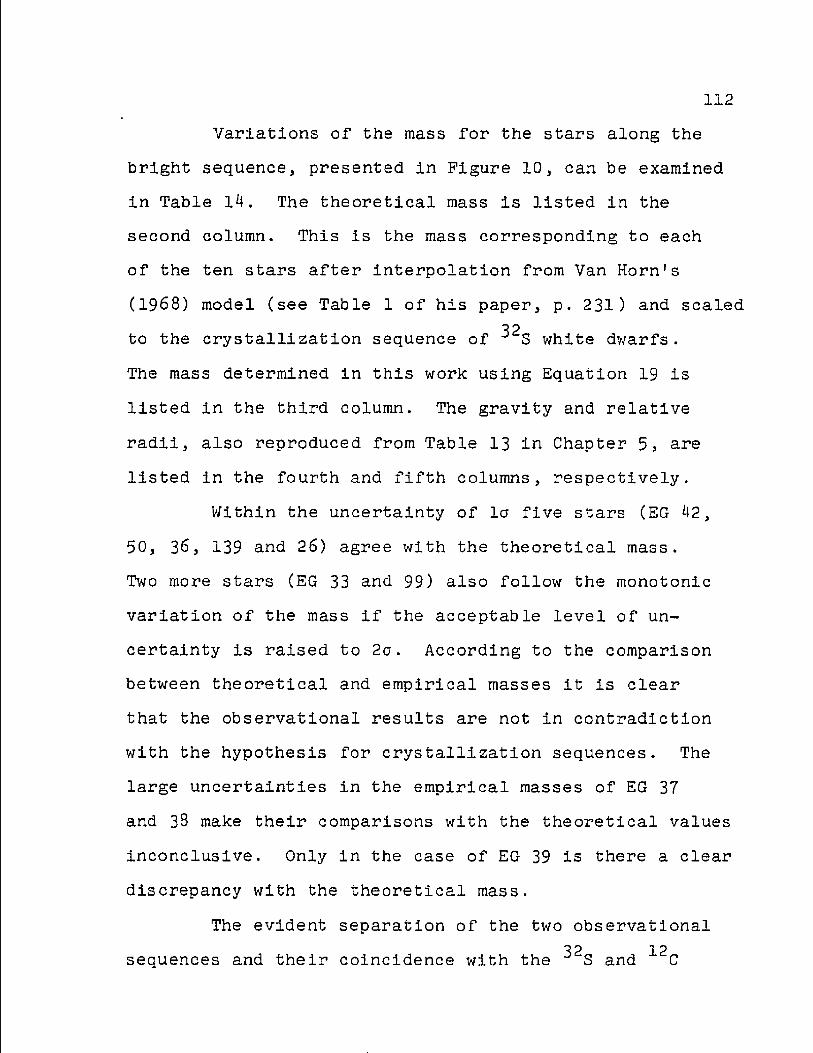
112
Variations of the mass for the stars along the
bright sequence, presented in Figure 10, can be examined
in Table 14. The theoretical mass is listed in the
second column. This is the mass corresponding to each
of the ten stars after interpolation from Van Horn's
(1968) model (see Table 1 of his paper, p. 231) and scaled
to the crystallization sequence of S white dwarfs.
The mass determined in this work using Equation 19 is
listed in the third column. The gravity and relative
radii, also reproduced from Table 13 in Chapter 5, are
listed in the fourth and fifth columns, respectively.
Within the uncertainty of la five stars (EG 42,
50, 36, 139 and 26) agree with the theoretical mass.
Two more stars (EG 33 and 99) also follow the monotonic
variation of the mass if the acceptable level of un
certainty is raised to 2a. According to the comparison
between theoretical and empirical masses it is clear
that the observational results are not in contradiction
with the hypothesis for crystallization sequences. The
large uncertainties in the empirical masses of EG 37
and 38 make their comparisons with the theoretical values
inconclusive. Only in the case of EG 39 is there a clear
discrepancy with the theoretical mass.
The evident separation of the two observational
32 12 sequences and their coincidence with the S and C

113
Table 14. Variables of the brighter crystallization sequence.
Theoretical EmDirical EG No. M/M o M/M o
g log(R/Ro)
42 0.88 0.8l±l.16 2.0xl08 -1.98+0.07
38 o
OO
h->
6.6l±3.35 15. 8 -1.97±0.05
37 0 . 7 1 4,57±2.32 0 0
-1.95±0.05
39 0.66 0.15±0.11 0.9 -1.95±0.05
50 0 .65 0.55±0.18 1.3 -1.96±0.05
36 0.64 0.62±0.31 1.3 -1.93±0 .05
139 0.63 0.37±0.27 0.6 -1.89±0.05
33 0 .60 0.33±0.14 0.5 -1.87±0.08
99 0 .56 0.32+0.18 0.5 -1.88±0.07
26 0 .45 0.48±0.14 0.6 -1.84±0.04

114
crystallization sequences raises two questions. First,
is it possible that during pre-whlte dwarf evolution
32 nucleosynthesis can reach the formation of S? And
second, what is the reason for a dichotomy in the final
composition of the white dwarfs? To the extent that
parent stars of white dwarfs should have a moderate mass,
with an upper limit of ~5 according to Weidemann
(1977)3 nuclear processing will not reach such heavy
nuclei as suggested by current trends in nucleosynthesis
research. Nevertheless, assuming that white dwarfs
32 with nuclei as heavy as S originate in some massive
stars or they are formed in highly evolved binaries,
after several stages of mass transfer, one would expect
to observe intermediate crystallization sequences, not
12 32 only the C and S sequences .
A satisfactory answer to these questions appears
to be the effect of crystallization and variation of
specific heat upon the probability of observing a white
dwarf of a given mass and chemical composition in the
interval Alog(L/Lo) as studied by Van Horn (1968). In
12 the case of white dwarfs consisting of C, values of
high probability density define two separate areas on
the H-R diagram coinciding in extentlon and slope with
the two observational sequences. The area located on
the brighter sequence arises from the higher probability

115
corresponding to more luminous white dwarfs. The other
area of high probability density, coincident with the
fainter sequence, results from the onset of crystalliza-
1 2 tion in C white dwarfs. This is an attractive inter
pretation of the two sequences in the H-R diagram because
it eliminates the need for degenerate dwarfs composed
of elements much heavier than oxygen and/or carbon.
This interpretation also accounts for the lower number
of DAs observed in the lower sequence.
Van Horn (1977) has pointed out that, according
to the improved calculations reported by Lamb and Van
Horn (1975), at the onset of crystallization a 1 Mq,
12 pure C white dwarf should appear at M^ol = 11.69 and
log(T ff.) - 4.120 on the H-R diagram. By the time that
half of the mass is crystallized the position has shifted
to M. , « 12.7*1 and log(T ._) = 4.015. These values bol eii
indicate that the theoretical crystallization sequence
for carbon white dwarfs is actually lower by ~ 0.4
12 to 0.5 mag than the C sequence of the original computa
tions (Van Horn 1968). This new result indicates that
the coincidence between the observational data and the
theoretical sequence is also produced by other effects
aside from crystallization. Van Horn (1977) has suggested
two other effects. First, the increase in luminosity
by different atmospheric opacities, and second, the

116
brighter crystallization sequences expected in a carbon
corea hydrogen envelope white dwarfs. This second sug
gestion is based on the calculations by Fontaine and Van
Horn (1967) indicating that white dwarf models with a
hydrogen envelope display brighter luminosity - -0.6
to -1.0 mag near 10 <_ £ 12 mag) than pure carbon
models. The following steps into the understanding of
the sequences may be the theoretical determination of
the thickness of a hydrogen envelope and the percentage
of crystallized mass that are required to match the
observational data.
Finally, let us consider the traditional test
for the theory of degenerate dwarfs: the mass radius
diagram. To the extent that the models of degenerate
dwarfs, with homogeneous composition, can be parameter
ized in terms of the mean molecular weight per electron,
there is a one-to-one relation between the mass and the
radius. In the framework of this theory the composition
of the thin, non-degenerate atmosphere has no influence
in the determination of the radius or the mass. Accord
ingly, DA atmospheres are masking an internal composition
of heavier elements. At the present time, empirical and
theoretical determinations of the mass and the radius
have insufficient accuracy to survey such internal
compositions. The present consensus, however, is that

117
there Is no serious discrepancy between theory and ob
servations. Weidemann (1971) and Wickramasinghe and
Strittmatter (1972) have pointed out that the major
source of uncertainty in the determination of masses and
radii comes from the uncertainty in the distance to the
white dwarfs. Due to this uncertainty the empirical
data will show larger scatter in a direction almost per
pendicular to the theoretical mass-radius relations for
different compositions. The advent of new, more accurate,
parallax determinations have reduced some of the scatter,
as indicated by Figure 11 at least for DA white dwarfs.
A comparison of Figure 11 with the mass-radius diagram
derived by Wickramasinghe and Strittmatter (1972), based
mainly in old parallax determinations, indicates that bhe
new data is in better agreement with the mass-radius re
lations computed by Hamada and Salpeter (1961).
Nevertheless, it remains to investigate the
nature of the large masses derived for EG 37 and 38 (see
Figure 11 and Table 14). Such large masses become a
source of doubt on the degenerate-dwarf character of both
stars. However, the spectroscopic analysis of these two
stars is unequivocal on the effects of high surface
gravity upon the absorption lines of hydrogen (Eggen and
Greenstein 1965a). According to those observations both
stars are bona fide white dwarfs. It is possible then
that in the case of these two stars, the masses derived
here are affected by a systematic error. The analysis
of the uncertainty attached to the value of log (M/M )
quoted in Table 13 indicates that such systematic error
is plausible. In the cases of these two stars the un
certainty of log (M/M ) amounts to 0.22 in the logarithm,
a value that is comparable with the uncertainty of
several other DA white dwarfs with masses about 0.3 M . o
Consequently the large masses arise from an error in some
term of Equation 23 and Equation 24. Examination of the
values of log(T log(g) and their respective uncer-6X1
tainties (see Table 13) reveals no peculiarities in the
value of the effective temperature. However, the value
of the surface gravity is an order of magnitude larger
for EG 37 and 38 than the average value for the other
DAs in the sample. Keeping in mind that gravities have
been derived here by measuring the strength of , one
would expect lower gravities if the spectrum of both
stars were contaminated by a late type companion. There
fore, these two white dwarfs actually have larger gravi
ties or the model atmospheres used to match the strength
of Hg are inadequate in these two cases only. It is
difficult to judge the possibilities of the two alterna
tives .

119
Adopting the first alternative it is necessary
to search for errors in another term. Then the next step
is to search for an error in the value of the bolometric
magnitude. A systematic error in the bolometric correc
tion appears unlikely because the error is not present
in other DAs of similar effective temperature. In par
ticular the error is not detected in the hotter DA white
dwarfs known as EG 42 (see Figure 9). This conclusion
leads to a search for systematic error in the absolute
magnitude. A systematic error in the absolute magnitude
of EG 37 and 38 implies that their distance is different
from the distance of the Hyades cluster.
Strittmatter (1977) suggested to search for a
systematic error in the distance by assuring that EG 37
and 38 are members of the carbon mass-radius relation that
should lie slightly above the magnesium mass-radius curve
in Figure 11. Under this assumption the position of both
stars, near the hydrogen mass-radius relation, is due
to an erroneous value of the bolometric magnitude. An
increase of one unit in the bolometric magnitude corre
sponds to a change of -0.2 in log(R/R ) and -0.4 in
log(M/M ). Combination of both changes results in a
shift almost transversal to the mass-radius relations
presented in Figure 11. Accordingly, if EG 37 and 38
actually populate the carbon mass-radius relation, their

120
bolometric magnitude is about 1.3 mag fainter than the
value derived with the Hyades distance. This is equiva
lent to a parallax of it = 0."039 for both stars instead
of tt = 0."022 adopted for the Hyades cluster. The
corresponding values of log(M/M ) are 0.14 + 0.22 for
EG 37 and 0.30 + 0.22 for EG 38. These new values lend
support to the degenerate-dwarf character of both stars.
It is interesting to consider the effect of
fainter bolometric magnitudes for EG 37 and 38 upon the
two sequences of DA white dwarfs in the H-R diagram
(Figure 10). As long as EG 37 and 38 are assumed to be
at the distance of the Hyades cluster their bolometric
magnitudes fit the brighter sequence. However, if their
bolometric magnitudes are fainter by 1.3 mag3 as suggested
above, both stars become members of the fainter sequence.
The shift from the brighter to the fainter sequence re
sults from the fact that the separation of the two
sequences is about 1.2 mag. Since the fainter sequence
appears to be the crystallisation sequence of degenerate
dwarfs with mostly carbon in their internal composition
it can be seen that these considerations produce a highly
consistent scenario for these two white dwarfs. The only
requirement is that both stars are foreground to the
Hyades cluster. Determination of the trigonometric

121
parallax of EG 37 and 38 will provide a conclusive test
to the foregoing assumptions.
Eggen and Greenstein ( 1 9 6 5 a ) reported that EG 33
is probably an unresolved double of DA and dMe types .
Also van Altena (1969) has noted that a dM star with
V = 15.0^ mag and (B-V) =1.6 mag plus a DA white dwarf
with V = 1*1.24 mag and (B-V) = 0.0 satisfy the observed
broad band colors of EG 38 and, at the same time, the
color-magnitude diagram for the Hyades stars. However,
this possibility reduces the bolometric magnitude of the
white dwarf by only 0.3 mag and maintains an uncomfort
ably large value for the mass. Furthermore, it appears
that the intrinsic brightness of the late type companion
has been exaggerated in order to fit the UBV observations.
The effects of a dM companion are not detected in the
intermediate band colors observed by Graham (1972) or
the colors determined with the u, s, B and y spectral
bands.
In conclusion, the results of the present work
uphold the two sequences of white dwarfs in the H-R dia
gram and indicate that is rather too early to deny the
existence of crystallization sequences. Further observa
tions of newly discovered DAs and observations of the
trigonometric parallax of some individual cases may con
firm the existence of a crystallization sequence formed

122
by degenerate dwarfs with Internal composition of carbon
and oxygen.
The following is a note added in proof. The
fifth catalogue of trigonometric parallaxes from the
Naval Observatory (Harrington et al. 1978) reports a new
and more accurate parallax for EG 11 (= L 870-2) that
makes the star intrinsically fainter. According to this
new value TTabs = 0."083 + 0."003 in the absolute scale,
instead of = 0."064 + 0."013 as determined at the
Cape Observatory. Consequently, the actual bolometric
magnitude of EG 11 is M^ol = 12.04 and closer to the
fainter sequence in the H-R diagram. Also this result
shifts the star from the hydrogen mass-radius relation
(see Figure 11) to a position at log(R/RQ) = -1.7^ + 0.10
and log(M/M ) = 0.07 + 0.28. The new position is closer
to the mass-radius relation for carbon white dwarfs.
APPENDIX A
SPECTRAL RESPONSIVITIES
Table 15 presents the spectral responslvlties
of the four spectral bands used in the photometric ob
servations of this investigation.
The steps taken to derive the different factors
of the individual responsivities have been described in
the last section of Chapter 2.
The spectral responsivity is the product of three
factors: (1) the two mirrors reflectance, (2) the
photomultiplier response, and (3) the filter transmittance.
The filter transmittance is not listed because it can
be derived from the data given for each band.
123

124
Table 15. The u, s, 3, and y spectral responsivities.
Two Mirrors Photomultiplier Spectral Band X Reflectance Responsivity Responsivity nm % % %
The u Band
318 76 43 1 320 76 50 2 322 76 53 4 324 76 56 7 326 76 68 9 328 76 6 1 12 330 76 64 15 332 76 67 18 334 76 70 20 336 76 72 22 338 76 75 24 340 76 78 25 342 76 80 26 344 76 82 27 346 76 83 28 348 76 85 28 350 76 86 28 352 76 87 27 354 76 88 26 356 76 89 25 358 76 90 24 360 76 91 22 362 76 92 20 364 76 93 1 6 366 76 94 14 368 76 94 11 370 76 95 8 372 76 96 5 374 76 96 3 37 6 76 97 1
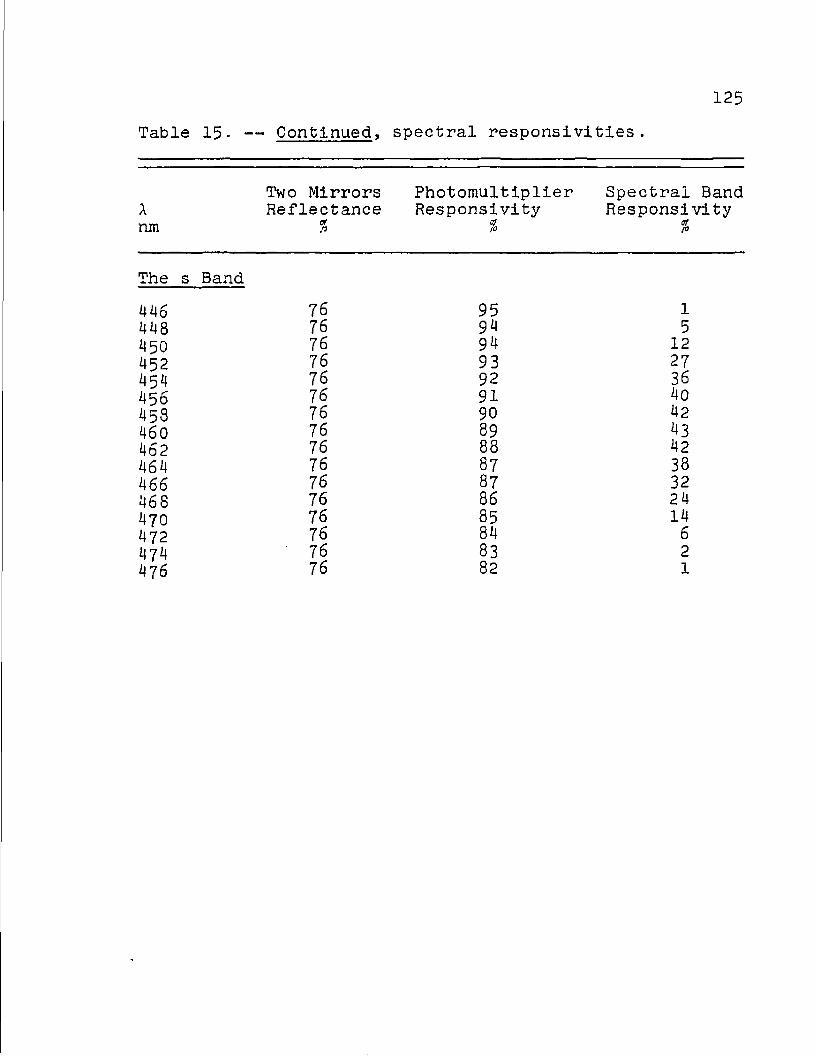
Table 15- — Continued, spectral responsivitles.
Two Mirrors Photomultlplier Spectral Band X Reflectance Responsivity Responsivlty nm % % Of to
The s Band
446 76 95 1 448 76 94 5 450 76 94 12 452 76 93 27 454 76 92 36 45o 76 91 40 458 76 90 42 460 76 89 4 3 462 76 88 42 464 76 87 38 466 IS 87 32 468 76 86 24 470 76 85 14 472 76 84 6 474 ' 76 83 2 476 76 82 1

126
Table 15. — Continued, spectral responslvities.
Two Mirrors Photomultiplier Spectral Band \ Reflectance Responsivity Responsivity nm % % %
The 3 Band
45 6 76 91 1 458 76 90 2 460 76 89 2 462 76 88 4 464 76 87 6 466 76 87 10 468 76 86 14 470 76 85 21 472 76 84 29 474 76 83 35 476 7 6 82 39 478 76 80 40 480 76 80 40 482 76 79 39 484 76 78 39 486 76 76 38 488 76 75 37 490 76 74 36 492 76 72 35 496 76 70 34 498 76 69 32 500 76 68 29 502 76 67 23 504 76 65 18 506 76 64 12 508 76 62 8 510 76 61 5 512 76 60 3 514 76 59 2

127
Table 15« — Continued, spectral responsivities.
Two Mirrors Photomultiplier Spectral Band A Reflectance Responsivity Responsivlty nm % % %
The y Band
516 76 57 2 518 76 56 1 524 76 53 1 526 76 51 1 528 76 50 2 530 76 49 3 532 75 48 4 534 75 47 6 536 75 46 9 538 75 45 13 5^0 75 44 18 542 75 43 22 544 75 42 24 546 75 41 26 548 75 40 26 550 75 39 25 552 75 38 25 554 74 37 23 556 75 37 28 558 75 36 19 560 75 35 13 562 75 34 10 564 75 34 7 5 6 6 75 33 5 568 75 33 3 570 75 32 2 572 75 31 2 574 75 30 1 576 75 30 1

APPENDIX B
VISUAL MAGNITUDES COMPILATION
Table 16 presents the apparent visual magnitude
and the number of observations obtained by four different
observing groups for a sample of DA white dwarfs. For
each entry the weighted average is presented in the last
column. These data have been used to derive the mean
external error of the V magnitude for the observations
of this investigation, as explained in the last section
of Chapter 3 .
128

Table 16. Visual magnitudes of selected DA white dwarfs.
EG Eggen and Naval This No. Greenstein Graham Observatory Work Average
mm mm m
10 14 .10 1 — 14.17 1 14.14 2 11 12.84 4 12.79 2 12.86 5 12.84 11 15 13.22 2 13.22 4 13.21 3 13.22 9 17 13-68 6 — — T- 13-59 1 13.68 7 26 14.47 4 14 .47 2 14 .46 3 14 .47 9
28 13.80 3 13.80 3 13.81 5 13.74 4 13.79 15 29 15.35 1 — 15.24 2 15.28 3 30 14.14 1 14.15 2 14.11 1 14.14 k 33 9-52 2 9.52 4 9.42 5 9-47 11 3^ 15-63 3 — 15.59 5 15.65 1 15.61 9
36 14.29 4 1 4 . 2 7 2 14 .26 2 14 .28 8 37 14.02 4 14 .05 2 13.99 2 14.02 8 38 13-95 4 13.90 2 13.78 1 13.91 7 39 13-18 H 14 .11 2 14.14 1 14.15 7 42 13.82 i\ 13.86 2 13.82 2 13.83 8
H6 13-40 1 __ 13.49 3 13-47 4 50 12.10 2 12.05 4 12.05 4 11.86 4 12.00 14 67 13.32 4 13.29 3 13.31 8 13.29 6 13.30 21 70 12.97 2 13.00 2 — 13.01 1 12.99 5 76 12.90 3 13.09 2 — 13.06 4 13.01 9

Table 16. — Continued.
EG No.
Eggen and Greenstein
m Graham
m
Naval Observatory
m
This Work
m Average
m
83 13.60 3 13.70 2 13.65 4 13.68 4 13.65 13 87 13-34 2 13.29 3 - - 13.25 4 13.28 9 99 12.30 3 12.34 4 12.31 5 12.33 6 12.32 18 102 12.79 4 12.80 2 ,— 12.81 6 12.80 12 115 14.36 1 14.33 2 •— 14.38 5 14.36 8
123 14.26 5 14.33 2 , 14,36 3 14,30 10 125 13-90 2 — 13.92 2 13.94 1 13.92 5 130 14.00 2 14 .05 3 14.11 2 14.05 7 131 14.24 4 12 .30 2 12.28 3 12.28 2 12.27 11 135 13.69 2 13.66 2 13.71 3 13.62 3 1 3 . 6 7 1 0
139 11.54 5 11.54 2 11.51 3 11.55 5 11.54 15 150 12.77 2 12.73 3 12.84 5 12.79 1 0 155 12.35 2 — 14.34 4 14.34 6 159 13.10 2 — 12.97 3 13.02 5 161 15-25 1 — 15-33 5 15.32 1 15.32 7
162 12.90 3 12 .96 4 12.93 4 12.94 2 12.93 13 168 14 .50 1 — — 14.51 6 14.47 3 14. 5 0 1 0 184 12.50 2 1 2 .46 4 1 2 . 5 1 4 1 2 . 4 9 1 0 199 14.51 2 14.36 3 14 .29 2 14,28 2 14.36 9 201 13.01 1 — — 12.97 4 12.98 5
20 3 13.82 1 13,79 2 13,80 3 232 — — 1 3 . 6 8 3 13.67 2 1 3 - 6 8 5 2*17 11.80 1 — 11.78 2 11.75 2 11.77 5 261 — — 12,93 3 13.10 1 12.97 4

APPENDIX C
STROMGREN COLORS
Table 17 lists the (u-b) and (b-y) colors for
the 18 white dwarfs with accurate absolute magnitude
used by Graham (1972) to plot the M versus (b-y) diagram.
Figure 12 presents the variation of the absolute magni
tude with respect to both colors.
131
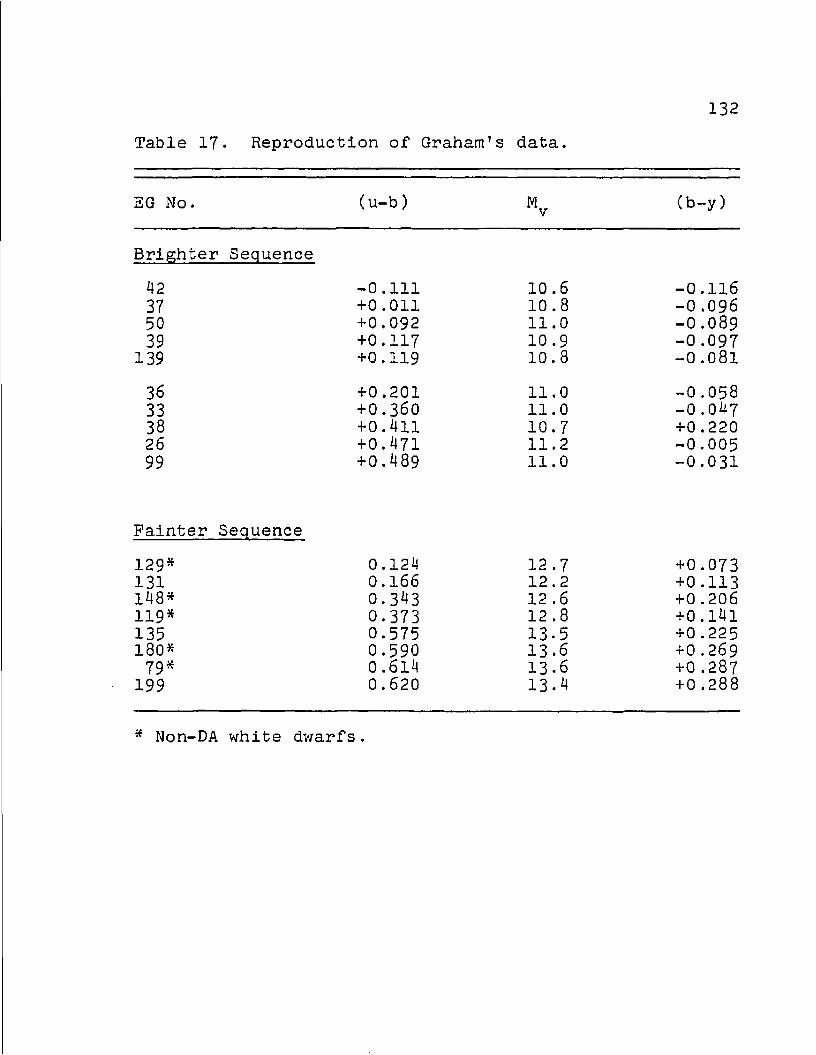
Table 1 7 - Reproduction of Graham's data.
EG No. (u-b) Mv (b-y)
Brighter Sequence
4 2 - 0 . 1 1 1 1 0 . 6 - 0 . 1 1 6 3 7 + 0 . 0 1 1 1 0 . 8 - 0 . 0 9 6 5 0 + 0 . 0 9 2 1 1 . 0 - 0 . 0 8 9 3 9 + 0 . 1 1 7 1 0 . 9 - 0 . 0 9 7
1 3 9 + 0 . 1 1 9 1 0 . 8 - 0 . 0 8 1
3 6 + 0 . 2 0 1 1 1 . 0 - 0 . 0 5 8 3 3 + 0 . 3 6 0 1 1 . 0 - 0 . 0 4 7 3 8 + 0 . 4 1 1 1 0 . 7 + 0 . 2 2 0 2 6 + 0 . 4 7 1 1 1 . 2 - 0 . 0 0 5 9 9 + 0 . 4 8 9 1 1 . 0 - 0 . 0 3 1
Painter Sequence
1 2 9 * 0 . 1 2 4 1 2 . 7 + 0 . 0 7 3 1 3 1 0 . 1 6 6 1 2 . 2 + 0 . 1 1 3 1 4 8 * 0 . 3 4 3 1 2 . 6 + 0 . 2 0 6 1 1 9 * 0 . 3 7 3 1 2 . 8 + 0 . 1 4 1 1 3 5 0 . 5 7 5 1 3 - 5 + 0 . 2 2 5 1 8 0 * 0 . 5 9 0 1 3 . 6 + 0 . 2 6 9
7 9 * 0 . 6 1 4 1 3 . 6 + 0 . 2 8 7 1 9 9 0 . 6 2 0 1 3 . 4 + 0 . 2 8 8
* Non-DA white dwarfs.

10
I 1
Mv 12
i 3
u
Figure 12.
" 1 • ! • I " " • I ' I 1 1
„ - 10 - _
- &x»0 11 o
o
o 00
o
EG3B X
o o oo
-
o 12 -
o -
EG 129* • * 13 EG 129*
• • _
o
So
• 14 — —
1 . t . 1 • I 1 r i
-0.2 OX) +0.2 +0.4
( b - y )
-0.2 0.0 +0.2 +0.4 +0.6
(u -b )
Absolute magnitude versus Stromgren colors. --- The left panel presents the Mv versus (b-y) diagram reproduced from Graham (1972); the right panel variation of Mv with respect to the (u-b) color is presented. Note the separation of about one and one-half magnitude between both sequences. DAs are presented with a circle. A dot is used for other types of white dwarfs.
M LO UO
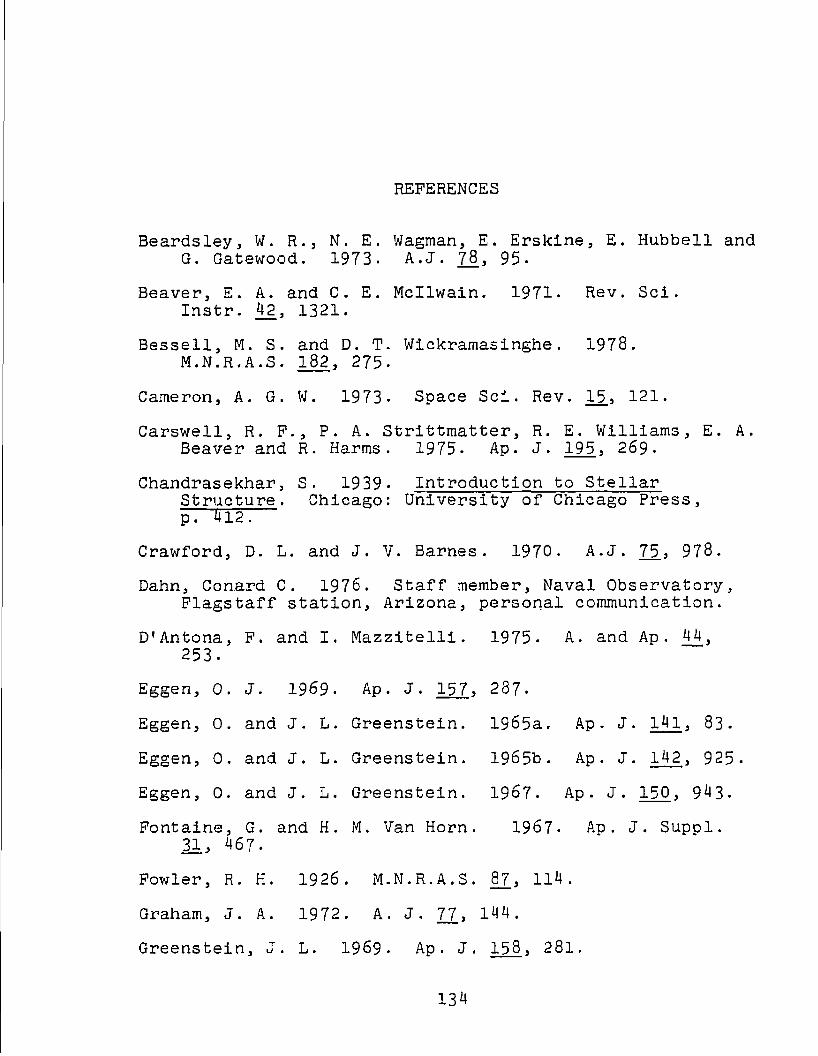
REFERENCES
Beardsley, W. R., N. E. Wagman, E. Erskine, E. Hubbell and G. Gatewood. 1973. A.J. 7J3, 95.
Beaver, E. A. and C. E. Mcllwain. 1971. Rev. Sci. Instr. 4£, 1321.
Bessell, M. S. and D. T. Wickramasinghe. 1978. M.N.R.A.S. 182, 275-
Cameron, A. G. W. 1973. Space Sci. Rev. 15., 121.
Carswell, R. F. , P. A. Strittmatter, R. E. Williams, E. A. Beaver and R, Harms. 1975. Ap. J. 195, 269.
Chandrasekhar, S. 1939* Introduction to Stellar Structure. Chicago: University of Chicago Press, p. 412.
Crawford, D. L. and J. V. Barnes. 1970. A.J. 75., 978.
Dahn, Conard C. 1976. Staff member, Naval Observatory, Flagstaff station, Arizona, personal communication.
D'Antona, F. and I. Mazzitelli. 1975- A. and Ap. 44, 253.
Eggen, 0. J. 1969. Ap. J. 157> 2 8 7 .
Eggen, 0. and J. L. Greenstein. 1965a. Ap. J. 141, 8 3 .
Eggen, 0. and J. L. Greenstein. 1965b. Ap. J. 142, 925*
Eggen, 0. and J. L. Greenstein. 1967- Ap. J. 150 > 943.
Fontaine, G. and H. M. Van Horn. 1967. Ap. J. Suppl. 31, 467.
Fowler, R. H. 1926. M.N.R.A.S. 87, 114.
Graham, J. A. 1972. A. J. 77_, 144.
Greenstein, J. L. 1969. Ap. J. 158, 281.
134

135
Greenstein, J. L. 1970. Ap. J. Letters 162, L55.
Greenstein, J. L. 1974a Ap . J. Letters 189 , L131.
Greenstein, J. L. 1974b Ap . J. Letters 194 , L51.
Greenstein, J. L. 1975. Ap. J. Letters 196, L117.
Greenstein, J. L., J. E. Gunn and J. Kristlan . 1971 Ap. J. Letters 169., L63-
Hamada, T. and E. E. Salpeter. 1961. Ap. J. 184, 683.
Hanson, R. B. 1975. A. J. 80^, 379*
Harrington, H. S., C. C. Dahn, A. L. Behall, J. B. Priser, J. W. Christy, B. Y. Diepe, H. D. Abies, H. H. Guetter, A. V. Hewitt and R. L. Walker. 1975. Publ. U.S.N.O., 2d Ser. XXIV, Part I.
Harrington, R. S. , C. C. Dahn, M. Miranian, B. Y. Diepe, J. W. Christy, H. H. Guetter, H. D. Abies, A. V. Hewitt, P. J. Vrba and R. L. Walker. 1978. Naval Obs. preprint.
Hass, G. and J. E. Waylonis. 1961. J. Opt. Soc. Am. 51, 719.
Hayes, D. S. and D. W. Latham. 1975. Ap. J. 197, 593*
Heintz, W. D. 1973- A. J. 78, 780.
Holtsmark, J. 1931. Ann. d. Phys. 9, 338.
IBM. 197^. Scientific Subroutine Package (IBM/360), p. 291.
Jenkins, L. F. 1952. General Catalogue of Trigonometric Stellar Parallaxes (Yale University Obs., New Haven), p . 1.
Jenkins, L. P. 1963- Supplement to the General Catalogue of Trigonometric Stellar Parallaxes (Yale University Obs., New Haven), p. 1.

136
Kelley, G. G. 1964. Methods of Experimental Physics: Vol. 2, Electronic Methods. ed. TT. Morton (Academic Press, New York), p. 519 •
Klemola, A. R. , E. A. Harlan, B. McNamara and C. A. Wirtanen. 1975. A. J. ̂ 30_, 642.
Kurucz, R. L. 1970. S.A.O. Special Report, No. 309 s p. 16 .
Lambj D. Q. and H. M. Van Horn. 19 75. Ap. J. 200, 306 .
Landstreet, J. D. and J. R. P. Angel. 1975* Ap. J. 196, 819 .
Liebert, J. 1976. Res. Assoc., Stewart OBS, Private Com.
Liebert, J. J. R. P. Dugel and J. D. Landstreet. 1975-Ap. J. Letters, 202, L139•
Lippincott, S. L. 1973. A. J. 7.8, 426.
Luyten, W. J. 1945. Ap. J. 101, 131.
Luyten, W. J. 1963- Adv. A. and Ap. 199.
McCook, G. P. and E. M. Sion. 1977- Villanova Univ. Obs. Contr. No. 2.
Mestel, L. and M. A. Ruderman. 1967- M.N.R.A.S. 136, 27.
Mihalas, D. 1975- Multicolor Photometry and the Theoretical H-R Diagram. Edited by A. G. D. Philip and D. S. Hayes, Dudley Obs. Report No. 9, p. 241.
Moore, C. H. 1974. A. and Ap. Suppl. 15., 497.
Nandy, K. 1 9 6 8 . Pub. R. Obs. Edinburg 6 _ , No. 7, 169-
O'Dell, C. R. 1974. I.A.U. Symp. No. 66, Late Stages of Stellar Evolution, edited by R. J. Tayler (Dordrecht-Holland), p. 213.
Oke, J. B. 1974 . Ap. J. Suppl. 27., 21.
Oke, J. B. and R. E. Schild. 1970. Ap. J. l6l, 1015.
Ostriker, J. P. 1971. Ann. Rev. A. and Ap. 9., 353.
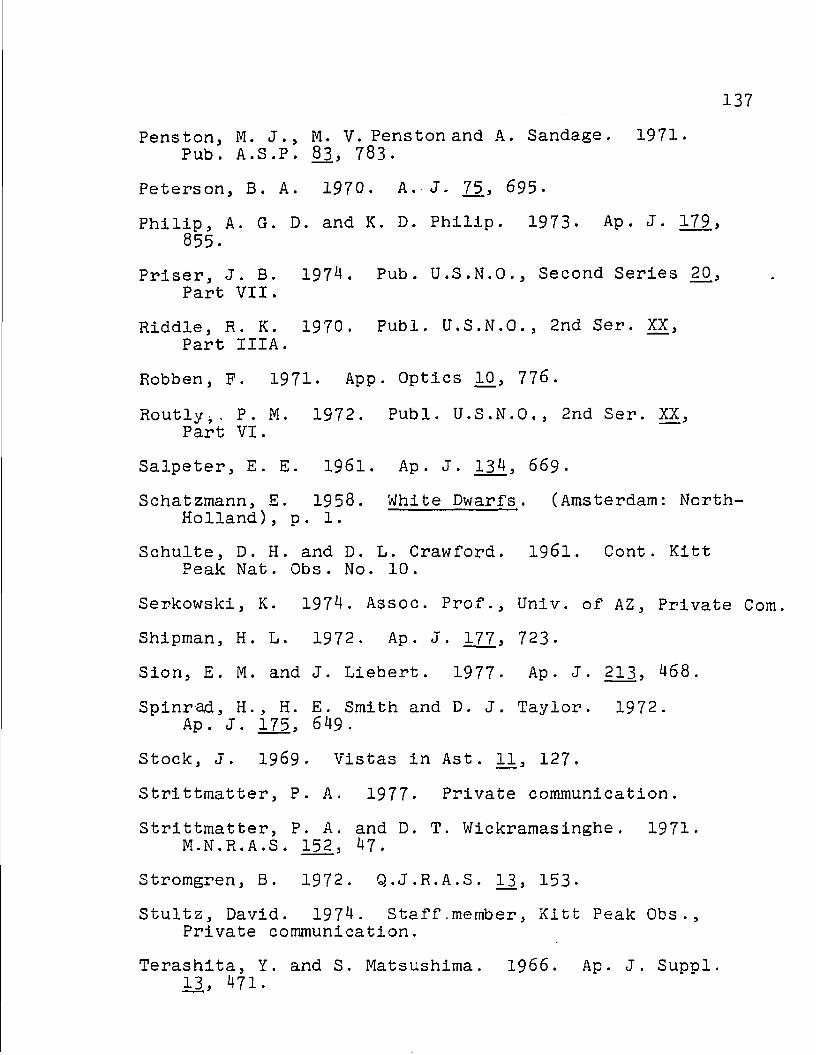
137
Periston, M. J., M . V. Penston and A. Sandage. 1971. Pub. A.S.P. 83, 783.
Peterson, B. A. 1970. A. J. 75., 695.
Philip, A. G. D. and K. D. Philip. 1973- Ap. J. 179, 855.
Priser, J. B. 1974. Pub. U.S.N.O., Second Series 20., Part VII.
Riddle, R. K. 1970. Publ. U.S.N.O., 2nd Ser. XX, Part IIIA.
Robben, F. 1971. App. Optics 10, 776.
Routly j, P. M. 1972. Publ. U.S.N.O,, 2nd Ser. XX, Part VI.
Salpeter, E. E. 1961. Ap. J. 134, 6 6 9 .
Schatzmann, E. 1958. White Dwarfs. (Amsterdam: North-Holland), p. 1.
Schulte, D. H. and D. L. Crawford. 1961. Cont. Kitt Peak Nat. Obs. No. 10.
Serkowski, K. 1974. Assoc. Prof., Univ. of AZ, Private Com.
Shipman, H. L. 1972. Ap. J. 177, 723.
Sion, E. M. and J. Liebert. 1977- Ap. J. 213, 468.
Spinrad, H., H. E. Smith and D. J. Taylor. 1972. Ap. J. 175, 649.
Stock, J. 1969. Vistas in Ast. 11, 127.
Strittmatter, P. A. 1977. Private communication.
Strittmatter, P. A. and D. T. Wickramasinghe. 1971. M.N.R.A.S. 152, 47.
Stromgren, B . 1972. Q.J.R.A.S. 13., 153.
Stultz, David. 1974. Staff.member, Kitt Peak Obs., Private communication.
Terashita, Y. and S. Matsushima. 1966. Ap. J. Suppl. 13, 471.
138
Terashita, Y. and S. Matsushima. 1969- Ap. J. 156, 203.
Thomas, D. V. 1973. M.N.R.A.S. l6l, 335-
Turorij P. and M. 0. Mennessier. 1975- A. and Ap. 44, 209.
Unsold, A. 1955- Physik der Sternatmospharen, 2nd ed. (Springer-Verlag, Berlin), p. 206.
Upgren, A. R. 1974. A. J. 79., 651-
van Altena, W. P. 1969- A. J. 74., 2.
van Altena, W. P. 1971a. Ap. J. 165, L77-
van Altena, W. P. 1971b. A. J. 7§_} 932.
van Altena, W. P. 1974. A. J. 79.3 8 2 6 .
Van Horn, H. M. 1968. Ap. J. 151, 227.
Van Horn, H. M. 1970. Ap. J. 160, L53-
Van Horn, H. M. 1977. Prof., Rochester Univ., Priv. Com.
Wagman, N. E. 1967. A. J. 72., 957.
Wehrse, R. 1975- A. and Ap . 39., 169.
Wehrse, R. 1976. A. and Ap. Suppl. 24_, 95.
Weidemann, V. 1963. Zs. f. Ap. 57., 8 7 .
Weldemann, V. 1966. J. Quant. Spectr. Rad. Transfer 6., 691.
Weidemann, V. 1971. IAU Symp. No. 42, White Dwarfs, edited by W. J. Luyten, Reidel, Dordrecht, p. 8l,
Weidemann, V. 1975. Problems in Stellar Atmospheres and Envelopes. Edited by B. Baschek, W, H. Kegel and G. Trairing (Heidelber: Springer-Verlag), p. 173-
Weidemann, V. 1977. A. and Ap. 59., 411.
Wickramasinghe, D. T. 1972. Mem. R.A.S. 76., 129-

139
Wickramasinghe, D. T. and P. A. Strittmatter. 1970. M.N.R.A.S. 150, 435.
Wickramasinghe, D. T. and P. A. Strittmatter. 1972. M.N.R.A.S. 160, 421.
Wickramasinghe, D. T. and J. Whelan. 1977. M.N.R.A.S. 178, IIP.
Wickramasinghe, D. T., R. I. Thompson and P. A. Strittmatter. 1972. Ap. J. 178, 763.
Wildt, R. 1939. Ap. J. 90, 611.
Young, T. 1963. App. Optics 2, 51.
Young, T. 1969. App. Optics, £3, 2431 .
Young, T. 1974. Methods of Experimental Physics, Vol. 12, Astrophysics, Part A: Optical and Infrared. Edited by N. P. Carleton (Academic Press, New York), p. 1.