university extension/department of economics grain transportation infrastructure pioneer...
TRANSCRIPT

University Extension/Department of Economics
Grain Transportation Infrastructure
Pioneer GrowingPoint® Advisory Board MeetingKansas City, Missouri
Mar. 14, 2011
Chad HartAssistant Professor/Grain Markets Specialist

University Extension/Department of Economics
Grain Flow SurveysEdward Yu and I conducted grain and biofuel flow
surveys for the 2006/07 and 2007/08 marketing years in Iowa.
2006/07 Report:• http://www.card.iastate.edu/publications/DBS/PD
FFiles/08sr102.pdf
2007/08 Report:• http://www.card.iastate.edu/publications/DBS/PD
FFiles/09sr103.pdf

University Extension/Department of Economics
Survey Format5 distinct surveys
• Grain Marketers (Farmers)
• Grain Handlers
• Corn Processors (including Ethanol)
• Soybean Processors
• Biodiesel Producers

University Extension/Department of Economics
0
10
20
30
40
50
60
70
Countryelevators
Corn processors River terminals Farm/feedingoperations
1999/2000 2006/07
Shifting Markets for Cornpercent

University Extension/Department of Economics
Transportation for Corn

University Extension/Department of Economics
0
10
20
30
40
50
60
70
80
Country elevators Soybean processors River terminals
1999/2000 2006/07
Shifting Markets for Soybeanspercent
University Extension/Department of Economics
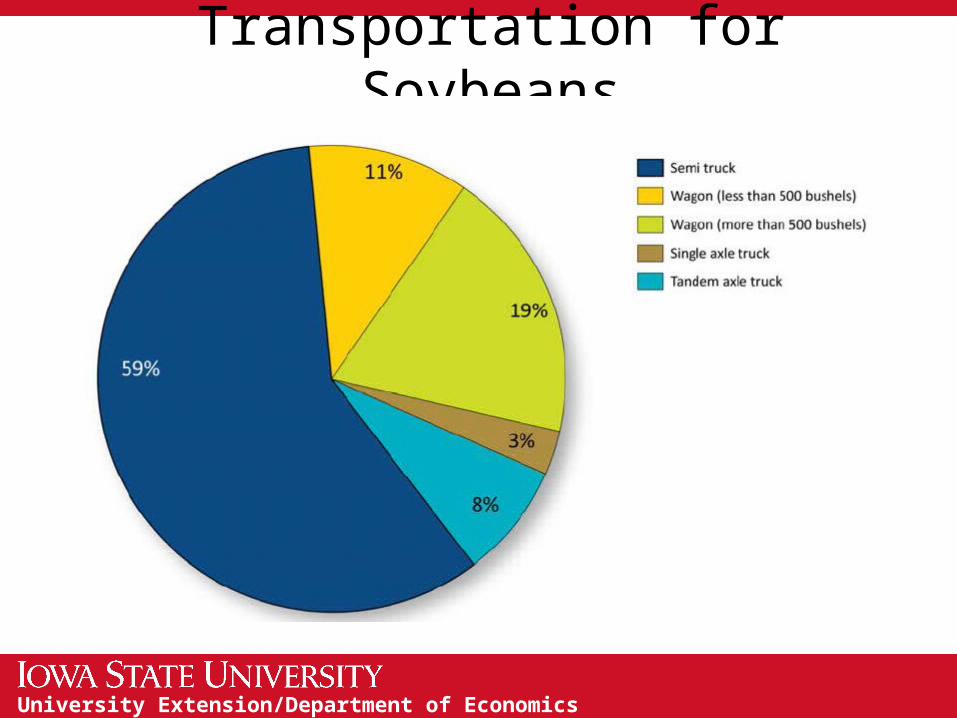
Transportation for Soybeans
University Extension/Department of Economics
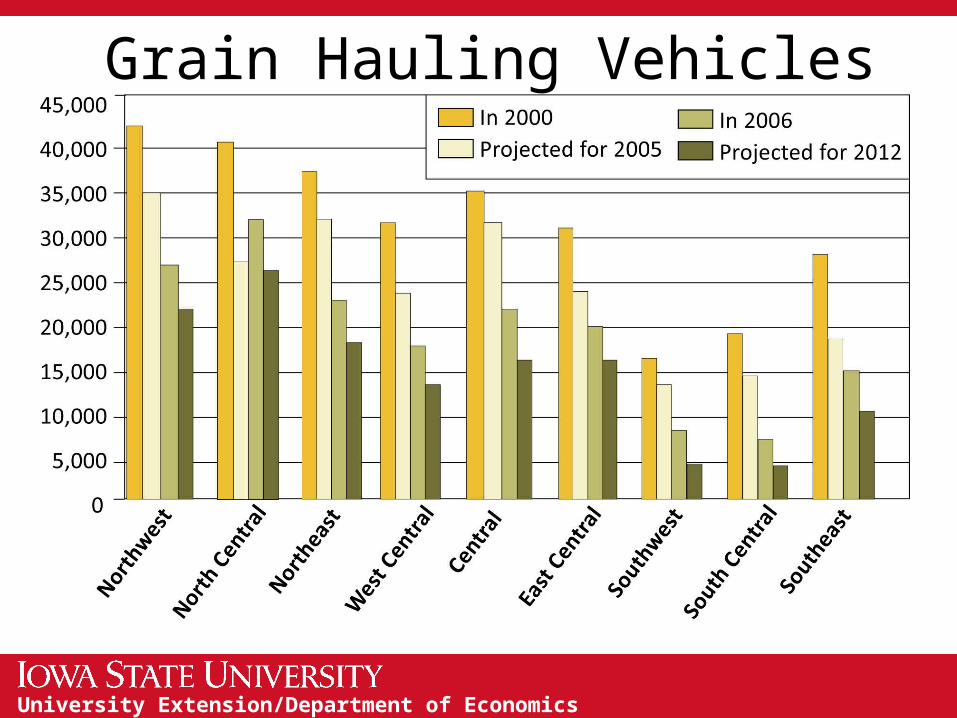
Grain Hauling Vehicles

University Extension/Department of Economics
-50
-40
-30
-20
-10
0
10
20
30
Wagon(<500 bu.)
Wagon(>=500
bu.)
Single axletruck
Tandemaxle truck
Semi Other
Projected Change in Fleet by 2012percent

University Extension/Department of Economics
Producer Shipments
University Extension/Department of Economics
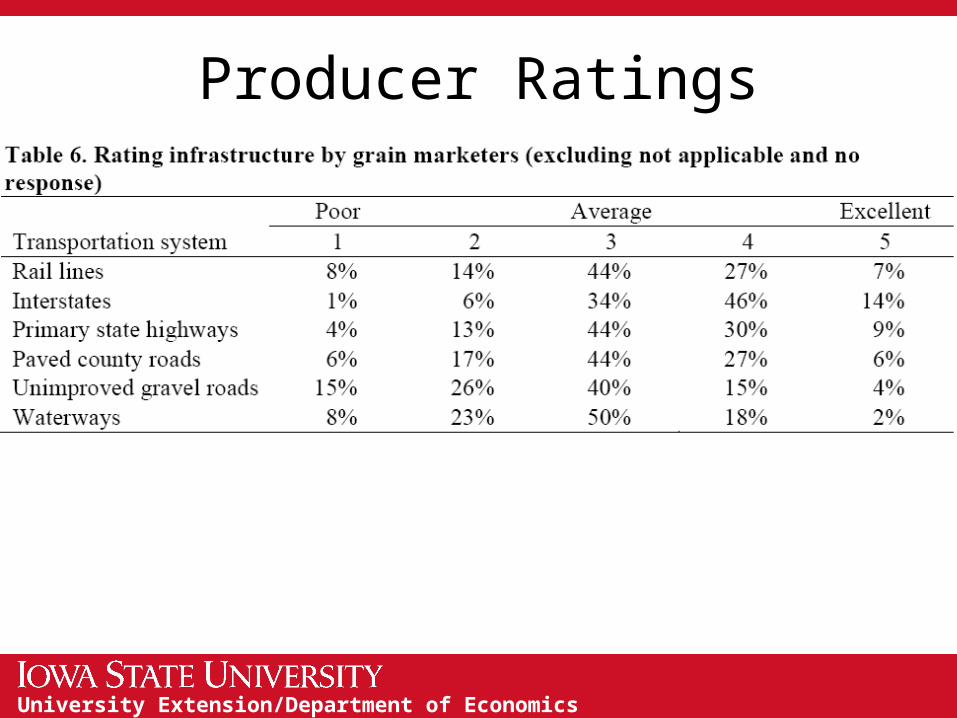
Producer Ratings

University Extension/Department of Economics
Producer Ratings

University Extension/Department of Economics
0
10
20
30
40
50
Feeders Corn processors River terminals Export markets
1999/2000 2006/07
Shifting Markets for Corn Handlerspercent
University Extension/Department of Economics
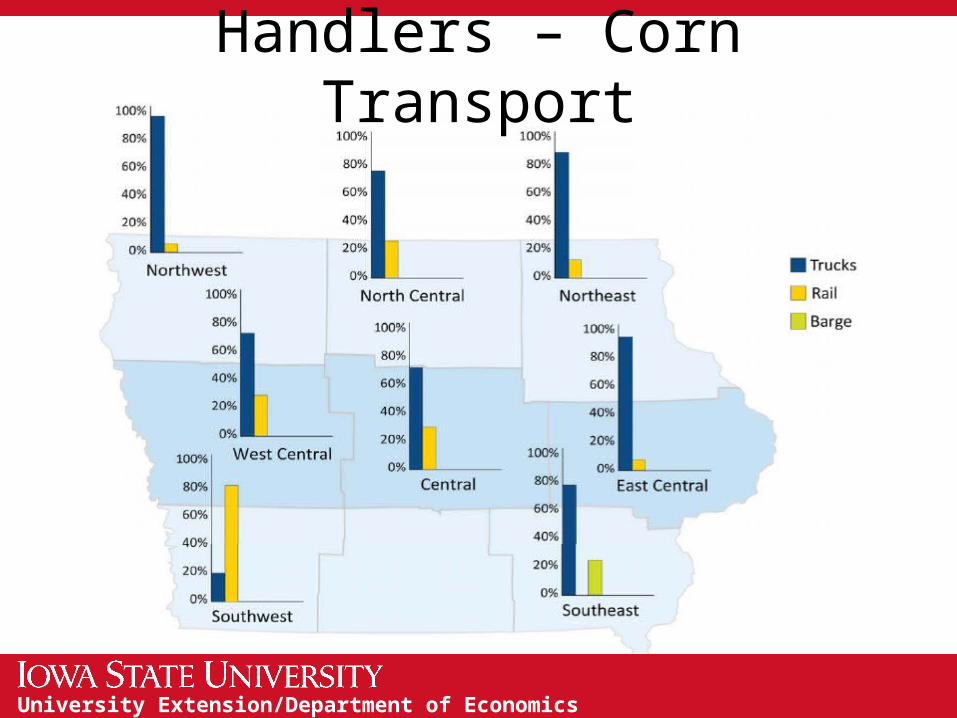
Handlers – Corn Transport

University Extension/Department of Economics
0
10
20
30
40
50
60
70
80
90
Soybean processors River terminals Export markets
1999/2000 2006/07
Shifting Markets for Soy Handlerspercent

University Extension/Department of Economics
Handlers – Soybean Transport

University Extension/Department of Economics
Elevator Ratings

University Extension/Department of Economics
Elevator Ratings

University Extension/Department of Economics
Ethanol Markets for 2007/08

University Extension/Department of Economics
Survey Summary• Continued demand for corn from the livestock
and ethanol industries is expected to generate more demand for in-state transportation.
• Although the share of export markets decline, the volume may increase given the expanding harvests.
• The total vehicles owned by farmers continue to decline, however, the number of heavier vehicles (large wagons and semis) is expected to increase.

University Extension/Department of Economics
Survey Summary• Most of the biofuels and co-products were sold
to other states, translating to a higher demand for rail services.
• Interstate highways received the most positive feedback, gravel roads received the least.
• High transportation costs was the common hurdle for all five surveyed groups.
University Extension/Department of Economics
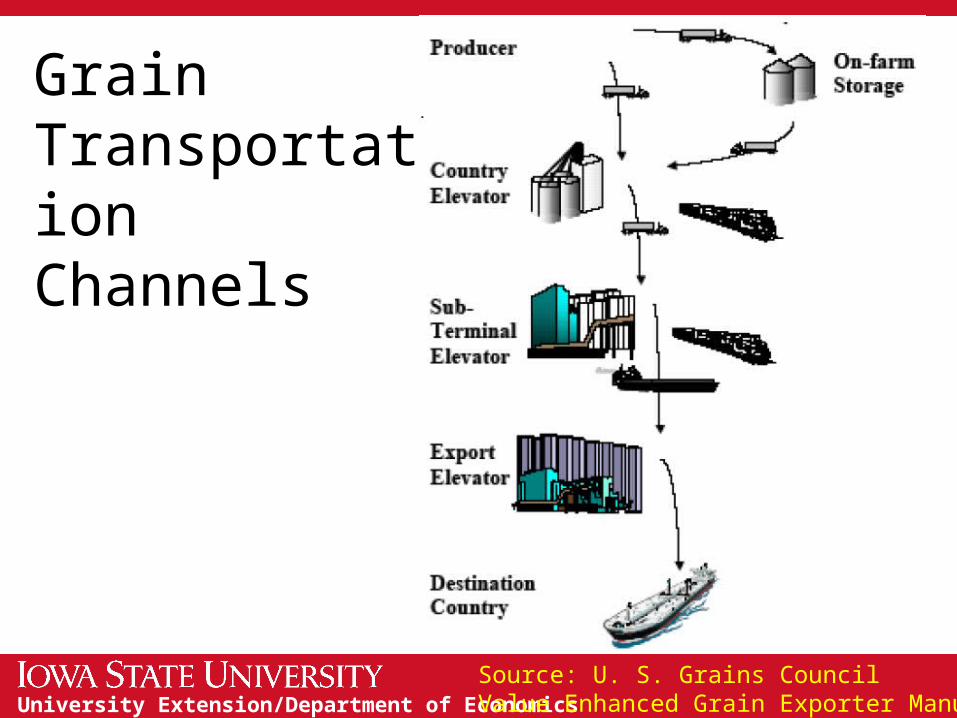
Grain Transportation Channels
Source: U. S. Grains CouncilValue Enhanced Grain Exporter Manual

University Extension/Department of Economics
Transportation Costs
Source: USDA, Agricultural Transportation Challenges for the 21st Century

University Extension/Department of Economics
Iowa Roadways
As of 2008:
Interstates 781 miles
Principal and minor arterials 9,748 miles
Collectors 31,558 miles
Local 72,136 miles
Total 114,223 miles
Source: BTS State Transportation Statistics2009 Edition

University Extension/Department of Economics
Iowa Roadway Conditions
As of 2008:
Very Good 2,456 miles 10.1%
Good 7,064 miles 28.9%
Fair 10,944 miles 44.8%
Mediocre 2,460 miles 10.1%
Poor 1,498 miles 6.1%
Source: BTS State Transportation Statistics2009 Edition

University Extension/Department of Economics
Roadway Comparison
Source: BTS State Transportation Statistics2009 Edition
Rank State % Mediocre or worse
1 New Jersey 49.5%
2 Hawaii 46.1%
3 California 40.5%
4 Vermont 36.3%
5 Idaho 35.2%
6 Maryland 34.6%
7 Kansas 32.6%
8 Alaska 32.4%
9 Oklahoma 32.3%
10 West Virginia 29.4%
Iowa is 25th with 16.2% of the roads rated “Mediocre” or “Poor”.
For the entire U.S. 17.9% of the roads rated “Mediocre” or “Poor”.
In Washington DC 96.0% of the roads rated “Mediocre” or “Poor”.

University Extension/Department of Economics
Iowa Bridges
As of 2009:
Iowa has 24,799 bridges
5,358 (21.6%) are structurally deficient
1,320 (5.3%) are functionally obsolete
Source: BTS State Transportation Statistics2009 Edition
U.S.
11.8%
12.9%
Iowa ranks 4th in structurally deficient bridges

University Extension/Department of Economics
Costs Due to Rough Roads
Source: AASHTO, “Rough Roads Ahead”May 2009
State Cost per Motorist New Jersey $596 California $590 Hawaii $503 Rhode Island $473 Oklahoma $457 Maryland $425 Missouri $410 New York $405 Mississippi $394 Louisiana $388
The U.S. average is $335
Iowa is 11th with $383
Given Iowa’s nearly 2 million drivers, rough roads costs Iowans $762 million

University Extension/Department of Economics
Roadway Maintenance
Source: National Center for Pavement Preservation

University Extension/Department of Economics
Needs Assessment
The Iowa Department of Transportation looked at its critical needs versus revenue streams
Their projections show a shortfall of $267 million per year for critical transportation needs
Source: IDOT, TIME-21 Funding AnalysisDec. 2008

University Extension/Department of Economics
Iowa’s Rail and Grain Facilities
Source: IDOT

University Extension/Department of Economics
Rail Deliveries to Ports
Source: USDA-AMS

University Extension/Department of Economics

University Extension/Department of Economics
University Extension/Department of Economics

University Extension/Department of Economics
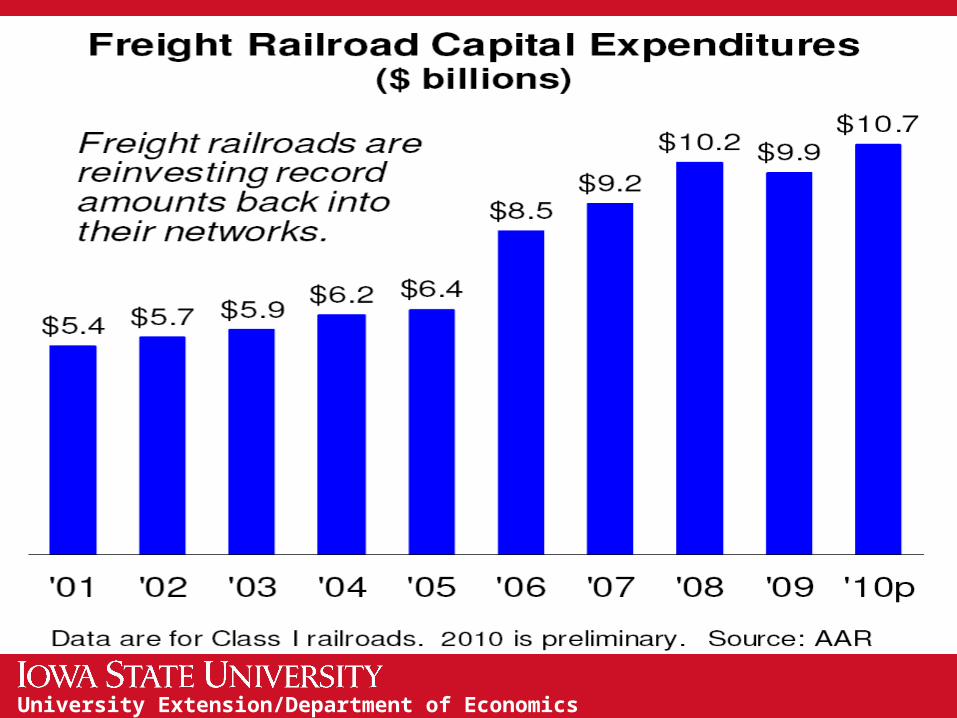
Rail Needs
Large-scale corridor expansion projects
New intermodal terminal facilities
New, more efficient locomotives and rail cars
Upgrades to railway track and structures
New technology and communication systems
Source: Association of American Railroads

University Extension/Department of EconomicsSource: Russ ByingtonUS Dept. of Transportation
Barge and Rail Shipments of Grain to U.S. Ports, 2000-2008
0
20
40
60
80
100
120
2000 2001 2002 2003 2004 2005 2006 2007 2008
Mil. Tons
Barge Rail

University Extension/Department of Economics
U.S. Waterway System
Source: USACE

University Extension/Department of Economics
Upper Mississippi Locks
Source: USACE

University Extension/Department of Economics
Barge Grain Shipments
Source: USDA-AMS
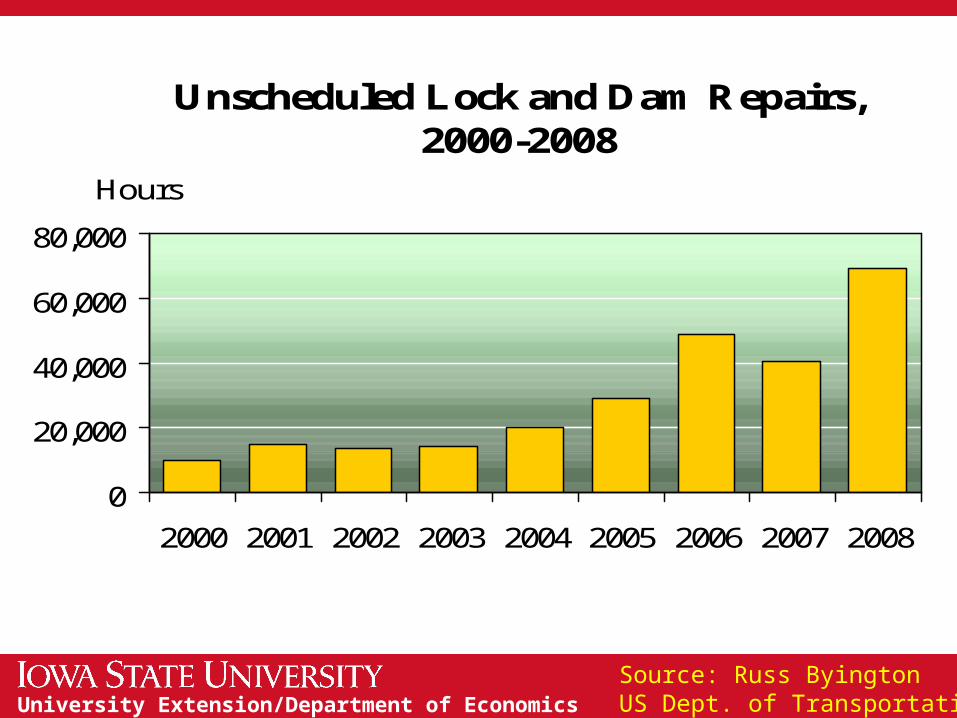
University Extension/Department of EconomicsSource: Russ ByingtonUS Dept. of Transportation
Unscheduled Lock and Dam Repairs, 2000-2008
0
20,000
40,000
60,000
80,000
2000 2001 2002 2003 2004 2005 2006 2007 2008
Hours

University Extension/Department of Economics
Barge Issues
Aging infrastructure in need of repair
Expansion of locks to meet barge shipping needs600 vs. 1200 feet long locks
Environmental vs. shipping concerns
Source: Association of American Railroads
University Extension/Department of Economics
University Extension/Department of Economics
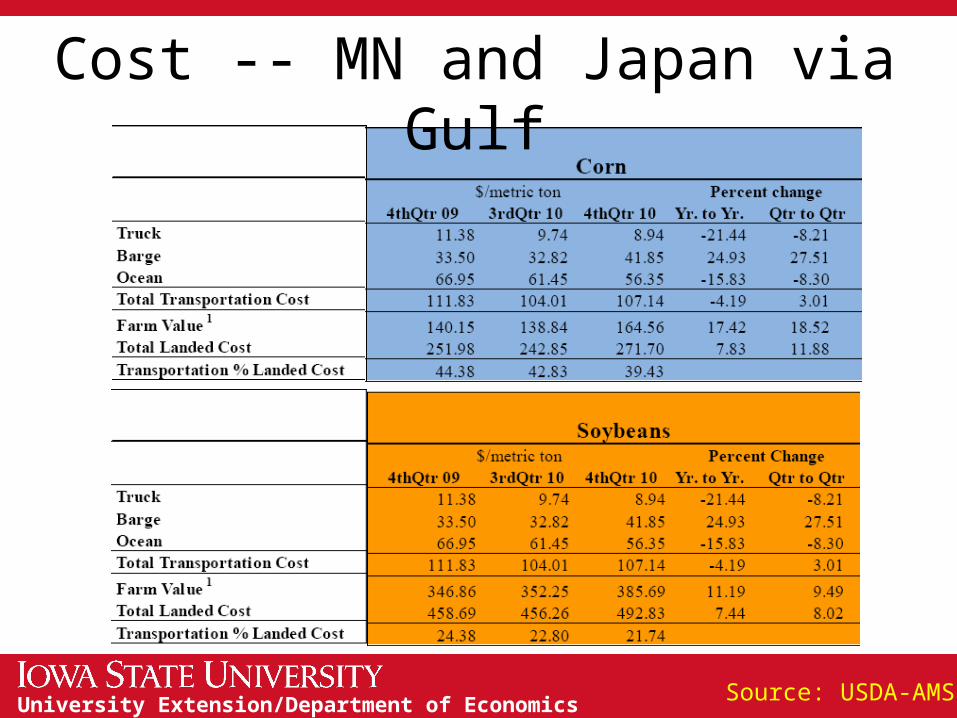
Cost -- MN and Japan via Gulf
Source: USDA-AMS

University Extension/Department of Economics
Cost -- MN and Japan via PNW
Source: USDA-AMS

University Extension/Department of Economics
Thank you for your time!
Any questions?
My web site:http://www.econ.iastate.edu/~chart/
Iowa Farm Outlook:http://www.econ.iastate.edu/ifo/
Ag Decision Maker:http://www.extension.iastate.edu/agdm/