universiti putra malaysia an economic analysis of … · 2013-05-27 · cephalopod export market...
TRANSCRIPT
UNIVERSITI PUTRA MALAYSIA
AN ECONOMIC ANALYSIS OF THAILAND'S CEPHALOPOD EXPORT MARKET
Ratana Sungsitthisawad
FEP 1986 3

All ECOIOHIC AIIALYSIS OF 'l'HAILAIfD' S CEPHALOPOD EXPORT KAnET
by
Ratana Sungsitthisawad
A thesis submitted in partial fulfilment of the requirements for the degree of Master of Science
in the Faculty of Economics and Management , Universiti Pertanian Malaysia .
June 1986
It is hereby certified that we have read this thesis entitled An Economic Analysis of Thai's Cephalopod Export Market by Ratana Sungtthisawad, and in our opinion it is satisfactory in terms of scope, quality and presentation as partial fulfilment of the requirements for the degree of Master of Science.
ALAN P. ZAINUDDIN, Ph. D. Assoc. sor/Dean of Graduate Studies
Universiti Pertanian Malaysia (Chairman Board of Examiners)
�SA)"'-<-THEODO 'A�otOU, Ph. D.
Ag ural Development Council Faculty of Economics and Business Administration
Kasetsart University Thailand.
(External Examiner)
EDDI NG, M. Agric. Sc. Lecturer, Dept. of Economics
Faculty of Resource Economics and Agribusiness Universiti Pertanian Malaysia
(Internal Examiner)
Faculty
L�N A DUL GHAFFAR, Ph. D. Head, D�artment of Economics
of Resource Economics and Agribusiness Universiti Pertanian Malaysia
(Supervisor)

This thesis was submitted to the Senate of Universiti Pertanian Malaysia and was accepted as partial fulfilment of the requirement for the degree of Master of Science.
Date: '0 JUl 1986 ALAN�DIN' Ph.D. ASSoclate Professor/ Dean of Graduate Studies
ACDlOVLEDGFJfKIITS
I am grateful to many individuals and organizations for
providing me with the opportunity to complete the present study as
a part of my graduate program.
I wish to express my most sincere gratitude to my supervisor,
Dr. Roslan A. Ghaffar. His stimulating instructions and inspiration
have made the completion of this thesis possible. His willingness
to spend a great deal of his valuable time on this work made the
preparation of this thesis a very valuable educational experience.
My gratitude is also due to Mr. Tai Shzee Yew my co-advisor
for his comment on an earlier draft was very helpful in revising
the manuscri pt.
The fellowship gran ted by International Center for Living
Aquatic Resource and Managemant (ICLARM) enabled me to complete the
graduate program at the Universiti Pertanian Malaysia. For this I
am most deeply grateful.
My sincere thanks to Dr. Brian Lockwood, Dr. Theodore
Panayotou, Dr. Chaiwat Konjing, Dr. Ruangrai Tokrisna, M r. Thanwa
and Associate Professor Ishak Haji Omar for their guidance whic h
led to the start of this thesis, to Dr. Chamnian Boonma, Dean of
Faculty of Economics and Business Administr ation, Kasetsart
University for his counsel, encouragement and guidance throughout
my graduate study.
ii
Deep appreciation is due to Aporn, Threeboon, Apirom,
Kanlayarat and Wilailak for their valuable help especially in the
preparation of this thesis, their willingness to obtain some data
and provide assistance in the statistical analyses of this study.
The words of encouragement which were badly needed, especially
during the diff icult months when eff orts to write this thesis
almost came to a halt were given by Liew Ny ook Fan, Nharong,
Supawan and Vo r a p a n are kindly a ckno wledged. I extend my
appreciation to Pi ti, Penp o rn, Ba h a r Bin Pu teh M a h a d i and
Kamaruzzaman A. Sa mah, who are my close friends in time of joy and
sorrow.
Finally I dedicate this thesis to my mother and my brother
who have offered great sacrifices to finance my earlier education
and words of encouragement throughout the period of my study abroad.
iii
ACKNOWLEDGEMENTS.
TABLE OF CONTENTS
LIST OF TABLES
ABSTRACT
TABLE OF COlltKRtS
Page
ii
iv
vii
viii
ABSTRAK x
CHAPTER I INTRODUCTION
World Cephalopod Supplies Resources and Trends
World Trade Patterns of Fresh and Frozen Cephalopod Products • •
World Cephalopod Demand and Consumption Patterns • • • •
Importance of Cephalopod Fishery in Thailand • • • • • • • • • • • • •
Statement of the Problem
Objective of the Study
Organization of the Study •
CHAPTER II REVIEW OF RELATED RESEARCH AND THEORETICAL FRAMEWORK
Previous Studies on Cephalopod and Fishery Products of Thailand
Liturature on Export Behavior
Summary • • •
iv
. . . .
1
6
6
9
14
18
18
20
23
37

CHAPTER III ANALYTICAL MODEL METHOD AND DATA
Introduction. • • • • • •
The Analytical Model.
Statistical Considerations and Estimation Procedures • • • • •
Definition and Data Source
CHAPTER I V EMPI RI CAL RESULTS AND DISCUSSION
Estimation Results For Salted Cephalopod Model •
Results of Estimation for Fresh Cephalopod Model. •
Summary
CHAPTER V SUMMARY, CONCLUSIONS AND SUGGESTIONS FOR FURTHER RESEARCH
Summary and Conclusion. . . . .
Policy Implications • • •
Suggestion for Further Research •
REFERENCES.
APPENDICES
. . . . . . . . . . . . . . . . . . . . . . .
A
B
C
D
Correlation Coefficient Matrix of Salted Cephalopod Export Supply Equation • • •
Correlation Coefficient Matrix of Salted Cephalopod Export Demand Equation • • •
Correlation Coefficient Matrix of Fresh Cephalopod Export Supply Equation • • •
Correlation Coefficient Matrix of Fresh Cephalopod Export Demand Equation • • •
v
. . .
page
39
39
42
46
49
53
56
58
60
62
64
68
69
70
71

page
E Data Series For Salted Cephalopod export From Thailand, 1975-1983. · · · · · · · · 72
F Data Series For Fresh Cephalopod export From Thailand,1975-1983 • · · · · · · · 73
G Data Series For Japanese Real National Product, Consumer Price Index and Exchange Rate • . . . · · · · 74
H Plot of Salted Cephalopod Export Supply: Actual and Predicted. · · · · · · · · 75
I Plot of Salted Cephalopod Export Demand: Actual and Predicted. · · · · · · · · 76
J Plot of Fresh Cephalopod Export Supply: Actual and Predicted. · · · · · · · · 77
K Plot of Fresh Cephalopod Export Demand: Actual and Predicted. · · · · · · · · 78
vi

TABLE
1.1
1.2
1.3
1.4
1.5
1.6
1.7
1.8
1.9
4.1
4.2
4.3
4.4
LIST OF TABLES
World Catch of Cephalopod by Species, 1970-1982 • • •
World Catch of Cephalopod by Major Landing Countries, 1970-1982
Export of Fresh and Frozen Cephalopod in Thousand Tons Product Weight, 1970-1980. •
Import of Fresh and Frozen Cephalopod in Thousand Tons Product Weight by Main importing Countries, 1969-1980 • • • • •
Utilization of Cephalopod Products, 1970-1980 • • • •
Export of Cephalopod Products, Thailand, 1970-1983. • • • • •
. . . . . . . . .
Major Markets of Thailand's Cephalopod Exports, 1970-1983 • • • • • • • • • •
Fishery Products Balance of Trade Mayment. •
Balance of Payment • • • • • • • • •
Estimated Export Supply Equation for Salted Cephalopod. • • • • • • •
Estimated Export Demand Equation for salted Cephalopod. • • • • • • • • •
Estimated Export Supply Equation for Fresh Cephalopod • • • • • •
Estimated Export Demand Equation for Fresh Cephalopod • • • • • • • • • •
vii
PAGE
3
5
7
8
10
13
15
16
17
51
52
55
55

An a b s t r a c t o f the the s i s p r e s e n t e d to the S e n a t e o f Universiti Pertanian Malaysia i n partial fulfilment of the requirements for the Degree of Master of Science
AN ECONOMIC ANALYSIS OF THAILAND'S CEPHALOPOD EXPORT MARKET
by
Ratana Sungsitthisawad
June, 1986
Supervisor Dr . Roslan A. Ghaffar
Co-supervisor Mr . Tai Shzee Yew
Faculty Economics and Management
This study attempts to provide information and evaluation of
factors affecting the Thai export market of cephalopod to Japan.
This was accomplished by estimating simultaneous export demand and
supply equations using quarterly data from 1975 through 1983. The
commodities are grouped into two, i.e. cephalopod salted in brine
dried and cephalopod fresh, chilled and frozen. Export supply is
explained by weighted average export price of cephalopod, lagged
export quantity of cephalopod, and dummy varia bles while export
demand is hypothesized to be a function of cephalopod weighted
average export price, lagged weighted average export price, price
of substitute good, Japanese's real income and dummy variables. A
log linear form was selected as the function to be estimated. The
estimation procedure is three stage least squares.
viii
The results for sa lted cephalopod indicate that supply and
demand for export is price elastic while demand is income elastic.
In the case of fresh cephalopod both export demand and supply are
price inelastic while demand is also income elastic. Cross price
elasticities of demand a s co mpens ated to substitution products
(shrimps, pra wns and lobsters) are found to be highly inelastic.
The results also indicate that Japanese's real inco me has the
strongest effect on both salted and f resh cephalopod demand. The
seasonal effect is found to be insignificant.
ix

Abstrak t esis y ang dikemukakan kepada Senat Universiti Pertanian Malaysia sebagai memenuhi seba hagian daripa d a syarat-syarat untuk memdapatkan ijazah Master Sains.
AN ECONOMIC ANALYSIS OF THAILAND CEPHALOPOD EXPORT MARKET
oleh
Ratana Sungsitthisawad
Jun, 1986
Penyelia Roslan A . Ghaffar, PhD.
Penyelia Bersama Tai Shzee Yew
Fakulti Ekonomi dan Pengurusan
Kajian ini bertujuan untuk memberi maklumat dan menilai
faktor-faktor yang mempengaruhi pasaran eksport selfalopoda ke
Jepun. Ini didapati dengan anggaran serentak persamaan eksport
bagi permintaan dan penawaran dengan menggunakan data suku tahun
daripada 1975 hingga 1983. Komoditi-komoditi di bahagi kepada dua
iaitu selfalopoda kering serta masin dan selfalopoda segar, sejuk
dan beku. Eksport penawaran diterangkan oleh harga purata eksport
selfalopoda, kuantiti eksport selfalopoda suku tahunan lepas dan
pembolehubah patung manakala eksport permintaan dianggap berfungsi
kepada harga purata eksport selfalopoda harga purata eksport suku
tahunan lepas, harga barang pengganti benar negara Jepun dan
pembolehubah patung. Fungsi ber bentuk logaritma liniar digunakan
dan anggaran dibuat dengan menggunakan kaedah kuasa dua terkecil
tiga peringkat (3SLS).
x

Keputusan bagi selfalopoda masin menunjukkan bahawa penawaran
dan permintaan untuk ekspot adalah anjal harga. Selfalopoda segar
adalah tidak anjal harga untuk kedua-dua permintaan dan penawaran
eksport. Walaubagaimanapun, keanjalan pendapatan bagi permintaan
terhadap selfalopoda segar adalah tidak anjal. Keanjalan harga
bagi permintaan terhadap keluaran-keluaran gantian (udang putih,
udang merah dan udang baring) adalah sangat tidak anjal. Keputusan
juga menunjukkan bahawa pendapatan benar negara Jepun mempunyai
kesan yang kuat terhadap kedua-dua permintaan terhadap selfalopoda
masin dan segar, dan musim yang wakilkan oleh pembolehubah patung
tidak memberi apa-apa kesan terhadap kuantiti eksport.
xi
CIIAP'tER I
IRnODUCTIOK
WORLD CEPHALOPOD SUPPLIES, RESOURCE AND TRENDS
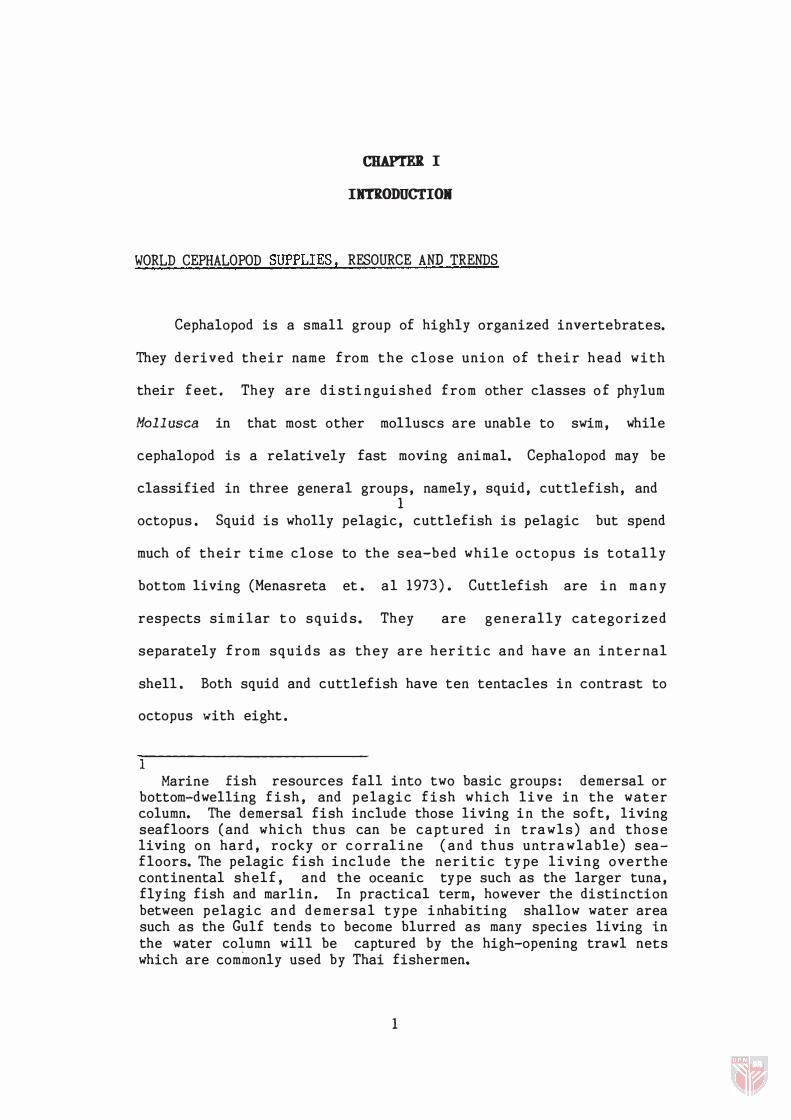
Cephalopod is a small group of highly organized invertebrates.
They derived their name from t he close union of their head with
their feet. They are disti nguished from other classes of phylum
Mollusca in that most other molluscs are unable to swim, while
cephalopod is a relatively fast moving animal. Cephalopod may be
classified in three general groups, namely, squid, cuttlefish, and 1
octopus . Squid is wholly pelagic, cuttlefish is pelagic but spend
much of their t ime close to the sea-bed while octopus is totally
bottom living (Menasreta et . al 1973). Cuttlefish are in m a n y
respects sim ilar t o squids. They are generally categorized
separately from squids as they are heritic and have an internal
shell . Both squid and cuttlefish have ten tentacles in contrast to
octopus with eight .
1 Marine fish resources fall into two basic groups: demersal or
bottom-dwelling fish, and pelagic fish which live in the water column. The demersal fish include those living in the soft, living seafloors (and which thus can be capt ured in trawls) and those living on hard, rocky or corraline (and thus untrawlable) seafloors. The pelagic fish include the neritic type living overthe continental shelf, and the oceanic type such as the larger tuna, flying fish and marlin. In practical term, however the distinction between pelagic and demersal type inhabiting shallow water area such as the Gulf tends to become blurred as many species living in the water column will be captured by the high-opening trawl nets which are commonly used by Thai fishermen.
1

2
Cephalopod fisheries increasingly play an important economic
and nutritional role. The e stablishment of national Exclusive
Economic Zone2 and rapidly increasing fuel costs provided many
countries with the impetus to exploit cephalopod resources within
their waters in order to increase export earning. Recent increases
in world-wide demand for ce phalopod produc ts has stimulated
exploitation to procure this animal protein for local consumption.
Another factor is that demersal fish are fully exploited in several
major areas e.g. Gulf of Thai land and Strait of Malacca. Also
some pelagic species such as Chub Mackerel were over exploited in
many areas in South Chi na Sea. These factors have par t l y
contributed t o the increase landing of world cephalopod over the
last decade.
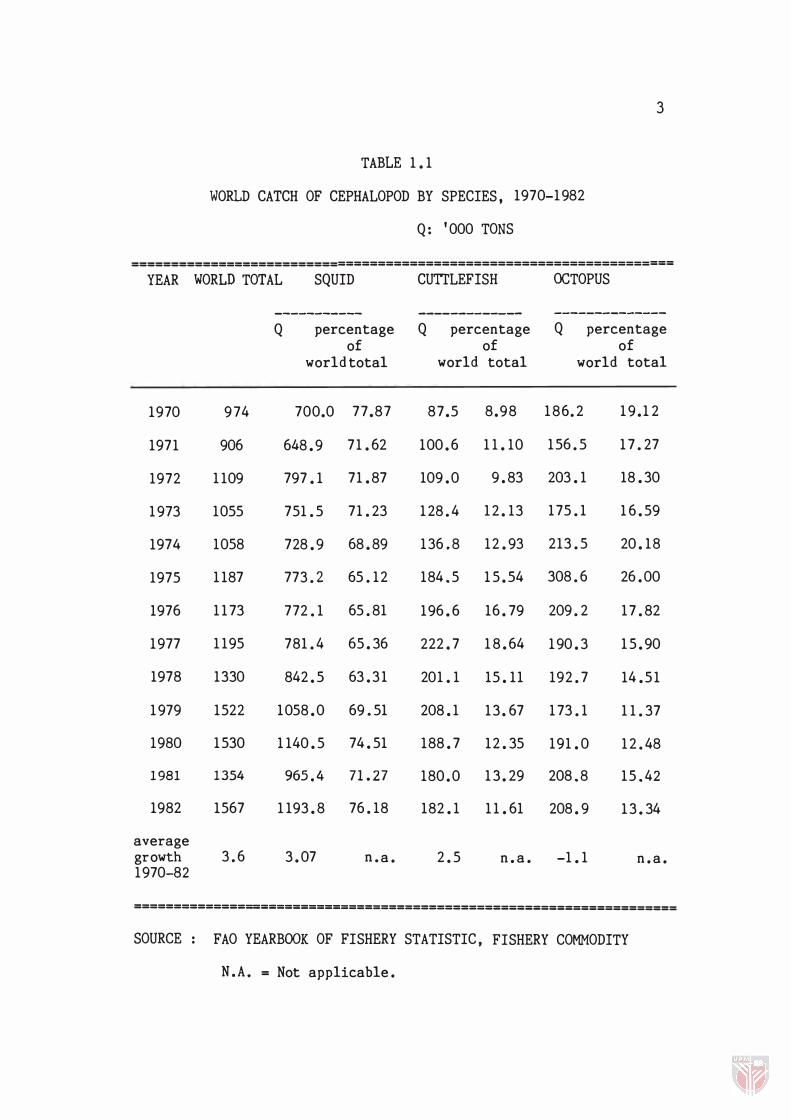
Table 1 . 1 presents data on the world catch of cephalopod
during 1 970-1 982. The world catch of cephalopod has i ncrea sed
during the last decade and in 1982 it amounted to over 1 .5 million
tons live weight, compared to about 1 million tons in 1 970. Thi s
presents an increase o f 65. 29 percent. I t should be noted,
however, that the increasing trend is not continuous. The world
catch of cephalopod gradually increased from 1970 to 1980. However
in 198 1 the output drop ped slightly before increasing again i n
1982 . Squid is the main product landed and the proportion of squid
2 The Exclusive Economic Zone is a zone extending two hundred miles
(about 320 km.) from the coast l ine. A number of coastal nations have made claim on the sovereign rights to explore and exploit the living r esources of the sea (fi sh). Among all the Thailand's neighbouring countries India was the first to clai m for these rights in 1 976, follo wed by Burma in 197 7 , and Indonesia and Malaysia in 1980. Thailand placed her claims in 1981.
3
TABLE 1 . 1
WORLD CATCH OF CEPHALOPOD BY SPECIES , 1970-1982
Q: '000 TONS
====================================================================
YEAR WORLD TOTAL SQUID CUTILEFISH OCTOPUS
----------- ------------- --------------Q percentage Q percentage Q percentage
of of of world total world total world total
1970 9 74 700.0 77 .87 87.5 8 .98 1 86.2 1 9 . 1 2
1971 906 648 . 9 71 . 62 100 . 6 1 1 . 10 156 . 5 1 7 . 27
1972 1 109 797 . 1 71 . 87 109 . 0 9 . 83 203 . 1 18 . 30
1973 1055 751 . 5 71 . 23 128 . 4 12 . 13 175 . 1 1 6 . 59
1974 1058 728 . 9 68 . 89 136.8 12 . 93 213 . 5 20 . 18
1975 1 187 773 . 2 65 . 12 184.5 1 5 . 54 308 . 6 26 . 00
1976 1 1 73 772 . 1 65 . 81 196 . 6 16 . 79 209 . 2 17 . 82
1977 1 195 781 . 4 65 . 36 222 . 7 1 8 . 64 190 . 3 1 5 . 90
1978 1330 842 . 5 63 . 3 1 201 . 1 15 . 11 192 . 7 14 . 5 1
1979 1522 1058 . 0 69.51 208 . 1 13 . 67 1 73 . 1 1 1 . 37
1980 1530 1 140 . 5 74 . 51 188 . 7 12 . 35 191 . 0 12 . 48
1981 1354 965.4 71.27 180 . 0 1 3 . 29 208.8 15.42
1982 1567 1 193 . 8 76 . 18 182 . 1 1 1 . 61 208 . 9 1 3 . 34
average growth 3 . 6 3 . 07 n . a . 2 . 5 n . a . -1 . 1 n . a . 1970-82
====================================================================
SOURCE . FAO YEARBOOK OF FISHERY STATISTIC , FISHERY COMMODITY .
N . A. = Not applicable .
4
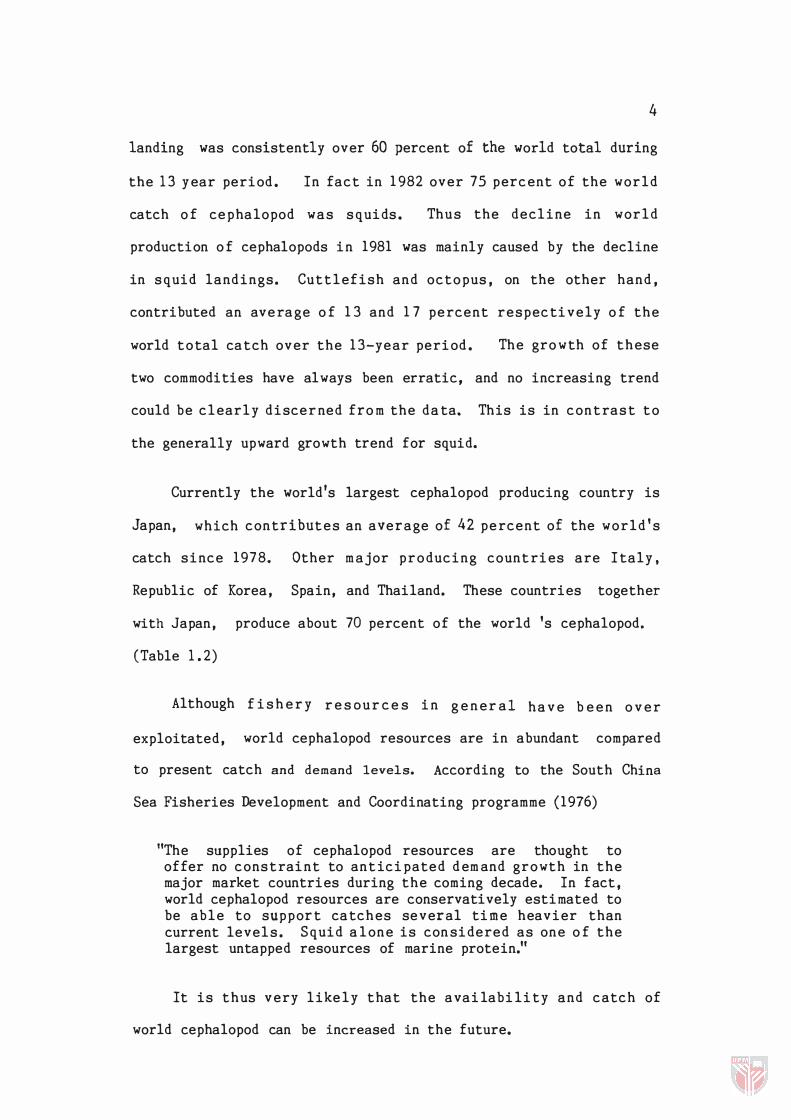
landing was consistently over 60 percent of the world total during
the 13 year period. In fact in 1982 over 75 percent of the world
catch of cephalopod was squids. Thus the decline in world
production of cephalopods in 1981 was mainly caused by the decline
in squid landings. Cuttlefish and octopus, on the other hand,
contributed an average of 13 and 17 percent respectively of the
world total catch over the 13-year period. The growth of these
two commodities have always been erratic, and no increasing trend
could be clearly discer ned from the data. This is in contrast to
the generally upward growth trend for squid.
Currently the world's largest cephalopod producing country is
Japan, which contributes an aver age of 42 percent of the world's
catch since 1978. Other m ajor producing countries are Italy,
Republic of Korea, Spain, and Thailand. These countries together
with Japan, produce about 70 percent of the world 's cephalopod.
(Table 1.2)
Al though f ish e r y r e s 0 u r c e s in g e n er a 1 h a v e b ee n ove r
exploitated, world cephalopod resources are in abundant compared
to present catch and demand levels. According to the South China
Sea Fisheries Development and Coordinating programme (1976)
"The supplies of cephalopod resources are thought to offer no constraint to anticip ated dem and growth in the major market countries during the coming decade. In fact, world cephalopod resources are conservatively estimated to be able to support catches several time heavier than current levels. Squid alone is con sidered as one of the largest untapped resources of marine protein."
It is thus very likely that the availability and c atch of
world cephalopod can be increased in the future.
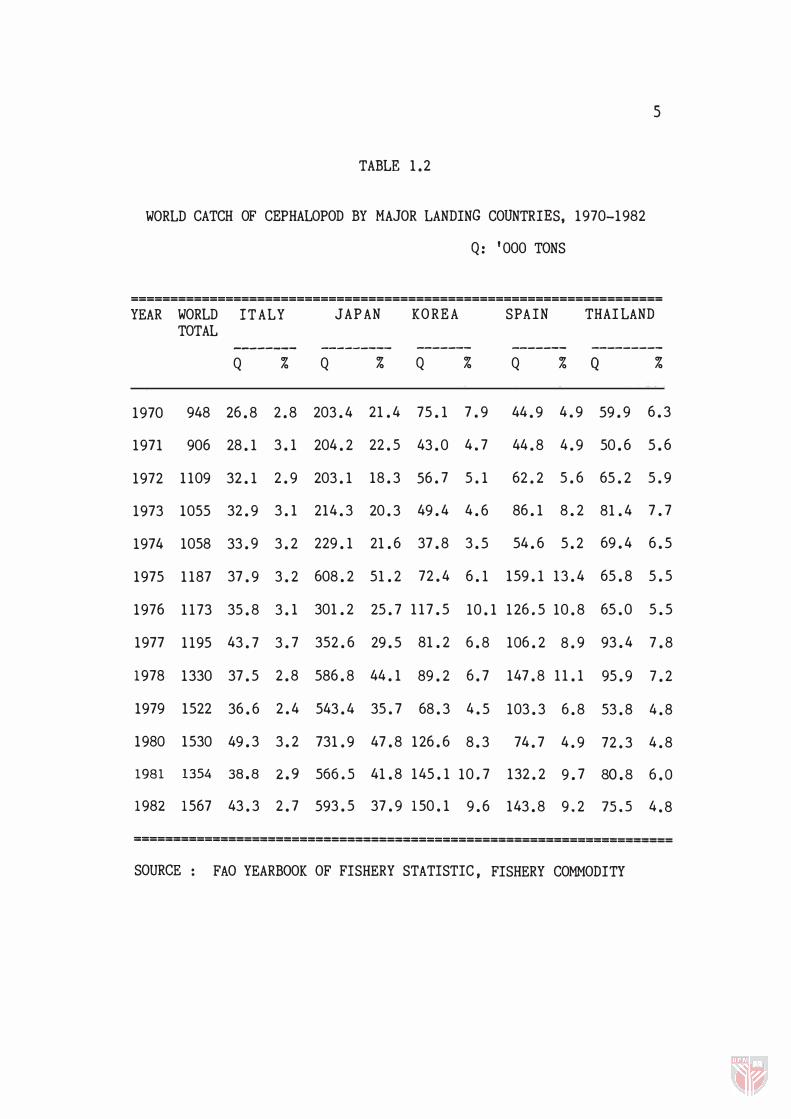
TABLE 1.2
WORLD CATCH OF CEPHALOPOD BY MAJOR LANDING COUNTRIES, 1970-1982
Q: '000 TONS
5
===================================================================
YEAR WORLD IT ALY JAPAN KO RE A SPAIN THAI LAND TOTAL
-------- --------- ------- ------- ---------
Q % Q % Q % Q % Q %
1970 948 26.8 2.8 203.4 21.4 75.1 7.9 44.9 4.9 59.9 6.3
1971 906 28.1 3.1 204.2 22.5 43.0 4.7 44.8 4.9 50.6 5.6
1972 1109 32.1 2.9 203.1 18.3 56.7 5.1 62.2 5.6 65.2 5.9
1973 1055 32.9 3.1 214.3 20.3 49.4 4.6 86.1 8.2 81.4 7.7
1974 1058 33.9 3.2 229.1 21.6 37.8 3.5 54.6 5.2 69.4 6.5
1975 1187 37.9 3.2 608.2 51.2 72.4 6.1 159.1 13.4 65.8 5.5
1976 1173 35.8 3.1 301.2 25.7 117.5 10.1 126.5 10.8 65.0 5.5
1977 1195 43.7 3.7 352.6 29.5 81.2 6.8 106.2 8.9 93.4 7.8
1978 1330 37.5 2.8 586.8 44.1 89.2 6.7 147.8 11.1 95.9 7.2
1979 1522 36.6 2.4 543.4 35.7 68.3 4.5 103.3 6.8 53.8 4.8
1980 1530 49.3 3.2 731.9 47.8 126.6 8.3 74.7 4.9 72.3 4.8
1981 1354 38.8 2.9 566.5 41.8 145.1 10.7 132.2 9.7 BO.B 6.0
1982 1567 43.3 2.7 593.5 37.9 150.1 9.6 143.8 9.2 75.5 4.8
====================================================================
SOURCE : FAO YEARBOOK OF FISHERY STATISTIC , FISHERY COMMODITY

6
W ORLD TRADE PATTERNS OF FRESH AND FROZEN CEPHALOPOD PRODUCT
World trade in fresh and frozen cephalopod has increased very
rapidly over the last decade. Thi s is evident in Ta ble 1.3 where
the total increased from 64,000 tons in 1970 to over 250,000 tons
in 1976 and 360,000 to ns i n 1979. Thi s trade increa se was due
mainly to a large increase in demand from Japan.
Table 1.3 p resents the i m po rt quantity o f fresh and fro zen
cephalopod product by main co untries. Ja pan's i mpo rts o f thi s
product increased sharply from 42,800 tons in 1969 to 162,900 tons
in 1976 and 218,300 tons in 1979. Imports o f Italy also grew
rapidly during 1969-1970. The strong market demand may have
stimulated exports fro m Spain, (37,000 to ns in 1970 to 66,000 tons
in 1979), Thailand (3,000 tons in 1970 to 41,000 tons in 1980) and
Korea (6,000 tons in 1970 to 15,000 tons in 1980) (Table 1.4).
WORLD CEPHALOPOD DEMAND AND CONSUMPTION PATTERNS
According to FAO e sti mates ( FAO , 1984 ), t ot a l w o r ld
requirements for cepha lo pod product are expected to expand to two
million to ns by 1990, an increa se o f over one thi rd o f the 1980
consumption level. Whi le such
principally fro m Ja pan (Tab le 1.3),
marked i ncrea se may ari se
the demand fo r cepha lo pod
products is likely to increase considerably in other co untries such
as Spai n , Ital y , The Republi c o f Ko rea and Thail a nd. The
consu mption of cephalopods , like that of other fishery products ,
depends largely upo n traditional co nsumers' ha bits and tastes .
For insta nce, in so me countries li ke Ja pan which ha s the m o s t
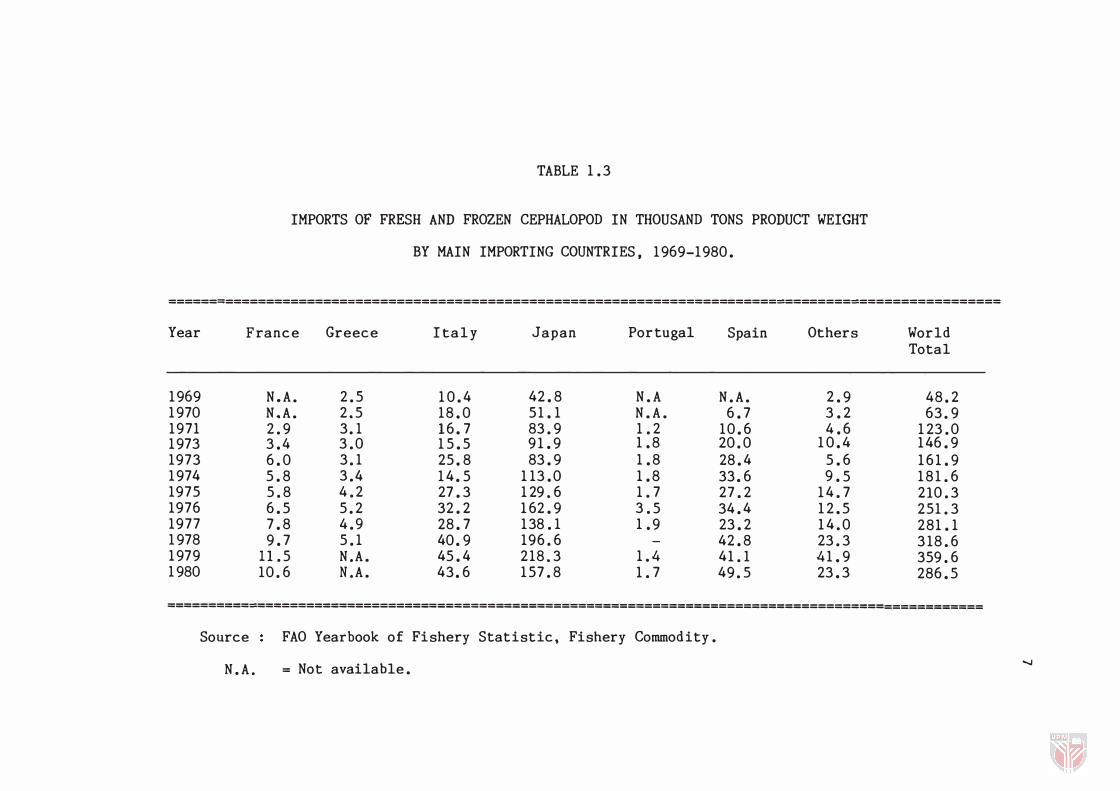
TABLE 1 . 3
IMPORTS OF FRESH AND FROZEN CEPHALOPOD IN THOUSAND TONS PRODUCT WEIGHT
BY MAIN IMPORTING COUNTRIES, 1969-1980 .
======�===================================================================�========�=================
Year France Greece Italy Japan Portugal Spain Others World Total
1969 N.A. 2 . 5 1 0 . 4 42 . 8 N.A N.A. 2 . 9 48 . 2 1970 N.A. 2.5 18 . 0 5 1 . 1 N.A. 6 . 7 3 . 2 63. 9 1971 2 . 9 3. 1 16 . 7 83 . 9 1 . 2 10 . 6 4 . 6 1 23 . 0 1973 3 . 4 3 . 0 1 5 . 5 9 1 . 9 1 . 8 20 . 0 1 0 . 4 146 . 9 1973 6 . 0 3. 1 25 . 8 83 . 9 1 . 8 28 . 4 5 . 6 1 6 1 . 9 1974 5 . 8 3 .4 1 4 . 5 1 13 . 0 1 . 8 33. 6 9 . 5 1 8 1 . 6 1975 5 . 8 4 . 2 27 . 3 1 29.6 1 . 7 27 . 2 1 4 . 7 2l0 . 3 1976 6 . 5 5 . 2 32 . 2 1 62 . 9 3 . 5 34 . 4 1 2 . 5 251 . 3 1977 7 . 8 4 . 9 28 . 7 138 . 1 1 . 9 23 . 2 1 4 . 0 281 . 1 1 978 9 . 7 5 . 1 40 . 9 196 . 6 42 . 8 23 . 3 318 . 6 1979 U . 5 N.A. 45 . 4 218.3 1 . 4 41 . 1 41 . 9 359 . 6 1 980 10 . 6 N.A. 43. 6 1 57 . 8 1 . 7 49 . 5 23 . 3 286 . 5
==========�========================================================================================
Source FAO Yearbook of Fishery Statistic, Fishery Commodity.
N.A. = Not available. -..J
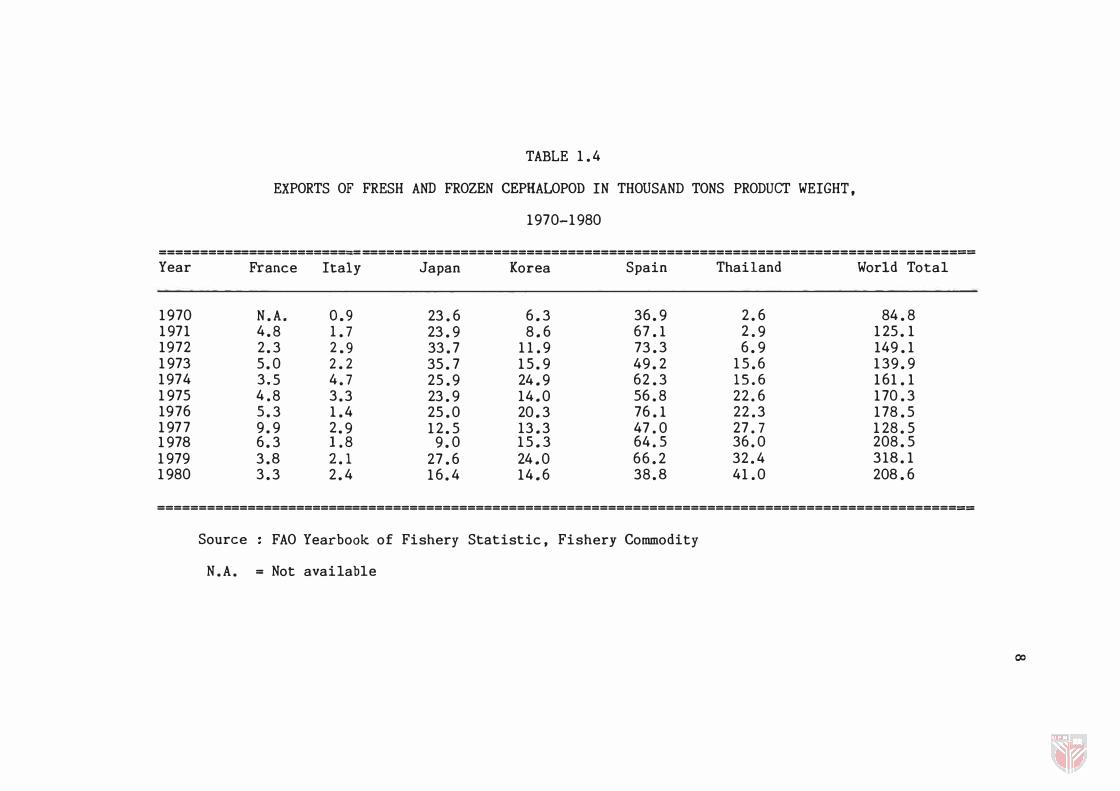
TABLE 1.4
EXPORTS OF FRESH AND FROZEN CEPHALOPOD IN THOUSAND TONS PRODUCT WEIGHT,
1970-1980
========================= ========================================================================== Year France Italy Japan Korea Spain Thailand World Total
1970 N.A. 0.9 23.6 6.3 36.9 2.6 84.8 1971 4.8 1.7 23.9 8.6 67.1 2 . 9 125.1 1972 2.3 2.9 33.7 11.9 73.3 6.9 149.1 1973 5.0 2.2 35.7 15.9 49.2 1 5 . 6 139.9 1974 3.5 4.7 25.9 24.9 62.3 15.6 161.1 1975 4 . 8 3.3 23.9 14.0 56.8 22 . 6 170.3 1976 5.3 1.4 25.0 20.3 76.1 22 . 3 178.5 197 7 9.9 2.9 12.5 13.3 47 . 0 27 . 7 128.5 197B 6.3 1 . 8 9.0 15.3 64 . 5 36 . 0 208.5 1979 3.B 2.1 27.6 24.0 66.2 32 . 4 31B.1 1980 3.3 2.4 16.4 14.6 38.B 41 . 0 20B.6
===================================================================================================
Source FAO Yearbook of Fishery Statistic, Fishery Commodity
N.A. = Not available
00

9
varied pattern of utilization, cuttlefish is regarded as a luxury
food pr oduct. Conver sly , demand for squid has tended t o decline
because it is regarded as a less desirable species by the
Japanese (South China Sea Fisheries Development and Coordinating
Programme 1 976) .
Table 1 .5 presents world uti liz ation pattern of cephalopod
products based upon data from 12 major count r i e s , i. e . Japan,
Spain, Republic of Korea, China, Thailand, USSR, Italy, Canada ,
Argentina, Philippines , USA, and Maxico. These countries together
account for 90 percent of the world cephalopod catch. As much as
75 percent of cephalopod was subjected to curing, fresh and frozen,
1 to 2 percent was used in canni ng , 14 percent was used i n
preparation and s o m e 4 percent w a s u s e d f o r reduction to m eal .
During the period between 1 970 and 1 980 uti liz ation of fresh and
froz en products had gradually increased. Preparation product and
quantity cured had also shown a steady increase. Production o f
canned cephalopod, however, had shown consid erable decline i.e .
from 3.73 percent ( o f 46 , 000 tons) in 1 9 7 5 to 1 .66 percent ( 25 , 000
tons) in 1 980. It is thus very likely under the present trend
that there will be no let up in the i ncrease i n world co nsum ption
of cephalopod. It can also be deduced from the present trend
that consumption of cephalopod other than in fresh and froz en forms
will not receive tremendous boost in the future.
IMPORTANCE OF CEPHALOPOD FISHERIES IN THAILAND
Fishery has been generally recogiz ed as an economically
important industry in Thailand, generating income and employment to

TABLE 1.5
UTILIZATION OF CEPHALOPOD PRODUCTS 1970-1980
Q : '000 tons live weight ============================================================================================================== = = = =
Fresh Frozen Curing Canning Preparation Reduction World Year ----------- ---------- ----------- ---------- ------------- ----------- Total
Q % Q % Q % Q % Q % Q %
1970 343 . 0 13 . 63 246 . 0 29 . 73 133 . 0 13. 81 21 . 0 2 . 60 1 93 . 0 19 . 62 39 . 0 3. 60 9 7 6 . 0 1971 392. 0 39 . 10 294. 0 29. 24 93. 0 9 . 30 1 7 . 0 1 . 73 166 . 0 16. 57 41 . 0 4 . 40 1 ,004 . 0 1 972 320 . 0 28 . 25 446 . 0 39. 81 109 . 0 9 . 68 21 . 1 1 . 85 186 . 0 16 . 57 40 . 0 3. 5 7 1,121 . 0 1973 357 . 0 33. 23 324 . 0 30.23 119 . 0 1 1 . 10 1 4 . 0 1 . 28 219 . 0 20 . 45 39 . 0 3. 6 7 1,070. 0 1974 349 . 0 32 . 59 336 . 0 31 .38 109 . 0 10 . 18 15 . 0 1 . 36 222 . 0 20 . 72 40 . 0 3. 74 1 ,070. 0 1975 522 . 0 42 . 37 335 . 0 27 . 19 127 . 0 10 . 31 46 . 0 3 . 73 161 . 0 1 3 . 07 41 . 0 3. 33 1,232 . 0 1976 503 . 0 41 . 53 345 . 0 28.49 109 . 0 9 . 00 34 . 0 2 . 8 1 1 70 . 0 1 4 . 04 50 . 0 4 . 13 1,211 . 0 1977 479 . 0 38 . 00 341. 0 27. 68 114 . 0 9 . 25 35 . 0 2 . 84 198. 0 16 . 07 65 . 0 5 . 28 1,232 . 0 1978 406 . 0 30 . 35 489 . 0 36.77 1 29 .0 9 . 70 39 . 0 2 . 18 204. 0 15 . 34 7 3 . 0 5 . 49 1 ,330 . 0 1979 518 . 0 34 . 17 567 . 0 37. 40 1 29 .0 8 . 51 24 . 0 1 . 58 224. 0 14. 78 97 . 0 6 . 40 1 ,5 1 6 . 0 1980 656 . 0 43 . 63 501 . 0 33 . 31 1 37 .0 9 . 11 25- . 0 1 . 66 224 . 0 1 3 . 76 46 . 0 3 . 06 1,504 . 0
==================================================================================================================
Source FAO Yearbook of Fishery Statistic, Fishery Commodity.
� o
1 1
the Thai people. It was estimated that the number of people
employed in the fishery sector in 1 9 8 1 w as more than 1 5 0 , 000
(Reintrirut 1983). In 1978 exports of fishery products contributed
5.2 percent of Thai foreign earnings. Fish is the most important
protein food in Thailand compared with all other kinds of meats as
indicated by the much higher per capita consumption of fish than
any other protein food (Ministry of Agriculture and Cooperative
, 1984). Thus fishery industry serves at least three main functions
in Thailand, cheap protein food, f oreign exchange earning,
employment and income for a considerable portion of the country's
population.
Throughout the history of Thailand, fisheries h a s b e e n a
subsistence industry with stationary entrapment as a dominant
method of fishing. M ajor devel opments of the country's fishing
methods only occured in the early 1 960 ' s , when technological
cooperation with The Governtment of the Republic of Germany had
succeeded in the adoption of moveable gears by the fishermen. This
has helped to increase Thailand's marine fish landing to more than
two million tons in 1977 , and consequently has made Thailand one of
the major fishing nations in the w orld (Jitsanguang 1 983). In
terms of quantity exported, it increased from less than 10,000 tons
in 1960 to over 1 7 , 000 tons in 1965 (Department of Custom 1966) and
300 , 306 tons in 1981 (Department of Custom 1982). In 1980 fishery
industry contributed appr oximately three percent to the country's
Gross National Product (Kumpa 1981).
Among fishery comm odities, cephalopod is the second most
important export earner. During the three decades ( 1 940-60) ,