united technologies 2003 annual english
DESCRIPTION
TRANSCRIPT
this is momentum
2 0 0 3 A N N U A L R E P O R T


C O N T E N T S
2 M A N A G E M E N T ’ S D I S C U S S I O N A N D A N A L Y S I S
1 6 M A N A G E M E N T ’ S R E S P O N S I B I L I T Y F O R F I N A N C I A L S T A T E M E N T S A N D C O N T R O L S
17 R E P O R T O F I N D E P E N D E N T A U D I T O R S
1 8 C O N S O L I D A T E D S T A T E M E N T O F O P E R A T I O N S
1 9 C O N S O L I D A T E D B A L A N C E S H E E T
2 0 C O N S O L I D A T E D S T A T E M E N T O F C A S H F L O W S
2 1 C O N S O L I D A T E D S T A T E M E N T O F C H A N G E S I N S H A R E O W N E R S ’ E Q U I T Y
2 2 N O T E S T O C O N S O L I D A T E D F I N A N C I A L S T A T E M E N T S
4 0 D I R E C T O R S
4 1 L E A D E R S H I P
4 2 S H A R E O W N E R I N F O R M A T I O N
2 0 0 3 A N N U A L R E P O R T

united technologies

2 0 0 3 A N N U A L R E P O R T 1
F I V E Y E A R S U M M A R Y
IN MILLIONS OF DOLLARS, EXCEPT PER SHARE AMOUNTS 2003 2002 2001 2000 1999
For the yearRevenues $ 31,034 $ 28,212 $ 27,897 $ 26,583 $ 24,127
Research and development 1,027 1,191 1,254 1,302 1,292
Income from continuing operations (1) 2,361 2,236 1,938 1,808 841
Net income 2,361 2,236 1,938 1,808 1,531
Earnings per share:
Basic:
Continuing operations 4.93 4.67 4.06 3.78 1.74
Net earnings 4.93 4.67 4.06 3.78 3.22
Net earnings adjusted for SFAS No. 142 4.51 4.18 3.51
Diluted:
Continuing operations 4.69 4.42 3.83 3.55 1.65
Net earnings 4.69 4.42 3.83 3.55 3.01
Net earnings adjusted for SFAS No. 142 4.25 3.92 3.27
Cash dividends per common share 1.14 .98 .90 .825 .76
Average number of shares of Common Stock outstanding:
Basic 473.8 472.4 470.2 470.1 465.6
Diluted 502.9 505.6 505.4 508.0 506.7
Return on average common shareowners’ equity, after tax 24.2% 24.9% 23.6% 24.4% 24.6%
Cash flow from operations 2,875 2,853 2,976 2,631 2,401
Capital expenditures 530 586 793 937 762
Acquisitions, including debt assumed 2,305 424 525 1,340 6,268
Share repurchase 401 700 599 800 822
At year endWorking capital, continuing operations $ 2,069 $ 4,050 $ 3,094 $ 1,864 $ 1,898
Total assets 34,648 29,194 27,030 25,369 24,366
Long-term debt, including current portion 4,632 4,676 4,371 3,772 3,419
Total debt 5,301 4,873 4,959 4,811 4,321
Debt to total capitalization 31% 37% 37% 39% 38%
ESOP Preferred Stock, net (2) 428 429 432 449
Shareowners’ equity 11,707 8,355 8,369 7,662 7,117
Number of employees – continuing operations 203,300 155,000 152,000 153,800 148,300
Note: During 2003, the Corporation acquired Chubb plc which is reported as a separate segment.
(1) 1999 Income from continuing operations excludes the results of UT Automotive which was sold in 1999 and reflected in discontinued operations. The 1999 amount reflectsrestructuring and related charges of $1.1 billion.
(2) During 2003, the Corporation converted all of its outstanding shares of ESOP Preferred Stock into Common Stock.
Certain reclassifications have been made to prior year amounts to conform to the current year presentation.

2 U N I T E D T E C H N O L O G I E S
M A N A G E M E N T ’ S D I S C U S S I O N A N D A N A L Y S I S
Management’s Discussion and Analysis of Financial Condition and Results of Operations
Business OverviewThe Corporation is a global provider of high technology products and services to the building systems and aerospaceindustries. Its operations are classified into five principal segments: Otis, Carrier, Chubb, Pratt & Whitney and FlightSystems. Otis, Carrier and Chubb serve customers in the com-mercial and residential property industries worldwide. Carrieralso serves commercial and transport refrigeration customers.Pratt & Whitney and the Flight Systems segment, whichincludes Hamilton Sundstrand and Sikorsky Aircraft (“Sikorsky”),primarily serve commercial and government customers in theaerospace industry and also serve customers in industrial markets. The percentage of consolidated revenues contributed in2003 and 2002 by the Corporation’s businesses is as follows:
2003 2002
Commercial and industrial 61% 57%Military aerospace 20% 20%Commercial aerospace 19% 23%
100% 100%
Revenues from outside the U.S., including U.S. export sales,in dollars and as a percentage of total segment revenues, areas follows:
IN MILLIONS OF DOLLARS 2003 2002 2001 2003 2002 2001
Europe $ 7,150 $ 5,573 $ 4,716 23% 19% 17%Asia Pacific 4,505 3,647 3,420 14% 13% 12%Other Foreign 2,602 2,581 2,785 8% 9% 10%U.S. Exports 3,329 4,053 3,947 11% 14% 14%
InternationalSegment Revenues $17,586 $15,854 $14,868 56% 55% 53%
In 2003 and 2002, approximately 57% and 58%, respectively,of the Corporation’s sales were generated from original equip-ment sales and 43% and 42%, respectively, were generatedfrom aftermarket sales. The Corporation’s segment operatingresults are discussed in the Segment Review and Note 17 ofthe Notes to Consolidated Financial Statements.
Business EnvironmentAs worldwide businesses, the Corporation’s operations areaffected by global, regional and industry economic and politicalfactors. However, the Corporation’s geographic and industrydiversity, as well as the diversity of its product sales and services,has helped limit the impact of any one industry or the economyof any single country on the consolidated operating results.Economic conditions in the commercial airline industry, globalrefrigeration industries, and commercial heating, ventilatingand air conditioning (“HVAC”) and construction markets negatively impacted the Corporation’s consolidated operatingresults in 2003 for a portion of the year. Strength in commercialand residential construction markets and a recovery in com-mercial HVAC markets and commercial aviation are expectedto contribute positively to the Corporation’s results in 2004.
The Corporation’s growth strategy contemplates acquisi-tions. The rate and extent to which appropriate acquisitionopportunities are available and to which acquired businessesare integrated and anticipated synergies and cost savings areachieved can affect the Corporation’s operations and results.
As part of its globalization strategy, the Corporation hasinvested in businesses in certain countries, includingArgentina, Brazil, the People’s Republic of China, Russia andSouth Africa, which carry higher levels of currency, politicaland economic risk. At December 31, 2003, the Corporation’snet investment in any one of these countries was less than 3%of consolidated equity.
During 2003, the strengthening of the euro had a significantfavorable impact on the translation of foreign currency-denominated operating results into U.S. dollars. The favorableimpact of foreign currency translation contributed $.23 of dilutedearnings per share in 2003.
OTIS is the world’s largest elevator and escalator manufacturing,installation and service company. Otis designs, manufactures,sells and installs a wide range of passenger and freight elevators, escalators and moving walkways. In addition to newequipment, Otis provides modernization products and servic-es to upgrade elevators and escalators as well as maintenanceservices for the products it sells and those of other manufac-turers. It serves an international customer base, principally inthe commercial and residential property industries. In 2003,79% of its revenues were generated outside the U.S. Otis’results can be impacted by various economic factors, includingfluctuations in commercial construction, labor costs, interestrates, foreign currency exchange rates and raw material costs.
During 2003, building construction activity in Europe wasmixed but remained essentially flat, and in Asia, activity wasstrong in both China and South Korea, but remained weak inJapan. U.S. office building construction starts continued todecline and national office vacancy rates increased as marketconditions remained soft.
CARRIER is the world’s largest manufacturer and distributorof commercial and residential HVAC systems and refrigerationand equipment. Carrier provides aftermarket services andcomponents for its products and those of other manufacturersin both the HVAC and refrigeration industries. During 2003,
2 0 0 3 A N N U A L R E P O R T 3
48% of Carrier’s revenues were generated outside the U.S.and by U.S. exports. Carrier’s results can be impacted by anumber of external factors, including commercial and residen-tial construction activity, production and utilization of transportequipment, weather conditions, fuel prices, interest rates, for-eign currency exchange rates, raw material costs and industrycapacity.
During 2003, U.S. commercial construction starts continuedto decrease as did investment in replacement refrigeration,negatively impacting commercial HVAC in refrigeration equip-ment. The global transport refrigeration market improved in2003, due in part to stabilizing fuel prices and favorable trendsin interest rates. Strength in housing starts favorably impactedNorth American residential HVAC operations, while globalcommercial construction markets were weak for a portion ofthe year, and showed some improvement in the fourth quarterof 2003. Global pricing trends are expected to continue topresent challenges to the North American and internationalHVAC and commercial refrigeration markets in 2004.
CHUBB is a global provider of security and fire protectionproducts and services and was acquired by the Corporationon July 28, 2003. In the fire protection industry, Chubb providessystem integration, installation and service of portable andfixed suppression systems and fire detection systems. In theelectronic security industry, Chubb provides system integration,installation and service of intruder alarms, access control systemsand video surveillance. Chubb also provides monitoring,response and security personnel services to complement boththe fire and electronic security equipment businesses.Chubb’s operations are predominantly outside the U.S. andChubb is a leading provider of products and services in theU.K., France, Hong Kong, South Africa, Australia and Canada.For the five-month period ended December 31, 2003, 96% ofChubb’s revenues were generated outside the U.S. Chubb’sresults can be impacted by a number of external factors, suchas customer attrition, interest rates, foreign currency exchangerates, labor costs, commercial construction activity and otherglobal economic and political factors.
PRATT & WHITNEY and the FLIGHT SYSTEMS segmentscomprise the Corporation’s aerospace businesses and produceand service commercial and government aerospace anddefense products and also serve customers in the industrialmarkets. The financial performance of these segments is directlytied to the aerospace and defense industries. Traffic growth,load factors, worldwide airline profits, and general economicactivity have been reliable indicators for new aircraft and after-market orders in the aerospace industry. Spare part sales andaftermarket service trends are impacted by many factorsincluding usage, pricing, regulatory changes and retirement ofolder aircraft. Performance in the general aviation sector isclosely tied to the overall health of the economy and is positivelycorrelated to corporate profits.
Conditions in the airline industry stabilized in the secondhalf of 2003, but continue to remain at low levels in areas suchas flight schedules and employment. The number of idle aircraftcontinues to be at historically high levels. The airline industrycontinues to experience poor financial performance. Airlinesand aircraft manufacturers continue to reduce supplier basesand seek lower cost packages. These conditions have resulted in decreased aerospace volume and orders in theCorporation’s commercial aerospace businesses for a portionof 2003 but are expected to improve in 2004.
The Corporation’s total sales to the U.S. Governmentincreased in 2003 to $5.3 billion or 17% of total sales, comparedwith $4.6 billion or 16% of total sales in 2002 and $3.8 billionor 14% of total sales in 2001. The defense portion of theCorporation’s aerospace businesses is affected by changes inmarket demand and the global political environment. TheCorporation’s participation in long-term production and devel-opment programs for the U.S. Government has contributedpositively to the Corporation’s results in 2003 and is expectedto continue to benefit results in 2004.
PRATT & WHITNEY is among the world’s leading suppliers ofcommercial, general aviation and military aircraft engines. Pratt& Whitney provides spare parts and aftermarket and fleet management services for the engines it produces, along withpower generation and space propulsion systems. These products and services must adhere to strict regulatory andmarket-driven safety and performance standards which cancreate uncertainty regarding engine program profitability. Theaftermarket business is impacted by competition and techno-logical improvements to newer generation engines thatincrease reliability. Pratt & Whitney continues to enhance itsprograms through performance improvement measures andproduct base expansion. Manufacturing and aftermarket operations are benefiting from repositioning actions aimed atimproving efficiency and from selective acquisitions and ventures.
Product base expansion includes Pratt & Whitney’s devel-opment of large commercial engines for the narrow-bodiedand wide-bodied aircraft markets and small commercialengines that have already been selected for new light jet aircraftprograms. Investments in new commercial engines involve significant financial risk due to the size of the investmentrequired and the technical issues surrounding new enginedevelopment. Pratt & Whitney is also positioned to deliverengines and aftermarket products and services for next gener-ation fighter aircraft to both the U.S. and foreign governments.Pratt & Whitney’s engines have been selected to power the AirForce’s F/A-22 and F-35 Joint Strike Fighter aircraft. The F119engine that powers the F/A-22 has been approved for opera-tional use by the U.S. Air Force. The F-35 Joint Strike Fighterprogram is intended to lead to the development of a single air-craft, with configurations for conventional and short takeoffand landing, for the U.S. Navy, Air Force and Marine Corps, theUnited Kingdom Royal Navy and other international customers.
4 U N I T E D T E C H N O L O G I E S
FLIGHT SYSTEMS SEGMENT provides global products andservices through Hamilton Sundstrand and Sikorsky. HamiltonSundstrand provides aerospace and industrial products andaftermarket services for diversified industries worldwide.Aerospace products include aircraft power generation man-agement and distribution systems, and environmental, flightand fuel control systems. Industrial products include air compressors, metering devices, fluid handling equipment andgear drives. Hamilton Sundstrand is responding to industryconditions by focusing on development of new product andservice offerings, acquisitions and actions aimed at improvingefficiency and aftermarket growth opportunities.
Sikorsky is one of the world’s largest manufacturers of military and commercial helicopters and provides aftermarkethelicopter and aircraft products and services. It has respondedto continued overcapacity among helicopter manufacturers byimproving its cost structure, increasing the capabilities of itsexisting products, developing new products and expanding itsaftermarket business. In its government business, Sikorsky willcontinue to supply Black Hawk helicopters and their deriva-tives to the U.S. and foreign governments under contractsextending into 2007. A Sikorsky-Boeing joint venture is undercontract with the U.S. Army to develop the RAH-66Comanche, nine of which are contracted for delivery in 2005-2006. Sikorsky is also leading an international team in developing the S-92, a large cabin derivative of the BlackHawk, for the commercial markets. Type certification of the S-92was obtained from the U.S. Federal Aviation Administration inDecember 2002. Production of the S-92 began in 2003 anddeliveries are scheduled to begin in 2004. Variants of the S-92for military markets are currently in development.
Critical Accounting Estimates Preparation of the Corporation’s financial statements requiresmanagement to make estimates and assumptions that affectthe reported amounts of assets, liabilities, revenues andexpenses. Note 1 to the Consolidated Financial Statementsdescribes the significant accounting policies used in preparationof the Consolidated Financial Statements. Managementbelieves the most complex and sensitive judgments, becauseof their significance to the Consolidated Financial Statements,result primarily from the need to make estimates about theeffects of matters that are inherently uncertain. The most sig-nificant areas involving management judgments and estimatesare described below. Actual results in these areas could differfrom management’s estimates.
LONG-TERM CONTRACT ACCOUNTING. The Corporationutilizes percentage of completion accounting on certain of itslong-term contracts. The percentage of completion methodrequires estimates of future revenues and costs over the fullterm of product delivery.
Losses, if any, on long-term contracts are provided forwhen anticipated. Loss provisions are based upon excessinventoriable manufacturing, engineering, estimated product
warranty and product performance guarantee costs in excessof the revenue from the products contemplated under the contractual arrangement. Revenue used in determining con-tract loss provisions is based upon an estimate of the quantity,pricing and timing of future product deliveries. The extent ofprogress toward completion on the Corporation’s long-termcommercial aerospace and helicopter contracts is measuredusing units of delivery. In addition, the Corporation uses thecost-to-cost method for development contracts in the aero-space businesses and for elevator and escalator installation andmodernization contracts. For long-term aftermarket contractsrevenue is recognized over the contract period in proportion tothe costs expected to be incurred in performing services underthe contract. Contract accounting also requires estimates offuture costs over the performance period of the contract as wellas an estimate of award fees and other sources of revenue.
Contract costs are incurred over a period of several years,and the estimation of these costs requires management’sjudgment. The long-term nature of these contracts, the com-plexity of the products, and the strict safety and performancestandards under which they are regulated can affect theCorporation’s ability to estimate costs precisely. As a result, theCorporation reviews and updates its cost estimates on signifi-cant contracts on a quarterly basis, and no less than annuallyfor all others, or when circumstances change and warrant amodification to a previous estimate. Adjustments to contractloss provisions are recorded in earnings upon identification.
INCOME TAXES. The future tax benefit arising from netdeductible temporary differences and tax carryforwards is$2.7 billion at December 31, 2003 and $3.1 billion atDecember 31, 2002. Management believes that theCorporation’s earnings during the periods when the temporarydifferences become deductible will be sufficient to realize therelated future income tax benefits. For those jurisdictionswhere the expiration date of tax carryforwards or the projectedoperating results indicate that realization is not likely, a valua-tion allowance is provided.
In assessing the need for a valuation allowance, theCorporation estimates future taxable income, considering thefeasibility of ongoing tax planning strategies and the realizabilityof tax loss carryforwards. Valuation allowances related todeferred tax assets can be impacted by changes to tax laws,changes to statutory tax rates and future taxable income levels.In the event the Corporation were to determine that it wouldnot be able to realize all or a portion of its deferred tax assets inthe future, the Corporation would reduce such amounts througha charge to income in the period in which that determination ismade. Conversely, if the Corporation were to determine that itwould be able to realize its deferred tax assets in the future inexcess of the net carrying amounts, the Corporation woulddecrease the recorded valuation allowance through anincrease to income in the period in which that determination ismade. Subsequently recognized tax benefits associated withvaluation allowances recorded in a business combination will

2 0 0 3 A N N U A L R E P O R T 5
be recorded as an adjustment to goodwill. See Note 10 to theConsolidated Financial Statements for further discussion.
GOODWILL AND INTANGIBLE ASSETS. The Corporationcompleted acquisitions in 2003 of $2.3 billion, includingapproximately $1.2 billion of debt assumed. In July 2003, theCorporation completed its acquisition of Chubb plc, a globalprovider of security and fire protection equipment and servicesfor approximately $2.0 billion, including debt assumed. Theassets and liabilities of acquired businesses are recordedunder the purchase method of accounting at their estimatedfair values at the dates of acquisition. Goodwill representscosts in excess of fair values assigned to the underlying netassets of acquired businesses. The Corporation has recordedgoodwill of $9.3 billion at December 31, 2003 and $7.0 billionat December 31, 2002. See Note 2 to the ConsolidatedFinancial Statements for further discussion.
Goodwill and intangible assets deemed to have indefinitelives are not amortized, but are subject to annual impairmenttesting. The identification and measurement of goodwill impair-ment involves the estimation of the fair value of reporting units.The estimates of fair value of reporting units are based on thebest information available as of the date of the assessment,which primarily incorporate management assumptions aboutexpected future cash flows and contemplate other valuationtechniques. Future cash flows can be affected by changes inindustry or market conditions or the rate and extent to whichanticipated synergies or cost savings are realized with newlyacquired entities. Although no goodwill impairment has beenrecorded to date, there can be no assurances that futuregoodwill impairments will not occur. See Note 7 to theConsolidated Financial Statements for further discussion.
PRODUCT PERFORMANCE. The Corporation extends per-formance and operating cost guarantees beyond its normalservice and warranty policies for extended periods on some of itsproducts, particularly commercial aircraft engines. Liability undersuch guarantees is based upon future product performanceand durability. In addition, the Corporation incurs discretionarycosts to service its products in connection with product per-formance issues. The Corporation accrues for such costs thatare probable and can be reasonably estimated. The estimationof costs associated with these product performance and oper-ating cost guarantees requires estimates over the full terms ofthe agreements, and requires management to consider factorssuch as the extent of future maintenance requirements and thefuture cost of material and labor to perform the services. Thesecost estimates are largely based upon historical experience.See Note 15 to the Consolidated Financial Statements for further discussion.
CONTRACTING WITH THE U.S. GOVERNM ENT. TheCorporation’s contracts with the U.S. Government are subjectto government investigations and audits. Like many defensecontractors, the Corporation has received audit reports which
recommend that certain contract prices should be reduced tocomply with various government regulations. Some of theseaudit reports involve substantial amounts. The Corporation hasmade voluntary refunds in those cases it believes appropriate.In addition, the Corporation accrues for liabilities associatedwith those government contracting matters that are probableand can be reasonably estimated. The inherent uncertaintyrelated to the outcome of these matters can result in amountsmaterially different from any provisions made with respect totheir resolution. See Note 16 to the Consolidated FinancialStatements for further discussion. The Corporation recordedsales to the U.S. Government of $5.3 billion in 2003 and $4.6billion in 2002.
EMPLOYEE BENEFIT PLANS. The Corporation and its sub-sidiaries sponsor domestic and foreign defined benefit pensionand other postretirement plans. Major assumptions used in theaccounting for these employee benefit plans include the dis-count rate, expected return on plan assets, rate of increase inemployee compensation levels and health care cost increaseprojections. Assumptions are determined based on Companydata and appropriate market indicators, and are evaluatedeach year as of the plans’ measurement date. A change in anyof these assumptions would have an effect on net periodicpension and postretirement benefit costs reported in theConsolidated Financial Statements.
Market interest rates declined in 2003 and as a result, thediscount rate used to measure pension liabilities and costswas lowered to 6.25%. Pension expense in 2004 is expectedto be negatively impacted by these changes and the amortizationof prior investment losses. See Note 11 to the ConsolidatedFinancial Statements for further discussion.
Results of Operations
IN MILLIONS OF DOLLARS 2003 2002 2001
Sales $30,723 $ 27,980 $27,486Financing revenues andother income, net 311 232 411
Revenues $31,034 $28,212 $27,897
Consolidated revenues increased 10% in 2003 and 1% in2002. Foreign currency translation contributed approximately40% of the 2003 revenue increase and had a minimal favor-able impact in 2002.
Sales growth in 2003 reflects revenue contributed from theacquisition of Chubb and growth at Otis and Carrier, and highermilitary revenues at Pratt & Whitney and Hamilton Sundstrand.These increases were partially offset by lower commercialaerospace volume and fewer helicopter shipments at Sikorsky.Sales in 2002 reflect growth at Otis and Sikorsky, largely off-set by lower volume at Carrier and Pratt & Whitney.
Financing revenues and other income, net, increased $79million in 2003 and decreased $179 million in 2002, respec-tively. The 2003 increase reflects a non-cash gain at Otis
6 U N I T E D T E C H N O L O G I E S
associated with an exchange of equity interests in China. The2002 decrease reflects interest income associated with thesettlement of prior year tax audits recorded in 2001.
IN MILLIONS OF DOLLARS 2003 2002 2001
Cost of sales $22,508 $20,161 $20,087Gross margin percent 26.7% 27.9% 26.9%
Interest expense decreased 2% in 2003 and 11% in 2002.The decline in interest expense in 2002 is due primarily tolower short-term borrowings partially offset by the issuance of$500 million of 6.10% notes in April 2002.
2003 2002 2001
Average interest rate during the year:Short-term borrowings 5.2% 9.4% 7.0%Total debt 6.5% 6.9% 7.3%
The Corporation’s research and development spendingincludes both company and customer funded programs. Totalresearch and development spending for the Corporationincreased $227 million (10%) in 2003 to $2.6 billion and$280 million (13%) in 2002 to $2.4 billion.
Company funded research and development decreased$164 million (14%) in 2003 and $63 million (5%) in 2002.The 2003 decrease is primarily due to lower spending in thecommercial aerospace businesses. The 2003 decrease alsoreflects a technology funding agreement at Pratt & WhitneyCanada and lower spending on Sikorsky’s S-92 programwhich received U.S. Federal Aviation Administration type certi-fication during the fourth quarter of 2002. The 2002 decreasereflects the variable nature of engineering development programschedules at Pratt & Whitney and cost reduction actions atCarrier partially offset by increased spending on Sikorsky’sS/H-92 program. Company funded research and developmentspending is subject to the variable nature of program develop-ment schedules. Company funded research and developmentspending in 2004 is expected to increase approximately $100million over 2003 levels.
In addition to company funded programs, customer fundedresearch and development was $1,580 million in 2003,$1,189 million in 2002, and $846 million in 2001. The 2003and 2002 increases of $391 million and $343 million, respec-tively, are primarily attributable to the Corporation’s Joint StrikeFighter program.
IN MILLIONS OF DOLLARS 2003 2002 2001
Selling, general and administrative $ 3,654 $ 3,203 $ 3,323Percent of sales 11.9% 11.4% 12.1%
Selling, general and administrative expenses as a percent-age of sales increased five-tenths of a percent in 2003 anddecreased seven-tenths of a percent in 2002. The 2003increase was due primarily to the July 2003 acquisition ofChubb partially offset by $50 million lower restructuringcharges in 2003. The 2002 decrease reflects the benefits ofcost reduction actions, primarily at Carrier, and $43 millionlower restructuring charges in 2002, when compared to 2001.
IN MILLIONS OF DOLLARS 2003 2002 2001
Interest expense $375 $381 $426
The average interest rate during 2003 on short-term borrowings was less than that of total debt due to higher com-mercial paper balances partially offset by higher short-termborrowing rates in certain foreign operations. The weighted-average interest rate applicable to debt outstanding atDecember 31, 2003 was 3.2% for short-term borrowings and6.1% for total debt.
2003 2002 2001
Effective income tax rate 27.1% 27.1% 26.9%
The effective tax rate for 2003, 2002 and 2001 reflects thetax benefit associated with the lower tax rate on internationalearnings which the Corporation intends to permanently reinvestoutside the United States. The 2003 rate also benefits fromthe tax loss associated with a non-core business partially offsetby a reduced benefit from international activities attributable torecognition of foreign taxes as deductions instead of creditsfor U.S. tax purposes.
The 2002 rate reflects the benefit of increased use of certaintax planning strategies, including utilization of a capital losscarryback, and reflects the increase in pre-tax income from discontinuing amortization of non-deductible goodwill in accor-dance with SFAS No. 142. The 2001 effective tax rate reflectsthe impact of the favorable settlement of certain prior year taxaudits. Excluding this settlement, the effective rate was 30.0%.The effective income tax rate for 2001, adjusted for the impactof SFAS No. 142 and excluding the favorable settlement ofprior year tax audits in 2001, was 28.2%. The Corporation has
Gross margin decreased 1.2 percentage points in 2003 to26.7% from 27.9% in 2002 primarily due to lower commercialaerospace spares volume and the absence of the approximate$100 million gain on the environmental insurance settlementrecorded in 2002. These decreases were partially offset bymargin improvement at Otis and $111 million lower restruc-turing charges in 2003. Gross margin increased to 27.9% in2002 from 26.9% in 2001 due primarily to $230 million ofgoodwill amortization in 2001 which was discontinued in 2002and the approximate $100 million gain on the environmentalinsurance settlement in 2002. These items contributed 1.2percentage points to gross margin in 2002.
IN MILLIONS OF DOLLARS 2003 2002 2001
Research and development – company funded $1,027 $1,191 $1,254
Percent of sales 3.3% 4.3% 4.6%

2 0 0 3 A N N U A L R E P O R T 7
generally continued to lower its effective tax rate by implementingtax reduction strategies. The Corporation expects its effectiveincome tax rate in 2004 to approximate 28%, before theimpact of the anticipated tax settlement described below.
In the normal course of business, the Corporation and itssubsidiaries are examined by various tax authorities, includingthe Internal Revenue Service (“IRS”). The IRS is reviewing theCorporation’s claims for prior periods’ benefits as part of itsroutine examinations of the Corporation’s income tax returns.In 2004, the Corporation expects to resolve its claims and tosettle other disputed issues related to prior open tax yearsfrom 1986 to 1993. Although the outcome of these matterscannot presently be determined, management believes that itmay reach favorable settlement of these claims upon completionof the reviews by the IRS and U.S. Congress Joint Committeeon Taxation. Any additional impact on the Corporation’s liabilityfor income taxes cannot presently be determined, but theCorporation believes adequate provision has been made forpotential adjustments.
For additional discussion of income taxes, see “CriticalAccounting Estimates – Income Taxes” and Note 10 to theConsolidated Financial Statements.
IN MILLIONS OF DOLLARS 2003 2002 2001
Net income $2,361 $2,236 $1,938Diluted earnings per share $ 4.69 $ 4.42 $ 3.83
For additional discussion, see Notes 1, 2 and 7 to theConsolidated Financial Statements.
Business AcquisitionsDuring 2003, the Corporation invested $2.3 billion, including$1.2 billion of debt assumed, in the acquisition of businesses,primarily reflecting the Corporation’s acquisition of Chubb plc.During 2002, the Corporation invested $424 million, includingdebt assumed, in business acquisitions. That amount includesSikorsky’s second quarter purchase of Derco Holding andacquisitions at Pratt & Whitney. For additional discussion ofacquisitions, see “Liquidity and Financing Commitments” andNote 2 to the Consolidated Financial Statements.
Restructuring and Other Costs 2003 Actions As described in Note 12 to the ConsolidatedFinancial Statements, during 2003, the Corporation recordednet pre-tax restructuring and related charges of $182 million.These charges relate to ongoing cost reduction efforts, includingworkforce reductions and the consolidation of manufacturingfacilities including Carrier’s Syracuse, New York-based containerrefrigeration and compressor manufacturing operations andOtis’ Bloomington, Indiana-based manufacturing, distributionand field tool operations. Those operations will be consolidatedinto facilities in growing Asian and other markets. The chargesincluded $126 million recorded in cost of sales, $31 million inselling, general and administrative expenses and $25 million inother income.
These charges were recorded in the Corporation’s segmentsas follows: Otis $65 million, Carrier $65 million, Pratt &Whitney $19 million, Flight Systems $23 million andEliminations and other $10 million. The charges included $133million for severance and related employee termination costs,$8 million for asset write-downs, largely related to manufacturingassets and exiting facilities that will no longer be utilized, and$41 million for facility exit and lease termination costs.
The 2003 actions are expected to result in net workforcereductions of approximately 4,000 hourly and salaried employ-ees, the exiting of approximately 2.1 million square feet of facilitiesand the disposal of assets associated with the exited facilities.Approximately 75% of the total pre-tax charge will require cashpayments which will be primarily funded by cash generatedfrom operations. During 2003, the Corporation made pre-taxcash outflows of approximately $75 million related to the 2003programs. Savings are expected to increase over a two yearperiod resulting in recurring pre-tax savings of approximately$165 million annually. As of December 31, 2003, net workforcereductions of approximately 2,500 employees have been com-pleted and one hundred thousand square feet of facilities havebeen exited. The majority of the remaining workforce and facilityrelated cost reduction actions are targeted to be completed in2004. A significant portion of the remaining square footage tobe eliminated under the 2003 actions relates to the Syracuse,New York and Bloomington, Indiana facilities. Additionalrestructuring and related charges of $118 million are expected
Net income and diluted earnings per share increased $125million (6%) and $.27 (6%) in 2003 compared to the sameperiod of 2002. The favorable impact of foreign currency trans-lation contributed $.23 per share in 2003.
Net income and diluted earnings per share increased $298million (15%) and $.59 (15%) in 2002 compared to the sameperiod in 2001. The favorable impact of foreign currency trans-lation contributed $.05 per share in 2002.
Effective January 1, 2002, the Corporation ceased theamortization of goodwill in accordance with SFAS No. 142. Asmore fully described in Note 7 to the Consolidated FinancialStatements, net income in 2001, adjusted to exclude amountsno longer being amortized, was $2,150 million. On that basis,diluted earnings per share would have been $4.25 in 2001.
The impact of goodwill amortization recorded in theCorporation’s segments, and the effect that discontinuingamortization would have had on certain income statement lineitem amounts in 2001 is as follows:
IN MILLIONS OF DOLLARS 2001
Otis $ 30Carrier 74Pratt & Whitney 23Flight Systems 103
Total segment goodwill amortization 230Income taxes (16)Minority interest in subsidiaries’ earnings (2)
Net income impact $ 212
Diluted earnings per share $ .42

8 U N I T E D T E C H N O L O G I E S
to be incurred to complete these actions, primarily in 2004. Asof December 31, 2003, approximately $92 million of sever-ance and related costs and $8 million of facility exit and leasetermination accruals remain.
2002 Actions As described in Note 12 to the ConsolidatedFinancial Statements, during 2002, the Corporation recordednet pre-tax restructuring and related charges totaling $321million. These charges related to ongoing cost reductionefforts, including workforce reductions and consolidation ofmanufacturing, sales and service facilities, and included $237million recorded in cost of sales and $81 million in selling, gen-eral and administrative expenses.
The charges were recorded in the Corporation’s segmentsas follows: Otis $73 million, Carrier $114 million, Pratt &Whitney $80 million and Flight Systems $55 million. Thecharges included accruals of $203 million for severance andrelated employee termination costs, $48 million for asset write-downs, largely related to manufacturing assets and exitingfacilities that will no longer be utilized, and $19 million for facilityexit and lease termination costs. Additional charges associatedwith these restructuring actions totaling $51 million, that werenot accruable at the time, were also recorded in 2002, primarilyin the Carrier segment.
As of December 31, 2003, the 2002 actions have beencompleted substantially as planned having resulted in networkforce reductions of approximately 6,800 salaried and
hourly employees, the exiting of approximately 1.6 millionsquare feet of facilities and the disposal of assets associatedwith exited facilities. During 2002 and 2003, the Corporationmade pre-tax cash outflows of approximately $251 millionrelated to the 2002 programs. Savings are expected toincrease over a two-year period resulting in recurring pre-taxsavings of approximately $285 million annually.
2004 Actions In January 2004, the Corporation received a$250 million payment from DaimlerChrysler. In consideration forthis payment, the Corporation has released DaimlerChryslerfrom certain commitments previously made in support of MTUAero Engines GmbH. The Corporation expects to use this firstquarter gain for additional cost reduction actions across thebusinesses. In addition, the Corporation may initiate otheractions later in 2004 should the Corporation reach a favorablesettlement of the 1986 to 1993 open tax years with the IRSand receive approval by the U.S. Congress Joint Committee on Taxation.
In February 2004, Carrier announced its intent to close itsMcMinnville, Tennessee manufacturing facility. The total cost ofthis action is expected to be approximately $120 million.During the first quarter of 2004, the Corporation expects torecord charges of approximately $60 million related to thisaction primarily attributable to severance related costs andaccelerated depreciation and asset writeoffs.
Segment ReviewRevenues Operating Profits Operating Profit Margin
IN MILLIONS OF DOLLARS 2003 2002 2001 2003 2002 2001 2003 2002 2001
Otis $7,927 $6,811 $6,338 $1,377 $1,057 $ 847 17.4% 15.5% 13.4%Carrier 9,246 8,773 8,895 911 779 590 9.9% 8.9% 6.6%Chubb 1,136 – – 55 – – 4.8% – –Pratt & Whitney 7,505 7,645 7,679 1,125 1,282 1,308 15.0% 16.8% 17.0%Flight Systems 5,708 5,571 5,292 785 741 670 13.8% 13.3% 12.7%
Revenues, operating profits and operating profit margins ofthe Corporation’s principal segments include the results of allmajority-owned subsidiaries, consistent with the managementreporting of these businesses. For certain of these sub-sidiaries, minority shareholders have rights which overcomethe presumption of control as described in Note 17 to theConsolidated Financial Statements. In the Corporation’s con-solidated results, these subsidiaries are accounted for usingthe equity method of accounting. Adjustments to reconcilesegment reporting to consolidated results are included in“Eliminations and other,” which also includes certain small subsidiaries.
2003 Compared to 2002OTIS revenues increased $1,116 million (16%) in 2003reflecting increases in all geographic regions, particularly Asiaand Europe. Foreign currency translation contributed approxi-
mately 50% of the increase, reflecting the continued strengthof the euro in relation to the U.S. dollar.
Otis operating profits increased $320 million (30%) in2003. The operating profit increase reflects strong profitimprovement in Asia and Europe and the favorable impact offoreign currency translation, which contributed approximatelyone-third of the operating profit growth. Otis operating profitalso includes a non-cash gain of approximately $50 millionassociated with an exchange of equity interests in China.Restructuring and related charges at Otis were comparable in2003 and 2002.
CARRIER revenues increased $473 million (5%) in 2003. Theincrease primarily reflects growth in transport refrigeration andNorth American residential HVAC partially offset by weaknessin global commercial HVAC and North American commercial
2 0 0 3 A N N U A L R E P O R T 9
refrigeration. Foreign currency translation contributed approxi-mately 70% of the reported revenue increase, primarily reflectingthe strength of the euro in relation to the U.S. dollar.
Carrier’s operating profits increased $132 million (17%) in2003. The increase reflects higher volume in the transportrefrigeration business and benefits of cost reduction and pro-ductivity actions, partially offset by lower profits in commercialrefrigeration and continued unfavorable pricing trends in global commercial HVAC. The increase is also due to lowerrestructuring charges in 2003, which were $65 million in 2003and $114 million in 2002. Approximately 30% of the reportedoperating profit increase is due to the favorable impact of foreigncurrency translation.
PRATT & WHITNEY revenues decreased $140 million, (2%)in 2003. The decrease was due primarily to declines in com-mercial aerospace spare parts volume and large commercialengine and aftermarket volume, largely offset by increased military revenues.
Pratt & Whitney operating profits decreased $157 million(12%) in 2003, reflecting declines in commercial aerospacespare parts volume and costs associated with a collaborationaccounting matter, partially offset by the profit impact ofincreased military revenues, and lower research and develop-ment costs, reflecting a technology funding agreement at Pratt& Whitney Canada. The 2002 operating profit also includesPW6000 costs which were partially offset by the favorableimpact of commercial engine contract changes, both recordedin the first quarter of 2002.
FLIGHT SYSTEMS revenues increased $137 million (2%) in2003. The increase was due to higher military and industrialrevenues at Hamilton Sundstrand and increased aftermarketrevenues at Sikorsky, resulting in part from the acquisition ofDerco Holding, largely offset by lower helicopter shipments at Sikorsky.
Flight Systems operating profits increased $44 million(6%) in 2003 due to higher operating profits at both HamiltonSundstrand and Sikorsky. The operating profit increase wasdue primarily to lower restructuring charges in 2003, primarilyat Hamilton Sundstrand. The 2003 results for HamiltonSundstrand also reflect the favorable impact of a third quarter2003 commercial contract termination and the estimated costof a pending commercial litigation matter, the net impact ofwhich were not material. The increase at Sikorsky was due primarily to aftermarket growth and lower post-certification S-92 spending, partially offset by fewer helicopter shipments.
CHUBB revenues and operating profits were $1,136 millionand $55 million, respectively, for the five-month period endedDecember 31, 2003. Security services in Australia, the UnitedKingdom and Europe represent the majority of the reportedrevenue and operating profit for 2003.
2002 Compared to 2001 OTIS revenues increased $473 million (7%) in 2002 reflectingincreases in all geographic regions and growth in both newequipment and service sales. Foreign currency translationincreased revenues 2% in 2002, largely reflecting the strengthof the euro in relation to the U.S. dollar. The 2002 increasealso includes approximately two percentage points of organicgrowth, as well as the impact of acquisitions.
Otis operating profits increased $210 million (25%) in2002. The operating profit increase reflects profit improvementin all geographic regions, primarily in Asia and Europe. Theincrease was due primarily to the profit impact of increasedrevenues, including those from recent acquisitions, productivi-ty improvements and the absence of goodwill amortization in2002. Foreign currency translation increased operating profitsby 3% in 2002.
CARRIER revenues decreased $122 million (1%) in 2002.The decrease reflects continued weakness in the NorthAmerican and European commercial HVAC markets, the commercial refrigeration business, and in Latin America, par-tially offset by increased volume in the transport refrigerationbusiness. Foreign currency translation had a minimal impact in2002, reflecting the strength of the U.S. dollar in relation toLatin American currencies, largely offset by the strengtheningof the euro.
Carrier’s operating profits increased $189 million (32%) in2002 reflecting $58 million lower restructuring charges in2002, the benefit of cost reduction actions and the absence of goodwill amortization, partially offset by the profit impact ofdecreased volume, competitive pricing and continued per-formance issues in some of the acquired entities.
PRATT & WHITNEY revenues decreased $34 million, lessthan one percentage point, in 2002. The decrease was dueprimarily to lower volume at Pratt & Whitney Power Systems,declines in commercial spare parts sales, reflecting currentconditions in the commercial airline industry, and lower enginevolume at Pratt & Whitney Canada. These decreases were partially offset by increases in military engine and commercialoverhaul and repair revenue. Consistent with the Corporation’sexpectations, commercial spare parts orders declined approx-imately 10% in 2002.
Pratt & Whitney operating profits decreased $26 million(2%) in 2002, reflecting lower profits from Pratt & WhitneyCanada, commercial spare parts and Pratt & Whitney PowerSystems. The decreases were partially offset by higher militaryengine and commercial overhaul and repair profits. The resultsalso reflect the favorable impact of commercial engine contractchanges offset by estimated costs to support product war-ranties to certain customers and costs associated with thePW6000 program.
1 0 U N I T E D T E C H N O L O G I E S
FLIGHT SYSTEMS revenues increased $279 million (5%) in2002. The increase was due to higher value helicopter shipmentsand increased aftermarket revenues at Sikorsky, resulting inpart from the acquisition of Derco Holding in the second quarter of 2002. These increases were partially offset by lowercommercial aerospace aftermarket and industrial volume atHamilton Sundstrand.
Flight Systems operating profits increased $71 million (11%)in 2002. The increase was due primarily to the discontinuanceof goodwill amortization. Excluding goodwill amortization, operating profits decreased $32 million (4%) due primarily tolower commercial aerospace aftermarket and industrial volumeat Hamilton Sundstrand and increased research and develop-ment spending at Sikorsky related to S-92 certification.
Liquidity and Financing Commitments
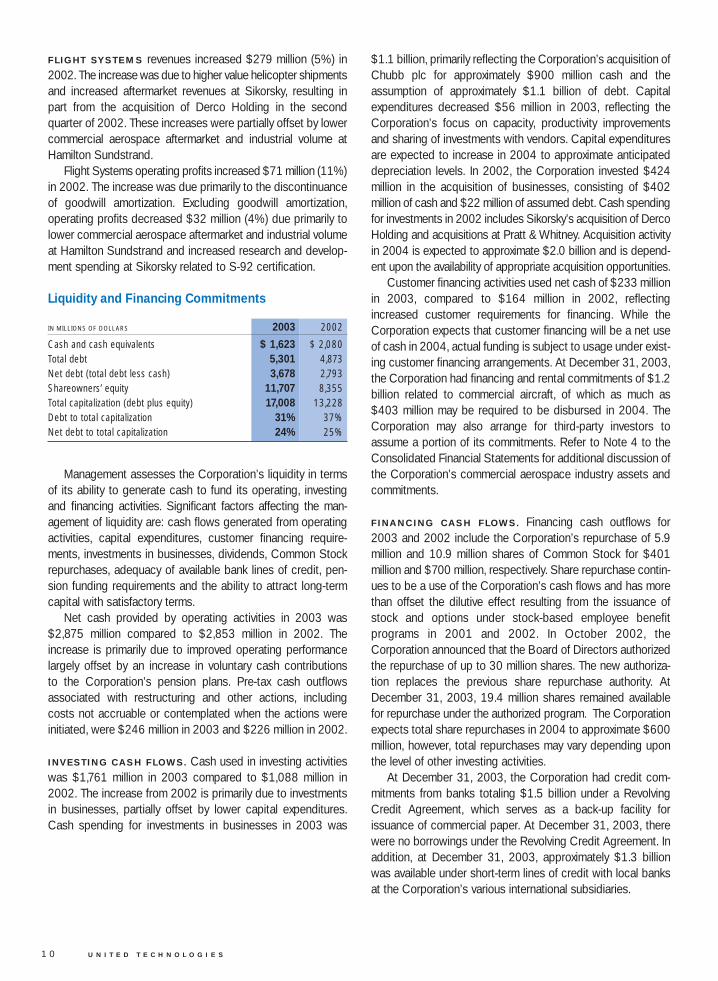
IN MILLIONS OF DOLLARS 2003 2002
Cash and cash equivalents $ 1,623 $ 2,080Total debt 5,301 4,873Net debt (total debt less cash) 3,678 2,793Shareowners’ equity 11,707 8,355Total capitalization (debt plus equity) 17,008 13,228Debt to total capitalization 31% 37%Net debt to total capitalization 24% 25%
$1.1 billion, primarily reflecting the Corporation’s acquisition ofChubb plc for approximately $900 million cash and theassumption of approximately $1.1 billion of debt. Capitalexpenditures decreased $56 million in 2003, reflecting theCorporation’s focus on capacity, productivity improvementsand sharing of investments with vendors. Capital expendituresare expected to increase in 2004 to approximate anticipateddepreciation levels. In 2002, the Corporation invested $424million in the acquisition of businesses, consisting of $402 million of cash and $22 million of assumed debt. Cash spendingfor investments in 2002 includes Sikorsky’s acquisition of DercoHolding and acquisitions at Pratt & Whitney. Acquisition activityin 2004 is expected to approximate $2.0 billion and is depend-ent upon the availability of appropriate acquisition opportunities.
Customer financing activities used net cash of $233 millionin 2003, compared to $164 million in 2002, reflectingincreased customer requirements for financing. While theCorporation expects that customer financing will be a net useof cash in 2004, actual funding is subject to usage under exist-ing customer financing arrangements. At December 31, 2003,the Corporation had financing and rental commitments of $1.2billion related to commercial aircraft, of which as much as$403 million may be required to be disbursed in 2004. TheCorporation may also arrange for third-party investors toassume a portion of its commitments. Refer to Note 4 to theConsolidated Financial Statements for additional discussion ofthe Corporation’s commercial aerospace industry assets andcommitments.
FINANCING CASH FLOWS. Financing cash outflows for2003 and 2002 include the Corporation’s repurchase of 5.9million and 10.9 million shares of Common Stock for $401 million and $700 million, respectively. Share repurchase contin-ues to be a use of the Corporation’s cash flows and has morethan offset the dilutive effect resulting from the issuance ofstock and options under stock-based employee benefit programs in 2001 and 2002. In October 2002, theCorporation announced that the Board of Directors authorizedthe repurchase of up to 30 million shares. The new authoriza-tion replaces the previous share repurchase authority. AtDecember 31, 2003, 19.4 million shares remained availablefor repurchase under the authorized program. The Corporationexpects total share repurchases in 2004 to approximate $600million, however, total repurchases may vary depending uponthe level of other investing activities.
At December 31, 2003, the Corporation had credit com-mitments from banks totaling $1.5 billion under a RevolvingCredit Agreement, which serves as a back-up facility forissuance of commercial paper. At December 31, 2003, therewere no borrowings under the Revolving Credit Agreement. Inaddition, at December 31, 2003, approximately $1.3 billionwas available under short-term lines of credit with local banksat the Corporation’s various international subsidiaries.
Management assesses the Corporation’s liquidity in termsof its ability to generate cash to fund its operating, investingand financing activities. Significant factors affecting the man-agement of liquidity are: cash flows generated from operatingactivities, capital expenditures, customer financing require-ments, investments in businesses, dividends, Common Stockrepurchases, adequacy of available bank lines of credit, pen-sion funding requirements and the ability to attract long-termcapital with satisfactory terms.
Net cash provided by operating activities in 2003 was$2,875 million compared to $2,853 million in 2002. Theincrease is primarily due to improved operating performancelargely offset by an increase in voluntary cash contributions to the Corporation’s pension plans. Pre-tax cash outflowsassociated with restructuring and other actions, includingcosts not accruable or contemplated when the actions wereinitiated, were $246 million in 2003 and $226 million in 2002.
INVESTING CASH FLOWS. Cash used in investing activitieswas $1,761 million in 2003 compared to $1,088 million in2002. The increase from 2002 is primarily due to investmentsin businesses, partially offset by lower capital expenditures.Cash spending for investments in businesses in 2003 was
2 0 0 3 A N N U A L R E P O R T 1 1
As described in Note 9 to the Consolidated FinancialStatements, the Corporation issued $500 million of long-termnotes payable in 2002. The proceeds of the issuance wereused for the repayment of commercial paper, to support invest-ment activities, and for general corporate purposes, includingrepurchases of the Corporation’s Common Stock. AtDecember 31, 2003, up to approximately $1.1 billion of additional debt and equity securities could be issued under ashelf registration statement on file with the Securities andExchange Commission.
The Board of Directors announced a 10% and a 30%increase in the dividend payable in the second and fourth quarters of 2003 to 27 and 35 cents per common share,respectively.
During the fourth quarter of 2003, all of the 10.6 millionconvertible preferred shares held in the Employee StockOwnership Plan (ESOP) were converted to 42.5 million ofcommon shares. The conversion had no effect on diluted earnings per share and slightly decreased the debt-to-capitalratio as shares were reclassified as equity.
The funded status of the Corporation’s pension plans isdependent upon many factors, including returns on investedassets, level of market interest rates and levels of voluntarycontributions to the plans. In connection with the acquisition ofChubb, the Corporation acquired defined benefit pensionplans with an aggregate unfunded liability of approximately$650 million. Declines in long-term interest rates have had anegative impact on the funded status of the plans. During2003, the Corporation made voluntary cash contributions of$994 million to its pension plans. During 2002, theCorporation made voluntary contributions of $783 million to itspension plans, including $253 million of Treasury Stock. Thesecontributions are reported as an increase in other assets in theConsolidated Balance Sheet. An independent manager hasbeen appointed to hold and dispose of the shares from time totime in the open markets or otherwise. The Corporation cancontribute cash to these plans at its discretion and plans tomake an additional $500 million of contributions in 2004. Asof December 31, 2003, the total investment by the definedbenefit pension plans in the Corporation’s securities, includingthe Treasury Stock transactions described above, is approxi-mately 6% of total plan assets.
The Corporation’s shareowners’ equity is impacted by avariety of factors, including those items that are not reported inearnings but are reported directly in equity, such as foreigncurrency translation, minimum pension liability adjustments,unrealized holding gains and losses on available-for-sale secu-rities and cash flow hedging transactions. The Corporationrecorded a $570 million after-tax credit to equity, reflecting adecrease in the additional minimum liability under its pensionplans of approximately $900 million, which is included in futurepension and postretirement benefit obligations in theDecember 31, 2003 Consolidated Balance Sheet. See theConsolidated Statement of Changes in Shareowners’ Equityfor information on such non-shareowners’ changes.
The Corporation manages its worldwide cash requirementsconsidering available funds among the many subsidiariesthrough which it conducts its business and the cost effective-ness with which those funds can be accessed. The repatriationof cash balances from certain of the Corporation’s subsidiariescould have adverse tax consequences; however, those balancesare generally available without legal restrictions to fund ordinarybusiness operations. The Corporation has and will continue totransfer cash from those subsidiaries to the parent and to otherinternational subsidiaries when it is cost effective to do so.
The Corporation believes that existing sources of liquidityare adequate to meet anticipated borrowing needs at compa-rable risk-based interest rates for the foreseeable future.Although uncertainties in acquisition spending could causemodest variations at times, management anticipates that thelevel of debt to capital will remain generally consistent withrecent levels. The anticipated level of debt to capital is expectedto be sufficient to satisfy the Corporation’s various cash flowrequirements, including acquisition spending, continuedCommon Stock repurchases and pension funding as needed.
Off-Balance Sheet ArrangementsThe Corporation extends a variety of financial guarantees to thirdparties in support of unconsolidated affiliates and for potentialfinancing requirements of commercial aerospace customers.
The Corporation also has obligations arising from sales ofcertain businesses and assets, including representations andwarranties and related indemnities for environmental, healthand safety, tax and employment matters. Circumstances thatcould cause the contingent obligations and liabilities arisingfrom these arrangements to become due are changes in anunderlying transaction (e.g., hazardous waste discoveries,adverse tax audit, etc.), non-performance under a contract,customer requests for financing or deterioration in the financialcondition of the guaranteed party.

1 2 U N I T E D T E C H N O L O G I E S
Amount of Commitment Expiration per Period
IN MILLIONS OF DOLLARS Less than More thanCommercial Commitments Committed 1 Year 1-3 Years 3-5 Years 5 Years
Commercial aerospace financing and rental commitments $1,203 $ 403 $ 459 $ 259 $ 82IAE financing arrangements 1,406 389 270 60 687Unconsolidated subsidiary debt guarantees 191 46 103 – 42Commercial aerospace financing arrangements 160 33 4 53 70Commercial customer financing arrangements 66 42 24 – –
Total commercial commitments $3,026 $ 913 $ 860 $ 372 $ 881
Refer to Notes 4, 9, 15 and 16 to the Consolidated Financial Statements for additional discussion on commercial commitments.
Market Risk and Risk Management The Corporation is exposed to fluctuations in foreign currencyexchange rates, interest rates and commodity prices. To managecertain of those exposures, the Corporation uses derivativeinstruments, including swaps, forward contracts and options.Derivative instruments utilized by the Corporation in its hedgingactivities are viewed as risk management tools, involve littlecomplexity and are not used for trading or speculative purposes.The Corporation diversifies the counterparties used and monitorsthe concentration of risk to limit its counterparty exposure.
The Corporation has evaluated its exposure to changes inforeign currency exchange rates, interest rates and commodityprices in its market risk sensitive instruments, which are primarilycash, debt and derivative instruments, using a value at riskanalysis. Based on a 95% confidence level and a one-dayholding period, at December 31, 2003, the potential loss in fairvalue of the Corporation’s market risk sensitive instruments
was not material in relation to the Corporation’s financial position,results of operations or cash flows. The Corporation’s calculatedvalue at risk exposure represents an estimate of reasonablypossible net losses based on volatilities and correlations andis not necessarily indicative of actual results. Refer to Notes 1,9, 13 and 14 to the Consolidated Financial Statements foradditional discussion of foreign currency exchange, interestrates and financial instruments.
FOREIGN CURRENCY EXPOSURES. The Corporation has alarge volume of foreign currency exposures that result from itsinternational sales, purchases, investments, borrowings andother international transactions. International segment revenues,including U.S. export sales, averaged approximately $16 billionover the last three years. The Corporation actively managesforeign currency exposures that are associated with committedforeign currency purchases and sales and other assets and
Purchase obligations include amounts committed under legallyenforceable contracts or purchase orders for goods and serv-ices with defined terms as to price, quantity, delivery and ter-mination liability. To the extent separately identifiable, purchaseorders for products to be delivered under firm contracts withthe U.S. Government and for which the Corporation has fullrecourse under normal contract termination clauses, have beenexcluded. In addition, as disclosed in Note 11 to theConsolidated Financial Statements, the Corporation expects to
make $500 million of voluntary contributions to its pension plansin 2004 which have been excluded from the table above.
Other long-term liabilities primarily include those amountson the Corporation’s December 31, 2003 balance sheet representing obligations under product service and warrantypolicies, performance and operating cost guarantees and esti-mated environmental remediation costs. The timing of cashflows associated with these obligations are based upon management’s estimates over the terms of these agreementsand are largely based upon historical experience.
A summary of the Corporation’s contractual obligations and commitments as of December 31, 2003 is as follows:
Payments Due by Period
IN MILLIONS OF DOLLARS Less than More thanContractual Obligations Total 1 Year 1-3 Years 3-5 Years 5 Years
Long-term debt $ 4,632 $ 375 $ 749 $ 69 $3,439Operating leases 1,059 292 390 190 187Purchase obligations 6,145 2,483 1,460 602 1,600Other long-term liabilities 1,639 591 302 204 542
Total contractual obligations $13,475 $ 3,741 $2,901 $1,065 $5,768

2 0 0 3 A N N U A L R E P O R T 1 3
liabilities created in the normal course of business at the oper-ating unit level. Exposures that cannot be naturally offset withinan operating unit to an insignificant amount are hedged withforeign currency derivatives. The Corporation also has a sig-nificant amount of foreign currency net asset exposures.Currently, the Corporation does not hold any derivative contractsthat hedge its foreign currency net asset exposures but mayconsider such strategies in the future.
The Corporation’s cash position includes amounts denom-inated in foreign currencies. The Corporation manages itsworldwide cash requirements considering available fundsamong its many subsidiaries and the cost effectiveness withwhich these funds can be accessed. The repatriation of cashbalances from certain of the Corporation’s subsidiaries couldhave adverse tax consequences. However, those balances aregenerally available without legal restrictions to fund ordinarybusiness operations. The Corporation has and will continue totransfer cash from those subsidiaries to the parent and to otherinternational subsidiaries when it is cost effective to do so.
INTEREST RATE EXPOSURES. The Corporation’s long-termdebt portfolio consists mostly of fixed-rate instruments. Due torecent declines in market interest rates, a portion of that port-folio is hedged with fixed for floating interest rate swaps. Thehedges are designated as fair value hedges and the gains andlosses on the swaps are reported in interest expense, reflectingthat portion of interest expense at a variable rate. From time totime the Corporation issues commercial paper, which exposesthe Corporation to changes in interest rates.
COMMODITY PRICE EXPOSURES. The Corporation isexposed to volatility in the prices of raw materials used in someof its products and uses forward contracts in limited circum-stances to manage some of those exposures. The forward contracts are designated as hedges of the cash flow variabilitythat results from the forecasted purchases. Gains and losseson those derivatives are deferred in other comprehensiveincome to the extent they are effective as hedges and reclas-sified into cost of products sold in the period in which thehedged transaction impacts earnings.
Environmental Matters The Corporation’s operations are subject to environmental regulation by federal, state and local authorities in the U.S. andregulatory authorities with jurisdiction over its foreign operations.As a result, the Corporation has established, and continuallyupdates, policies relating to environmental standards of performance for its operations worldwide. The Corporationbelieves that expenditures necessary to comply with the present regulations governing environmental protection willnot have a material effect upon its competitive position, con-solidated financial position, results of operations or cash flows.
The Corporation has identified approximately 480 locations,mostly in the United States, at which it may have some liabilityfor remediating contamination. The Corporation does not believethat any individual location’s exposure will have a materialeffect on the results of operations of the Corporation. Sites inthe investigation or remediation stage represent approximately95% of the Corporation’s accrued environmental liability. Theremaining 5% of the recorded liability consists of sites wherethe Corporation may have some liability but investigation is inthe initial stages or has not begun.
The Corporation has been identified as a potentiallyresponsible party under the Comprehensive EnvironmentalResponse Compensation and Liability Act (“CERCLA” orSuperfund) at approximately 100 sites. The number ofSuperfund sites, in and of itself, does not represent a relevantmeasure of liability because the nature and extent of environ-mental concerns vary from site to site and the Corporation’sshare of responsibility varies from sole responsibility to very little responsibility. In estimating its liability for remediation, theCorporation considers its likely proportionate share of theanticipated remediation expense and the ability of other poten-tially responsible parties to fulfill their obligations.
At December 31, 2003, the Corporation had $449 millionreserved for environmental remediation. Cash outflows forenvironmental remediation were $32 million in 2003, $42 millionin 2002 and $61 million in 2001. The Corporation estimatesthat ongoing environmental remediation expenditures in eachof the next two years will not exceed $60 million.
The Corporation has had insurance in force over its historywith a number of insurance companies and has pursued litiga-tion seeking indemnity and defense under these insurancepolicies in relation to its environmental liabilities. In January2002, the Corporation settled the last of these lawsuits underan agreement providing for the Corporation to receive paymentstotaling approximately $100 million.
U.S. Government The Corporation’s contracts with the U.S. Government aresubject to audits. Like many defense contractors, theCorporation has received audit reports which recommend thatcertain contract prices should be reduced to comply with various government regulations. Some of these audit reportsinvolve substantial amounts. The Corporation has made volun-tary refunds in those cases it believes appropriate. In addition,the Corporation accrues for liabilities associated with thosegovernment contracting matters that are probable and can bereasonably estimated.
As described in Note 16 to the Consolidated FinancialStatements, in the fourth quarter of 2003, the Corporationreceived a demand notice for $755 million from the U.S.Department of Defense (DoD) relating to an ongoing disputeover Pratt & Whitney’s government cost accounting practices
1 4 U N I T E D T E C H N O L O G I E S
for engine parts received from its partners on certain commer-cial engine collaboration programs from 1984 to the present.
In July 2001, the U.S. Armed Services Board of ContractAppeals (ASBCA) ruled that Pratt & Whitney’s accounting forthese parts was in compliance with government CostAccounting Standards (CAS). The DoD appealed the ruling tothe Court of Appeals for the Federal Circuit and in January2003, the Court reversed the ASBCA’s decision and remandedthe case back to the ASBCA. The case is currently pendingbefore the ASBCA.
Should the DoD ultimately prevail with respect to one ormore of the significant government contracting matters, theoutcome could result in a material effect on the Corporation’sresults of operations in the period the matter is resolved.However, the Corporation believes that the resolution of thesematters will not have a material adverse effect on theCorporation’s results of operations, competitive position, cashflows or financial condition.
Additional discussion of the Corporation’s environmentaland U.S. Government contract matters is included in “Critical Accounting Estimates – Contracting with the FederalGovernment” and Notes 1 and 16 to the ConsolidatedFinancial Statements.
Other The Corporation extends performance and operating costguarantees beyond its normal warranty and service policies forextended periods on some of its products, particularly commercial aircraft engines. Liability under such guarantees iscontingent upon future product performance and durability. Inaddition, the Corporation incurs discretionary costs to serviceits products in connection with product performance issues.The Corporation has accrued its estimated liability that mayresult under these guarantees and for service costs which areprobable and can be reasonably estimated.
New Accounting PronouncementsIn January 2003, FASB Interpretation No. 46, “Consolidationof Variable Interest Entities” (FIN No. 46) was issued. Theinterpretation requires variable interest entities to be consoli-dated if the equity investment at risk is not sufficient to permit anentity to finance its activities without support from other partiesor the equity investors lack certain specified characteristics ofa controlling financial interest. The guidelines of the interpreta-tion will become applicable for the Corporation in its first quar-ter 2004 financial statements. The Corporation is reviewingFIN No. 46 to determine its impact, if any, on future reportingperiods, and does not currently anticipate any materialaccounting or disclosure requirement under the provisions of theinterpretation.
2 0 0 3 A N N U A L R E P O R T 1 5
Cautionary Note Concerning FactorsThat May Affect Future ResultsThis Annual Report contains statements which, to the extentthey are not statements of historical or present fact, constitute“forward-looking statements” under the securities laws. Fromtime to time, oral or written forward-looking statements mayalso be included in other materials released to the public.These forward-looking statements are intended to providemanagement’s current expectations or plans for the futureoperating and financial performance of the Corporation, basedon assumptions currently believed to be valid. Forward-lookingstatements can be identified by the use of words such as:“believe,” “expect,” “plans,” “strategy,” “prospects,” “estimate,”“project,” “target,” “anticipate” and other words of similar meaning in connection with a discussion of future operating orfinancial performance. These include, among others, statementsrelating to:
• Future earnings and other measurements of financial performance
• Future cash flow and uses of cash
• The effect of economic downturns or growth in particular regions
• The effect of changes in the level of activity in particular industries or markets
• The scope, nature or impact of acquisition activity andintegration into the Corporation’s businesses
• Product developments and new business opportunities
• Restructuring costs and savings
• The outcome of contingencies
• Future repurchases of Common Stock
• Future levels of indebtedness and capital spending
• Pension plan assumptions and future contributions.
All forward-looking statements involve risks and uncertaintiesthat may cause actual results to differ materially from thoseexpressed or implied in the forward-looking statements. Foradditional information identifying factors that may cause actualresults to vary materially from those stated in the forward-look-ing statements, see the Corporation’s reports on Forms 10-K,10-Q and 8-K filed with the Securities and ExchangeCommission from time to time. The Corporation’s AnnualReport on Form 10-K for 2003 includes important informationas to risk factors in the “Business” section under the headings“Description of Business by Segment” and “Other MattersRelating to the Corporation’s Business as a Whole,” and in the“Legal Proceedings” section.
1 6 U N I T E D T E C H N O L O G I E S
M A N A G E M E N T ’ S R E S P O N S I B I L I T Y
F O R F I N A N C I A L S T A T E M E N T S A N D C O N T R O L S
We believe it is critical to provide investors and other users of our financial statements with information that is relevant, objective,understandable and timely, so that they can make informed decisions. As a result, we have established and we maintain accountingsystems and practices and internal control processes designed to provide reasonable assurance that transactions are properlyexecuted and recorded and that our policies and procedures are carried out appropriately.
Core Values We are committed to performance and improving shareowner value. We communicate honestly to investors and strive to deliverwhat we promise. We conduct our business in accordance with the Corporation’s Code of Ethics, which is distributed to employeesacross the Corporation and is published in 16 languages. Through our Business Practices Office, we have long-standing programsin place that allow employees, customers, suppliers and others to identify situations, on a confidential or anonymous basis, thatmay be in violation of the Corporation’s Code of Ethics.
Financial Controls and Transparency Our internal controls are designed to ensure that assets are safeguarded, transactions are executed according to managementauthorization and our financial systems and records can be relied upon for preparing our financial statements and related disclosures.Our system of internal controls includes continuous review of our financial policies and procedures to ensure accounting and regulatory issues have been appropriately addressed, recorded and disclosed. We execute periodic on-site accounting controland compliance reviews in each of our businesses to ensure policies and procedures are being followed. Our internal auditors testthe adequacy of internal controls and compliance with policies, as well as perform a number of financial audits across the busi-nesses throughout the year. The independent auditors perform audits of our financial statements, in which they examine evidencesupporting the amounts and disclosures in our financial statements, and also consider our system of internal controls and proceduresin planning and performing their audits. Their report appears on page 17.
Management Controls Our management team is committed to providing high-quality, relevant and timely information about our businesses. Managementperforms reviews of each of our businesses throughout the year, addressing issues ranging from financial performance and strategyto personnel and compliance. We require that each business unit president, chief financial officer and controller certify the accuracyof that business unit's financial information and its system of internal accounting and disclosure controls and procedures on a quarterly and annual basis. We also require each finance executive worldwide to acknowledge adherence to a series of principlesand responsibilities governing the professional and ethical conduct expected within the UTC finance organization, as modeled afterthe Financial Executives International code of conduct.
Our Board of Directors normally meets seven times per year to provide oversight, to review corporate strategies and opera-tions, and to assess management’s conduct of the business. The Audit Committee of our Board of Directors is comprised of sixindividuals who are not employees or officers of the company and normally meets eight times per year. The Audit Committee isresponsible for the appointment and oversight of the audit work performed by the independent auditors, as well as overseeing ourfinancial reporting practices and internal control systems. The Audit Committee meets regularly with our internal auditors and independent auditors, as well as management. Both the internal auditors and independent auditors have full, unlimited access tothe Audit Committee.
Management is responsible for implementing and maintaining adequate systems of internal and disclosure controls and pro-cedures and for monitoring their effectiveness. We strive to recruit, train and retain high performance individuals to ensure that ourcontrols are designed, implemented and maintained in a high-quality, reliable manner. We evaluated the systems of internal anddisclosure controls and procedures as of December 31, 2003. Based on that evaluation, management believes the internalaccounting controls provide reasonable assurance that the Corporation’s assets are safeguarded, transactions are executed inaccordance with management’s authorizations, and the financial records are reliable for the purpose of preparing financial statements.
George David Stephen F. PageChairman and Chief Executive Officer Vice Chairman and Chief Financial Officer

2 0 0 3 A N N U A L R E P O R T 1 7
R E P O R T O F I N D E P E N D E N T A U D I T O R S
To the Shareowners of United Technologies Corporation
In our opinion, the accompanying consolidated balance sheet and the related consolidated statements of operations, of cash flowsand of changes in shareowners’ equity present fairly, in all material respects, the financial position of United TechnologiesCorporation and its subsidiaries at December 31, 2003 and 2002, and the results of their operations and their cash flows for eachof the three years in the period ended December 31, 2003, in conformity with accounting principles generally accepted in theUnited States of America. These financial statements are the responsibility of the Corporation’s management; our responsibility isto express an opinion on these financial statements based on our audits. We conducted our audits of these statements in accordancewith auditing standards generally accepted in the United States of America, which require that we plan and perform the audit toobtain reasonable assurance about whether the financial statements are free of material misstatement. An audit includes examining,on a test basis, evidence supporting the amounts and disclosures in the financial statements, assessing the accounting principlesused and significant estimates made by management, and evaluating the overall financial statement presentation. We believe thatour audits provide a reasonable basis for our opinion.
As discussed in Note 7 to the Consolidated Financial Statements, effective January 1, 2002, the Corporation adoptedStatement of Financial Accounting Standards No. 142, “Goodwill and Other Intangible Assets.”
PricewaterhouseCoopers LLP Hartford, Connecticut January 20, 2004
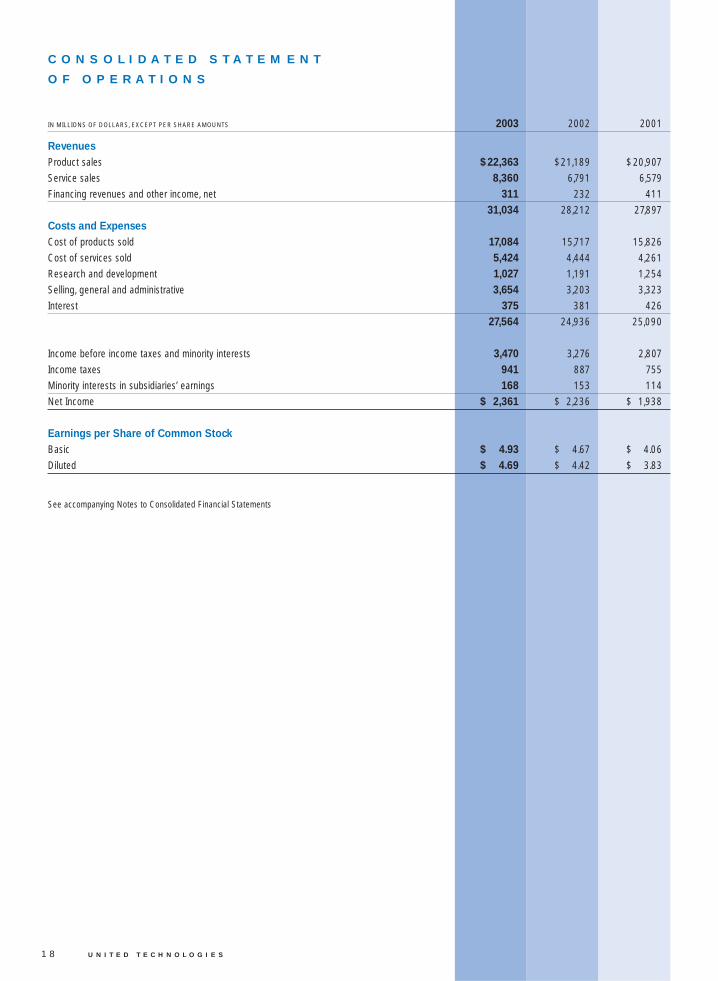
1 8 U N I T E D T E C H N O L O G I E S
C O N S O L I D A T E D S T A T E M E N T
O F O P E R A T I O N S
IN MILLIONS OF DOLLARS, EXCEPT PER SHARE AMOUNTS 2003 2002 2001
RevenuesProduct sales $22,363 $21,189 $20,907
Service sales 8,360 6,791 6,579
Financing revenues and other income, net 311 232 411
31,034 28,212 27,897
Costs and ExpensesCost of products sold 17,084 15,717 15,826
Cost of services sold 5,424 4,444 4,261
Research and development 1,027 1,191 1,254
Selling, general and administrative 3,654 3,203 3,323
Interest 375 381 426
27,564 24,936 25,090
Income before income taxes and minority interests 3,470 3,276 2,807
Income taxes 941 887 755
Minority interests in subsidiaries’ earnings 168 153 114
Net Income $ 2,361 $ 2,236 $ 1,938
Earnings per Share of Common StockBasic $ 4.93 $ 4.67 $ 4.06
Diluted $ 4.69 $ 4.42 $ 3.83
See accompanying Notes to Consolidated Financial Statements

2 0 0 3 A N N U A L R E P O R T 1 9
C O N S O L I D A T E D B A L A N C E S H E E T
IN MILLIONS OF DOLLARS, EXCEPT PER SHARE AMOUNTS (SHARES IN THOUSANDS) 2003 2002
AssetsCash and cash equivalents $ 1,623 $ 2,080
Accounts receivable (net of allowance for doubtful accounts of $421 and $380) 5,187 4,277
Inventories and contracts in progress 3,794 3,803
Future income tax benefits 1,372 1,431
Other current assets 388 244
Total Current Assets 12,364 11,835
Customer financing assets 1,031 771
Future income tax benefits 1,283 1,678
Fixed assets 5,080 4,587
Goodwill 9,329 6,981
Other assets 5,561 3,342
Total Assets $34,648 $29,194
Liabilities and Shareowners’ EquityShort-term borrowings $ 669 $ 197
Accounts payable 2,867 2,095
Accrued liabilities 6,384 5,449
Long-term debt currently due 375 44
Total Current Liabilities 10,295 7,785
Long-term debt 4,257 4,632
Future pension and postretirement benefit obligations 4,752 5,088
Other long-term liabilities 2,928 2,317
Commitments and contingent liabilities (Notes 4 and 16)
Minority interests in subsidiary companies 709 589
Series A ESOP Convertible Preferred Stock, $1 par value (Note 11) – 718
ESOP deferred compensation – (290)
– 428
Shareowners’ Equity:
Capital Stock:
Preferred Stock, $1 par value; Authorized – 250,000 shares; None issued or outstanding – –
Common Stock, $1 par value; Authorized – 2,000,000 shares; Issued 656,911 and 607,038 shares 6,587 5,447
Treasury Stock – 142,849 and 137,418 common shares at cost (5,335) (4,951)
Retained earnings 12,527 10,836
Unearned ESOP shares (273) –Accumulated other non-shareowners’ changes in equity:
Foreign currency translation (304) (832)
Minimum pension liability (1,581) (2,151)
Other 86 6
(1,799) (2,977)
Total Shareowners’ Equity 11,707 8,355
Total Liabilities and Shareowners’ Equity $34,648 $29,194
See accompanying Notes to Consolidated Financial Statements

2 0 U N I T E D T E C H N O L O G I E S
C O N S O L I D A T E D S T A T E M E N T
O F C A S H F L O W S
IN MILLIONS OF DOLLARS 2003 2002 2001
Operating ActivitiesNet income $ 2,361 $ 2,236 $ 1,938
Adjustments to reconcile net income to net cash flows provided by operating activities:
Depreciation and amortization 799 727 905
Deferred income tax provision 254 318 297
Minority interests in subsidiaries' earnings 168 153 114
Change in:
Accounts receivable (26) 80 289
Inventories and contracts in progress 77 243 (147)
Other current assets (14) 10 46
Accounts payable and accrued liabilities 19 (217) (64)
Voluntary contributions to pension plans (994) (530) –
Other, net 231 (167) (402)
Net Cash Provided by Operating Activities 2,875 2,853 2,976
Investing ActivitiesCapital expenditures (530) (586) (793)
Increase in customer financing assets (458) (386) (360)
Decrease in customer financing assets 225 222 237
Business acquisitions (1,097) (402) (439)
Dispositions of businesses 15 26 17
Other, net 84 38 61
Net Cash Used in Investing Activities (1,761) (1,088) (1,277)
Financing Activities Issuance of long-term debt – 500 904
Repayment of long-term debt (1,092) (231) (354)
Increase (decrease) in short-term borrowings 286 (357) (465)
Common Stock issued under employee stock plans 331 183 224
Dividends paid on Common Stock (533) (462) (423)
Repurchase of Common Stock (401) (700) (599)
Dividends to minority interests and other (287) (184) (147)
Net Cash Used in Financing Activities (1,696) (1,251) (860)
Effect of foreign exchange rate changes on Cash and cash equivalents 125 8 (29)
Net (decrease) increase in Cash and cash equivalents (457) 522 810
Cash and cash equivalents, beginning of year 2,080 1,558 748
Cash and cash equivalents, end of year $ 1,623 $ 2,080 $ 1,558
Supplemental Disclosure of Cash Flow Information:
Interest paid, net of amounts capitalized $ 372 $ 368 $ 420
Income taxes paid, net of refunds $ 378 $ 396 $ 497
Non-cash investing and financing activities include:
The 2002 and 2001 Treasury Stock contribution of $253 million and $247 million, respectively, to domestic defined benefit pension plans
The 2003 conversion of the ESOP convertible preferred shares of $698 million into Common Shares
See accompanying Notes to Consolidated Financial Statements

2 0 0 3 A N N U A L R E P O R T 2 1
C O N S O L I D A T E D S T A T E M E N T O F C H A N G E S
I N S H A R E O W N E R S ’ E Q U I T Y
Accumulated Non-Other Non- Shareowners’
Unearned Shareowners’ Changes inCommon Treasury Retained ESOP Changes Equity for
IN MILLIONS OF DOLLARS, EXCEPT PER SHARE AMOUNTS Stock Stock Earnings Shares In Equity the Period
December 31, 2000 $ 4,665 $ (3,955) $ 7,743 $ (791) $ 1,408Common Stock issued under employee plans
(6.2 million shares), including tax benefit of $91 315 13 (78)Common Stock contributed to defined benefit
pension plans (4.1 million shares) 110 137Common Stock repurchased (8.5 million shares) (599)Dividends on Common Stock ($.90 per share) (423)Dividends on ESOP Preferred Stock ($4.80 per share) (31)Non-Shareowners’ Changes in Equity:
Net income 1,938 $ 1,938Foreign currency translation adjustments (142) (142)Minimum pension liability adjustments,
net of income tax benefits of $303 (519) (519)Unrealized holding gain on marketable equity
securities, net of income taxes of $5 9 9Unrealized cash flow hedging loss,
net of income tax benefits of $12 (23) (23)December 31, 2001 $ 5,090 $ (4,404) $ 9,149 $ (1,466) $ 1,263Common Stock issued under employee plans
(4.2 million shares), including tax benefit of$45 247 10 (56)Common Stock contributed to defined benefit
pension plans (4.1 million shares) 110 143Common Stock repurchased (10.9 million shares) (700)Dividends on Common Stock ($.98 per share) (462)Dividends on ESOP Preferred Stock ($4.80 per share) (31)Non-Shareowners’ Changes in Equity:
Net income 2,236 $ 2,236Foreign currency translation adjustments 57 57Minimum pension liability adjustments,
net of income tax benefits of $927 (1,588) (1,588)Unrealized holding loss on marketable equity securities,
net of income tax benefits of $4 (7) (7)Unrealized cash flow hedging gain,
net of income taxes of $14 27 27December 31, 2002 $ 5,447 $ (4,951) $ 10,836 $ (2,977) $ 725Common Stock issued under employee plans
(7.9 million shares), including tax benefit of $111 442 17 (104) $ 1Common Stock – ESOP conversion (42.5 million shares) 698 (274)Common Stock repurchased (5.9 million shares) (401)Dividends on Common Stock ($1.14 per share), (533)Dividends on ESOP Preferred and Common Stock
($3.60 and $.35 per share, respectively) (33)Non-Shareowners’ Changes in Equity:
Net income 2,361 $2,361Foreign currency translation adjustments 528 528Minimum pension liability adjustments,
net of income taxes of $332 570 570Unrealized holding gain on marketable equity securities,
net of income taxes of $18 29 29Unrealized cash flow hedging gain,
net of income taxes of $23 51 51December 31, 2003 $6,587 $ (5,335) $12,527 $(273) $(1,799) $3,539
See accompanying Notes to Consolidated Financial Statements

2 2 U N I T E D T E C H N O L O G I E S
N O T E S T O C O N S O L I D A T E D F I N A N C I A L S T A T E M E N T S
Summary of Accounting Principles The preparation of financial statements requires managementto make estimates and assumptions that affect the reportedamounts of assets, liabilities, revenues and expenses. Actualresults could differ from those estimates.
Certain reclassifications have been made to prior yearamounts to conform to the current year presentation.
CONSOLIDATION. The consolidated financial statementsinclude the accounts of the Corporation and its controlled subsidiaries. Intercompany transactions have been eliminated.
CASH AND CASH EQUIVALENTS. Cash and cash equivalentsincludes cash on hand, demand deposits and short-term cashinvestments which are highly liquid in nature and have originalmaturities of three months or less.
ACCOUNTS RECEIVABLE. Current and long-term accountsreceivable include:
IN MILLIONS OF DOLLARS 2003 2002
Retainage $ 53 $ 40Unbilled receivables $199 $180
Costs accumulated against specific contracts or orders areat actual cost. Materials in excess of requirements for contractsand current or anticipated orders have been reserved asappropriate.
Manufacturing costs are allocated to current productionand firm contracts.
FIXED ASSETS. Fixed assets are stated at cost. Depreciationis computed over the assets’ useful lives using the straight-linemethod, except for aerospace assets acquired prior to January1, 1999, which are depreciated using accelerated methods.
GOODWILL AND OTHER INTANGIBLE ASSETS. Goodwillrepresents costs in excess of fair values assigned to the under-lying net assets of acquired businesses and was historicallyamortized using the straight-line method of amortization overperiods that ranged from 10 to 40 years. Effective July 1,2001, the Corporation adopted the provisions of Statement ofFinancial Accounting Standards (“SFAS”) No. 141, “BusinessCombinations” and SFAS No. 142, “Goodwill and OtherIntangible Assets,” applicable to business combinations com-pleted after June 30, 2001. In accordance with these standards,goodwill acquired after June 30, 2001 is not amortized.
As of January 1, 2002, the remaining provisions of SFASNo. 141 and No. 142 were effective for the Corporation.These standards require the use of the purchase method ofaccounting for business combinations, set forth the accountingfor the initial recognition of acquired intangible assets andgoodwill, and describe the accounting for intangible assetsand goodwill subsequent to initial recognition. Under the provisions of these standards, goodwill and intangible assetsdeemed to have indefinite lives are no longer subject to amor-tization. All other intangible assets are amortized over their estimated useful lives. Goodwill and intangible assets are subjectto annual impairment testing using the guidance and criteriadescribed in the standards. This testing compares carrying values to fair values and when appropriate, the carrying valueof these assets is required to be reduced to fair value.
Prior to the adoption of SFAS No. 142, the Corporationevaluated potential impairment of goodwill on an ongoingbasis and of other intangible assets when appropriate. Thisevaluation compared the carrying value of assets to the sum ofthe undiscounted expected future cash flows. If an asset’s carrying value exceeded the expected cash flows, the assetwas written down to fair value.
OTHER LONG-LIVED ASSETS. The Corporation evaluatesthe potential impairment of other long-lived assets whenappropriate. If the carrying value of assets exceeds the sum ofthe undiscounted expected future cash flows, the carryingvalue of the asset is written down to fair value.
N O T E 1
Retainage represents amounts which, pursuant to the contract, are not due until project completion and acceptanceby the customer. Unbilled receivables represent revenues thatare not currently billable to the customer under the terms of thecontract. These items are expected to be collected in the normal course of business. Long-term accounts receivable areincluded in Other assets in the Consolidated Balance Sheet.
MARKETABLE EQUITY SECURITIES. Equity securities thathave a readily determinable fair value and management doesnot intend to hold are classified as available for sale and carriedat fair value. Unrealized holding gains and losses are recordedas a separate component of shareowners’ equity, net ofdeferred income taxes.
INVENTORIES AND CONTRACTS IN PROGRESS. Inventoriesand contracts in progress are stated at the lower of cost orestimated realizable value and are primarily based on first-in,first-out (“FIFO”) or average cost methods; however, certainsubsidiaries use the last-in, first-out (“LIFO”) method. If inventories which were valued using the LIFO method hadbeen valued under the FIFO method, they would have beenhigher by $96 million and $103 million at December 31, 2003and 2002, respectively.

2 0 0 3 A N N U A L R E P O R T 2 3
REVENUE RECOGNITION. Sales under government andcommercial fixed-price contracts and government fixed-price-incentive contracts are recorded at the time deliveries aremade or, in some cases, on a percentage-of-completion basis.Sales under cost-reimbursement contracts are recorded aswork is performed.
Sales under elevator and escalator installation and modern-ization contracts are accounted for under the percentage-of-completion method.
Losses, if any, on contracts are provided for when antici-pated. Loss provisions are based upon excess inventoriablemanufacturing, engineering, estimated product warranty andproduct performance guarantee costs in excess of the revenuefrom products contemplated under the contractual arrangement.Contract accounting requires estimates of future costs overthe performance period of the contract as well as estimates ofaward fees and other sources of revenue. These estimates aresubject to change and result in adjustments to margins on contracts in progress. The extent of progress toward completionon the Corporation’s long-term commercial aerospace and helicopter contracts is measured using units of delivery. Inaddition, the Corporation uses the cost-to-cost method fordevelopment contracts in the aerospace businesses and forelevator and escalator installation and modernization contracts.For long-term aftermarket contracts revenue is recognized overthe contract period in proportion to the costs expected to beincurred in performing services under the contract. TheCorporation reviews its cost estimates on significant contractson a quarterly basis, and for others, no less frequently thanannually, or when circumstances change and warrant a modifi-cation to a previous estimate. Adjustments to contract lossprovisions are recorded in earnings upon identification.
Service sales, representing aftermarket repair and mainte-nance activities, are recognized over the contractual period oras services are performed.
Revenues from engine programs under collaborationagreements are recorded as earned and the collaborator shareof revenue is recorded as a reduction of revenue at that time.Costs associated with engine programs under collaborationagreements are expensed as incurred. The collaborator shareof program costs is recorded as a reduction of the relatedexpense item at that time.
RESEARCH AND DEVELOPMENT. Research and developmentcosts not specifically covered by contracts and those related tothe Corporation-sponsored share of research and developmentactivity in connection with cost-sharing arrangements arecharged to expense as incurred.
Research and development costs incurred under contractswith customers are reported as a component of cost of productssold. Revenue from such contracts is recognized as productsales when earned.
HEDGING ACTIVITY. The Corporation uses derivative instru-ments, including swaps, forward contracts and options, tomanage certain foreign currency, interest rate and commodityprice exposures. Derivative instruments are viewed as riskmanagement tools by the Corporation and are not used fortrading or speculative purposes. Derivatives used for hedgingpurposes must be designated and effective as a hedge of theidentified risk exposure at the inception of the contract.Accordingly, changes in fair value of the derivative contractmust be highly correlated with changes in the fair value of theunderlying hedged item at inception of the hedge and over thelife of the hedge contract.
All derivative instruments are recorded on the balancesheet at fair value. Derivatives used to hedge foreign-currency-denominated balance sheet items are reported directly in earn-ings along with offsetting transaction gains and losses on theitems being hedged. Derivatives used to hedge forecastedcash flows associated with foreign currency commitments orforecasted commodity purchases are accounted for as cashflow hedges. Gains and losses on derivatives designated ascash flow hedges are recorded in other comprehensiveincome and reclassified to earnings in a manner that matchesthe timing of the earnings impact of the hedged transactions. Theineffective portion of all hedges, if any, is recognized currentlyin earnings.
ENVIRONMENTAL. Environmental investigatory, remediation,operating and maintenance costs are accrued when it is prob-able that a liability has been incurred and the amount can bereasonably estimated. The most likely cost to be incurred isaccrued based on an evaluation of currently available facts withrespect to each individual site, including existing technology,current laws and regulations and prior remediation experience.Where no amount within a range of estimates is more likely, theminimum is accrued. For sites with multiple responsible parties,the Corporation considers its likely proportionate share of theanticipated remediation costs and the ability of the other partiesto fulfill their obligations in establishing a provision for thosecosts. Liabilities with fixed or reliably determinable future cashpayments are discounted. Accrued environmental liabilities arenot reduced by potential insurance reimbursements.
STOCK-BASED COMPENSATION. As more fully described inNote 11, the Corporation has long-term incentive plans author-izing various types of market and performance based incentiveawards that may be granted to officers and employees. TheCorporation applies APB Opinion 25, “Accounting for StockIssued to Employees,” and related interpretations in accountingfor its long-term incentive plans. The exercise price of stockoptions is set on the grant date and may not be less than thefair market value per share on that date. Stock options have aterm of ten years and generally vest after three years.
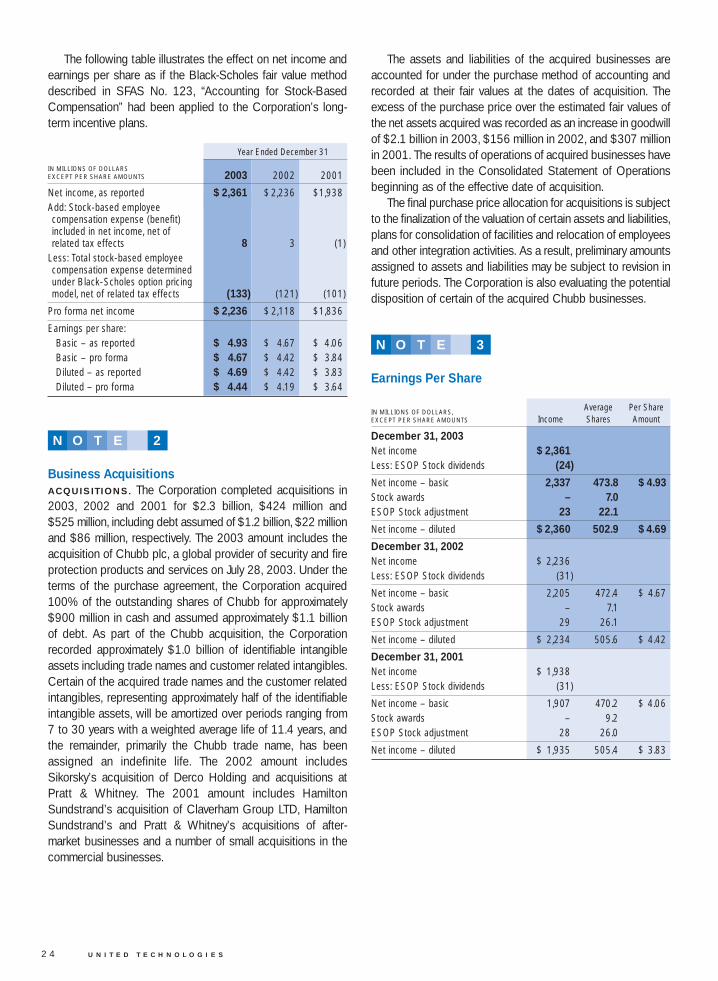
2 4 U N I T E D T E C H N O L O G I E S
The following table illustrates the effect on net income andearnings per share as if the Black-Scholes fair value methoddescribed in SFAS No. 123, “Accounting for Stock-BasedCompensation” had been applied to the Corporation’s long-term incentive plans.
Year Ended December 31
IN MILLIONS OF DOLLARSEXCEPT PER SHARE AMOUNTS 2003 2002 2001
Net income, as reported $ 2,361 $ 2,236 $1,938Add: Stock-based employeecompensation expense (benefit)included in net income, net ofrelated tax effects 8 3 (1)
Less: Total stock-based employee compensation expense determined under Black-Scholes option pricing model, net of related tax effects (133) (121) (101)
Pro forma net income $ 2,236 $ 2,118 $1,836
Earnings per share:Basic – as reported $ 4.93 $ 4.67 $ 4.06Basic – pro forma $ 4.67 $ 4.42 $ 3.84Diluted – as reported $ 4.69 $ 4.42 $ 3.83Diluted – pro forma $ 4.44 $ 4.19 $ 3.64
The assets and liabilities of the acquired businesses areaccounted for under the purchase method of accounting andrecorded at their fair values at the dates of acquisition. Theexcess of the purchase price over the estimated fair values ofthe net assets acquired was recorded as an increase in goodwillof $2.1 billion in 2003, $156 million in 2002, and $307 millionin 2001. The results of operations of acquired businesses havebeen included in the Consolidated Statement of Operationsbeginning as of the effective date of acquisition.
The final purchase price allocation for acquisitions is subjectto the finalization of the valuation of certain assets and liabilities,plans for consolidation of facilities and relocation of employeesand other integration activities. As a result, preliminary amountsassigned to assets and liabilities may be subject to revision infuture periods. The Corporation is also evaluating the potential disposition of certain of the acquired Chubb businesses.
N O T E 2
Business AcquisitionsACQUISITIONS. The Corporation completed acquisitions in2003, 2002 and 2001 for $2.3 billion, $424 million and $525 million, including debt assumed of $1.2 billion, $22 millionand $86 million, respectively. The 2003 amount includes theacquisition of Chubb plc, a global provider of security and fireprotection products and services on July 28, 2003. Under theterms of the purchase agreement, the Corporation acquired100% of the outstanding shares of Chubb for approximately$900 million in cash and assumed approximately $1.1 billionof debt. As part of the Chubb acquisition, the Corporationrecorded approximately $1.0 billion of identifiable intangibleassets including trade names and customer related intangibles.Certain of the acquired trade names and the customer relatedintangibles, representing approximately half of the identifiableintangible assets, will be amortized over periods ranging from7 to 30 years with a weighted average life of 11.4 years, andthe remainder, primarily the Chubb trade name, has beenassigned an indefinite life. The 2002 amount includesSikorsky’s acquisition of Derco Holding and acquisitions atPratt & Whitney. The 2001 amount includes HamiltonSundstrand’s acquisition of Claverham Group LTD, HamiltonSundstrand’s and Pratt & Whitney’s acquisitions of after-market businesses and a number of small acquisitions in thecommercial businesses.
N O T E 3
Earnings Per Share
IN MILLIONS OF DOLLARS,Average Per Share
EXCEPT PER SHARE AMOUNTS Income Shares Amount
December 31, 2003Net income $ 2,361Less: ESOP Stock dividends (24)
Net income – basic 2,337 473.8 $ 4.93Stock awards – 7.0ESOP Stock adjustment 23 22.1
Net income – diluted $2,360 502.9 $4.69
December 31, 2002Net income $ 2,236Less: ESOP Stock dividends (31)
Net income – basic 2,205 472.4 $ 4.67Stock awards – 7.1ESOP Stock adjustment 29 26.1
Net income – diluted $ 2,234 505.6 $ 4.42
December 31, 2001Net income $ 1,938Less: ESOP Stock dividends (31)
Net income – basic 1,907 470.2 $ 4.06Stock awards – 9.2ESOP Stock adjustment 28 26.0
Net income – diluted $ 1,935 505.4 $ 3.83
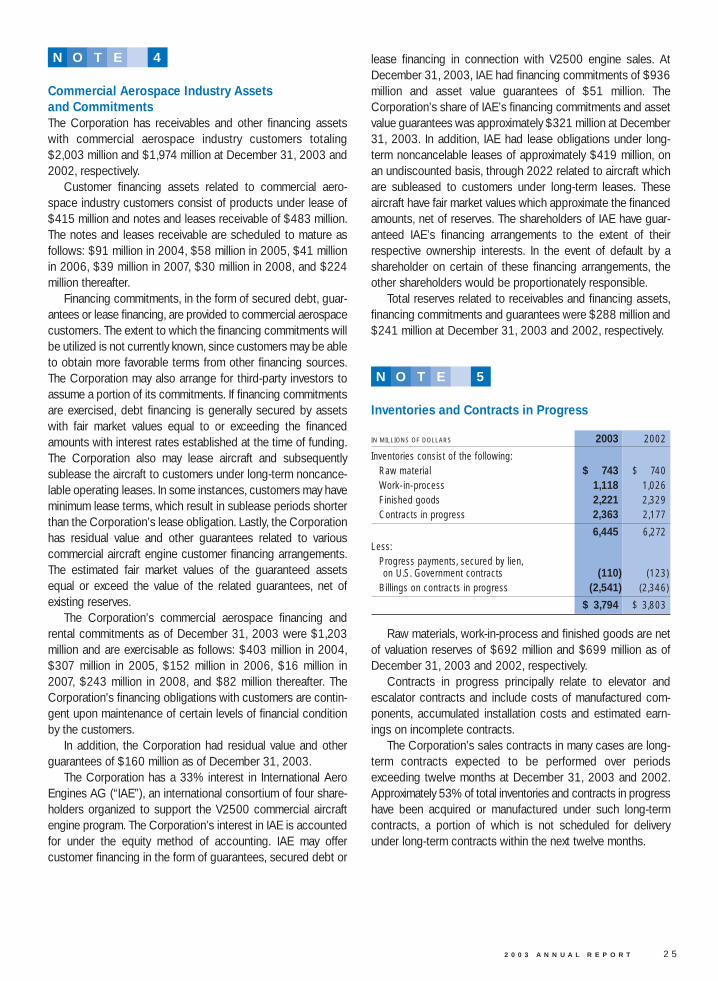
2 0 0 3 A N N U A L R E P O R T 2 5
Commercial Aerospace Industry Assets and Commitments The Corporation has receivables and other financing assetswith commercial aerospace industry customers totaling$2,003 million and $1,974 million at December 31, 2003 and2002, respectively.
Customer financing assets related to commercial aero-space industry customers consist of products under lease of$415 million and notes and leases receivable of $483 million.The notes and leases receivable are scheduled to mature asfollows: $91 million in 2004, $58 million in 2005, $41 millionin 2006, $39 million in 2007, $30 million in 2008, and $224million thereafter.
Financing commitments, in the form of secured debt, guar-antees or lease financing, are provided to commercial aerospacecustomers. The extent to which the financing commitments willbe utilized is not currently known, since customers may be ableto obtain more favorable terms from other financing sources.The Corporation may also arrange for third-party investors toassume a portion of its commitments. If financing commitmentsare exercised, debt financing is generally secured by assetswith fair market values equal to or exceeding the financedamounts with interest rates established at the time of funding.The Corporation also may lease aircraft and subsequently sublease the aircraft to customers under long-term noncance-lable operating leases. In some instances, customers may haveminimum lease terms, which result in sublease periods shorterthan the Corporation’s lease obligation. Lastly, the Corporationhas residual value and other guarantees related to variouscommercial aircraft engine customer financing arrangements.The estimated fair market values of the guaranteed assetsequal or exceed the value of the related guarantees, net ofexisting reserves.
The Corporation’s commercial aerospace financing andrental commitments as of December 31, 2003 were $1,203million and are exercisable as follows: $403 million in 2004,$307 million in 2005, $152 million in 2006, $16 million in2007, $243 million in 2008, and $82 million thereafter. TheCorporation’s financing obligations with customers are contin-gent upon maintenance of certain levels of financial conditionby the customers.
In addition, the Corporation had residual value and otherguarantees of $160 million as of December 31, 2003.
The Corporation has a 33% interest in International AeroEngines AG (“IAE”), an international consortium of four share-holders organized to support the V2500 commercial aircraftengine program. The Corporation’s interest in IAE is accountedfor under the equity method of accounting. IAE may offer customer financing in the form of guarantees, secured debt or
lease financing in connection with V2500 engine sales. AtDecember 31, 2003, IAE had financing commitments of $936million and asset value guarantees of $51 million. TheCorporation’s share of IAE’s financing commitments and assetvalue guarantees was approximately $321 million at December31, 2003. In addition, IAE had lease obligations under long-term noncancelable leases of approximately $419 million, onan undiscounted basis, through 2022 related to aircraft whichare subleased to customers under long-term leases. These aircraft have fair market values which approximate the financedamounts, net of reserves. The shareholders of IAE have guar-anteed IAE’s financing arrangements to the extent of theirrespective ownership interests. In the event of default by ashareholder on certain of these financing arrangements, theother shareholders would be proportionately responsible.
Total reserves related to receivables and financing assets,financing commitments and guarantees were $288 million and$241 million at December 31, 2003 and 2002, respectively.
N O T E 5
Inventories and Contracts in Progress
IN MILLIONS OF DOLLARS 2003 2002
Inventories consist of the following:Raw material $ 743 $ 740Work-in-process 1,118 1,026Finished goods 2,221 2,329Contracts in progress 2,363 2,177
6,445 6,272Less:
Progress payments, secured by lien, on U.S. Government contracts (110) (123)
Billings on contracts in progress (2,541) (2,346)
$ 3,794 $ 3,803
N O T E 4
Raw materials, work-in-process and finished goods are netof valuation reserves of $692 million and $699 million as ofDecember 31, 2003 and 2002, respectively.
Contracts in progress principally relate to elevator andescalator contracts and include costs of manufactured com-ponents, accumulated installation costs and estimated earn-ings on incomplete contracts.
The Corporation’s sales contracts in many cases are long-term contracts expected to be performed over periods exceeding twelve months at December 31, 2003 and 2002.Approximately 53% of total inventories and contracts in progresshave been acquired or manufactured under such long-termcontracts, a portion of which is not scheduled for deliveryunder long-term contracts within the next twelve months.

2 6 U N I T E D T E C H N O L O G I E S
Goodwill and Other Intangible AssetsEffective January 1, 2002, the Corporation ceased the amortization of goodwill in accordance with SFAS No. 142.Results adjusted to exclude amounts no longer being amortized,are as follows:
IN MILLIONS OF DOLLARS EXCEPT PER SHARE AMOUNTS 2003 2002 2001
Reported net income $ 2,361 $2,236 $1,938Adjustments:
Goodwill amortization – – 230Income taxes – – (16)Minority interest in subsidiaries’ earnings – – (2)
Adjusted net income $ 2,361 $2,236 $2,150
Basic earnings per shareReported $ 4.93 $ 4.67 $ 4.06Adjusted $ 4.93 $ 4.67 $ 4.51
Diluted earnings per shareReported $ 4.69 $ 4.42 $ 3.83Adjusted $ 4.69 $ 4.42 $ 4.25
The changes in the carrying amount of goodwill for the year ended December 31, 2003, by segment, are as follows:
Pratt & Flight Total EliminationsIN MILLIONS OF DOLLARS Otis Carrier Chubb Whitney Systems Segments and Other Total
Balance as of January 1, 2003 $ 753 $ 2,000 $ – $ 451 $ 3,781 $ 6,985 $ (4) $ 6,981Goodwill resulting from businesscombinations completed or finalized 141 11 1,922 5 (1) 2,078 (6) 2,072
Foreign currency translation and other 17 48 174 6 27 272 4 276
Balance as of December 31, 2003 $911 $ 2,059 $2,096 $462 $ 3,807 $ 9,335 $ (6) $ 9,329
N O T E 6
Fixed Assets
EstimatedIN MILLIONS OF DOLLARS Useful Lives 2003 2002
Land $ 217 $ 196Buildings and improvements 20-40 years 4,026 3,552Machinery, tools and equipment 3-20 years 7,597 6,904Other, including under construction 242 217
12,082 10,869Accumulated depreciation (7,002) (6,282)
$ 5,080 $ 4,587
N O T E 7
The increase in goodwill during 2003 resulted principallyfrom business combinations completed or finalized in theperiod. Effective July 28, 2003, the Corporation acquiredChubb plc. Under the terms of the purchase agreement, theCorporation acquired 100% of the outstanding shares ofChubb for approximately $900 million in cash and assumedapproximately $1.1 billion of debt. As part of the Chubbacquisition, the Corporation recorded approximately $1 billionof identifiable intangible assets, including trade names andcustomer related intangibles. Certain of the acquired tradenames and the customer related intangibles, representingapproximately half of the identifiable intangible assets, will beamortized over periods ranging from 7 to 30 years with aweighted average life of 11.4 years, and the remainder,primarily the Chubb trade name, has been assigned an
indefinite life. The excess of the purchase price over theestimated fair values of the net assets acquired of $2.1 billion,including foreign currency translation of $174 million, has beenrecorded as goodwill. The final purchase price allocation issubject to the finalization of the valuation of certain assets andliabilities, plans for consolidation of facilities and relocation ofemployees and other integration activities. As a result,preliminary amounts assigned to assets and liabilities will besubject to revision in future periods. The Corporation is alsoevaluating potential disposition of certain of the acquiredChubb businesses. Goodwill is subject to annual impairmenttesting as required under SFAS No. 142. As of December 31,2003, the Corporation was not required to recognize anygoodwill impairment. There can be no assurance that goodwillimpairment will not occur in the future.
Depreciation expense was $677 million in 2003, $640 millionin 2002 and $616 million in 2001.

2 0 0 3 A N N U A L R E P O R T 2 7
Identifiable intangible assets as of December 31, 2003 arerecorded in Other assets in the Consolidated Balance Sheetand are comprised of the following:
2003 2002
Gross Accumulated Gross AccumulatedIN MILLIONS OF DOLLARS Amount Amortization Amount Amortization
Amortized intangible assetsPurchased service contracts $ 894 $ (275) $ 684 $ (199)
Patents and trademarks 197 (34) 152 (26)Other, principally customer relationships 581 (51) 60 (17)
$1,672 $ (360) $ 896 $ (242)
Unamortized intangible assetsTrademarks $ 583 $ – $ – $ –
The weighted-average interest rates applicable to short-term borrowings outstanding at December 31, 2003 and 2002were 3.2% and 7.0%, respectively. At December 31, 2003,approximately $1.3 billion was available under short-term linesof credit with local banks at the Corporation’s various interna-tional subsidiaries.
At December 31, 2003, the Corporation had credit com-mitments from banks totaling $1.5 billion under a RevolvingCredit Agreement, which serves as a back-up facility forissuance of commercial paper. There were no borrowingsunder the Revolving Credit Agreement at December 31, 2003.
Long-term debt consists of the following:
WeightedAverage
IN MILLIONS OF DOLLARS Interest Rate Maturity 2003 2002
Notes and other debt denominated in:U.S. dollars 6.4% 2004-2029 $ 4,407 $ 4,425Foreign currency 5.4% 2004-2018 27 19
ESOP debt 7.7% 2004-2009 198 232
4,632 4,676Less: Long-term debt currently due 375 44
$ 4,257 $ 4,632
Amortization of intangible assets for the year endedDecember 31, 2003 was $86 million. Amortization of theseintangible assets during each of the next five years is expectedto approximate $100 million.
Accrued Liabilities
IN MILLIONS OF DOLLARS 2003 2002
Accrued salaries, wages and employee benefits $ 1,291 $1,056
Accrued restructuring costs 100 182Service and warranty accruals 534 690Advances on sales contracts 917 795Income taxes payable 521 381Other 3,021 2,345
$6,384 $5,449
N O T E 8
N O T E 9
Borrowings and Lines of Credit Short-term borrowings consist of the following:
IN MILLIONS OF DOLLARS 2003 2002
Domestic borrowings $ 8 $ 9Foreign bank borrowings 321 188Commercial paper 340 –
$ 669 $197
Principal payments required on long-term debt for the nextfive years are: $375 million in 2004, $44 million in 2005, $705million in 2006, $35 million in 2007, and $34 million in 2008.
The Corporation has entered into $225 million and $125million of interest rate contracts in 2003 and 2002, respec-tively, which swap fixed interest rates for floating rates. Theexpiration dates of the various contracts are tied to scheduleddebt payment dates and extend to 2006.
The Corporation issued $500 million of notes in 2002under shelf registration statements previously filed with theSecurities and Exchange Commission. The 2002 notes carryan interest rate of 6.10%. Proceeds from the debt issuanceswere used for general corporate purposes, including repay-ment of commercial paper, to support investment activities andrepurchasing the Corporation’s Common Stock.
At December 31, 2003, approximately $1.1 billion of addi-tional debt and equity securities could be issued under a shelfregistration statement on file with the Securities and ExchangeCommission.
The percentage of total debt at floating interest rates was19% and 13% at December 31, 2003 and 2002, respectively.
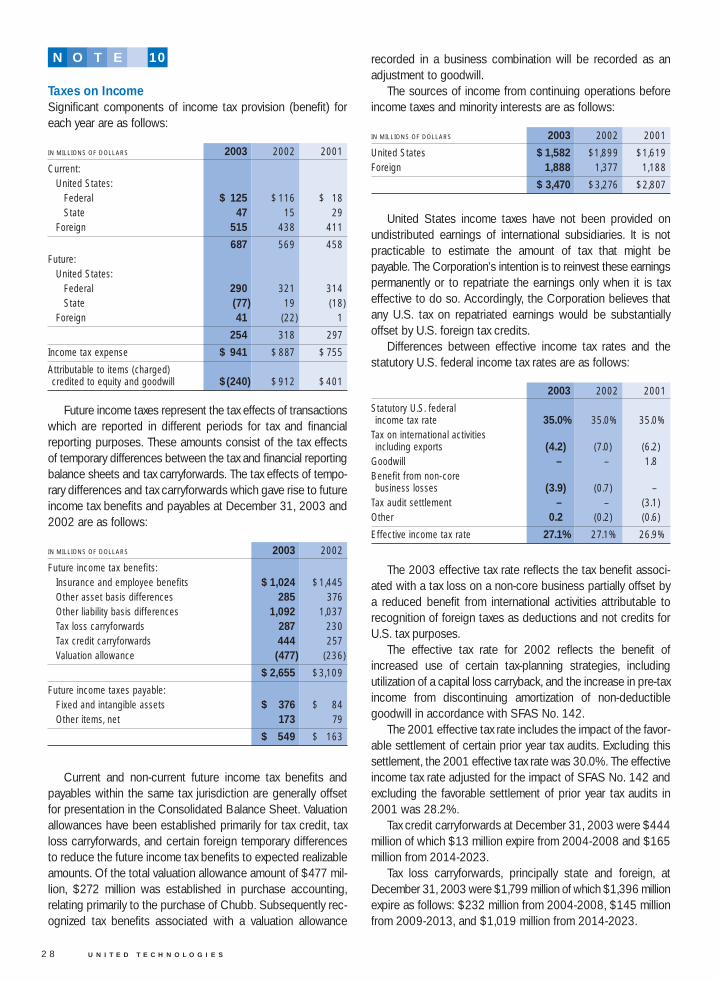
2 8 U N I T E D T E C H N O L O G I E S
Future income taxes represent the tax effects of transactionswhich are reported in different periods for tax and financialreporting purposes. These amounts consist of the tax effectsof temporary differences between the tax and financial reportingbalance sheets and tax carryforwards. The tax effects of tempo-rary differences and tax carryforwards which gave rise to futureincome tax benefits and payables at December 31, 2003 and2002 are as follows:
IN MILLIONS OF DOLLARS 2003 2002
Future income tax benefits:Insurance and employee benefits $ 1,024 $1,445Other asset basis differences 285 376Other liability basis differences 1,092 1,037Tax loss carryforwards 287 230Tax credit carryforwards 444 257Valuation allowance (477) (236)
$ 2,655 $3,109
Future income taxes payable: Fixed and intangible assets $ 376 $ 84Other items, net 173 79
$ 549 $ 163
recorded in a business combination will be recorded as anadjustment to goodwill.
The sources of income from continuing operations beforeincome taxes and minority interests are as follows:
IN MILLIONS OF DOLLARS 2003 2002 2001
United States $ 1,582 $1,899 $1,619Foreign 1,888 1,377 1,188
$ 3,470 $3,276 $2,807
Taxes on IncomeSignificant components of income tax provision (benefit) foreach year are as follows:
IN MILLIONS OF DOLLARS 2003 2002 2001
Current:United States:
Federal $ 125 $ 116 $ 18State 47 15 29
Foreign 515 438 411
687 569 458Future:
United States:Federal 290 321 314State (77) 19 (18)
Foreign 41 (22) 1
254 318 297
Income tax expense $ 941 $ 887 $ 755
Attributable to items (charged) credited to equity and goodwill $(240) $ 912 $401
N O T E 10
Current and non-current future income tax benefits andpayables within the same tax jurisdiction are generally offsetfor presentation in the Consolidated Balance Sheet. Valuationallowances have been established primarily for tax credit, taxloss carryforwards, and certain foreign temporary differencesto reduce the future income tax benefits to expected realizableamounts. Of the total valuation allowance amount of $477 mil-lion, $272 million was established in purchase accounting,relating primarily to the purchase of Chubb. Subsequently rec-ognized tax benefits associated with a valuation allowance
United States income taxes have not been provided onundistributed earnings of international subsidiaries. It is notpracticable to estimate the amount of tax that might bepayable. The Corporation’s intention is to reinvest these earningspermanently or to repatriate the earnings only when it is taxeffective to do so. Accordingly, the Corporation believes thatany U.S. tax on repatriated earnings would be substantially offset by U.S. foreign tax credits.
Differences between effective income tax rates and thestatutory U.S. federal income tax rates are as follows:
2003 2002 2001
Statutory U.S. federalincome tax rate 35.0% 35.0% 35.0%
Tax on international activities including exports (4.2) (7.0) (6.2)
Goodwill .– .– 1.8Benefit from non-core business losses (3.9) (0.7) .–
Tax audit settlement .– .– (3.1)Other 0.2 (0.2) (0.6)
Effective income tax rate 27.1% 27.1% 26.9%
The 2003 effective tax rate reflects the tax benefit associ-ated with a tax loss on a non-core business partially offset bya reduced benefit from international activities attributable torecognition of foreign taxes as deductions and not credits forU.S. tax purposes.
The effective tax rate for 2002 reflects the benefit ofincreased use of certain tax-planning strategies, including utilization of a capital loss carryback, and the increase in pre-taxincome from discontinuing amortization of non-deductiblegoodwill in accordance with SFAS No. 142.
The 2001 effective tax rate includes the impact of the favor-able settlement of certain prior year tax audits. Excluding thissettlement, the 2001 effective tax rate was 30.0%. The effectiveincome tax rate adjusted for the impact of SFAS No. 142 andexcluding the favorable settlement of prior year tax audits in2001 was 28.2%.
Tax credit carryforwards at December 31, 2003 were $444million of which $13 million expire from 2004-2008 and $165million from 2014-2023.
Tax loss carryforwards, principally state and foreign, atDecember 31, 2003 were $1,799 million of which $1,396 millionexpire as follows: $232 million from 2004-2008, $145 millionfrom 2009-2013, and $1,019 million from 2014-2023.
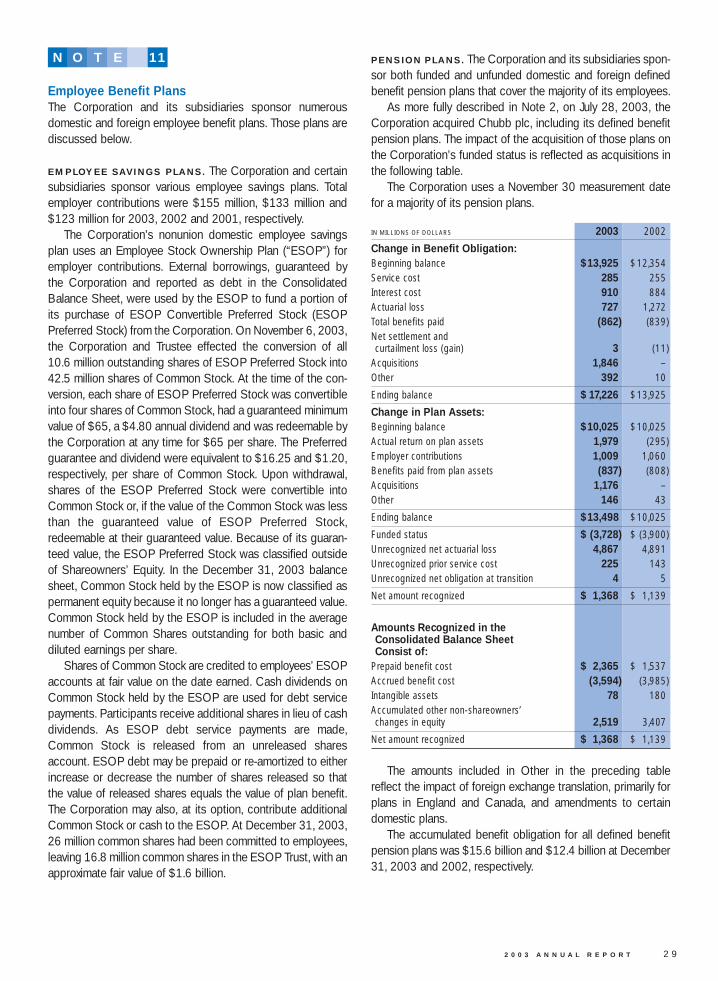
2 0 0 3 A N N U A L R E P O R T 2 9
Employee Benefit Plans The Corporation and its subsidiaries sponsor numerousdomestic and foreign employee benefit plans. Those plans arediscussed below.
EMPLOYEE SAVINGS PLANS. The Corporation and certainsubsidiaries sponsor various employee savings plans. Totalemployer contributions were $155 million, $133 million and$123 million for 2003, 2002 and 2001, respectively.
The Corporation’s nonunion domestic employee savingsplan uses an Employee Stock Ownership Plan (“ESOP”) foremployer contributions. External borrowings, guaranteed bythe Corporation and reported as debt in the ConsolidatedBalance Sheet, were used by the ESOP to fund a portion ofits purchase of ESOP Convertible Preferred Stock (ESOPPreferred Stock) from the Corporation. On November 6, 2003,the Corporation and Trustee effected the conversion of all 10.6 million outstanding shares of ESOP Preferred Stock into42.5 million shares of Common Stock. At the time of the con-version, each share of ESOP Preferred Stock was convertibleinto four shares of Common Stock, had a guaranteed minimumvalue of $65, a $4.80 annual dividend and was redeemable bythe Corporation at any time for $65 per share. The Preferred guarantee and dividend were equivalent to $16.25 and $1.20,respectively, per share of Common Stock. Upon withdrawal,shares of the ESOP Preferred Stock were convertible intoCommon Stock or, if the value of the Common Stock was lessthan the guaranteed value of ESOP Preferred Stock,redeemable at their guaranteed value. Because of its guaran-teed value, the ESOP Preferred Stock was classified outsideof Shareowners’ Equity. In the December 31, 2003 balancesheet, Common Stock held by the ESOP is now classified aspermanent equity because it no longer has a guaranteed value.Common Stock held by the ESOP is included in the averagenumber of Common Shares outstanding for both basic anddiluted earnings per share.
Shares of Common Stock are credited to employees’ ESOPaccounts at fair value on the date earned. Cash dividends onCommon Stock held by the ESOP are used for debt servicepayments. Participants receive additional shares in lieu of cashdividends. As ESOP debt service payments are made,Common Stock is released from an unreleased sharesaccount. ESOP debt may be prepaid or re-amortized to eitherincrease or decrease the number of shares released so thatthe value of released shares equals the value of plan benefit.The Corporation may also, at its option, contribute additionalCommon Stock or cash to the ESOP. At December 31, 2003,26 million common shares had been committed to employees,leaving 16.8 million common shares in the ESOP Trust, with anapproximate fair value of $1.6 billion.
PENSION PLANS. The Corporation and its subsidiaries spon-sor both funded and unfunded domestic and foreign definedbenefit pension plans that cover the majority of its employees.
As more fully described in Note 2, on July 28, 2003, theCorporation acquired Chubb plc, including its defined benefitpension plans. The impact of the acquisition of those plans onthe Corporation’s funded status is reflected as acquisitions inthe following table.
The Corporation uses a November 30 measurement datefor a majority of its pension plans.
IN MILLIONS OF DOLLARS 2003 2002
Change in Benefit Obligation:Beginning balance $13,925 $12,354Service cost 285 255Interest cost 910 884Actuarial loss 727 1,272Total benefits paid (862) (839)Net settlement and curtailment loss (gain) 3 (11)
Acquisitions 1,846 –Other 392 10
Ending balance $ 17,226 $13,925
Change in Plan Assets:Beginning balance $10,025 $10,025Actual return on plan assets 1,979 (295)Employer contributions 1,009 1,060Benefits paid from plan assets (837) (808)Acquisitions 1,176 –Other 146 43
Ending balance $13,498 $10,025
Funded status $ (3,728) $ (3,900)Unrecognized net actuarial loss 4,867 4,891Unrecognized prior service cost 225 143Unrecognized net obligation at transition 4 5
Net amount recognized $ 1,368 $ 1,139
Amounts Recognized in the Consolidated Balance Sheet Consist of:
Prepaid benefit cost $ 2,365 $ 1,537Accrued benefit cost (3,594) (3,985)Intangible assets 78 180Accumulated other non-shareowners’ changes in equity 2,519 3,407
Net amount recognized $ 1,368 $ 1,139
The amounts included in Other in the preceding tablereflect the impact of foreign exchange translation, primarily forplans in England and Canada, and amendments to certaindomestic plans.
The accumulated benefit obligation for all defined benefitpension plans was $15.6 billion and $12.4 billion at December31, 2003 and 2002, respectively.
N O T E 11
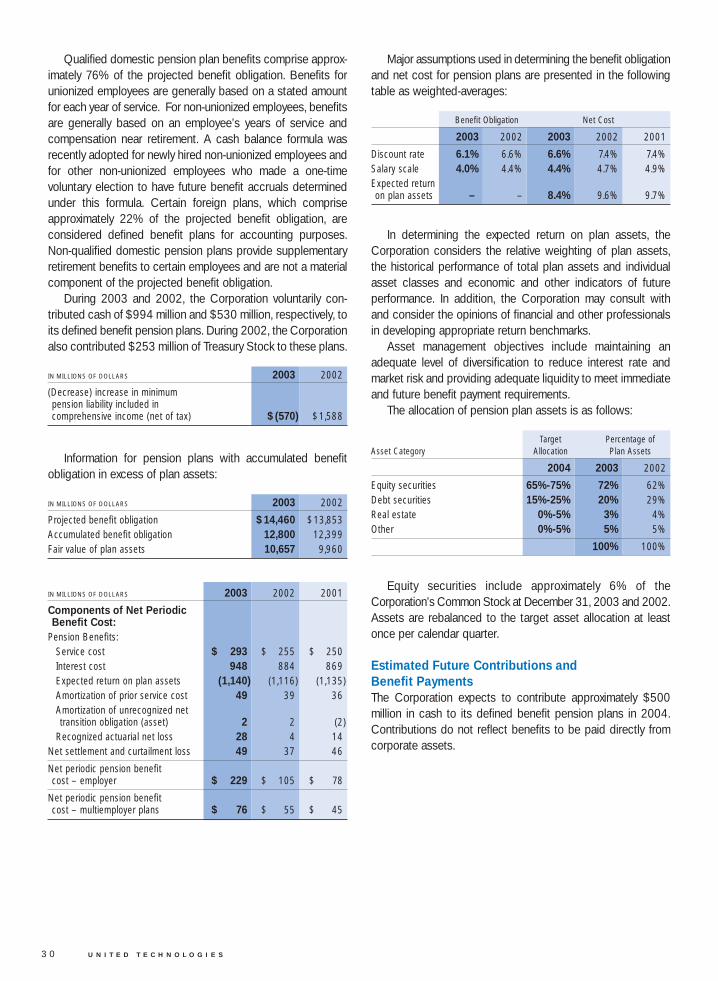
3 0 U N I T E D T E C H N O L O G I E S
Qualified domestic pension plan benefits comprise approx-imately 76% of the projected benefit obligation. Benefits forunionized employees are generally based on a stated amountfor each year of service. For non-unionized employees, benefitsare generally based on an employee’s years of service andcompensation near retirement. A cash balance formula wasrecently adopted for newly hired non-unionized employees andfor other non-unionized employees who made a one-time voluntary election to have future benefit accruals determinedunder this formula. Certain foreign plans, which compriseapproximately 22% of the projected benefit obligation, areconsidered defined benefit plans for accounting purposes.Non-qualified domestic pension plans provide supplementaryretirement benefits to certain employees and are not a materialcomponent of the projected benefit obligation.
During 2003 and 2002, the Corporation voluntarily con-tributed cash of $994 million and $530 million, respectively, toits defined benefit pension plans. During 2002, the Corporationalso contributed $253 million of Treasury Stock to these plans.
IN MILLIONS OF DOLLARS 2003 2002
(Decrease) increase in minimum pension liability included in comprehensive income (net of tax) $(570) $1,588
Major assumptions used in determining the benefit obligationand net cost for pension plans are presented in the followingtable as weighted-averages:
Benefit Obligation Net Cost
2003 2002 2003 2002 2001
Discount rate 6.1% 6.6% 6.6% 7.4% 7.4%Salary scale 4.0% 4.4% 4.4% 4.7% 4.9%Expected return on plan assets – – 8.4% 9.6% 9.7%
In determining the expected return on plan assets, theCorporation considers the relative weighting of plan assets,the historical performance of total plan assets and individualasset classes and economic and other indicators of future performance. In addition, the Corporation may consult withand consider the opinions of financial and other professionalsin developing appropriate return benchmarks.
Asset management objectives include maintaining an adequate level of diversification to reduce interest rate andmarket risk and providing adequate liquidity to meet immediateand future benefit payment requirements.
The allocation of pension plan assets is as follows:
Target Percentage of Asset Category Allocation Plan Assets
2004 2003 2002
Equity securities 65%-75% 72% 62%Debt securities 15%-25% 20% 29%Real estate 0%-5% 3% 4%Other 0%-5% 5% 5%
100% 100%
Equity securities include approximately 6% of theCorporation’s Common Stock at December 31, 2003 and 2002.Assets are rebalanced to the target asset allocation at leastonce per calendar quarter.
Estimated Future Contributions andBenefit PaymentsThe Corporation expects to contribute approximately $500million in cash to its defined benefit pension plans in 2004.Contributions do not reflect benefits to be paid directly fromcorporate assets.
Information for pension plans with accumulated benefitobligation in excess of plan assets:
IN MILLIONS OF DOLLARS 2003 2002
Projected benefit obligation $14,460 $13,853Accumulated benefit obligation 12,800 12,399Fair value of plan assets 10,657 9,960
IN MILLIONS OF DOLLARS 2003 2002 2001
Components of Net Periodic Benefit Cost:
Pension Benefits:Service cost $ 293 $ 255 $ 250Interest cost 948 884 869Expected return on plan assets (1,140) (1,116) (1,135)Amortization of prior service cost 49 39 36Amortization of unrecognized net transition obligation (asset) 2 2 (2)
Recognized actuarial net loss 28 4 14Net settlement and curtailment loss 49 37 46
Net periodic pension benefit cost – employer $ 229 $ 105 $ 78
Net periodic pension benefit cost – multiemployer plans $ 76 $ 55 $ 45

2 0 0 3 A N N U A L R E P O R T 3 1
Benefit payments, including amounts to be paid from corporate assets, and reflecting expected future service, asappropriate, are expected to be paid as follows:
IN MILLIONS OF DOLLARS
2004 $ 9592005 9762006 9942007 1,0192008 1,0482009-2013 5,751
IN MILLIONS OF DOLLARS 2003 2002
Change in Benefit Obligation:Beginning balance $ 997 $ 1,040Service cost 8 11Interest cost 65 73Actuarial loss 77 16Total benefits paid (127) (114)Net settlement and curtailment loss (gain) 8 (59)Other 37 30
Ending balance $ 1,065 $ 997
Change in Plan Assets:Beginning balance $ 53 $ 62Actual return on plan assets 4 (1)Employer contributions 7 1Benefits paid from plan assets (14) (13)Other 5 4
Ending balance $ 55 $ 53
Funded status $(1,010) $ (944)Unrecognized net actuarial gain (8) (102)Unrecognized prior service cost (74) (94)Unrecognized net obligation at transition – –
Net amount recognized $(1,092) $(1,140)
Amounts Recognized in the Consolidated Balance Sheet Consist of:
Accrued benefit liability $(1,092) $(1,140)
IN MILLIONS OF DOLLARS 2003 2002 2001
Components of Net Periodic Benefit Cost:
Other Postretirement Benefits:Service cost $ 8 $ 11 $ 15Interest cost 64 73 85Expected return on plan assets (4) (5) (7)Amortization of prior service cost (21) (19) (13)
Net settlement and curtailment gain (15) (57) (3)
Net periodic other postretirement benefit cost $ 32 $ 3 $ 77
POSTRETIREMENT BENEFIT PLANS. The Corporation andits subsidiaries also sponsor a number of postretirement benefit plans that provide health and life benefits to eligibleretirees. Such benefits are provided primarily from domesticplans which comprise approximately 90% of the benefit obli-gation. The other postretirement plans are primarily unfunded.The allocation of assets in funded plans is approximately 70%equity and 30% fixed income.
During 2002, the Corporation modified the postretirementmedical and life insurance benefits provided to certain employeesresulting in the recognition of a $43 million curtailment gain.The gain was recorded in segment cost of products sold andselling, general and administrative expenses.
In December 2003, the Medicare Prescription Drug,Improvement and Modernization Act of 2003 (the “Act”) wassigned into law. The Act introduced a plan sponsor subsidybased on a percentage of a beneficiary’s annual prescriptiondrug benefits, within defined limits, and the opportunity for aretiree to obtain prescription drug benefits under Medicare.
Certain employees are covered under legacy benefit provi-sions that include prescription drug coverage for Medicare-eligible retirees. In order to coordinate this coverage with theAct, the Corporation plans to complete a strategic review of itspostretirement plans during the two year transitional periodprovided in the Act. In accordance with FASB Staff PositionFAS 106-1, the benefit obligation and net periodic benefit costdo not reflect any potential effects of the Act. Since theCorporation has already taken steps to limit its postretirementmedical benefits, any reductions in postretirement benefitcosts resulting from the Act are not expected to be material.
The Corporation uses a November 30 measurement datefor a majority of its postretirement benefit plans.
Major assumptions used in determining the benefit obliga-tion and net cost for postretirement plans are presented in thefollowing table as weighted-averages:
Benefit Obligation Net Cost
2003 2002 2003 2002 2001
Discount rate 6.3% 6.7% 6.7% 7.5% 7.5%Expected return on plan assets – – 8.3% 9.6% 9.6%

3 2 U N I T E D T E C H N O L O G I E S
Assumed health care cost trend rates are as follows:
2003 2002
Health care cost trend rate assumed for next year 10% 10%
Rate that the cost trend rate gradually declines to 5% 5%
Year that the rate reaches the rate it is assumed to remain at 2014 2013
A summary of the transactions under all plans for the threeyears ended December 31, 2003 follows:
Stock Options OtherAverage Incentive
SHARES AND UNITS IN THOUSANDS Shares Price Shares/Units
Outstanding at:December 31, 2000 42,392 $ 40.93 483
Granted 8,255 75.60 78Exercised/earned (6,206) 26.83 (127)Canceled (1,292) 66.33 (40)
December 31, 2001 43,149 $ 48.85 394Granted 10,313 65.18 280Exercised/earned (4,031) 32.01 (88)Canceled (1,383) 68.99 (16)
December 31, 2002 48,048 $ 53.19 570Granted 6,612 62.75 47Exercised/earned (8,577) 36.58 (292)Canceled (993) 62.14 (3)
December 31, 2003 45,090 $57.55 322
Options in the above table include options issued in con-nection with business combinations.
The following table summarizes information about stockoptions outstanding and exercisable (in thousands) atDecember 31, 2003:
Options Outstanding Options Exercisable
Average Remaining AverageExercise Price Shares Price Term Shares Price
$10.01-$25.00 3,032 $19.91 1.40 3,032 $19.91$25.01-$40.00 6,722 35.01 3.10 6,722 35.01$40.01-$55.00 5,095 52.00 4.40 5,082 47.09$55.01-$70.00 20,506 63.86 7.60 5,223 58.00$70.01-$85.00 9,733 74.43 6.50 3,385 70.52$85.01-$100.00 2 85.80 9.80 – –
In accordance with SFAS No. 123, “Accounting for StockIssued to Employees,” the fair value of each stock option hasbeen estimated on the date of grant using the Black-Scholesoption-pricing model with the following weighted-averageassumptions:
2003 2002 2001
Risk-free interest rate 3.0% 4.4% 4.8%Expected life 5 years 5 years 5 yearsExpected volatility 39% 39% 36%Expected dividend yield 1.8% 1.6% 1.3%
Assumed health care cost trend rates have a significanteffect on the amounts reported for the health care plans. Aone-percentage-point change in assumed health care costtrend rates would have the following effects:
2003One-Percentage-Point
Increase Decrease
Effect on total service and interest cost 3 (3)Effect on postretirement benefit obligation 38 (36)
ESTIMATED FUTURE BENEFIT PAYMENTS. Benefit pay-ments, including net amounts to be paid from corporateassets, and reflecting expected future service, as appropriate,are expected to be paid as follows:
IN MILLIONS OF DOLLARS
2004 $ 932005 862006 852007 832008 792009-2013 346
STOCK-BASED COMPENSATION. The Corporation haslong-term incentive plans authorizing various types of marketand performance-based incentive awards, which may be grantedto officers and employees. The Corporation’s Long-TermIncentive Plan provides for the annual grant of awards in anamount not to exceed 2% of the aggregate shares of CommonStock, treasury shares and potentially dilutive common sharesfor the preceding year. The Long-Term Incentive Plan has a tenyear term from the date of the most recent shareownerapproval and will expire April 24, 2005 unless extended by amajority vote of shareowners. In addition, up to 4 millionoptions on Common Stock may be granted annually under theCorporation’s Employee Stock Option Plan. No more than 20million shares, in the aggregate, may be granted after June 30,2003 unless the plan is extended by a majority vote of shareowners. A table illustrating the effect on net income and earnings
per share as if the Black-Scholes fair value method had beenapplied to long-term incentive plans is presented in Note 1.
The weighted-average grant date fair values of optionsgranted during 2003, 2002 and 2001 were $20.82, $23.30and $24.83, respectively.
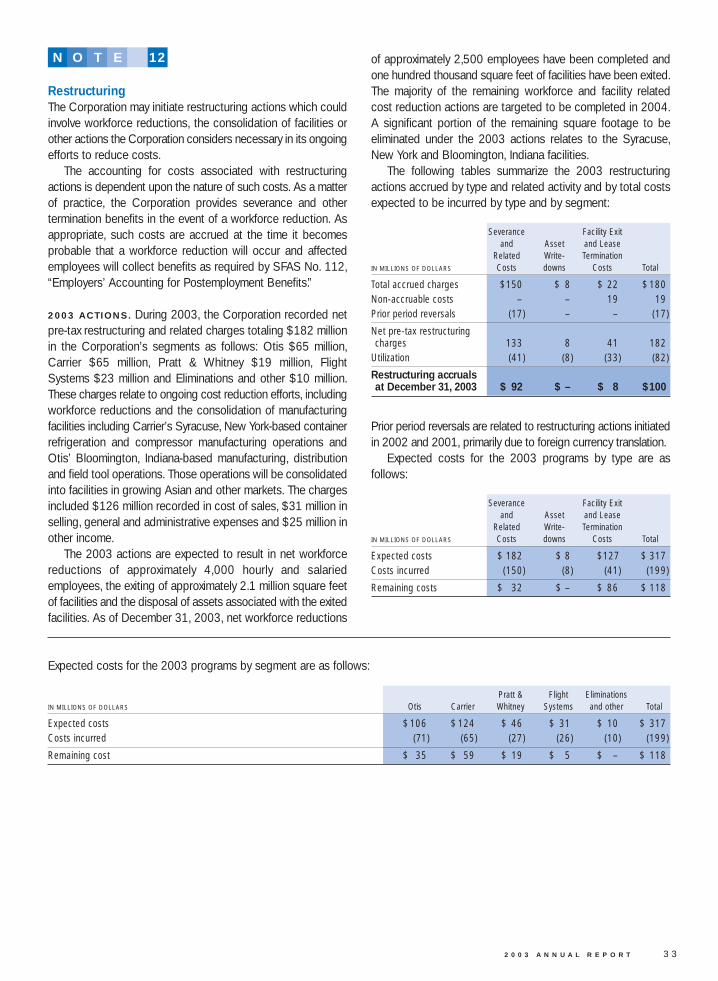
2 0 0 3 A N N U A L R E P O R T 3 3
Restructuring The Corporation may initiate restructuring actions which couldinvolve workforce reductions, the consolidation of facilities orother actions the Corporation considers necessary in its ongoingefforts to reduce costs.
The accounting for costs associated with restructuringactions is dependent upon the nature of such costs. As a matterof practice, the Corporation provides severance and other termination benefits in the event of a workforce reduction. Asappropriate, such costs are accrued at the time it becomesprobable that a workforce reduction will occur and affectedemployees will collect benefits as required by SFAS No. 112,“Employers’ Accounting for Postemployment Benefits.”
2003 ACTIONS. During 2003, the Corporation recorded netpre-tax restructuring and related charges totaling $182 millionin the Corporation’s segments as follows: Otis $65 million,Carrier $65 million, Pratt & Whitney $19 million, FlightSystems $23 million and Eliminations and other $10 million.These charges relate to ongoing cost reduction efforts, includingworkforce reductions and the consolidation of manufacturingfacilities including Carrier’s Syracuse, New York-based containerrefrigeration and compressor manufacturing operations andOtis’ Bloomington, Indiana-based manufacturing, distributionand field tool operations. Those operations will be consolidatedinto facilities in growing Asian and other markets. The chargesincluded $126 million recorded in cost of sales, $31 million inselling, general and administrative expenses and $25 million inother income.
The 2003 actions are expected to result in net workforcereductions of approximately 4,000 hourly and salaried employees, the exiting of approximately 2.1 million square feetof facilities and the disposal of assets associated with the exitedfacilities. As of December 31, 2003, net workforce reductions
of approximately 2,500 employees have been completed andone hundred thousand square feet of facilities have been exited.The majority of the remaining workforce and facility relatedcost reduction actions are targeted to be completed in 2004.A significant portion of the remaining square footage to beeliminated under the 2003 actions relates to the Syracuse,New York and Bloomington, Indiana facilities.
The following tables summarize the 2003 restructuringactions accrued by type and related activity and by total costsexpected to be incurred by type and by segment:
Severance Facility Exitand Asset and Lease
Related Write- TerminationIN MILLIONS OF DOLLARS Costs downs Costs Total
Total accrued charges $150 $ 8 $ 22 $180Non-accruable costs – – 19 19Prior period reversals (17) – – (17)
Net pre-tax restructuring charges 133 8 41 182
Utilization (41) (8) (33) (82)
Restructuring accruals at December 31, 2003 $ 92 $ – $ 8 $100
Expected costs for the 2003 programs by segment are as follows:
Pratt & Flight EliminationsIN MILLIONS OF DOLLARS Otis Carrier Whitney Systems and other Total
Expected costs $106 $ 124 $ 46 $ 31 $ 10 $ 317Costs incurred (71) (65) (27) (26) (10) (199)
Remaining cost $ 35 $ 59 $ 19 $ 5 $ – $ 118
N O T E 12
Prior period reversals are related to restructuring actions initiatedin 2002 and 2001, primarily due to foreign currency translation.
Expected costs for the 2003 programs by type are as follows:
Severance Facility Exitand Asset and Lease
Related Write- TerminationIN MILLIONS OF DOLLARS Costs downs Costs Total
Expected costs $ 182 $ 8 $127 $ 317Costs incurred (150) (8) (41) (199)
Remaining costs $ 32 $ – $ 86 $ 118

3 4 U N I T E D T E C H N O L O G I E S
2002 ACTIONS. During 2002, the Corporation recorded netpre-tax restructuring and related charges totaling $321 million.These charges related to ongoing cost reduction efforts,including workforce reductions and consolidation of manufac-turing, sales and service facilities, and included $237 millionrecorded in cost of sales and $81 million in selling, generaland administrative expenses.
The charges were recorded in the Corporation’s segmentsas follows: Otis $73 million, Carrier $114 million, Pratt &Whitney $80 million and Flight Systems $55 million. Thecharges included accruals of $203 million for severance andrelated employee termination costs, $48 million for asset write-downs, largely related to manufacturing assets and exitingfacilities that will no longer be utilized, and $19 million for facilityexit and lease termination costs. Additional charges associatedwith these restructuring actions totaling $51 million that werenot accruable at the time were also recorded in 2002, primarilyin the Carrier segment.
As of December 31, 2003, the 2002 actions have beencompleted substantially as planned having resulted in networkforce reductions of approximately 6,800 salaried andhourly employees, the exiting of approximately 1.6 millionsquare feet of facilities and the disposal of assets associatedwith exited facilities.
Foreign Exchange The Corporation conducts business in many different currenciesand, accordingly, is subject to the inherent risks associatedwith foreign exchange rate movements. The financial positionand results of operations of substantially all of theCorporation’s foreign subsidiaries are measured using thelocal currency as the functional currency. Foreign currencydenominated assets and liabilities are translated into U.S. dollarsat the exchange rates existing at the respective balance sheetdates, and income and expense items are translated at theaverage exchange rates during the respective periods. Theaggregate effects of translating the balance sheets of thesesubsidiaries are deferred as a separate component ofShareowners’ Equity. The Corporation had foreign currencynet assets in more than forty currencies, aggregating $6.5 bil-lion and $4.2 billion at December 31, 2003 and 2002, respec-tively.
The notional amount of foreign exchange contracts hedgingforeign currency transactions was $4.9 billion and $2.9 billionat December 31, 2003 and 2002, respectively.
Financial Instruments The Corporation operates internationally and, in the normalcourse of business, is exposed to fluctuations in interest rates,foreign exchange rates and commodity prices. These fluctuationscan increase the costs of financing, investing and operatingthe business. The Corporation manages its foreign currencytransaction risks and some commodity exposures to acceptablelimits through the use of derivatives designated as hedges.
By nature, all financial instruments involve market and creditrisks. The Corporation enters into derivative and other financialinstruments with major investment grade financial institutionsand has policies to monitor the credit risk of those counterparties.The Corporation limits counterparty exposure and concentrationof risk by diversifying counterparties. The Corporation does notanticipate non-performance by any of these counterparties.
The non-shareowner changes in equity associated withhedging activity for the twelve months ended December 31,2003 and 2002 were as follows:
IN MILLIONS OF DOLLARS 2003 2002
Balance at January 1 $ 4 $(23)Cash flow hedging gain (loss), net 66 (6)Net (gain) loss reclassified to salesor cost of products sold (15) 33
Balance at December 31 $ 55 $ 4
Of the amount recorded in Shareowners’ Equity, a $75 millionpre-tax gain is expected to be reclassified into sales or cost ofproducts sold to reflect the fixed prices obtained from hedgingwithin the next twelve months. Gains and losses recognized inearnings related to fair value hedges and the discontinuance orthe ineffectiveness of cash flow hedges were immaterial for theyears ended December 31, 2003 and 2002. At December 31,2003, all derivative contracts accounted for as cash flowhedges mature by March 2006.
All derivative instruments are recorded on the balancesheet at fair value. At December 31, 2003 and 2002, the fairvalue of derivatives recorded as assets is $162 million and$58 million, respectively, and the fair value of derivativesrecorded as liabilities is $56 million and $39 million, respec-tively. The Corporation uses derivatives to hedge forecastedcash flows associated with foreign currency commitments orforecasted commodity purchases which are accounted for ascash flow hedges. In addition, the Corporation uses derivatives,such as interest rate swaps which are accounted for as fairvalue hedges.
N O T E 13
N O T E 14

2 0 0 3 A N N U A L R E P O R T 3 5
The carrying amounts and fair values of financial instru-ments at December 31 are as follows:
2003 2002
Carrying Fair Carrying FairIN MILLIONS OF DOLLARS Amount Value Amount Value
Financial Assets and LiabilitiesMarketable equity securities $ 79 $ 79 $ 17 $ 17
Long-term receivables 128 125 155 151Customer financing note receivables 439 425 301 299
Short-term borrowings (669) (669) (197) (197)Long-term debt (4,614) (5,363) (4,657) (5,374)
GuaranteesThe Corporation extends a variety of financial guarantees tothird parties. As of December 31, 2003 and 2002 the followingfinancial guarantees were outstanding:
2003 2002
Maximum Carrying Maximum CarryingPotential Amount of Potential Amount of
IN MILLIONS OF DOLLARS Payment Liability Payment Liability
Credit facilities and debt obligations –unconsolidated subsidiaries (expire 2004 – 2011) $ 191 $ 9 $ 259 $ –
IAE’s financing arrangements (See Note 4) 1,406 22 1,232 22
Commercial aerospace financing arrangements (See Note 4) 160 36 164 26
Commercial customer financing arrangements 66 1 62 –
N O T E 15
The above fair values were computed based on comparabletransactions, quoted market prices, discounted future cashflows or an estimate of the amount to be received or paid toterminate or settle the agreement, as applicable.
The values of marketable equity securities represent theCorporation’s investment in common stock that is classified asavailable for sale and is accounted for at fair value.
The Corporation had outstanding financing and rental commitments totaling $1.2 billion at December 31, 2003. Risksassociated with changes in interest rates on these commitmentsare mitigated by the fact that interest rates are variable duringthe commitment term and are set at the date of funding basedon current market conditions, the fair value of the underlyingcollateral and the credit worthiness of the customers. As aresult, the fair value of these financings is expected to equalthe amounts funded.
The fair value of the commitment itself is not readily deter-minable and is not considered significant. Additional informa-tion pertaining to these commitments is included in Note 4.
The Company also has obligations arising from sales ofcertain businesses and assets, including representations andwarranties and related indemnities for environmental, healthand safety, tax and employment matters. The maximum potentialpayment related to these obligations is not a specified amountas a number of the obligations do not contain financial caps.The carrying amount of liabilities related to these obligationswas $191 million and $186 million at December 31, 2003 and2002, respectively. For additional information regarding theenvironmental indemnifications see Note 16.
The Corporation accrues for costs associated with guaran-tees when it is probable that a liability has been incurred andthe amount can be reasonably estimated. The most likely costto be incurred is accrued based on an evaluation of currentlyavailable facts, and where no amount within a range of estimatesis more likely, the minimum is accrued. In accordance withFASB Interpretation No. 45, “Guarantor’s Accounting andDisclosure Requirements for Guarantees, Including IndirectGuarantees of Indebtedness of Others,” for guarantees issuedafter December 31, 2002, the Corporation records a liabilityfor the fair value of such guarantees in the balance sheet.
The Corporation provides service and warranty policies onits products and extends performance and operating costguarantees beyond its normal service and warranty policies onsome of its products, particularly commercial aircraft engines.Liability under service and warranty policies is based upon areview of historical warranty and service claim experience.Liability for performance and operating cost guarantees isbased upon future product performance and durability, and is estimated largely based upon historical experience.

3 6 U N I T E D T E C H N O L O G I E S
Adjustments are made to accruals as claim data and historicalexperience warrant. In addition, the Corporation incurs discre-tionary costs to service its products in connection with productperformance issues.
The changes in the carrying amount of service and productwarranties and product performance guarantees for the yearsended December 31, 2003 and 2002, are as follows:
IN MILLIONS OF DOLLARS 2003 2002
Balance as of January 1 $1,116 $1,177Warranties and guarantees issued 448 385Settlements made (405) (500)Adjustments to provision 2 54
Balance as of December 31 $1,161 $1,116
bidding on or receiving awards of new government contractspending the completion of legal proceedings. If convicted orfound liable, the Corporation could be fined and debarred fromnew government contracting for a period generally not toexceed three years. Any contracts found to be tainted by fraudcould be voided by the Government.
The Corporation’s contracts with the U.S. Government arealso subject to audits. Like many defense contractors, theCorporation has received audit reports which recommend thatcertain contract prices should be reduced to comply with various government regulations. Some of these audit reportsinvolve substantial amounts. The Corporation has made volun-tary refunds in those cases it believes appropriate and continuesto litigate certain cases. In addition, the Corporation accruesfor liabilities associated with those matters that are probableand can be reasonably estimated.
In the fourth quarter of 2003, the Corporation received ademand notice for $755 million from the U.S. Department ofDefense (DoD) relating to an on-going dispute over Pratt &Whitney’s government cost accounting practices for engineparts received from its partners on certain commercial enginecollaboration programs from 1984 to the present. The case iscurrently pending before the Armed Services Board ofContract Appeals (ASBCA).
Should the DoD ultimately prevail with respect to one ormore of the significant government contracting matters, theoutcome could result in a material effect on the Corporation’sresults of operations in the period the matter is resolved.However, the Corporation believes that the resolution of thesematters will not have a material adverse effect on theCorporation’s results of operations, competitive position, cashflows or financial condition.
OTHER. The Corporation extends performance and operatingcost guarantees beyond its normal warranty and service poli-cies for extended periods on some of its products, particularlycommercial aircraft engines. Liability under such guarantees iscontingent upon future product performance and durability. Inaddition, the Corporation incurs discretionary costs to serviceits products in connection with product performance issues.The Corporation has accrued its estimated liability that mayresult under these guarantees and for service costs which areprobable and can be reasonably estimated.
The Corporation also has other commitments and contin-gent liabilities related to legal proceedings and matters arisingout of the normal course of business.
The Corporation has accrued for environmental investigatory,remediation, operating and maintenance costs, performanceguarantees and other litigation and claims based on manage-ment’s estimate of the probable outcome of these matters.While it is possible that the outcome of these matters may differ from the recorded liability, management believes that resolution of these matters will not have a material impact onthe Corporation’s financial position, results of operations orcash flows.
N O T E 16
Commitments and Contingent LiabilitiesLEASES. The Corporation occupies space and uses certainequipment under lease arrangements. Rental commitments of$1,059 million at December 31, 2003 under long-term non-cancelable operating leases are payable as follows: $292 millionin 2004, $227 million in 2005, $163 million in 2006, $114million in 2007, $76 million in 2008 and $187 million thereafter.
Rent expense was $261 million in 2003, $214 million in2002 and $204 million in 2001.
Additional information pertaining to commercial aerospacerental commitments is included in Note 4.
ENVIRONMENTAL. The Corporation’s operations are subjectto environmental regulation by federal, state and local authoritiesin the United States and regulatory authorities with jurisdictionover its foreign operations. As described in Note 1, theCorporation has accrued for the costs of environmental reme-diation activities and periodically reassesses these amounts.Management believes that the likelihood of incurring lossesmaterially in excess of amounts accrued is remote.
The Corporation has had insurance in force over its historywith a number of insurance companies and has pursued litigation seeking indemnity and defense under these insurancepolicies in relation to its environmental liabilities. In January2002, the Corporation settled the last of these lawsuits underan agreement providing for the Corporation to receive paymentstotaling approximately $100 million. Accrued environmental lia-bilities are not reduced by potential insurance reimbursements.
U.S. GOVERNMENT. The Corporation is now, and believesthat in light of the current government contracting environmentit will be, the subject of one or more government investigations.If the Corporation or one of its business units were chargedwith wrongdoing as a result of any of these investigations orother government investigations (including violations and cer-tain environmental or export laws) it could be suspended from
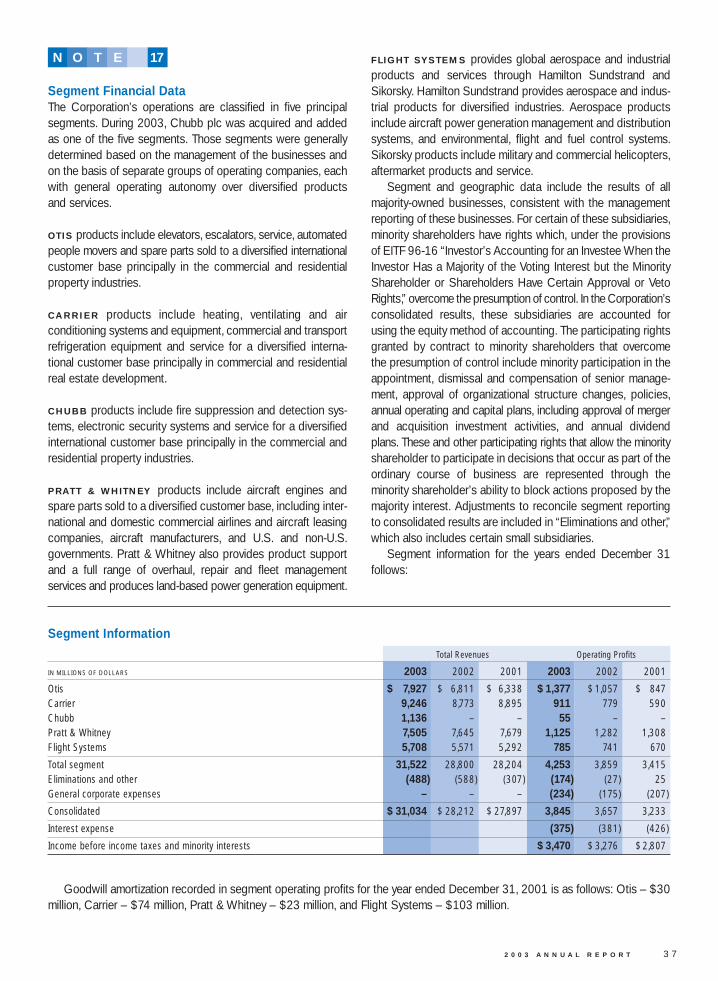
2 0 0 3 A N N U A L R E P O R T 3 7
Segment Financial DataThe Corporation’s operations are classified in five principalsegments. During 2003, Chubb plc was acquired and addedas one of the five segments. Those segments were generallydetermined based on the management of the businesses andon the basis of separate groups of operating companies, eachwith general operating autonomy over diversified products and services.
OTIS products include elevators, escalators, service, automatedpeople movers and spare parts sold to a diversified internationalcustomer base principally in the commercial and residentialproperty industries.
CARRIER products include heating, ventilating and air conditioning systems and equipment, commercial and transportrefrigeration equipment and service for a diversified interna-tional customer base principally in commercial and residentialreal estate development.
CHUBB products include fire suppression and detection sys-tems, electronic security systems and service for a diversifiedinternational customer base principally in the commercial andresidential property industries.
PRATT & WHITNEY products include aircraft engines andspare parts sold to a diversified customer base, including inter-national and domestic commercial airlines and aircraft leasingcompanies, aircraft manufacturers, and U.S. and non-U.S. governments. Pratt & Whitney also provides product supportand a full range of overhaul, repair and fleet management services and produces land-based power generation equipment.
FLIGHT SYSTEMS provides global aerospace and industrialproducts and services through Hamilton Sundstrand andSikorsky. Hamilton Sundstrand provides aerospace and indus-trial products for diversified industries. Aerospace productsinclude aircraft power generation management and distributionsystems, and environmental, flight and fuel control systems.Sikorsky products include military and commercial helicopters,aftermarket products and service.
Segment and geographic data include the results of allmajority-owned businesses, consistent with the managementreporting of these businesses. For certain of these subsidiaries,minority shareholders have rights which, under the provisionsof EITF 96-16 “Investor’s Accounting for an Investee When theInvestor Has a Majority of the Voting Interest but the MinorityShareholder or Shareholders Have Certain Approval or VetoRights,” overcome the presumption of control. In the Corporation’sconsolidated results, these subsidiaries are accounted forusing the equity method of accounting. The participating rightsgranted by contract to minority shareholders that overcomethe presumption of control include minority participation in theappointment, dismissal and compensation of senior manage-ment, approval of organizational structure changes, policies,annual operating and capital plans, including approval of mergerand acquisition investment activities, and annual dividendplans. These and other participating rights that allow the minorityshareholder to participate in decisions that occur as part of theordinary course of business are represented through theminority shareholder’s ability to block actions proposed by themajority interest. Adjustments to reconcile segment reportingto consolidated results are included in “Eliminations and other,”which also includes certain small subsidiaries.
Segment information for the years ended December 31 follows:
Segment Information
Total Revenues Operating Profits
IN MILLIONS OF DOLLARS 2003 2002 2001 2003 2002 2001
Otis $ 7,927 $ 6,811 $ 6,338 $ 1,377 $1,057 $ 847Carrier 9,246 8,773 8,895 911 779 590Chubb 1,136 – – 55 – –Pratt & Whitney 7,505 7,645 7,679 1,125 1,282 1,308Flight Systems 5,708 5,571 5,292 785 741 670
Total segment 31,522 28,800 28,204 4,253 3,859 3,415Eliminations and other (488) (588) (307) (174) (27) 25General corporate expenses – – – (234) (175) (207)
Consolidated $ 31,034 $ 28,212 $ 27,897 3,845 3,657 3,233
Interest expense (375) (381) (426)
Income before income taxes and minority interests $ 3,470 $ 3,276 $2,807
N O T E 17
Goodwill amortization recorded in segment operating profits for the year ended December 31, 2001 is as follows: Otis – $30million, Carrier – $74 million, Pratt & Whitney – $23 million, and Flight Systems – $103 million.

3 8 U N I T E D T E C H N O L O G I E S
Total Assets Capital Expenditures Depreciation & Amortization
IN MILLIONS OF DOLLARS 2003 2002 2001 2003 2002 2001 2003 2002 2001
Otis $ 4,946 $ 4,144 $ 3,777 $ 77 $ 81 $ 80 $154 $138 $ 159Carrier 7,720 7,431 7,202 89 94 226 182 189 248Chubb 4,396 – – 16 – – 44 – –Pratt & Whitney 6,648 6,082 6,090 192 257 343 214 209 223Flight Systems 8,478 8,005 7,724 138 127 125 167 169 259
Total segment 32,188 25,662 24,793 512 559 774 761 705 889Eliminations and other 2,460 3,532 2,237 18 27 19 38 22 16
Consolidated $34,648 $29,194 $27,030 $530 $586 $ 793 $799 $ 727 $905
SEGMENT REVENUES AND OPERATING PROFIT. Total revenues by segment include intersegment sales, which are generallymade at prices approximating those that the selling entity is able to obtain on external sales. Operating profits by segment includeincome before interest expense, income taxes and minority interest.
Geographic Areas
External Revenues Operating Profits Long-Lived Assets
IN MILLIONS OF DOLLARS 2003 2002 2001 2003 2002 2001 2003 2002 2001
United States operations $16,988 $ 16,760 $17,109 $2,156 $2,289 $1,987 $ 8,675 $ 8,648 $ 8,489International operations
Europe 7,150 5,573 4,716 970 690 570 4,984 1,547 1,188Asia Pacific 4,505 3,647 3,420 722 573 416 1,663 1,428 1,404Other 2,602 2,581 2,785 404 307 442 682 521 574
Eliminations and other (211) (349) (133) (407) (202) (182) 300 78 72
Consolidated $31,034 $28,212 $27,897 $3,845 $3,657 $3,233 $16,304 $12,222 $11,727
GEOGRAPHIC EXTERNAL REVENUES AND OPERATING
PROFIT. Geographic external revenues and operating profitsare attributed to the geographic regions based on their loca-tion of origin. United States external revenues include exportsales to commercial customers outside the U.S. and sales tothe U.S. Government, commercial and affiliated customers,which are known to be for resale to customers outside the U.S.
Revenues from United States operations include exportsales as follows:
IN MILLIONS OF DOLLARS 2003 2002 2001
Europe $ 1,171 $1,422 $1,314Asia Pacific 1,145 1,594 1,484Other 1,013 1,037 1,149
$3,329 $4,053 $3,947
GEOGRAPHIC LONG-LIVED ASSETS. Long-lived assetsinclude net fixed assets and intangibles which can be attrib-uted to the specific geographic regions.
MAJOR CUSTOMERS. Revenues include sales under primecontracts and subcontracts to the U.S. Government, primarilyrelated to Pratt & Whitney and Flight Systems products, as follows:
IN MILLIONS OF DOLLARS 2003 2002 2001
Pratt & Whitney $3,025 $2,489 $ 1,708Flight Systems $2,196 $2,015 $2,037

2 0 0 3 A N N U A L R E P O R T 3 9
Subsequent Events (Unaudited)In January 2004, the Corporation received a $250 million pay-ment from DaimlerChrysler. In consideration for this payment,the Corporation has released DaimlerChrysler from certaincommitments previously made in support of MTU Aero EnginesGmbH. The Corporation expects to use this first quarter gainfor additional cost reduction actions across the businesses.
In February 2004, Carrier announced its intent to close itsMcMinnville, Tennessee manufacturing facility. The total cost ofthis action is expected to be approximately $120 million.During the first quarter of 2004, the Corporation expects torecord charges of approximately $60 million related to thisaction primarily attributable to severance related costs andaccelerated depreciation and asset writeoffs.
Selected Quarterly Financial Data (Unaudited)
2003 Quarters 2002 Quarters
IN MILLIONS OF DOLLARS, EXCEPT PER SHARE AMOUNTS First Second Third Fourth First Second Third Fourth
Sales $6,653 $ 7,708 $ 7,875 $8,487 $6,321 $ 7,271 $7,250 $7,138Gross margin 1,787 2,089 2,162 2,177 1,836 2,081 2,012 1,890Net income 502 632 639 588 467 624 612 533Earnings per share of Common Stock:
Basic $ 1.05 $ 1.33 $ 1.34 $ 1.21 $ .97 $ 1.30 $ 1.28 $ 1.11Diluted $ 1.00 $ 1.26 $ 1.27 $ 1.16 $ .92 $ 1.23 $ 1.21 $ 1.06
Comparative Stock Data
2003 2002
Common Stock High Low Dividend High Low Dividend
First quarter $66.21 $54.15 $.245 $77.25 $59.37 $.245Second quarter $73.51 $58.75 $.270 $75.00 $64.85 $.245Third quarter $80.25 $71.29 $.270 $71.00 $55.98 $.245Fourth quarter $95.54 $79.88 $.350 $65.83 $49.19 $.245
The Corporation’s Common Stock is listed on the New York Stock Exchange. The high and low prices are based on the CompositeTape of the New York Stock Exchange. There were approximately 26,000 common shareowners of record at December 31, 2003.
N O T E 18

4 0 U N I T E D T E C H N O L O G I E S
D I R E C T O R S
Board of Directors
Betsy J. BernardFormer PresidentAT&T Corporation (Telecommunications)
George DavidChairman and Chief Executive Officer
Jean-Pierre GarnierChief Executive OfficerGlaxoSmithKline plc(Pharmaceuticals)
Jamie S. GorelickPartnerWilmer Cutler Pickering LLP
Charles R. LeeRetired Chairman and Co-Chief Executive OfficerVerizon Communications(Telecommunications)
Richard D. McCormickHonorary ChairmanInternational Chamber of Commerce (ICC)
Harold McGraw IIIChairman, President and Chief Executive OfficerThe McGraw-Hill Companies(Global Information Services)
Stephen F. PageVice Chairman and Chief Financial Officer
Frank P. PopoffRetired Chairman and Chief Executive OfficerThe Dow Chemical Company(Chemicals and Chemical Products)
H. Patrick SwygertPresidentHoward University
André VilleneuveChairmanEuronext.LIFFE(London Futures and Derivatives Exchange)
H. A. WagnerRetired ChairmanAir Products and Chemicals, Inc.(Industrial Gases and Chemicals)
Christine Todd WhitmanFormer EPA Administrator and Former Governor of New Jersey
Permanent Committees
Audit CommitteeFrank P. Popoff, ChairmanJamie S. GorelickRichard D. McCormickHarold McGraw IIIAndré VilleneuveH. A. Wagner
Compensation & Executive DevelopmentH. A. Wagner, ChairmanJean-Pierre GarnierCharles R. LeeRichard D. McCormickFrank P. Popoff
Executive CommitteeGeorge David, ChairmanCharles R. LeeStephen F. PageFrank P. PopoffH. A. Wagner
Finance CommitteeCharles R. Lee, ChairmanGeorge DavidJamie S. GorelickStephen F. PageFrank P. PopoffH. Patrick SwygertAndré VilleneuveChristine Todd Whitman
Committee on Nominations and GovernanceRichard D. McCormick, ChairmanBetsy J. BernardJean-Pierre GarnierCharles R. LeeH. Patrick SwygertH. A. Wagner
Public Issues Review CommitteeJean-Pierre Garnier, ChairmanBetsy J. BernardJamie S. GorelickHarold McGraw IIIH. Patrick SwygertAndré VilleneuveChristine Todd Whitman

2 0 0 3 A N N U A L R E P O R T 4 1
L E A D E R S H I P
Mario AbajoPresident, South Europe, Middle East and Western Asia, Otis
David AdlerSenior Vice President,Worldwide Customer Service,Sikorsky
Tesfaye AkliluVice President, Quality
Ted F. AmyuniSenior Vice President, Operations, Carrier
Alain M. BellemarePresident,Pratt & Whitney Canada
Richard H. Bennett, Jr.Vice President,Environment, Health & Safety
Todd BluedornPresident, North America Commercial, Carrier
Ari BousbibPresident, Otis
John W. BoydVice President, Operations,Hamilton Sundstrand
Kent L. BrittanVice President,Supply Management
William M. BrownPresident, Asia Pacific,Carrier
William L. Bucknall, Jr.Senior Vice President, Human Resources and Organization
John F. Cassidy, Jr.Senior Vice President, Science and Technology
Tony ChamberlainPresident, Australasia, Chubb
Louis R. ChênevertPresident, Pratt & Whitney
Jean ColpinDirector, United TechnologiesResearch Center
Halsey CookPresident, North AmericaResidential, Carrier
Geraud DarnisPresident, Carrier
George DavidChairman and Chief Executive Officer
John DoucetteVice President and Chief Information Officer
Thomas E. FarmerPresident, Military Engines,Pratt & Whitney
Stephen N. FingerPresident, Sikorsky
James E. GeislerVice President, Finance
James L. GingrichPresident, Flight Systems and Services,Hamilton Sundstrand
Patrick J. GnazzoVice President, BusinessPractices
Bruno GrobPresident, North Europe, Otis
Anthony J. GuzziPresident, Carrier Distribution & Service
Ruth R. HarkinSenior Vice President,International Affairs andGovernment Relations
Gregory J. HayesVice President, Accounting and Control
David P. HessPresident, Aerospace Power Systems,Hamilton Sundstrand
Darryl HughesPresident, Security Business,United Kingdom, Ireland &South Africa, Chubb
Tadayuki InouePresident, Japan, Otis
George H. JamisonVice President,Communications
Todd KallmanVice President, CorporateStrategy & Development
Edwin W. LapradePresident, Industrial, Hamilton Sundstrand
John P. LearyVice President, Employee Relations
Robert LeducExecutive Vice President and Chief Operating Officer,Pratt & Whitney and President,Large Commercial Engines
Patrick L’HostisPresident, Europe, Middle East and Africa, Carrier
Richard LaubensteinPresident, Carrier Transicold
Arthur W. LucasSenior Vice President,Engineering,Pratt & Whitney
Paul W. MartinSenior Vice President,U.S. Government & AdvancedDevelopment Programs,Sikorsky
Ronald F. McKennaPresident, Hamilton Sundstrand
Raymond J. MonciniPresident, North and SouthAmerica, Otis
Larry O. MooreSenior Vice President, Module Centers andOperations, Pratt & Whitney
Robert R. MooreSenior Vice President, Production Operations,Sikorsky
Joseph R. OrnelasVice President, Engineering & Technology,Hamilton Sundstrand
Stephen F. PageVice Chairman and Chief Financial Officer
Eric PatryPresident, Continental Europe,Chubb
Jeffrey P. PinoSenior Vice President, Marketing & CommercialPrograms, Sikorsky
Carlos RenckPresident, Latin America, Carrier
Jürgen ReuningPresident, Central and EastEurope, Otis
Jeffrey P. RhodenbaughPresident, CommercialRefrigeration, Carrier
Olivier J. RobertPresident, Chubb
Thomas I. RoganVice President, Treasurer
William H. TrachselSenior Vice President and General Counsel
Tobin J. TreichelVice President, Tax
Joseph E. TriompoPresident, Engine and ControlSystems, Hamilton Sundstrand
Debra A. ValentineVice President, Secretary andAssociate General Counsel
Jan van DokkumPresident, UTC Power
Charles M. VoPresident, North Asia Pacific, Otis
Randal E. WilcoxPresident, South Asia Pacific, Otis
4 2 U N I T E D T E C H N O L O G I E S
S H A R E O W N E R I N F O R M A T I O N
WWW.UTC.COM
WWW.CARRIER.COM
WWW.CHUBBPLC.COM
WWW.HAMILTONSUNDSTRANDCORP.COM
WWW.OTIS.COM
WWW.PRATT-WHITNEY.COM
WWW.SIKORSKY.COM
WWW.UTCPOWER.COM
Corporate Office
United Technologies CorporationOne Financial PlazaHartford, Connecticut 06103Telephone 1-860-728-7000
This annual report is made available toshareowners in advance of the annualmeeting of shareowners to be held at 2:00 p.m., April 14, 2004, at the Pratt & Whitney Space Propulsion facility in Jupiter, Florida. The proxystatement will be made available toshareowners on or about February 27,2004, at which time proxies for the meetingwill be requested.
Information about UTC, including financialinformation, can be found at our Web site:www.utc.com.
Stock ListingNew York, London, Paris, Frankfurt, Brusselsand Swiss Stock Exchanges
Ticker Symbol: UTX
Transfer Agent and RegistrarEquiServe Trust Company, N.A., is thetransfer agent, registrar and dividenddisbursing agent for UTC’s Common Stock. Questions and communicationsregarding transfer of stock, replacement of lost certificates, dividends and addresschanges and the Dividend Reinvestmentand Stock Purchase Plan should bedirected to:
EquiServe Trust Company, N.A.P.O. Box 43069Providence, RI02940-3069Telephone: 1-800-519-3111Web site: www.equiserve.com
TDD: 1-800-952-9245Telecommunications device for the hearing impaired.
DividendsDividends if declared are usually paid on the 10th day of March, June, September and December.
Electronic AccessShareowners of record may sign up at thefollowing Web site for electronic access tofuture annual reports and proxy materials,rather than receiving mailed copies:www.econsent.com/utx
Your enrollment is revocable until eachyear’s record date for the annual meeting.Beneficial shareowners may be able torequest electronic access by contacting your broker or bank, or ADP atwww.utc.com/investors/econsent/ics.htm.
Additional InformationShareowners may obtain a copy of theUnited Technologies Report on Form 10-Kfor 2003 filed with the Securities andExchange Commission by writing to:
Corporate SecretaryUnited Technologies CorporationOne Financial PlazaHartford, Connecticut 06103
For additional information about theCorporation please contact InvestorRelations at the above corporate officeaddress, or visit our Web site atwww.utc.com.
Shareowner Information ServicesOur Internet and telephone services giveshareowners fast access to UTC financialresults. The 24-hour-a-day, toll-freetelephone service includes recordedsummaries of UTC’s quarterly earningsinformation and other company news.Callers also may request copies of ourquarterly earnings and news releases, byeither fax or mail, and obtain copies of the UTC Annual Report and Form 10-K.
To access the service, dial 1-800-881-1914 from any touch-tone phone and follow therecorded instructions.
Direct Registration SystemIf your shares are held in street namethrough a broker and you are interested in participating in the Direct RegistrationSystem, you may have your broker transferthe shares to EquiServe Trust Company,N.A., electronically through the DirectRegistration System. Interested investorscan request a description of this book-entryform of registration by calling ShareownerInformation Services at 1-800-881-1914.
Environmentally Friendly ReportThis annual report is printed on recycled and recyclable paper.


O N E F I N A N C I A L P L A Z A
H A R T F O R D , C T 0 6 1 0 3
C A R R I E R
C H U B B
H A M I L T O N S U N D S T R A N D
O T I S
P R A T T & W H I T N E Y
S I K O R S K Y
U T C P O W E R