united states department of education 400 maryland … · united states department of education 400...
TRANSCRIPT

February 23, 2007 Henry L. Johnson, Assistant Secretary United States Department of Education 400 Maryland Avenue, SW Washington, DC 20202-6200 Dear Assistant Secretary Johnson: Your staff’s October 19, 2006 review of Vermont’s revised state plan for meeting the Highly Qualified Teacher (HQT) goal resulted in a request that the Vermont Department of Education submit additional revisions to its state plan that explain in more detail the actions the state is taking to support schools in need of improvement to meet HQT goals.
• Corrective actions the State Education Agency (SEA) will take when LEAs fail to meet AMOs,
• How the state will eliminate use of the HOUSSE, • The SEA’s Equity Plan to ensure that poor and minority students are not
disproportionately taught by non-HQT or inexperienced teachers. This letter is submitted in response to your request. The elements of Vermont’s plan include: TECHNICAL ASSISTANCE SEA staff from the Educator Quality Team (EQT) do HQT reviews of all educator endorsements at the time of issue and issue HQT certificates to the educator. Individual educators who do not meet HQT requirements for newly issued endorsements are informed of what they need to do to become HQT for their endorsements. In addition, their HQT status is shared with their administrators upon request. EQT staff provides technical assistance to LEA administrators in meeting teacher and paraprofessional HQT and HQP requirements through on-site visits, phone and email conferencing and communication, and printed information posted on the VT Department of Education’s website and provided via US mail. (As examples of technical assistance, please see the chart entitled NCLBA Highly Qualified Teacher (HQT) and
Paraprofessional Accountability Requirements at http://www.state.vt.us/educ/new/html/licensing/hqt.html and the attached sample LEA-level HQT data report.) In addition, the EQT staff regularly makes presentations regarding HQT and HQP requirements at statewide conferences relevant to administrators and educators. EQT staff share HQT data related to schools that are not meeting AYP with members of the state’s Assessment and Accountability (AA) Team. The AA Team determines and oversees Schools in Need of Improvement, including providing technical assistance to these schools through the work of the School Support coordinators. These coordinators are department employees with responsibility for particular schools identified as Schools in Need of Improvement. They assist their schools in developing effective data-based improvement plans and broker professional development services for these schools, including services provided by the SEA’s Content Specialists and through the regional Education Service Agencies (ESAs) and Professional Development Networks (see below). The School Support Coordinators are funded through state general funds and State Assessments and Related Activities (SARA) monies. Members of the EQT team share HQT data with the SEA’s Independent and Federal Programs (IFP) and Student Support Teams (SST). The IFP Team monitors all LEAs/schools receiving federal monies under the various titles of the NCLB, while the SST Team monitors LEAs/schools for compliance with laws and regulations related to special education. When the percentage of classes being taught by educators who are not HQT for their assignments is at issue in a particular school, the School Support Coordinator assigned to that school and the various monitoring teams are alerted to this concern. All of the activities of the EQT staff described above are funded with Title II Part A state activities and technical assistance funds. PROFESSIONAL DEVELOPMENT The SEA routinely collaborates with providers of professional development (including the Higher Education Collaborative, the Regiona l Education Services Agencies, The Vermont Institutes, and the Institutions of Higher Education) to identify areas of need for professional development in order for individuals to meet HQT requirements and to preapprove course offerings for HQT purposes. In addition, the SEA has implemented a number of specific programs and services to assist teachers and LEAs in meeting their professional development and staffing needs, including their need to successfully meet HQT goals. These include:
Regional Education Service Agencies (ESAs) – These are regional service agencies that collaborate with their affiliate districts to identify their professional development needs, including needs related to HQT, and to develop or broker professional development opportunities that will meet these needs. (Please see the enclosed brochure or visit http://education.vermont.gov/new/html/prodev/resources.html#esa for further

information.) EQT staff regularly collaborate with ESA directors to determine HQT needs in a particular region and to preapprove courses and workshops for HQT content credit. Throughout this process, the needs of schools not making AYP in a particular region are given priority. The ESAs are funded through Title II Part A SAHE funds as well as state general funds and local funds, including local Title I and Title II A funds.
Content Specialists – The SEA employs a number of specialists with expertise in specific content areas. They provide professional development in their content area to specific schools and school districts as requested (or required – see below) and coordinate the state-wide Professional Development Networks (see below). The content specialists are funded through SARA, Title V, and Title II D funds.
Professional Development Networks – The SEA facilitates math, literacy, and science networks and is developing several social studies networks around the state as well. These networks focus on standards and grade expectations, aligned curriculum, instruction and state (if applicable) and local assessment. These networks are funded by state general funds and SARA monies.
Professional Development Requirements for Identified Schools – Professional development is a key component of both the Commissioner's Required Actions for identified schools, as well as the grants from Title I pass-through funds and Gear-Up Partnership funds made to identified schools to specifically address the content areas and student groups for which they did not make AYP. In addition, teachers from identified schools have been required to attend the Vermont Professional Development Network meetings in Literacy and/or mathematics as applicable to the areas in which the school has not made AYP. The Department initiated a pilot project in formative assessment targeted at teachers in identified schools and schools not making AYP for the first time. The SEA’s intent is to continue to scale up this work with identified schools as a priority. PHASE-OUT OF HOUSSE Vermont has discontinued the use of its HOUSSE, effective July 1, 2006. All new endorsements issued on or after July 1, 2006 are subject to “New Teacher” HQT content knowledge requirements. (Please see the charts of HQT licensure and content knowledge requirements on the state’s website at http://www.state.vt.us/educ/new/html/licensing/hqt.html.) Upgraded licensure requirements implemented in 2003 include a major in each secondary teaching area as well as art, music, and foreign languages. In addition, Praxis II testing is required in all core content areas. Therefore, all new licensees in core content areas automatically meet HQT requirements for new teachers as well.
There are only two instances where we allow educators to continue to use the HOUSSE to document HQT status. These are: 1) educators coming from out-of-state with three or more years of teaching experience in the area for which they are seeking Vermont licensure and are, therefore, exempt from educator testing requirements under our Interstate Reciprocity Agreement, and 2) experienced Vermont educators who were out of the classroom during the past several years and therefore, were unable to take

advantage of the HOUSSE. An example of the latter is an educator who taught elementary education for seven years prior to 2001, left the classroom to raise children, and is now reinstating his/her lapsed elementary license. Since she was licensed prior to 2001 and has more than three years of experience, he/she is exempt from the Praxis testing requirements of Vermont’s licensure regulations. He/she could use the experienced teacher criteria (which require a particular number of credits in each content area) to document HQT status, rather than having to meet the new teacher HQT criteria, which, in the case of elementary education, requires Praxis II testing. ACCOUNTABILITY AND PUBLIC REPORTING REQUIREMENTS The SEA requires LEAs to sign assurances on the Consolidated Federal Programs application stating the following: “The LEA assures that all teachers of core academic subjects (as defined by NCLB) are highly qualified (HQT) for their assignments, or that individual plans are in place to ensure that each teacher who is not HQT for his/her assignment will become so, and that records are available to support this assurance. “The LEA assures that HQT parental “right to know” and non-HQT parental notification letters are being sent in a timely manner, when required, as stipulated under NCLB and that records are available to support this assurance.” “The LEA assures that all instructional paraprofessionals supported with Title I funds meet NCLB paraprofessional requirements and that records are available to support this assurance.” “The LEA assures that whenever its percentage of classes taught by Highly Qualified Teachers (HQT) is below 100%, it is setting Annual Measurable Objectives (AMOs) to ensure that it meets this goal, is monitoring its progress toward this goal, and that records are available to support this assurance.” The SEA requires LEAs to set Annual Measurable Objectives (AMOs) to meet the NCLB requirement that 100 percent of their core subject teachers are HQT for their assignments. In addition, until an LEA has met the requirement that 100 percent of its core area classes are taught by teachers who are highly qualified for their assignments, it is required to maintain individual plans describing its efforts to support each educator who is not HQT for his/her assignment to attain HQT status. These efforts may include:
• Providing financial assistance to the educator to acquire additional content coursework/professional development/testing in his/her endorsement area,
• Providing financial or other assistance to the educator to acquire the coursework/professional development/testing to qualify fo r an additional endorsement, or
• Restructuring the assignment to match the educator’s qualifications.
This requirement continues to be effective whenever the percentage of the LEA’s core area teachers who are HQT for their assignments is less than 100 percent in any given year. (Please see the chart entitled NCLBA Highly Qualified Teacher (HQT) and Paraprofessional Accountability Requirements at http://www.state.vt.us/educ/new/html/licensing/hqt.html.) The SEA provides data from the previous school year to each LEA on the percentage of its core subject classes taught by teachers who are not highly qualified for their assignments. These data are provided for the LEA as a whole, and for each school within the LEA, as well as a comparison of the high and low poverty schools within the LEA, if applicable. In addition, the SEA provides to each LEA data on the number and percentage of emergency licensed teachers in the LEA and in each school within the LEA. These data are provided to the LEAs in January of each school year. (Please see sample LEA-level HQT data report attached.) The SEA reports on its Web site data (from the previous school year) on the percentage of core area classes taught by “highly qualified” teachers statewide. These data are broken out by high and low poverty elementary and secondary schools. The SEA also reports the statewide emergency licensure data on its website. The SEA requires that LEAs report to all parents and broadly within the school community the data on the percentage of classes that are taught by teachers who are NOT “highly qualified” for their assignments and the percentage of emergency licensed teachers,. These data must be reported by school and for the LEA as a whole (both aggregate and high vs. low poverty, if applicable). The SEA also requires that LEAs report the professional qualifications of their teachers. The required data elements should be included in annual school reports or other similar publications where student assessment data is presented. In addition, if the LEA maintains a Web site, this information should be published there as well. As part of its Consolidated Federal Programs (CFP) monitoring process (Titles I – V), the SEA ascertains that:
• The LEA has set Annual Measurable Objectives (AMOs) to meet the NCLB requirement that 100 percent of its core subject teachers are HQT for their assignments,
• Data are being collected regarding the annual progress made by the LEA toward this goal,
• The LEA is maintaining the individual educator plans described above, • The LEA is complying with the parental notification and paraprofessional
requirements, and • The LEA is reporting required HQT data annually to the community. (Please see Title I monitoring document attached.)

CORRECTIVE ACTIONS SEA policy regarding corrective actions for schools failing to make progress toward meeting AMOs is aligned fully with Section 2141 of NCLB. Specifically, the SEA will provide technical assistance to any LEA failing to make progress toward meeting AMOs for two consecutive years. And if any LEA fails to make progress toward its AMOs for a third year, the SEA will restrict the use of its Title I A funds through "Commissioner's Required Actions." PARAPROFESSIONAL REQUIREMENTS The SEA collects data annually on the percentage of Title I funded instructional paraprofessionals who meet the NCLB paraprofessional requirements. The SEA requires that in Title I schools, LEAs may only employ new instructional paraprofessionals who meet the HQP requirements. LEAs have also been repeatedly notified that beyond June 2006 they may not continue to employ in Title I funded positions any instructional paraprofessional who is not HQP. Compliance with this requirement is monitored as noted above in the Accountability and Public Reporting section. ANALYSIS OF HQT DATA Using its 2004-2005 data, the SEA has determined which core areas have the lowest percentage of classes being taught by teachers who do not meet HQT requirements for their assignments. This analysis indicates that in only five content areas is the percentage of classes taught by HQ teachers below 80 percent – general social studies, economics (only 33 classes), reading, Latin, and general science. In the social studies and science situations, the issue is not primarily one of lack of content knowledge but rather of how a course is entered in the Educator Census (the SEA’s electronic tool for collecting statewide teacher assignment data). Many courses entered as “general social studies” or “general science” courses are really history or biology or chemistry courses. Many individuals who do not meet the breadth of our content knowledge requirements across the four social studies or science areas for general social studies or general science assignments have extensive expertise in a particular discipline (usually history and biology or chemistry respectively). These individuals are granted HQT status for the disciplines in which they meet content knowledge requirements but not necessarily for the “general” (i.e., all disciplines) social studies or science endorsement. The SEA continues to provide technical assistance to LEAs in how to correctly enter assignment information into the Census. Meanwhile, the SEA advises educators regarding the additional coursework or testing that is necessary to enable them to meet HQT content knowledge requirements for all the science or social studies areas. Please note that this is NOT an issue with new licensees in these areas since they must pass broad Praxis II tests in order to attain licensure in social studies or science. In the area of reading, the problem is accounted for primarily by individuals who are teaching reading with endorsements that do not cover either the content area or grade levels of their assignments. The SEA is working with LEA and school- level administrators to ensure that each teacher of reading carries one of the endorsements considered “appropriate” for this assignment, and that his/her endorsement matches the grade level(s) he/she is teaching.

While, overall, a very small number of educators still need to take additional coursework, testing, or professional development to meet HQT content knowledge requirements for their licensing endorsement areas, the primary cause of an educator being not-HQT for his/her assignment is an out of subject area or grade level (i.e. “out of field”) assignment. In 2004-2005, over 75 percent of non-HQT classes were taught by teachers who were not properly endorsed for that assignment. The primary way in which the state will increase its percentage of classes taught by HQ teachers is by assisting administrators to understand the key role of appropriate licensure in being HQ for an assignment. The SEA is working with the LEAs to identify and rectify each instance of a mismatch between educator endorsement status and assignment. In many cases, this is as simple as the educator requesting an expansion of his or her endorsement from a 7-12 to K-12 instructional level or an administrator restructuring an educator’s assignment to match the grade levels of his or her endorsement. (Please see sample LEA-level HQT data report attached.) The SEA compared the percentage of HQ teachers in high poverty versus low poverty schools, high minority versus low minority schools, and schools not meeting AYP goals versus schools meeting AYP goals. Based upon these results, the SEA determined that:
• In 2004-2005, there was no “unreasonable” (i.e., 5 percent or greater) discrepancy in the distribution of HQ teachers with regards to these three measures in regular education classrooms in Vermont. (Please see attached Addendum.)
• In Vermont, in 2004-2005, in situations where special educators were providing “primary instruction” in a core content area (i.e., special education “classes”), there was an “unreasonable” (i.e., 5 percent or greater) discrepancy in the distribution of HQ teachers with regards to these three measures. However, the discrepancy was IN FAVOR OF poor students in both elementary and secondary schools. (Please see the attached Addendum.)
The SEA will continue to analyze the data elements identified above to determine whether any other discrepancies arise. In addition, the SEA is in the process of developing a system for tracking educator experience. We are considering a number of options including:
• Using Level I versus Level II licensure status as a proxy for experience • Developing a separate data collection to gather this data • Using teacher retirement system data to determine years of experience
A data gathering system will be selected in the spring of 2007 and data on educator experience within individual schools will be matched against the data on school poverty status and school minority status to determine if discrepancies exist in this area. The SEA will complete its analysis of the experience data and make its determination regarding the need for an equity plan by September 30, 2007.
Our timeline for collection of teacher experience data is the following: March 27-28, 2007 – Attend Title II A State Director's Meeting to discuss how other states are collecting this information. April-May, 2007 – Discuss various options for collecting experience data and determine which method Vermont will use. June 30, 2007 – Collect and analyze experience data in relation to school poverty and minority status. This process will be completed by September 30, 2007. If analysis of experience data yields inequities, then we will address these inequities through actions outlined in a revised Equity Plan. EQUITY PLAN Vermont does not currently have a situation where poor or minority students or students in schools not meeting AYP are disproportionally taught by educators who are not HQT for their assignments. However, as part of its support to schools in need of improvement, the SEA is targeting special assistance to these schools to ensure that they have the highest quality educators. These schools are provided with the intensive support of School Support coordinators. These individuals are familiar with the HQT status of their schools and make connections with professional development providers and coordinate technical assistance to the administrators of these schools regarding appropriate assignments, etc., as needed. In addition, although there is no discrepancy in special educators’ HQT status, overall the HQT status of our special education workforce needs to be addressed. The Higher Education Collaborative (HEC), a collaboration between the SEA, the state colleges and universities, and school districts, provides coursework to educators across the state to enable them to acquire the knowledge and skills to become special educators. SEA Title II staff are working closely with the coordinators of the HEC to ensure that their candidates for licensure have sufficient content knowledge to meet HQT requirements, including reviewing program and course requirements, syllabi, etc. If any further information or clarification is required, please contact Marta Cambra, Director of the Educator Quality Team, at (802) 828-6543 or at [email protected]. Sincerely,
Richard H. Cate Commissioner of Education

Attachments Sample LEA-level non-HQT Report
Addendum Table 1 The percentage of classes taught by highly qualified teachers by high poverty elementary schools versus low poverty elementary schools, high poverty secondary schools versus low poverty secondary schools, high minority schools versus low minority schools, schools identified for improvement versus schools not identified for improvement (both at the school and district levels). Percentage of “core area” regular education classes being taught by a teacher who is HQT for that assignment by School level/ poverty, minority, and AYP (school and district) High poverty elementary schools 87.83% Low poverty elementary schools 87.05% High poverty secondary schools 87.51% Low poverty secondary schools 91.74% High minority schools 90.26% Low minority schools 85.90% Identified schools in need of improvement 90.63% Schools not identified in need of improvement 88.15% Identified districts in need of improvement 89.51% Districts not identified in need of improvement 88.22%
Percentage of “core area” special education assignments being taught by a teacher who is HQT for that assignment by School level/ poverty, minority, and AYP (school and district) High poverty elementary schools 83.96% Low poverty elementary schools 73.83% High poverty secondary schools 75.18% Low poverty secondary schools 40.81% High minority schools 67.28% Low minority schools 67.85% Identified schools in need of improvement 73.01% Schools not identified in need of improvement 65.97% Identified districts in need of improvement 74.67% Districts not identified in need of improvement 65.37%

Poverty measure: Free/ Reduced meals were used a measure for poverty. High/low poverty defined by upper and lower quartiles. Minority measure: Percentage of students reported as being white was used as a measure for minority. High/low minority defined by upper and lower quartiles.

Table 2 The percentage of regular education classes taught by highly qualified teachers by district and their AYP status.
District Name
Total Number of Classes
Classes Taught by HQT
Percentage of Classes Taught by HQT AYP Status
Addison 16 16 100.00% Albany 32 27.5 85.94% Alburg 62 59 95.16% Arlington 117 98 83.76% Athens/Grafton Contract Joint District 10 9 90.00% Bakersfield 49 46 93.88% Barnard 7 7 100.00% Barnet 44 41 93.18% Barre City 176 164 93.18% Barre Town 153 128 83.66% Barstow Joint Contract 64 53 82.81% Barton ID 47 33 70.21% Bellows Falls UHSD #27 153 134.5 87.91% Not Meeting Bennington ID 87 81 93.10% Benson 49 37 75.51% Berkshire 42 42 100.00% Berlin 17 17 100.00% Bethel 99 89 89.90% Black River USD #39 89 89 100.00% Blue Mountain USD #21 91 83 91.21% Bolton 8 8 100.00% Bradford ID 20 19 95.00% Braintree 14 14 100.00% Brandon 24 24 100.00% Brattleboro 77 76 98.70% Brattleboro UHSD #6 456 393 86.18% Bridgewater 15 13 86.67% Bridport 8 8 100.00% Brighton 33 30 90.91% Bristol 34 33 97.06% Brookfield 11 11 100.00% Brookline 3 3 100.00% Brownington 15 15 100.00% Burke 17 17 100.00% Burlington 658 631.5 95.97% Not Meeting Cabot 137 89.5 65.33% Calais 10 10 100.00% Cambridge 25 23 92.00% Canaan 70 64 91.43% Castleton-Hubbardton USD #42 75 66 88.00% Cavendish 25 25 100.00%

Champlain Valley UHSD #15 421 399 94.77% Charleston 33 24 72.73% Charlotte 76 67 88.16% Chelsea 70 65 92.86% Chester-Andover USD #29 21 20 95.24% Clarendon 20 20 100.00% Colchester 379 363 95.78% Not Meeting Concord 62 54.5 87.90% Cornwall 7 6 85.71% Coventry 42 26 61.90% Craftsbury 70 58 82.86% Currier Memorial USD #23 10 9 90.00% Danville 167 125 74.85% Derby 31 31 100.00% Dorset 47 29 61.70% Dover 7 6 85.71% Dummerston 52 42.75 82.21% Duxbury/Waterbury Union #45 76 70 92.11% East Haven 6 5.75 95.83% East Montpelier 21 21 100.00% Eden 14 13 92.86% Elmore 1 1 100.00% Enosburg Falls ID 170 153 90.00% Essex Comm. Ed. Ctr. UHSD #46 566 549 97.00% Essex Junction ID 183 172 93.99% Essex Town 165 139 84.24% Fair Haven 75 74 98.67% Fair Haven UHSD #16 190 155 81.58% Fairfax 200 192 96.00% Fairfield 53 46 86.79% Fairlee 14 14 100.00% Fayston 10 8 80.00% Ferrisburgh 20 17 85.00% Fletcher 9 9 100.00% Flood Brook USD #20 77 65 84.42% Franklin 10 10 100.00% Georgia 104 83 79.81% Glover 40 31 77.50% Granby 3 3 100.00% Grand Isle 55 51 92.73% Granville/Hancock Joint District 17 17 100.00% Green Mountain UHSD #35 125 114 91.20% Guildhall 3 3 100.00% Guilford 41 37 90.24% Halifax 10 4.5 45.00% Hardwick 28 28 100.00% Hartford 422 397 94.08% Hartland 72 71 98.61% Harwood UHSD #19 280 272.5 97.32% Hazen UHSD #26 158 145 91.77%

Highgate 23 23 100.00% Hinesburg 87 85 97.70% Holland 10 9 90.00% Huntington 14 12 85.71% Hyde Park 21 19 90.48% Irasburg 33 27 81.82% Isle La Motte 5 5 100.00% Jamaica 7 7 100.00% Jay/Westfield Joint Contract 9 9 100.00% Jericho 21 20 95.24% Johnson 18 17 94.44% Killington 10 8 80.00% Lake Region UHSD #24 133 123 92.48% Lakeview USD #43 9 9 100.00% Lamoille UHSD #18 300 294 98.00% Leicester 8 7 87.50% Leland & Gray UHSD #34 148 129 87.16% Lincoln 15 12 80.00% Lowell 35 24 68.57% Ludlow 16 15 93.75% Lunenburg 44 38 86.36% Lyndon 65 61 93.85% Manchester 71 47 66.20% Marlboro 24 15 62.50% Mettawee Community Sch UESD 47 18 17 94.44% Middlebury ID #4 30 30 100.00% Middlebury UHSD #3 299 270 90.30% Middlesex 15 13 86.67% Middletown Springs 9 9 100.00% Mill River USD #40 255 203 79.61% Millers Run USD #37 24 15 62.50% Milton ID 311 300 96.46% Not Meeting Missisquoi Valley UHSD #7 297 274.5 92.42% Monkton 15 15 100.00% Montgomery 32 32 100.00% Montpelier 297 236 79.46% Not Meeting Moretown 12 12 100.00% Morgan 9 9 100.00% Morristown 198 181 91.41% Mount Abraham UHSD #28 646 556.3 86.11% Mt. Anthony UHSD #14 479 428.5 89.46% Mt. Holly 10 10 100.00% Mt. Mansfield USD #17 477 437 91.61% New Haven 15 15 100.00% Newark 12 7 58.33% Newbury 17 17 100.00% Newfane 12 9 75.00% Newport City 28 28 100.00% Newport Town 45 28 62.22% North Bennington ID 15 15 100.00%

North Country Jr UHSD #22 114 99 86.84% Not Meeting North Country Sr UHSD #22 265 232 87.55% Not Meeting North Hero 25 21 84.00% Northfield 171 158 92.40% Norton 1 1 100.00% Norwich 28 25 89.29% Orange 35 24 68.57% Orleans ID 33 32 96.97% Orwell 39 38 97.44% Otter Valley UHSD #8 156 145 92.95% Oxbow UHSD #30 187 160 85.56% Peacham 10 7 70.00% Pittsford 20 19 95.00% Plymouth 4 3 75.00% Pomfret 9 8 88.89% Poultney 87 77.5 89.08% Pownal 24 23 95.83% Proctor 95 94 98.95% Putney 80 52 65.00% Randolph 25 25 100.00% Randolph UHSD #2 218 182.5 83.72% Reading 6 5 83.33% Readsboro 17 16 94.12% Richford 109 98 89.91% Richmond 18 18 100.00% Ripton 4 4 100.00% Rivendell Interstate District 38 31 81.58% Rochester 74 69 93.24% Rockingham 151 125 82.78% Roxbury 4 4 100.00% Royalton 103 98.25 95.39% Rutland City 569 472 82.95% Not Meeting Rutland Town 74 60 81.08% Salisbury 12 11 91.67% Shaftsbury 16 16 100.00% Sharon 12 10 83.33% Shelburne 144 85.5 59.38% Sheldon 41 36 87.80% Shoreham 8 7 87.50% Shrewsbury 10 9 90.00% South Burlington 500 427 85.40% South Hero 50 50 100.00% Spaulding HSUD #41 336 287 85.42% Springfield 355 261 73.52% St. Albans City 170 140 82.35% St. Albans Town 177 145 81.92% St. Johnsbury 94 74 78.72% Not Meeting Stamford 14 14 100.00% Starksboro 26 25 96.15% Stockbridge 8 7 87.50%

Stowe 177 169 95.48% Strafford 50 47 94.00% Sudbury 8 8 100.00% Sunderland 11 9 81.82% Sutton 14 13 92.86% Swanton 39 38 97.44% Thetford 16 16 100.00% Tinmouth 8 8 100.00% Townshend 8 8 100.00% Troy 38 30 78.95% Tunbridge 34 32 94.12% Twinfield USD #33 205 165 80.49% U-32 High School (UHSD #32) 374 363 97.06% Underhill ID 11 11 100.00% Underhill Town 11 11 100.00% Vergennes UESD #44 24 19 79.17% Vergennes UHSD #5 228 217 95.18% Vernon 19 19 100.00% Waits River Valley USD #36 68 57 83.82% Waitsfield 14 13 92.86% Walden 22 21 95.45% Wallingford 14 14 100.00% Wardsboro 8 8 100.00% Warren 12 11 91.67% Washington 17 14 82.35% Waterford 37 37 100.00% Waterville 11 10 90.91% Weathersfield 50 44 88.00% Wells 10 8 80.00% West Fairlee 11 11 100.00% West Rutland 123 115 93.50% West Windsor 9 9 100.00% Westford 51 49 96.08% Westminster 24 22 91.67% Weybridge 5 4 80.00% Whiting 7 7 100.00% Whitingham/Wilmington Joint Contract 135 103 76.30% Williamstown 82 68 82.93% Williston 178 132 74.16% Windham 4 4 100.00% Windsor 161 132 81.99% Winooski ID 197 150 76.14% Wolcott 16 16 100.00% Woodbury 11 10 90.91% Woodford 6 5 83.33% Woodside Juvenile Rehab. Ctr. 29 2 6.90% Woodstock 18 17 94.44% Woodstock UHSD #4 207 183 88.41% Worcester 9 9 100.00%
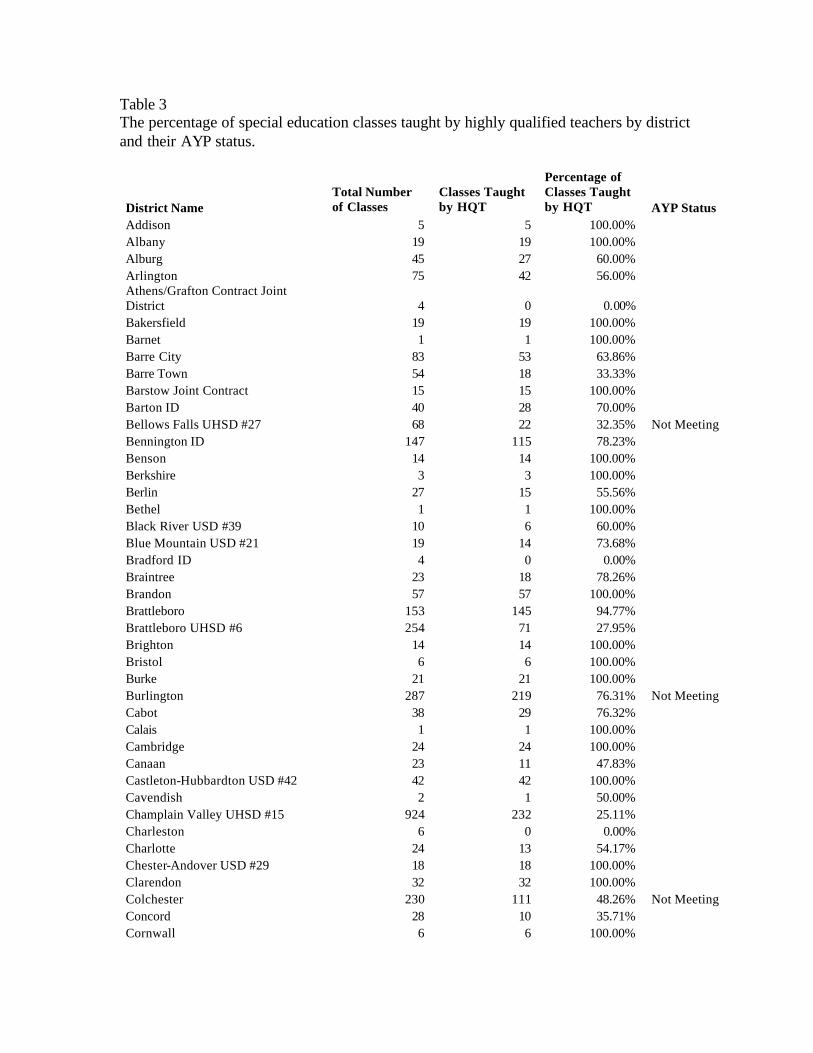
Table 3 The percentage of special education classes taught by highly qualified teachers by district and their AYP status.
District Name Total Number of Classes
Classes Taught by HQT
Percentage of Classes Taught by HQT AYP Status
Addison 5 5 100.00% Albany 19 19 100.00% Alburg 45 27 60.00% Arlington 75 42 56.00% Athens/Grafton Contract Joint District 4 0 0.00% Bakersfield 19 19 100.00% Barnet 1 1 100.00% Barre City 83 53 63.86% Barre Town 54 18 33.33% Barstow Joint Contract 15 15 100.00% Barton ID 40 28 70.00% Bellows Falls UHSD #27 68 22 32.35% Not Meeting Bennington ID 147 115 78.23% Benson 14 14 100.00% Berkshire 3 3 100.00% Berlin 27 15 55.56% Bethel 1 1 100.00% Black River USD #39 10 6 60.00% Blue Mountain USD #21 19 14 73.68% Bradford ID 4 0 0.00% Braintree 23 18 78.26% Brandon 57 57 100.00% Brattleboro 153 145 94.77% Brattleboro UHSD #6 254 71 27.95% Brighton 14 14 100.00% Bristol 6 6 100.00% Burke 21 21 100.00% Burlington 287 219 76.31% Not Meeting Cabot 38 29 76.32% Calais 1 1 100.00% Cambridge 24 24 100.00% Canaan 23 11 47.83% Castleton-Hubbardton USD #42 42 42 100.00% Cavendish 2 1 50.00% Champlain Valley UHSD #15 924 232 25.11% Charleston 6 0 0.00% Charlotte 24 13 54.17% Chester-Andover USD #29 18 18 100.00% Clarendon 32 32 100.00% Colchester 230 111 48.26% Not Meeting Concord 28 10 35.71% Cornwall 6 6 100.00%
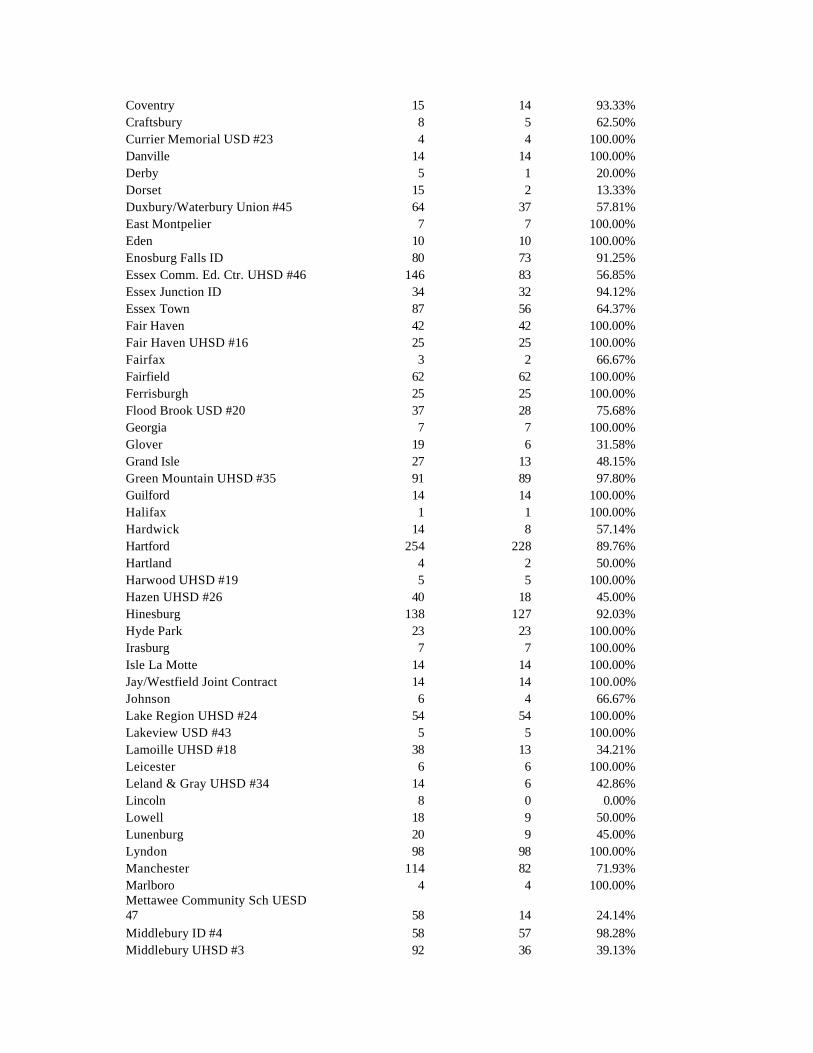
Coventry 15 14 93.33% Craftsbury 8 5 62.50% Currier Memorial USD #23 4 4 100.00% Danville 14 14 100.00% Derby 5 1 20.00% Dorset 15 2 13.33% Duxbury/Waterbury Union #45 64 37 57.81% East Montpelier 7 7 100.00% Eden 10 10 100.00% Enosburg Falls ID 80 73 91.25% Essex Comm. Ed. Ctr. UHSD #46 146 83 56.85% Essex Junction ID 34 32 94.12% Essex Town 87 56 64.37% Fair Haven 42 42 100.00% Fair Haven UHSD #16 25 25 100.00% Fairfax 3 2 66.67% Fairfield 62 62 100.00% Ferrisburgh 25 25 100.00% Flood Brook USD #20 37 28 75.68% Georgia 7 7 100.00% Glover 19 6 31.58% Grand Isle 27 13 48.15% Green Mountain UHSD #35 91 89 97.80% Guilford 14 14 100.00% Halifax 1 1 100.00% Hardwick 14 8 57.14% Hartford 254 228 89.76% Hartland 4 2 50.00% Harwood UHSD #19 5 5 100.00% Hazen UHSD #26 40 18 45.00% Hinesburg 138 127 92.03% Hyde Park 23 23 100.00% Irasburg 7 7 100.00% Isle La Motte 14 14 100.00% Jay/Westfield Joint Contract 14 14 100.00% Johnson 6 4 66.67% Lake Region UHSD #24 54 54 100.00% Lakeview USD #43 5 5 100.00% Lamoille UHSD #18 38 13 34.21% Leicester 6 6 100.00% Leland & Gray UHSD #34 14 6 42.86% Lincoln 8 0 0.00% Lowell 18 9 50.00% Lunenburg 20 9 45.00% Lyndon 98 98 100.00% Manchester 114 82 71.93% Marlboro 4 4 100.00% Mettawee Community Sch UESD 47 58 14 24.14% Middlebury ID #4 58 57 98.28% Middlebury UHSD #3 92 36 39.13%

Middlesex 6 2 33.33% Middletown Springs 9 9 100.00% Mill River USD #40 52 34 65.38% Millers Run USD #37 9 9 100.00% Milton ID 15 10 66.67% Not Meeting Monkton 30 27 90.00% Montgomery 11 7 63.64% Montpelier 231 189 81.82% Not Meeting Moretown 15 15 100.00% Mount Abraham UHSD #28 74 45 60.81% Mt. Anthony UHSD #14 393 309 78.63% Mt. Holly 6 1 16.67% Mt. Mansfield USD #17 75 26 34.67% Newbury 9 9 100.00% Newport City 65 65 100.00% Newport Town 3 3 100.00% North Bennington ID 11 11 100.00% North Country Jr UHSD #22 35 18 51.43% Not Meeting North Country Sr UHSD #22 131 65 49.62% Not Meeting North Hero 18 9 50.00% Northfield 106 93 87.74% Orange 2 0 0.00% Orleans ID 18 18 100.00% Otter Valley UHSD #8 153 97 63.40% Oxbow UHSD #30 31 31 100.00% Pittsford 18 18 100.00% Poultney 24 10 41.67% Pownal 31 31 100.00% Proctor 7 7 100.00% Putney 6 6 100.00% Randolph 56 56 100.00% Randolph UHSD #2 268 108 40.30% Richford 18 14 77.78% Richmond 27 27 100.00% Rochester 14 10 71.43% Rockingham 21 19 90.48% Royalton 1 1 100.00% Rutland City 698 595 85.24% Not Meeting Rutland Town 5 5 100.00% Shaftsbury 21 21 100.00% Shelburne 11 11 100.00% Shoreham 29 29 100.00% Shrewsbury 1 1 100.00% South Burlington 117 67 57.26% South Hero 54 27 50.00% Spaulding HSUD #41 33 33 100.00% Springfield 208 159 76.44% St. Albans City 181 144 79.56% St. Albans Town 71 59 83.10% St. Johnsbury 145 145 100.00% Not Meeting

Stamford 4 4 100.00% Starksboro 58 21 36.21% Sudbury 8 8 100.00% Swanton 7 7 100.00% Thetford 21 6 28.57% Tinmouth 24 24 100.00% Twinfield USD #33 10 5 50.00% U-32 High School (UHSD #32) 50 28 56.00% Vergennes UESD #44 25 19 76.00% Vergennes UHSD #5 72 11 15.28% Vernon 27 27 100.00% Waits River Valley USD #36 21 8 38.10% Waitsfield 6 5 83.33% Walden 18 7 38.89% Wallingford 24 17 70.83% Warren 12 8 66.67% Washington 1 0 0.00% Waterford 22 22 100.00% Waterville 14 0 0.00% Weathersfield 47 40 85.11% Wells 24 24 100.00% West Rutland 36 36 100.00% Westford 60 60 100.00% Westminster 32 19 59.38% Weybridge 9 6 66.67% Williamstown 7 1 14.29% Williston 91 49 53.85% Windsor 8 7 87.50% Winooski ID 75 26 34.67% Wolcott 2 2 100.00% Woodside Juvenile Rehab. Ctr. 36 18 50.00% Woodstock 4 0 0.00%

Table 4 The percentage of regular education classes taught by highly qualified teachers by school and their poverty, minority and AYP status.
School Name
Total Number of Classes
Classes Taught by HQT
Percentage of Classes Taught by HQT
School Type
Poverty Status
Minority Status AYP Status
Addison Central School 16 16 100.00% Elem HighWhite Albany Community School 32 27.5 85.94% Elem HighElem Albert Bridge Sch (W Wind.) 9 9 100.00% Elem Albert D. Lawton School 130 119 91.54% Sec LowSec LowWhite Alburg Community Ed Center 62 59 95.16% Elem HighElem Arlington Memorial 108 90 83.33% Sec Bakersfield School 49 46 93.88% Elem HighWhite Barnard Central School 7 7 100.00% Elem Barnet Elementary School 44 41 93.18% Elem LowWhite Barre City Elem/Middle School 176 164 93.18% Elem HighElem LowWhite Not Meeting Barre Town Elementary School 153 128 83.66% Elem LowElem HighWhite Barstow Memorial School 64 53 82.81% Elem LowElem LowWhite Barton Graded School 47 33 70.21% Elem HighElem Beeman Elementary School 15 15 100.00% Elem LowElem HighWhite Bellows Falls Middle School 113 88 77.88% Elem LowWhite Bellows Falls UHSD #27 153 134.5 87.91% Sec Not Meeting Bennington Elem. School 22 20 90.91% Elem Benson Village School 49 37 75.51% Elem Berkshire Elementary School 42 42 100.00% Elem HighWhite Berlin Elementary School 17 17 100.00% Elem Bethel Elementary School 13 13 100.00% Elem BFA Elementary/Middle School-Fairfax 96 94 97.92% Elem LowElem LowWhite BFA High School-Fairfax 104 98 94.23% Sec Bingham Memorial School 7 6 85.71% Elem LowElem LowWhite Black River USD #39 89 89 100.00% Sec Blue Mountain USD #21 91 83 91.21% Elem HighElem Bradford Elementary School 20 19 95.00% Elem Braintree School 14 14 100.00% Elem HighElem Bratt. Area Middle Sch UHSD #6 117 100 85.47% Sec LowWhite Brattleboro Academy 35 35 100.00% Elem HighElem LowWhite Brattleboro Sr. UHSD #6 338 293 86.69% Sec LowWhite Not Meeting Brewster Pierce School 14 12 85.71% Elem LowElem HighWhite Bridgewater Village School 15 13 86.67% Elem Bridport Central School 8 8 100.00% Elem HighElem Brighton Elementary School 33 30 90.91% Elem HighElem Bristol Elementary School 34 33 97.06% Elem

Brookfield School 11 11 100.00% Elem Brookline Elementary School 3 3 100.00% Elem HighWhite Brownington Central School 15 15 100.00% Elem HighElem Browns River Middle USD #17 121 109 90.08% Elem LowElem Burke Town School 17 17 100.00% Elem Burlington Senior High Sch 317 305.5 96.37% Sec LowWhite Not Meeting C. P. Smith School 17 17 100.00% Elem LowWhite Cabot School 137 89.5 65.33% Elem HighWhite Calais Elementary School 10 10 100.00% Elem Cambridge Elementary School 25 23 92.00% Elem Camels Hump Middle USD #17 84 77 91.67% Elem LowElem Canaan Schools 70 64 91.43% Elem HighWhite Canal St/Oak Grove Schools 19 19 100.00% Elem HighElem LowWhite Castleton-Hubbardton USD#42 75 66 88.00% Elem Catamount Elementary School 27 25 92.59% Elem HighElem Cavendish Town Elem. School 25 25 100.00% Elem Chamberlin School 23 22 95.65% Elem LowWhite Champlain School 17 17 100.00% Elem LowWhite Champlain Valley UHSD #15 421 399 94.77% Sec LowSec Charleston Elem. School 33 24 72.73% Elem HighElem HighWhite Charlotte Central School 76 67 88.16% Elem LowElem Chelsea Elem. High School 70 65 92.86% Elem Cherry Hill Elem. School 8 8 100.00% Elem HighElem Chester-Andover USD #29 21 20 95.24% Elem Clarendon Elementary School 20 20 100.00% Elem Colchester High School 215 203 94.42% Sec LowSec Colchester Middle School 106 102 96.23% Sec LowWhite Concord Schools 62 54.5 87.90% Elem HighElem HighWhite Coventry Village School 42 26 61.90% Elem HighElem Craftsbury Schools 70 58 82.86% Elem HighWhite Crossett Brook Middle USD #45 54 48 88.89% Elem Currier Memorial USD #23 10 9 90.00% Elem HighElem HighWhite Danville School 167 125 74.85% Elem HighWhite Deerfield Valley Elem. Sch 14 14 100.00% Elem LowWhite Derby Elementary School 31 31 100.00% Elem HighElem Dorset School 47 29 61.70% Elem LowElem HighWhite Dothan Brook School 25 24 96.00% Elem LowElem LowWhite Doty Memorial School 9 9 100.00% Elem Dover Elementary School 7 6 85.71% Elem HighWhite Dummerston Schools 52 42.75 82.21% Elem LowElem HighWhite E. Taylor Hatton School 9 9 100.00% Elem HighWhite East Haven River School 6 5.75 95.83% Elem HighElem HighWhite

East Montpelier Elem. Sch 21 21 100.00% Elem LowWhite Eden Central School 14 13 92.86% Elem HighElem Edmunds Elementary School 20 20 100.00% Elem LowWhite Edmunds Middle School 103 98 95.15% Sec HighSec LowWhite Not Meeting Elm Hill School 9 8 88.89% Elem Enosburg Falls Elem. School 24 23 95.83% Elem HighElem LowWhite Enosburg Falls Jr/Sr High Sch 146 130 89.04% Sec HighSec Essex Comm. Ed. Ctr. UHSD #46 530 521 98.30% Sec LowSec LowWhite Essex Elementary School 27 27 100.00% Elem LowElem LowWhite Essex Jct Regional Tech Ctr 36 28 77.78% Sec LowSec Essex Middle School 114 88 77.19% Sec LowSec LowWhite Fair Haven Grade School 75 74 98.67% Elem Not Meeting Fair Haven UHSD #16 190 155 81.58% Sec HighWhite Fairfield Center School 53 46 86.79% Elem Fayston Elementary School 10 8 80.00% Elem LowElem LowWhite Ferrisburgh Central School 20 17 85.00% Elem Fisher School 9 8 88.89% Elem Fletcher Elementary School 9 9 100.00% Elem LowElem Flood Brook USD #20 77 65 84.42% Elem LowElem Folsom Ed. & Community Ctr 50 50 100.00% Elem LowElem HighWhite Founders Memorial School 24 24 100.00% Elem LowElem LowWhite Franklin Central School 10 10 100.00% Elem Frederick H. Tuttle Middle Sch 151 105 69.54% Sec LowSec LowWhite Georgia Elementary School 104 83 79.81% Elem LowElem HighWhite Glover Village School 40 31 77.50% Elem Grafton Elementary School 10 9 90.00% Elem LowWhite Granby Central School 3 3 100.00% Elem HighWhite Grand Isle Elem. School 55 51 92.73% Elem LowElem Green Mountain UHSD #35 125 114 91.20% Sec HighSec HighWhite Green Street School 23 22 95.65% Elem HighElem LowWhite Guildhall Elementary School 3 3 100.00% Elem Guilford Central School 41 37 90.24% Elem LowWhite Halifax West School 10 4.5 45.00% Elem HighWhite Hardwick Elementary School 28 28 100.00% Elem HighElem Hartford Career & Tech. Ctr. 12 0 0.00% Sec Hartford High School 237 231 97.47% Sec LowSec Hartford Mem. Middle School 112 107 95.54% Sec Hartland Elementary School 72 71 98.61% Elem LowElem Harwood UHSD #19 219 214.5 97.95% Sec LowSec Harwood Union Middle UHSD #19 61 58 95.08% Sec LowSec HighWhite Hazen UHSD #26 158 145 91.77% Sec HighSec

Hiawatha School 16 16 100.00% Elem LowElem LowWhite Highgate Schools 23 23 100.00% Elem LowWhite Hinesburg Elementary School 87 85 97.70% Elem LowElem Holland Elementary School 10 9 90.00% Elem HighElem Hyde Park Elementary School 21 19 90.48% Elem Irasburg Village School 33 27 81.82% Elem HighElem LowWhite Isle La Motte Elem. School 5 5 100.00% Elem HighWhite J. F. Kennedy Elem. School 30 30 100.00% Elem HighElem LowWhite J. J. Flynn School 20 20 100.00% Elem HighElem LowWhite Jamaica Village School 7 7 100.00% Elem HighElem HighWhite Jay/Westfield Joint Elementary 9 9 100.00% Elem HighElem HighWhite Jericho Elementary School 21 20 95.24% Elem LowElem Johnson Elementary School 18 17 94.44% Elem HighElem Lake Elmore School 1 1 100.00% Elem HighWhite Lake Region UHSD #24 133 123 92.48% Sec HighSec HighWhite Lakeview USD #43 9 9 100.00% Elem HighElem Lamoille AVC 12 12 100.00% Sec Lamoille UHSD #18 163 160 98.16% Sec Lamoille Union Middle School #18 125 122 97.60% Sec Lawrence Barnes School 15 15 100.00% Elem HighElem LowWhite Leicester Central School 8 7 87.50% Elem HighWhite Leland & Gray UHSD #34 148 129 87.16% Sec Lincoln Community School 15 12 80.00% Elem HighWhite Lothrop School 20 19 95.00% Elem HighWhite Lowell Village School 35 24 68.57% Elem HighElem Ludlow Elementary School 16 15 93.75% Elem HighElem Lunenburg Schools 44 38 86.36% Elem HighWhite Lyman C. Hunt Middle School 134 124 92.54% Sec HighSec LowWhite Lyndon Town School 65 61 93.85% Elem HighElem Not Meeting Main Street School 110 87 79.09% Sec Malletts Bay School 28 28 100.00% Elem LowElem Manchester Elem/Middle School 71 47 66.20% Elem LowElem Marion W. Cross School 28 25 89.29% Elem LowWhite Marlboro Elementary School 24 15 62.50% Elem Mettawee Community Sch USD #47 18 17 94.44% Elem HighWhite Middlebury ID #4 School 30 30 100.00% Elem LowWhite Middlebury Sr. UHSD #3 185 169 91.35% Sec LowSec Middlebury Union Middle Sch #3 81 81 100.00% Sec Middletown Springs Elem School 9 9 100.00% Elem HighWhite Mill River USD #40 255 203 79.61% Sec Millers Run USD #37 24 15 62.50% Elem HighElem Milton Elementary School 57 56 98.25% Elem Not Meeting
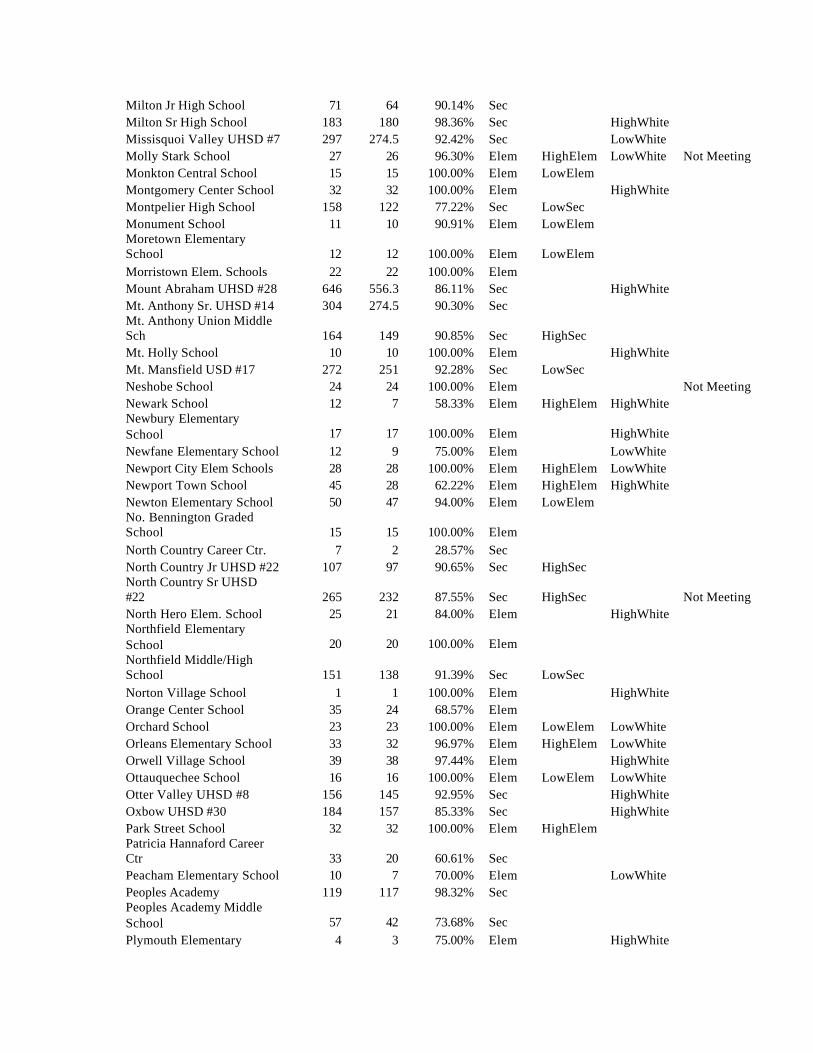
Milton Jr High School 71 64 90.14% Sec Milton Sr High School 183 180 98.36% Sec HighWhite Missisquoi Valley UHSD #7 297 274.5 92.42% Sec LowWhite Molly Stark School 27 26 96.30% Elem HighElem LowWhite Not Meeting Monkton Central School 15 15 100.00% Elem LowElem Montgomery Center School 32 32 100.00% Elem HighWhite Montpelier High School 158 122 77.22% Sec LowSec Monument School 11 10 90.91% Elem LowElem Moretown Elementary School 12 12 100.00% Elem LowElem Morristown Elem. Schools 22 22 100.00% Elem Mount Abraham UHSD #28 646 556.3 86.11% Sec HighWhite Mt. Anthony Sr. UHSD #14 304 274.5 90.30% Sec Mt. Anthony Union Middle Sch 164 149 90.85% Sec HighSec Mt. Holly School 10 10 100.00% Elem HighWhite Mt. Mansfield USD #17 272 251 92.28% Sec LowSec Neshobe School 24 24 100.00% Elem Not Meeting Newark School 12 7 58.33% Elem HighElem HighWhite Newbury Elementary School 17 17 100.00% Elem HighWhite Newfane Elementary School 12 9 75.00% Elem LowWhite Newport City Elem Schools 28 28 100.00% Elem HighElem LowWhite Newport Town School 45 28 62.22% Elem HighElem HighWhite Newton Elementary School 50 47 94.00% Elem LowElem No. Bennington Graded School 15 15 100.00% Elem North Country Career Ctr. 7 2 28.57% Sec North Country Jr UHSD #22 107 97 90.65% Sec HighSec North Country Sr UHSD #22 265 232 87.55% Sec HighSec Not Meeting North Hero Elem. School 25 21 84.00% Elem HighWhite Northfield Elementary School 20 20 100.00% Elem Northfield Middle/High School 151 138 91.39% Sec LowSec Norton Village School 1 1 100.00% Elem HighWhite Orange Center School 35 24 68.57% Elem Orchard School 23 23 100.00% Elem LowElem LowWhite Orleans Elementary School 33 32 96.97% Elem HighElem LowWhite Orwell Village School 39 38 97.44% Elem HighWhite Ottauquechee School 16 16 100.00% Elem LowElem LowWhite Otter Valley UHSD #8 156 145 92.95% Sec HighWhite Oxbow UHSD #30 184 157 85.33% Sec HighWhite Park Street School 32 32 100.00% Elem HighElem Patricia Hannaford Career Ctr 33 20 60.61% Sec Peacham Elementary School 10 7 70.00% Elem LowWhite Peoples Academy 119 117 98.32% Sec Peoples Academy Middle School 57 42 73.68% Sec Plymouth Elementary 4 3 75.00% Elem HighWhite

School Pomfret School 9 8 88.89% Elem LowWhite Porters Point School 16 16 100.00% Elem LowElem Poultney Elementary School 17 17 100.00% Elem Poultney High School 70 60.5 86.43% Sec HighWhite Pownal Ele mentary School 24 23 95.83% Elem HighElem Proctor Elementary School 16 15 93.75% Elem Proctor Jr/Sr High School 79 79 100.00% Sec Putney Central School 80 52 65.00% Elem Randolph AVC 15 2 13.33% Sec Randolph Schools 25 25 100.00% Elem Randolph UHSD #2 203 180.5 88.92% Sec Reading Elementary School 6 5 83.33% Elem HighWhite Readsboro Elementary School 17 16 94.12% Elem HighElem LowWhite Richford Elementary School 31 31 100.00% Elem HighElem HighWhite Richford Jr/Sr High School 78 67 85.90% Sec HighSec HighWhite Richmond Elementary School 18 18 100.00% Elem LowElem HighWhite Ripton Elementary School 4 4 100.00% Elem Rivendell Academy 38 31 81.58% Sec River Bend Career & Tech Ctr 3 3 100.00% Sec Riverside School 92 55 59.78% Sec HighSec Robinson School 26 25 96.15% Elem Rochester Elem/High School 74 69 93.24% Elem LowWhite Rockingham Central Elementary 19 19 100.00% Elem HighElem LowWhite Roxbury Village School 4 4 100.00% Elem Rumney School (Middlesex) 15 13 86.67% Elem LowElem LowWhite Rutland Intermediate School 40 40 100.00% Elem Not Meeting Rutland Middle School 126 116 92.06% Sec HighSec Not Meeting Rutland Northeast Primary Sch 16 14 87.50% Elem Rutland Northwest School 18 18 100.00% Elem HighElem Not Meeting Rutland Senior High School 347 270 77.81% Sec Rutland Town Elem School 74 60 81.08% Elem LowElem HighWhite Salisbury Community School 12 11 91.67% Elem HighWhite Samuel Morey Elementary 14 14 100.00% Elem Saxtons River Elem. School 11 10 90.91% Elem HighWhite Shaftsbury Elem. School 16 16 100.00% Elem LowElem Sharon Elementary School 12 10 83.33% Elem Shelburne Community School 144 85.5 59.38% Elem LowElem Sheldon Elementary School 41 36 87.80% Elem LowWhite Sherburne Elementary School 10 8 80.00% Elem LowElem LowWhite Shoreham Elementary School 8 7 87.50% Elem HighWhite Shrewsbury Mountain 10 9 90.00% Elem LowElem LowWhite

School Smilie Memorial School(Bolton) 8 8 100.00% Elem So. Burlington Central School 29 28 96.55% Elem LowElem LowWhite So. Burlington High School 274 249 90.88% Sec LowSec LowWhite So. Royalton Elem/High School 103 98.25 95.39% Elem Southeastern VT Career Ed Ctr 1 0 0.00% Sec Spaulding HSUD #41 336 287 85.42% Sec Springfield High School 209 153 73.21% Sec St Albans City School 170 140 82.35% Elem LowWhite Not Meeting St. Albans Town Educ. Center 177 145 81.92% Elem St. Johnsbury Schools 94 74 78.72% Elem HighElem Not Meeting Stafford Technical Center 22 14 63.64% Sec Stamford Elementary School 14 14 100.00% Elem LowElem HighWhite Stockbridge Central School 8 7 87.50% Elem HighWhite Stowe Elementary School 19 19 100.00% Elem LowElem Stowe Middle/High School 158 150 94.94% Sec LowSec Sudbury Country School 8 8 100.00% Elem HighWhite Summit Street School 17 17 100.00% Elem LowWhite Sunderland Elem. School 11 9 81.82% Elem HighWhite Sutton Village School 14 13 92.86% Elem HighElem SW VT Career Development Ctr 11 5 45.45% Sec Swanton Schools 39 38 97.44% Elem LowWhite Thatcher Brook Primary USD #45 22 22 100.00% Elem Thetford Elementary School 16 16 100.00% Elem LowElem LowWhite Thomas Fleming School 20 20 100.00% Elem LowElem LowWhite Tinmouth Elementary School 8 8 100.00% Elem Townshend Village School 8 8 100.00% Elem HighWhite Troy School 38 30 78.95% Elem HighElem Tunbridge Central School 34 32 94.12% Elem HighWhite Twin Valley High School 77 48 62.34% Sec HighWhite Twin Valley Middle School 38 36 94.74% Sec HighSec HighWhite Twinfield USD #33 205 165 80.49% Elem U-32 High School (UHSD #32) 374 363 97.06% Sec Underhill Central School 11 11 100.00% Elem LowElem Underhill Graded School 11 11 100.00% Elem LowElem HighWhite Union Elementary School 29 27 93.10% Elem LowWhite Union Memorial School 14 14 100.00% Elem LowElem Union School 13 13 100.00% Elem HighElem LowWhite Vergennes UESD #44 24 19 79.17% Elem Vergennes UHSD #5 228 217 95.18% Sec Vernon Elementary School 19 19 100.00% Elem LowElem Village School, The 17 17 100.00% Elem HighElem

Waits River Valley USD #36 68 57 83.82% Elem HighElem HighWhite Waitsfield Elem. School 14 13 92.86% Elem LowElem LowWhite Walden School 22 21 95.45% Elem Wallingford Village School 14 14 100.00% Elem Wardsboro Central School 8 8 100.00% Elem HighWhite Warren Elementary School 12 11 91.67% Elem LowElem Washington Village School 17 14 82.35% Elem HighWhite Waterford Elementary School 37 37 100.00% Elem LowElem Waterville Elementary School 11 10 90.91% Elem LowWhite Weathersfield Elem. School 10 9 90.00% Elem HighWhite Weathersfield Middle School 40 35 87.50% Elem Wells Village School 10 8 80.00% Elem West Rutland School 123 115 93.50% Elem Westford Elementary School 51 49 96.08% Elem LowElem Westminster Schools 24 22 91.67% Elem Westshire School 11 11 100.00% Elem HighWhite Weybridge Elementary School 5 4 80.00% Elem LowElem HighWhite Wheeler School 15 15 100.00% Elem HighElem LowWhite Whitcomb Jr/Sr High School 86 76 88.37% Sec HighSec LowWhite White River School 20 19 95.00% Elem LowWhite Whiting Village School 7 7 100.00% Elem LowWhite Whitingham School 6 5 83.33% Elem HighWhite Williamstown Elem. School 16 15 93.75% Elem HighWhite Williamstown Middle/High Sch 66 53 80.30% Sec HighWhite Williston Schools 178 132 74.16% Elem LowElem LowWhite Windham Elementary School 4 4 100.00% Elem LowWhite Windsor High School 140 112 80.00% Sec Windsor State Street School 21 20 95.24% Elem Winooski High School 100 96 96.00% Sec HighSec LowWhite Winooski Middle School 67 24 35.82% Sec HighSec LowWhite Wolcott Elementary School 16 16 100.00% Elem HighElem HighWhite Woodbury Elementary School 11 10 90.91% Elem LowElem LowWhite Woodford Hollow School 6 5 83.33% Elem HighElem Woodside Juvenile Rehab. Ctr. 29 2 6.90% Elem HighElem Woodstock Elementary School 18 17 94.44% Elem LowElem Woodstock Sr. UHSD #4 142 124 87.32% Sec LowSec Woodstock Union Middle School 65 59 90.77% Sec LowSec
Poverty measure: Free/ Reduced meals were used a measure for poverty. High/low poverty defined by upper and lower quartiles. Minority measure: Percentage of students reported as being white was used as a measure for minority. High/low minority defined by upper and lower quartiles.

Table 5 The percentage of special education classes taught by highly qualified teachers by school and their poverty, minority and AYP status.
School Name
Total Number of Classes
Classes Taught by HQT
Percentage of Classes Taught by HQT
School Type
Poverty Status
Minority Status AYP Status
Addison Central School 5 5 100.00% Elem HighWhite Albany Community School 19 19 100.00% Elem HighElem Albert D. Lawton School 30 28 93.33% Sec LowSec LowWhite Alburg Community Ed Center 45 27 60.00% Elem HighElem Arlington Memorial 75 42 56.00% Sec Bakersfield School 19 19 100.00% Elem HighWhite Barnet Elementary School 1 1 100.00% Elem LowWhite Barre City Elem/Middle School 83 53 63.86% Elem HighElem LowWhite Not Meeting Barre Town Elementary School 54 18 33.33% Elem LowElem HighWhite Barstow Memorial School 15 15 100.00% Elem LowElem LowWhite Barton Graded School 40 28 70.00% Elem HighElem Bellows Falls UHSD #27 68 22 32.35% Sec Not Meeting Bennington Elem. School 25 25 100.00% Elem Benson Village School 14 14 100.00% Elem Berkshire Elementary School 3 3 100.00% Elem HighWhite Berlin Elementary School 27 15 55.56% Elem BFA Elementary/Middle School-Fairfax 3 2 66.67% Elem LowElem LowWhite Bingham Memorial School 6 6 100.00% Elem LowElem LowWhite Black River USD #39 10 6 60.00% Sec Blue Mountain USD #21 19 14 73.68% Elem HighElem Bradford Elementary School 4 0 0.00% Elem Braintree School 23 18 78.26% Elem HighElem Bratt. Area Middle Sch UHSD #6 73 22 30.14% Sec LowWhite Brattleboro Academy 46 38 82.61% Elem HighElem LowWhite Brattleboro Sr. UHSD #6 181 49 27.07% Sec LowWhite Not Meeting Brighton Elementary School 14 14 100.00% Elem HighElem Bristol Elementary School 6 6 100.00% Elem Browns River Middle USD #17 13 2 15.38% Elem LowElem Burke Town School 21 21 100.00% Elem Burlington Senior High Sch 114 78 68.42% Sec LowWhite Not Meeting C. P. Smith School 7 7 100.00% Elem LowWhite Cabot School 38 29 76.32% Elem HighWhite Calais Elementary School 1 1 100.00% Elem Cambridge Elementary School 24 24 100.00% Elem Camels Hump Middle USD #17 28 15 53.57% Elem LowElem

Canaan Schools 23 11 47.83% Elem HighWhite Canal St/Oak Grove Schools 75 75 100.00% Elem HighElem LowWhite Castleton-Hubbardton USD#42 42 42 100.00% Elem Catamount Elementary School 48 48 100.00% Elem HighElem Cavendish Town Elem. School 2 1 50.00% Elem Chamberlin School 17 17 100.00% Elem LowWhite Champlain Valley UHSD #15 924 232 25.11% Sec LowSec Charleston Elem. School 6 0 0.00% Elem HighElem HighWhite Charlotte Central School 24 13 54.17% Elem LowElem Cherry Hill Elem. School 4 4 100.00% Elem HighElem Chester-Andover USD #29 18 18 100.00% Elem Clarendon Elementary School 32 32 100.00% Elem Colchester High School 104 26 25.00% Sec LowSec Colchester Middle School 73 35 47.95% Sec LowWhite Concord Schools 28 10 35.71% Elem HighElem HighWhite Coventry Village School 15 14 93.33% Elem HighElem Craftsbury Schools 8 5 62.50% Elem HighWhite Crossett Brook Middle USD #45 58 31 53.45% Elem Currier Memorial USD #23 4 4 100.00% Elem HighElem HighWhite Danville School 14 14 100.00% Elem HighWhite Derby Elementary School 5 1 20.00% Elem HighElem Dorset School 15 2 13.33% Elem LowElem HighWhite Dothan Brook School 10 7 70.00% Elem LowElem LowWhite East Montpelier Elem. Sch 7 7 100.00% Elem LowWhite Eden Central School 10 10 100.00% Elem HighElem Edmunds Middle School 9 9 100.00% Sec HighSec LowWhite Not Meeting Enosburg Falls Elem. School 23 19 82.61% Elem HighElem LowWhite Enosburg Falls Jr/Sr High Sch 57 54 94.74% Sec HighSec Essex Comm. Ed. Ctr. UHSD #46 146 83 56.85% Sec LowSec LowWhite Essex Middle School 87 56 64.37% Sec LowSec LowWhite Fair Haven Grade School 42 42 100.00% Elem Not Meeting Fair Haven UHSD #16 25 25 100.00% Sec HighWhite Fairfield Center School 62 62 100.00% Elem Ferrisburgh Central School 25 25 100.00% Elem Flood Brook USD #20 37 28 75.68% Elem LowElem Folsom Ed. & Community Ctr 54 27 50.00% Elem LowElem HighWhite Frederick H. Tuttle Middle Sch 61 21 34.43% Sec LowSec LowWhite Georgia Elementary School 7 7 100.00% Elem LowElem HighWhite Glover Village School 19 6 31.58% Elem Grafton Elementary School 4 0 0.00% Elem LowWhite Grand Isle Elem. School 27 13 48.15% Elem LowElem

Green Mountain UHSD #35 91 89 97.80% Sec HighSec HighWhite Green Street School 32 32 100.00% Elem HighElem LowWhite Guilford Central School 14 14 100.00% Elem LowWhite Halifax West School 1 1 100.00% Elem HighWhite Hardwick Elementary School 14 8 57.14% Elem HighElem Hartford High School 146 124 84.93% Sec LowSec Hartford Mem. Middle School 67 67 100.00% Sec Hartland Elementary School 4 2 50.00% Elem LowElem Harwood UHSD #19 5 5 100.00% Sec LowSec Hazen UHSD #26 40 18 45.00% Sec HighSec Hinesburg Elementary School 138 127 92.03% Elem LowElem Hyde Park Elementary School 23 23 100.00% Elem Irasburg Village School 7 7 100.00% Elem HighElem LowWhite Isle La Motte Elem. School 14 14 100.00% Elem HighWhite Jay/Westfield Joint Elementary 14 14 100.00% Elem HighElem HighWhite Johnson Elementary School 6 4 66.67% Elem HighElem Lake Region UHSD #24 54 54 100.00% Sec HighSec HighWhite Lakeview USD #43 5 5 100.00% Elem HighElem Lamoille UHSD #18 14 0 0.00% Sec Lamoille Union Middle School #18 24 13 54.17% Sec Leicester Central School 6 6 100.00% Elem HighWhite Leland & Gray UHSD #34 14 6 42.86% Sec Lincoln Community School 8 0 0.00% Elem HighWhite Lothrop School 18 18 100.00% Elem HighWhite Lowell Village School 18 9 50.00% Elem HighElem Lunenburg Schools 20 9 45.00% Elem HighWhite Lyman C. Hunt Middle School 17 15 88.24% Sec HighSec LowWhite Lyndon Town School 98 98 100.00% Elem HighElem Not Meeting Main Street School 25 25 100.00% Sec Malletts Bay School 38 35 92.11% Elem LowElem Manchester Elem/Middle School 114 82 71.93% Elem LowElem Marlboro Elementary School 4 4 100.00% Elem Mettawee Community Sch USD #47 58 14 24.14% Elem HighWhite Middlebury ID #4 School 58 57 98.28% Elem LowWhite Middlebury Sr. UHSD #3 24 3 12.50% Sec LowSec Middlebury Union Middle Sch #3 68 33 48.53% Sec Middletown Springs Elem School 9 9 100.00% Elem HighWhite Mill River USD #40 52 34 65.38% Sec Millers Run USD #37 9 9 100.00% Elem HighElem Milton Jr High School 10 10 100.00% Sec Milton Sr High School 5 0 0.00% Sec HighWhite

Molly Stark School 74 42 56.76% Elem HighElem LowWhite Not Meeting Monkton Central School 30 27 90.00% Elem LowElem Montgomery Center School 11 7 63.64% Elem HighWhite Montpelier High School 59 47 79.66% Sec LowSec Moretown Elementary School 15 15 100.00% Elem LowElem Mount Abraham UHSD #28 74 45 60.81% Sec HighWhite Mt. Anthony Sr. UHSD #14 144 90 62.50% Sec Mt. Anthony Union Middle Sch 249 219 87.95% Sec HighSec Mt. Holly School 6 1 16.67% Elem HighWhite Mt. Mansfield USD #17 34 9 26.47% Sec LowSec Neshobe School 57 57 100.00% Elem Not Meeting Newbury Elementary School 9 9 100.00% Elem HighWhite Newport City Elem Schools 65 65 100.00% Elem HighElem LowWhite Newport Town School 3 3 100.00% Elem HighElem HighWhite No. Bennington Graded School 11 11 100.00% Elem North Country Jr UHSD #22 35 18 51.43% Sec HighSec North Country Sr UHSD #22 131 65 49.62% Sec HighSec Not Meeting North Hero Elem. School 18 9 50.00% Elem HighWhite Northfield Elementary School 69 58 84.06% Elem Northfield Middle/High School 37 35 94.59% Sec LowSec Ontop 90 60 66.67% Sec HighSec LowWhite Orange Center School 2 0 0.00% Elem Orchard School 2 2 100.00% Elem LowElem LowWhite Orleans Elementary School 18 18 100.00% Elem HighElem LowWhite Ottauquechee School 14 14 100.00% Elem LowElem LowWhite Otter Valley UHSD #8 153 97 63.40% Sec HighWhite Oxbow UHSD #30 31 31 100.00% Sec HighWhite Park Street School 57 57 100.00% Elem HighElem Porters Point School 13 13 100.00% Elem LowElem Poultney High School 24 10 41.67% Sec HighWhite Pownal Elementary School 31 31 100.00% Elem HighElem Proctor Elementary School 7 7 100.00% Elem Putney Central School 6 6 100.00% Elem Randolph AVC 240 100 41.67% Sec Randolph Schools 56 56 100.00% Elem Randolph UHSD #2 28 8 28.57% Sec Richford Elementary School 18 14 77.78% Elem HighElem HighWhite Richmond Elementary School 27 27 100.00% Elem LowElem HighWhite Riverside School 60 56 93.33% Sec HighSec Robinson School 58 21 36.21% Elem Rochester Elem/High School 14 10 71.43% Elem LowWhite Rockingham Central Elementary 16 14 87.50% Elem HighElem LowWhite

Rumney School (Middlesex) 6 2 33.33% Elem LowElem LowWhite Rutland Intermediate School 280 259 92.50% Elem Not Meeting Rutland Middle School 58 43 74.14% Sec HighSec Not Meeting Rutland Northeast Primary Sch 91 73 80.22% Elem Rutland Northwest School 128 98 76.56% Elem HighElem Not Meeting Rutland Senior High School 141 122 86.52% Sec Rutland Town Elem School 5 5 100.00% Elem LowElem HighWhite Saxtons River Elem. School 1 1 100.00% Elem HighWhite Shaftsbury Elem. School 21 21 100.00% Elem LowElem Shelburne Community School 11 11 100.00% Elem LowElem Shoreham Elementary School 29 29 100.00% Elem HighWhite Shrewsbury Mountain School 1 1 100.00% Elem LowElem LowWhite So. Burlington Central School 8 8 100.00% Elem LowElem LowWhite So. Burlington High School 29 19 65.52% Sec LowSec LowWhite So. Royalton Elem/High School 1 1 100.00% Elem Spaulding HSUD #41 33 33 100.00% Sec Springfield High School 50 5 10.00% Sec St Albans City School 181 144 79.56% Elem LowWhite Not Meeting St. Albans Town Educ. Center 71 59 83.10% Elem St. Johnsbury Schools 145 145 100.00% Elem HighElem Not Meeting Stamford Elementary School 4 4 100.00% Elem LowElem HighWhite Sudbury Country School 8 8 100.00% Elem HighWhite Summit Street School 1 1 100.00% Elem LowWhite Swanton Schools 7 7 100.00% Elem LowWhite Thatcher Brook Primary USD #45 6 6 100.00% Elem Thetford Elementary School 21 6 28.57% Elem LowElem LowWhite Thomas Fleming School 3 3 100.00% Elem LowElem LowWhite Tinmouth Elementary School 24 24 100.00% Elem Twinfield USD #33 10 5 50.00% Elem U-32 High School (UHSD #32) 50 28 56.00% Sec Union Elementary School 147 117 79.59% Elem LowWhite Union Memorial School 2 2 100.00% Elem LowElem Union School 41 41 100.00% Elem HighElem LowWhite Vergennes UESD #44 25 19 76.00% Elem Vergennes UHSD #5 72 11 15.28% Sec Vernon Elementary School 27 27 100.00% Elem LowElem Waits River Valley USD #36 21 8 38.10% Elem HighElem HighWhite Waitsfield Elem. School 6 5 83.33% Elem LowElem LowWhite Walden School 18 7 38.89% Elem Wallingford Village School 24 17 70.83% Elem Warren Elementary School 12 8 66.67% Elem LowElem
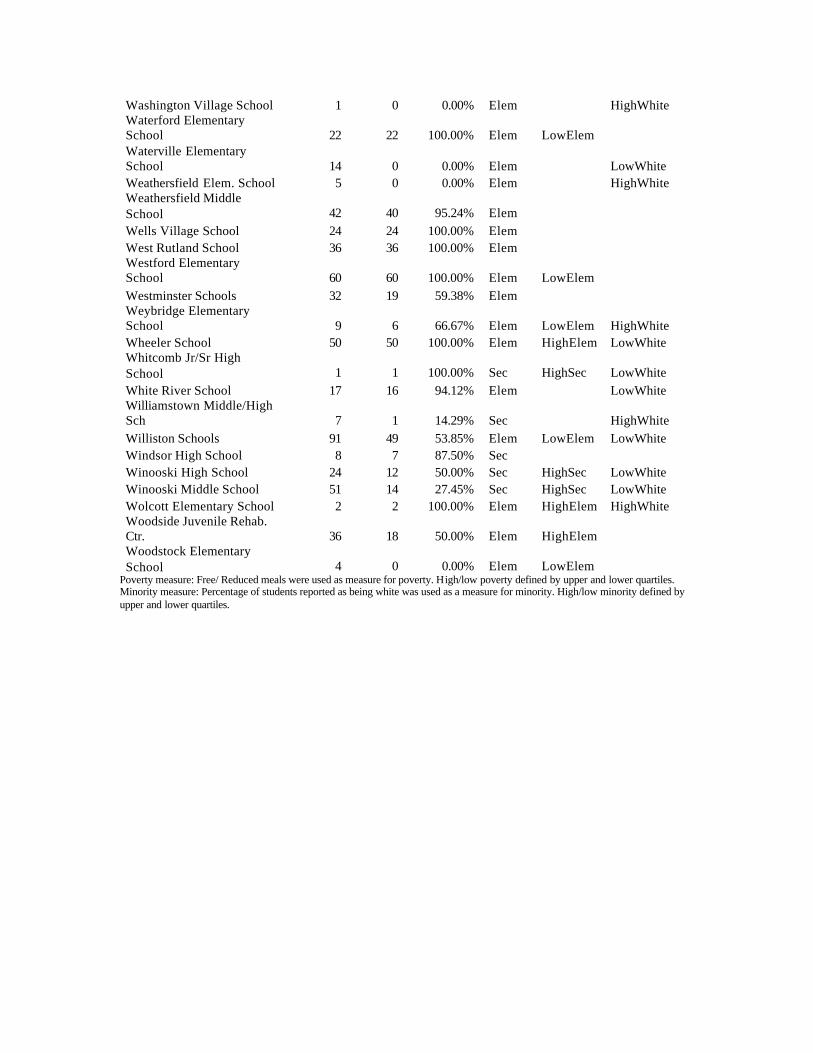
Washington Village School 1 0 0.00% Elem HighWhite Waterford Elementary School 22 22 100.00% Elem LowElem Waterville Elementary School 14 0 0.00% Elem LowWhite Weathersfield Elem. School 5 0 0.00% Elem HighWhite Weathersfield Middle School 42 40 95.24% Elem Wells Village School 24 24 100.00% Elem West Rutland School 36 36 100.00% Elem Westford Elementary School 60 60 100.00% Elem LowElem Westminster Schools 32 19 59.38% Elem Weybridge Elementary School 9 6 66.67% Elem LowElem HighWhite Wheeler School 50 50 100.00% Elem HighElem LowWhite Whitcomb Jr/Sr High School 1 1 100.00% Sec HighSec LowWhite White River School 17 16 94.12% Elem LowWhite Williamstown Middle/High Sch 7 1 14.29% Sec HighWhite Williston Schools 91 49 53.85% Elem LowElem LowWhite Windsor High School 8 7 87.50% Sec Winooski High School 24 12 50.00% Sec HighSec LowWhite Winooski Middle School 51 14 27.45% Sec HighSec LowWhite Wolcott Elementary School 2 2 100.00% Elem HighElem HighWhite Woodside Juvenile Rehab. Ctr. 36 18 50.00% Elem HighElem Woodstock Elementary School 4 0 0.00% Elem LowElem
Poverty measure: Free/ Reduced meals were used as measure for poverty. High/low poverty defined by upper and lower quartiles. Minority measure: Percentage of students reported as being white was used as a measure for minority. High/low minority defined by upper and lower quartiles.