unit i introduction concepts of quality … · cs621 – software quality management unit - i mtech...
TRANSCRIPT

CS621 – Software Quality Management Unit - I
MTech CSE (PT, 2011-14) SRM, Ramapuram 1 hcr:innovationcse@gg
UNIT I INTRODUCTION Concepts of Quality Control, Quality Assurance, Quality Management - Total Quality Management; Cost of
Quality; QC tools - 7 QC Tools and Modern Tools; Other related topics - Business Process Re-engineering -
Zero Defect, Six Sigma, Quality Function Deployment, Benchmarking, Statistical process control
CONCEPTS OF QUALITY CONTROL Software Quality
Fitness for use – Boehm
Conformance to user requirement – Phil Crosby
Striving for excellence – Edward Deming
Achieving Excellent level of reliability, Maintainability, Portability – Watt Humphrey
Low defect level – Tom McCabe
Quality is people – Allan Gillies
Why Software Quality is Important
one of major customer’s demand
competitive issue
important for survival in global market
makes the manufacturer to global reach
cost effective, increases the profit
critical for survival and success
a hall mark for world class business
Quality criteria are not independent
View of quality differs from one to other
User satisfaction = Complaint product + good quality + Delivery within budget and schedule
Why Software Quality is Difficult
Software has no physical existence
Lack of knowledge of client needs at the start
Change of client needs over time
Rapid rate of change in both H/W and S/W
High expectations of customer with respect to adaptability
View Of Quality
Transcendent view
o It relates quality to innate excellence
Product based view
o Quality is free of cost – Crosby. 80% development cost for maintenance
User based view
o Fitness for purpose, needs, use
Manufacturing view
o Conformance to requirements – CASE, TQM, Zero defect approach
Value base view
o Affordable price for product by customer
Changing View of Quality
Past Present
Responsibility of to blue-collar workers and employees
working on the product
Everyone’s Responsibility including over head staff
Defects were hidden from customer and management Defects are brought to surface of corrective action and
highlighted
Quality problem leads to fault justification Quality problem leads to co-operative solutions

CS621 – Software Quality Management Unit - I
MTech CSE (PT, 2011-14) SRM, Ramapuram 2 hcr:innovationcse@gg
Quality is internally focused Quality is customer focused
Quality Check occurred during the project execution Quality check occurs at project initiation and continues
till maintenance
Increasing quality led to increasing project cost Improving quality saves money and increases money
Correction to quality problems was accompanied with
minimum documention
Documentation are essential so that the mistakes are
not repeated
How to Achieve a Quality Software
Software quality control – Corrective action
Software Quality Assurance – Preventive action
Total Quality management – Managing the entire organisation to achieve excellence
Eight dimensions of quality (PFR-CD-SAP)
Performance
o Primary operating characteristics of a product
Features
o Bells and whistles of a product
Reliability
o Reflects the probability of a product failing within a specified period of time
o MTFF / MTBF
Conformance
o Degree to which product design and operating characteristics match preestablished standards
Durability
o Measure of product life
Serviceability
o Speed / competency and efficiency of repair
o MTTR
Aesthetics
o Subjective
o Looks, feels, sounds, tastes ans smells
o Individual preference
Perceived quality
o Indirect method of comparing of brands
SOFTWARE QUALITY CONTROL Corrective Approach
Operational techniques and activities used to fulfil the requirements for quality
Ensuring that procedures and standards are being followed
Key Concept of Software Quality Control
All work product should be defined
There exists manageable specifications
Output of each process should be comparable
There should be feedback loop
It should minimize the variation control between predicted project with actual project
Two Approaches to Software Quality Control
Quality Review
o Design or program inspection - To detect detailed errors occurred during the software life cycle. Check
list of possible error drives the review
o Progress review – Overall progress of project both process and product
o Quality review – to find the mismatch of requirements, to meet the standards
Automated software assessment and measurement
o Seven QC tools
o Modern QC tools
CS621 – Software Quality Management Unit - I
MTech CSE (PT, 2011-14) SRM, Ramapuram 3 hcr:innovationcse@gg
o Structured System and Design Method (SSADM)
o Information Engineering Methodology(IEM)
o CASE Tools
QUALITY ASSURANCE Software Quality Assurance
Preventive Approach
It is the planned and systematic activities implemented within the quality systems
Why Software Quality Assurance is important
If team size grows and manager involves in other duties, then the monitoring of work is not done
To motivate the people to monitor each other
To ensure the inadequacies in the project or process or product
To ensure full compliance with the established standards
Responsibilities of SQA
Review the all developments and quality plans for completeness
Review all test plans for adherence to standards
Review a significant sample of all test results to determine adherence to plans
Periodically audit SCM performance to determine adherence to standards
Participate as inspection moderators in design and code inspections
Benefits of Quality assurance
An appropriate development methodology is in place
The projects use standards and procedures in the work
Independent reviews and audits are conducted
Documentation is produced to support maintenance and enhancement
The documentation is produced during the development
Mechanisms are in place and used to control changes
Testing emphasizes all the high risk product areas
Deviation from standards and procedures are exposed as soon as possible
The project is auditable by external professionals
The SQA plan and development plan are compatible
Eight Steps to launch a SQA program
Initiate SQA Program – Management commitment, Goal documentation, Identify the resp. and team leader
Identify the SQA issues
Write a SQA program – Identify the standards and procedure, Define SQA audit and control activities
Establish Standards
Establish SQA functions
Conduct training and promote the SQA program
Implement the SQA plan – SQA activity is assigned to SQA personnel
Evaluate the SQA program – periodical audit, corrective action and preventive action
Various Standards to Achieve SQA
ISO 9000, 9001
SPICE - Software Process Improvement and Capability dEtermination
CMM
CMMI – Capability Maturity Model Integration
Software Quality Control Software Quality Assurance
Corrective (reactive) Preventive (proactive)
Product Processes
Confidence to producer Confidence to Customers

CS621 – Software Quality Management Unit - I
MTech CSE (PT, 2011-14) SRM, Ramapuram 4 hcr:innovationcse@gg
Line Function Staff Function
Find Defects Prevent Defects
Walkthrough Defining processes
Testing Quality Audit
Inspection Selection of tools
Checkpoint Review Training
TOTAL QUALITY MANAGEMENT Total - Made up of the whole
Quality - degree of excellence a product or service provides
Management - Act, art or manner of planning, controlling, directing
Therefore, TQM is the art of managing the whole to achieve excellence
Goal Of TQM
“Do the right things right the first time, every time.”
TQM is all managers leading and facilitating all contributors in everyone’s two main objectives:
Total client satisfaction through quality products and services;
Continuous improvements to processes systems, people, suppliers, partners, products, and services.
Elements of TQM
Top management commitment and involvement
Customer involvement
Design products for quality
Design production processes for quality
Control production processes for quality
Develop supplier partnerships
Customer service, distribution and installation
Building teams of empowered employees
Benchmarking and continuous improvement
Basic Tenets (Beliefs) of TQM
The customer makes the ultimate determination of quality.
Top Management must provide leadership and support for all quality initiatives.
Preventing variability is the key to producing high quality.
CS621 – Software Quality Management Unit - I
MTech CSE (PT, 2011-14) SRM, Ramapuram 5 hcr:innovationcse@gg
Quality goals are a moving target, thereby requiring a commitment toward continuous improvement.
Improving quality requires the establishment of effective metrics. We must speak with data and facts not
just opinions
Traditional Approach Continuous Improvement
Market-share focus
Individuals
Focus on ‘who” and “why”
Short-term focus
Status quo focus
Product focus
Innovation
Fire fighting
Customer focus
Cross-functional teams
Focus on “what” and “how”
Long-term focus
Continuous improvement
Process improvement focus
Incremental improvements
Problem solving
COST OF QUALITY (COQ) Cost of quality is the sum of costs incurred by an organization in preventing poor quality
Quality costs are the costs associated with preventing, finding, and correcting defective work.
Quality is cost effective.
It enables the management to reduce the defect correction cost
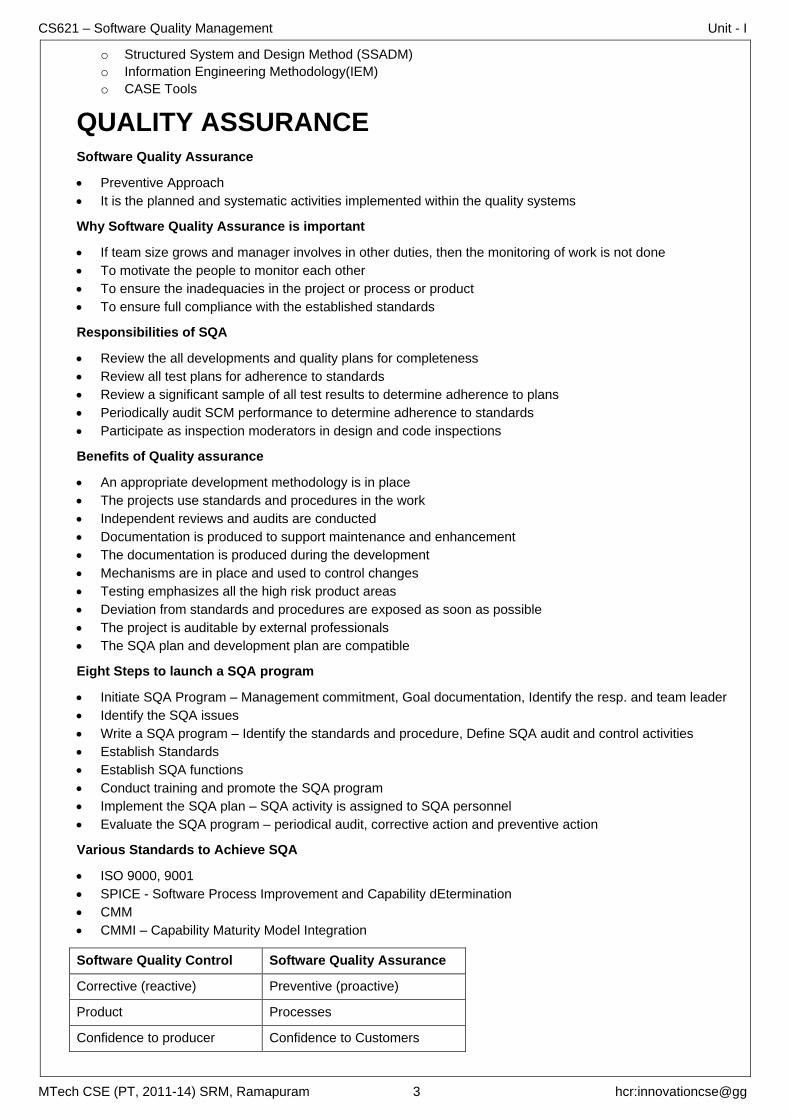
Types of Quality Costs (PAF Model)
Prevention cost
o Quality planning, formal technical review, testing, training
Appraisal cost
o Equipment calibration, inter-process inspection, in-process inspection
Failure cost
o incurred in correcting defects found by appraisal.
o Internal failure cost (rework and repair)
o External failure cost (defects found after shipment)
Prevention Cost
Staff Training
Requirement analysis
Early prototyping
Fault tolerant design
Defensive programming
Usability analysis
Clear specification
Accurate internal doc.
Appraisal cost
Design Review
Code inspection
Glass box testing
White box testing
Training testers
Beta testing
Test automation
Usability testing
Internal Failure
Bug fixes
Regression testing
Wasted in-house user time
Wasted writer time
Wasted marketer time
Wasted advertisement
Direct cost of late shipment
External Failure
Warranty cost
Liability cost
Penalties
Preparation support answer book
Investigation of customer support
PR work, Investigation of customer complaint
CS621 – Software Quality Management Unit - I
MTech CSE (PT, 2011-14) SRM, Ramapuram 6 hcr:innovationcse@gg
7 QC TOOLS – CFC-HPCS
Why Seven QC Tools
Improve Quality
Decrease Costs
Improve Productivity
Decrease Price
Increase Market
Stay in Business
Provide More Jobs
Return on Investment
Six Problem solving Steps
Identify - recognize the symptoms
Define - Agree on the problem and set boundaries
Investigate - Collect data
Analyze - Use quality tools to aid
Solve - Develop the solution and implement
Confirm - Follow up to ensure that the solution is effective
7 QC Tools
Cause and Effect Diagrams
Flow Charts
Check sheets
Histograms
Pareto Charts
Control Charts
Scatter Diagrams
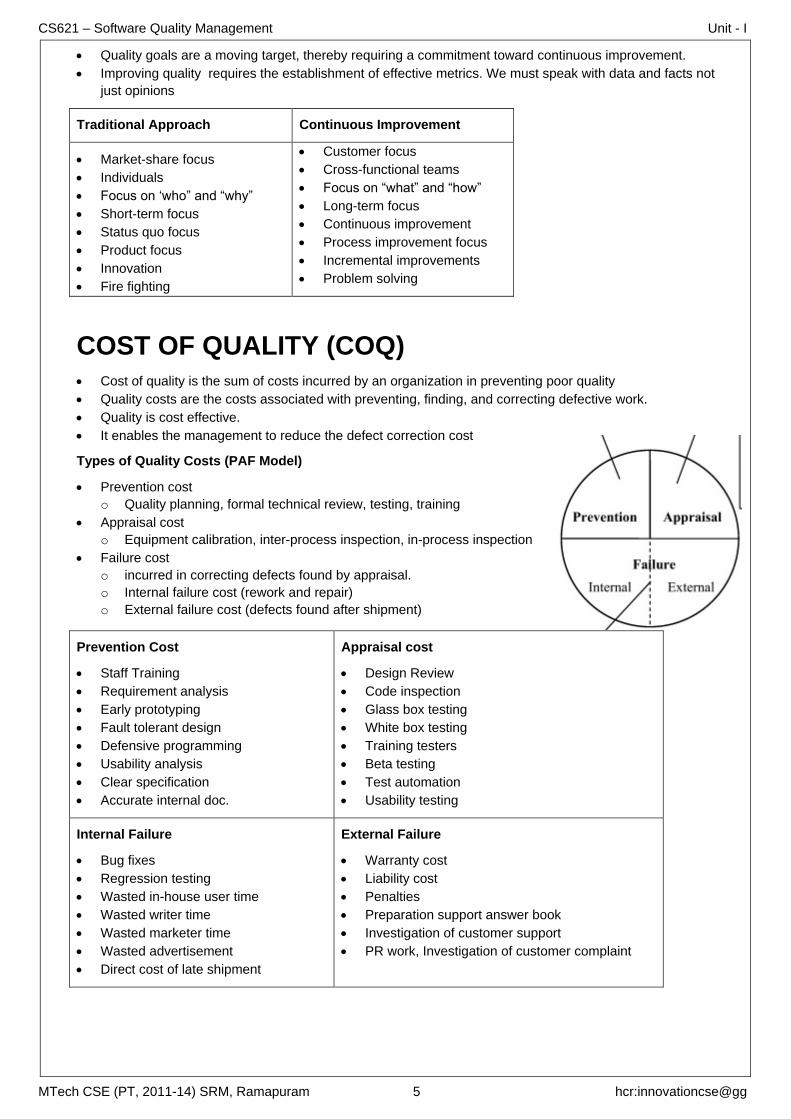
Cause and Effect Diagrams
Also called as Fish bone / Ishikawa diagram
Purpose
o Graphical representation of the trail leading to the root cause of a problem
How is it done?
o Decide which quality characteristic, outcome or effect you want to examine (may use Pareto chart)
o Backbone –draw straight line
o Ribs – categories
o Medium size bones –secondary causes
o Small bones – root causes
Benefits:
o Breaks problems down into bite-size pieces to find
root cause
o Fosters team work
o Common understanding of factors causing the
problem
o Road map to verify picture of the process
o Follows brainstorming relationship
Flow Charts
Purpose:
o Visual illustration of the sequence of
operations required to complete a task
o Schematic drawing of the process to
measure or improve.
o Starting point for process improvement
o Potential weakness in the process are
made visual.
o Picture of process as it should be.
Benefits:
o Identify process improvements
o Understand the process
o Shows duplicated effort and other non-
value-added steps

CS621 – Software Quality Management Unit - I
MTech CSE (PT, 2011-14) SRM, Ramapuram 7 hcr:innovationcse@gg
o Clarify working relationships between people and organizations
o Target specific steps in the process for improvement.
o Show what actually happens at each step in the process
o Show what happens when non-standard events occur
o Graphically display processes to identify redundancies and other wasted effort
How is it done?
o Write the process step inside each symbol
o Connect the Symbols with arrows showing the direction of flow
Check sheets
Purpose:
o Tool for collecting and organizing measured or counted data
o Data collected can be used as input data for other quality tools
Benefits:
o Collect data in a systematic and organized manner
o To determine source of problem
o To facilitate classification of data (stratification)
Histograms
Purpose:
o To determine the spread or variation of a set of data points in a graphical form
How is it done?:
o Collect data, 50-100 data point
o Determine the range of the data
o Calculate the size of the class interval
o Divide data points into classes Determine the
class boundary
o Count # of data points in each class
o Draw the histogram
Benefits:
o Allows you to understand at a glance the
variation that exists in a process
o The shape of the histogram will show process
behavior
o Often, it will tell you to dig deeper for otherwise
unseen causes of variation.
o The shape and size of the dispersion will help
identify otherwise hidden sources of variation
o Used to determine the capability of a process
o Starting point for the improvement process
Pareto Charts
Purpose:
o Prioritize problems.
How is it done?
o Create a preliminary list of problem
classifications.
o Tally the occurrences in each problem
classification.
o Arrange each classification in order
from highest to lowest
o Construct the bar chart
Benefits:
o Pareto analysis helps graphically display
results so the significant few problems
emerge from the general background
o It tells you what to work on first
CS621 – Software Quality Management Unit - I
MTech CSE (PT, 2011-14) SRM, Ramapuram 8 hcr:innovationcse@gg
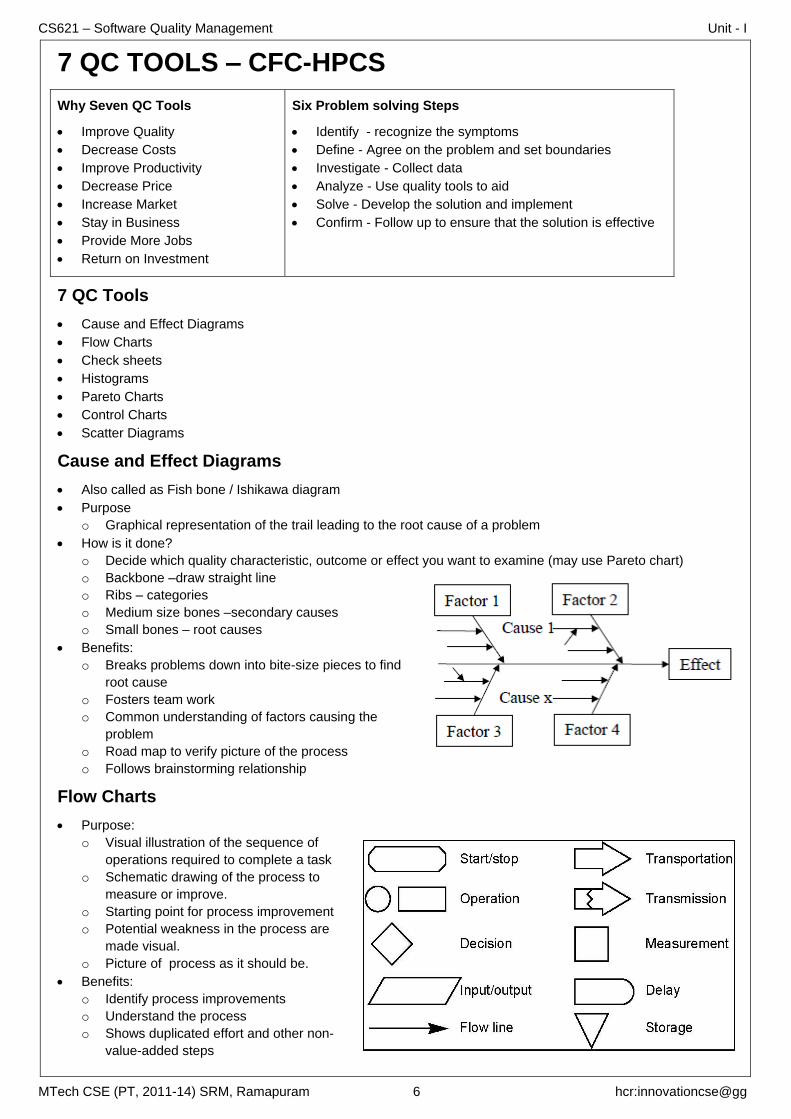
Control Charts
Purpose:
o The primary purpose of a control chart is to predict expected product outcome.
Benefits:
o Predict process out of control and out of specification limits
o Distinguish between specific, identifiable causes of variation
o Can be used for statistical process control
How is it done?
o The data must have a normal distribution (bell curve).
o Have 20 or more data points. Fifteen is the absolute minimum.
o List the data points in time order. Determine the range between each of the consecutive data points.
o Find the mean or average of the data point values.
o Calculate the control limits (three standard deviations)
o Set up the scales for your control chart.
o Draw a solid line representing the data mean.
o Draw the upper and lower control limits.
o Plot the data points in time sequence.
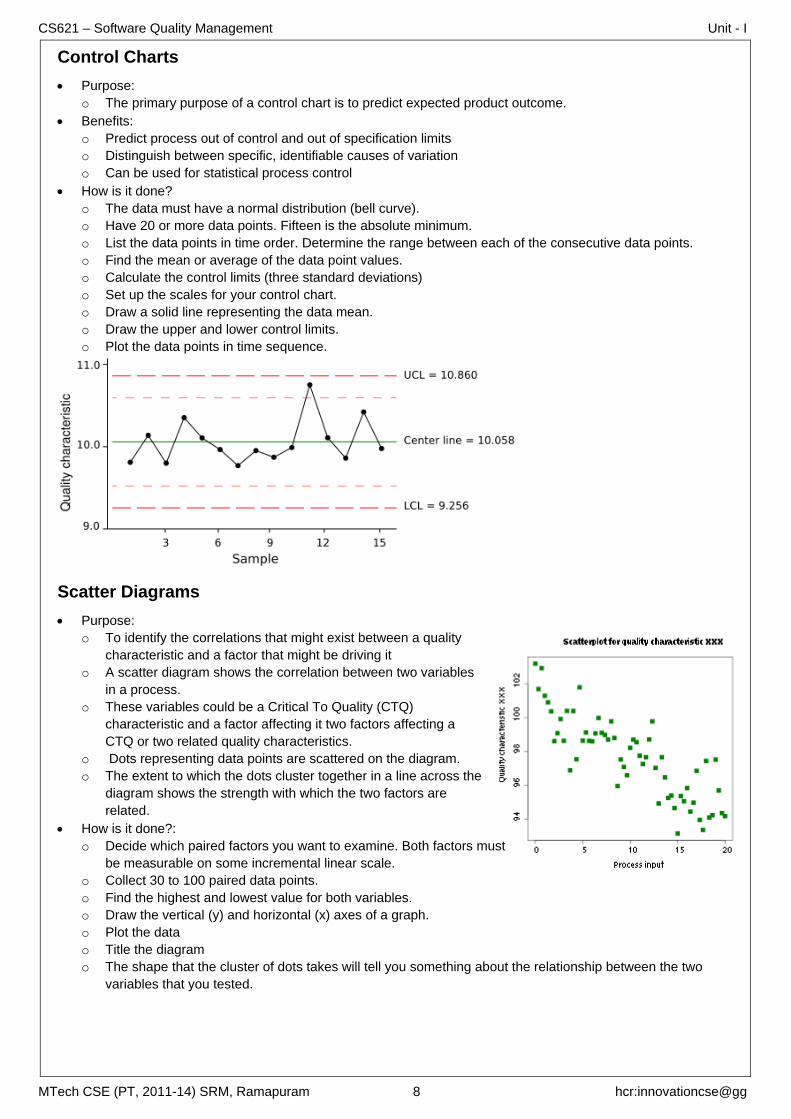
Scatter Diagrams
Purpose:
o To identify the correlations that might exist between a quality
characteristic and a factor that might be driving it
o A scatter diagram shows the correlation between two variables
in a process.
o These variables could be a Critical To Quality (CTQ)
characteristic and a factor affecting it two factors affecting a
CTQ or two related quality characteristics.
o Dots representing data points are scattered on the diagram.
o The extent to which the dots cluster together in a line across the
diagram shows the strength with which the two factors are
related.
How is it done?:
o Decide which paired factors you want to examine. Both factors must
be measurable on some incremental linear scale.
o Collect 30 to 100 paired data points.
o Find the highest and lowest value for both variables.
o Draw the vertical (y) and horizontal (x) axes of a graph.
o Plot the data
o Title the diagram
o The shape that the cluster of dots takes will tell you something about the relationship between the two
variables that you tested.
CS621 – Software Quality Management Unit - I
MTech CSE (PT, 2011-14) SRM, Ramapuram 9 hcr:innovationcse@gg
MODERN TOOLS – A-RTM-APM Affinity Diagrams
Relations Diagrams
Tree Diagrams
Matrix Diagrams
Arrow Diagrams
Process Decision Program Charts
Matrix Data Analysis
History of the New Seven Q.C. Tools
Developed to organize verbal data diagrammatically.
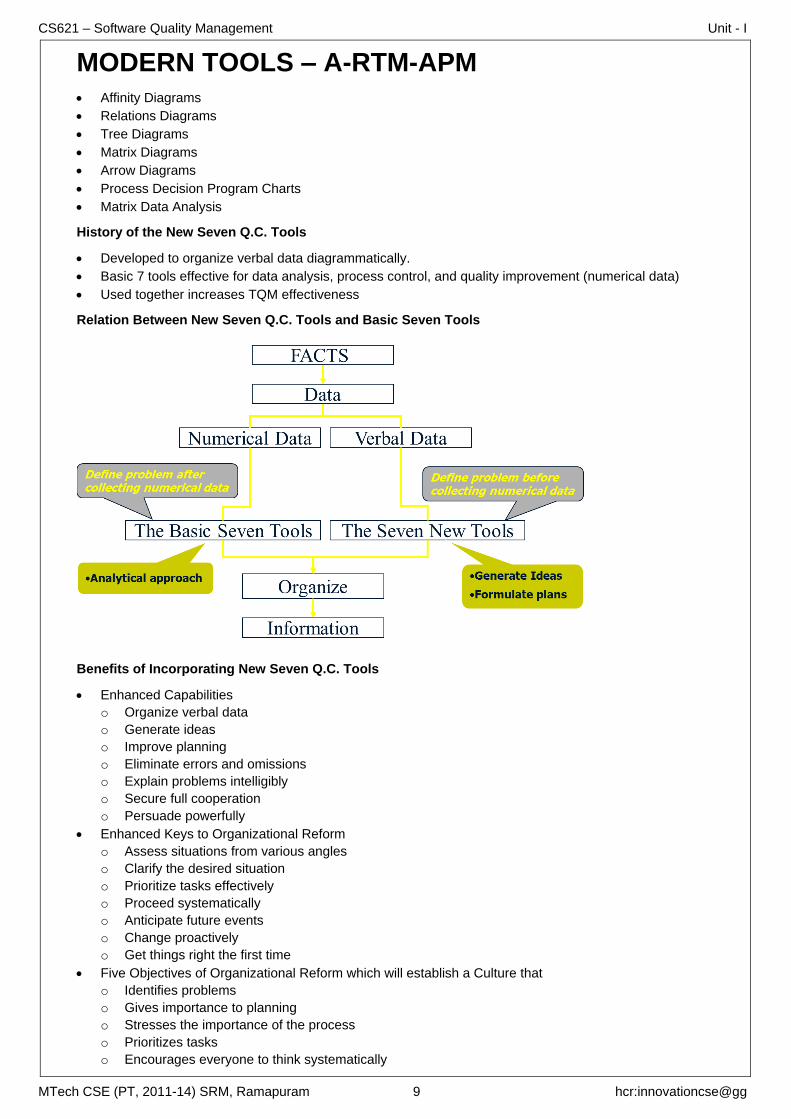
Basic 7 tools effective for data analysis, process control, and quality improvement (numerical data)
Used together increases TQM effectiveness
Relation Between New Seven Q.C. Tools and Basic Seven Tools
Benefits of Incorporating New Seven Q.C. Tools
Enhanced Capabilities
o Organize verbal data
o Generate ideas
o Improve planning
o Eliminate errors and omissions
o Explain problems intelligibly
o Secure full cooperation
o Persuade powerfully
Enhanced Keys to Organizational Reform
o Assess situations from various angles
o Clarify the desired situation
o Prioritize tasks effectively
o Proceed systematically
o Anticipate future events
o Change proactively
o Get things right the first time
Five Objectives of Organizational Reform which will establish a Culture that
o Identifies problems
o Gives importance to planning
o Stresses the importance of the process
o Prioritizes tasks
o Encourages everyone to think systematically

CS621 – Software Quality Management Unit - I
MTech CSE (PT, 2011-14) SRM, Ramapuram 10 hcr:innovationcse@gg
Affinity Diagrams
For Pinpointing the Problem in a Chaotic Situation and Generating Solution Strategies
Gathers large amounts of intertwined verbal data (ideas, opinions, issues)
Organizes the data into groups based on natural relationship
Makes it feasible for further analysis and to find a solution to the problem
Advantages
Facilitates breakthrough thinking and stimulate fresh ideas
Permits the problem to be pinned down accurately
Ensures everyone clearly recognizes the problem
Incorporates opinions of entire group
Fosters team spirit
Raises everyone’s level of awareness
Spurs to the group into action
Method: Group Method Approach
Select a topic
Collect verbal data by brainstorming
Discuss info collected until everyone understands it thoroughly
Write each item on separate data card
Spread out all cards on table
Move data cards into groups of similar themes (natural affinity for each other)
Combine statements on data cards to new Affinity statement
Make new card with Affinity statement
Continue to combine until less than 5 groups
Lay the groups outs, keeping the affinity clusters together
Next, complete the diagram
Relations Diagrams
For Finding Solutions Strategies by Clarifying Relationships with Complex Interrelated Causes
Resolves tangled issues by unraveling the logical connection
Allows for “Multi-directional” thinking rather than linear
Also known as Interrelationship diagrams
Advantages
Useful at planning stage for obtaining perspective on overall situation
Facilitates consensus among team
Assists to develop and change people’s thinking
Enables priorities to be identified accurately
Makes the problem recognizable by clarifying the relationships among causes
Group Method Approach
Express the problem in form of “Why isn’t something happening?”
Each member lists 5 causes affecting problem
Write each item on a card
Discuss info collected until everyone understands it thoroughly
Move cards into similar groups
Asking why, explore the cause-effect relationships, and divide the cards into primary, secondary and tertiary
causes
Connect all cards by these relationships
Further discuss until all possible causes have been identified
Review whole diagram looking for relationships among causes
Connect all related groups
Next, complete the diagram

CS621 – Software Quality Management Unit - I
MTech CSE (PT, 2011-14) SRM, Ramapuram 11 hcr:innovationcse@gg
Tree Diagrams
For Systematically Pursuing the Best Strategies for Attaining an Objective
Develops a succession of strategies for achieving objectives
Reveals methods to achieve the results
Also known as Systematic diagrams or
Dendrograms
Advantages
Systematic and logical approach is less likely
that items are omitted
Facilitates agreement among team
Are extremely convincing with strategies
Method
Write Relations Diagram topic (Objective card)
Identify constraints on how objective can be
achieved
Discuss means of achieving objective (primary means, first level strategy)
Take each primary mean, write ob-jective for achieving it (secondary means)
Continue to expand to the fourth level
Review each system of means in both directions (from objective to means and means to objective)
Add more cards if needed
Connect all levels
Next, complete the diagram
Matrix Diagrams
For Clarifying Problems by “Thinking
Multidimensionally”
Consists of a two-dimensional array to determine
location and nature of problem
Discovers key ideas by relationships represented
by the cells in matrix
Advantages
Enable data on ideas based on extensive experience
Clarifies relationships among different elements
Makes overall structure of problem immediately obvious
Combined from two to four types of diagrams, location of problem is clearer
5 types: L-shaped, T-shaped, Y-shaped, X-shaped, and C-shaped
Method
Write final-level means from Tree diagram forming vertical axis

CS621 – Software Quality Management Unit - I
MTech CSE (PT, 2011-14) SRM, Ramapuram 12 hcr:innovationcse@gg
Write in Evaluation categories (efficacy, practicability, and rank) on horizontal axis
Examine final-level means to identify whom will implement them
Write names along horizontal axis
Label group of columns as “Responsibilities”
Label right-hand end of horizontal axis as “Remarks”
Examine each cell and insert the appropriate symbol
o
o
Determine score for each combination of symbols, record in rank column
Examine cells under Responsibility Columns, insert double-circle for Principal and single-circle for
Subsidiary
Fill out remarks column and record meanings of symbol
Next, complete the diagram
Arrow Diagrams
For Working Out Optimal Schedules and
Controlling Them Effectively
Shows relationships among tasks needed
to implement a plan
Network technique using nodes for events
and arrows for activities
Used in PERT (Program Evaluation and
Review Technique) and CPM (Critical
Path Method)
Advantages
Allows overall task to viewed and potential snags to be identified before work starts
Leads to discovery of possible improvements
Makes it easy to monitor progress of work
Deals promptly with changes to plan
Improves communication among team
Promotes understanding and agreement among group
Method
From strategies on Tree diagram, select one (Objective of Arrow Diagram)
Identify constraints to Objective
List all activities necessary to achieving Objective
Write all essential activities on separate cards
Organize cards in sequential order of activities
Remove any duplicate activities
Review order of activities, find sequence with greatest amount of activities
Arrange parallel activities
Examine path, number nodes in sequence from left to right
Record names and other necessary information
Next, complete the diagram
Process Decision Program Charts
For Producing the Desired Result from Many
Possible Outcomes
Used to plan various contingencies
Used for getting activities back on track
Steers events in required direction if
unanticipated problems occur
Finds feasible counter measures to overcome
problems

CS621 – Software Quality Management Unit - I
MTech CSE (PT, 2011-14) SRM, Ramapuram 13 hcr:innovationcse@gg
Advantages
Facilitates forecasting
Uses past to anticipate contingencies
Enables problems to pinpointed
Illustrates how events will be directed to successful conclusion
Enables those involved to understand decision-makers intentions
Fosters cooperation and communication in group
Easily modified and easily understood
Method
Select a highly effective, but difficult strategy from the Tree diagram
Decide on a goal (most desirable outcome)
Identify existing situation (Starting point)
Identify constraints of objective
List activities to reach goal and potential problems with each activity
Review list. Add extra activities or problems not thought of previously
Prepare contingency plan for each step and review what action is needed if step is not achieved
Examine carefully to check for inconsistencies and all important factors are included
Examine to make sure all contingency plans are adequate
Next, complete the diagram
Matrix Data Analysis
Principal Component Analysis
Technique quantifies and arranges data presented in Matrix
Based solely on numerical data
Finds indicators that differentiate and attempt to clarify large amount of information
Advantages
Can be used in various fields (market surveys, new product planning, process analysis)
Can be when used when Matrix diagram does not give sufficient information
Useful as Prioritization Grid
Method
Determine your goal, your alternatives, and criteria for decision
Place selection in order of importance
Apply percentage weight to each option (all weights should add up to 1)
Sum individual ratings to establish overall ranking (Divide by number of options for average ranking)
Rank order each option with respect to criterion (Average the rankings and apply a completed ranking)
Multiply weight by associated rank in Matrix (in example, 4 is best, 1 is worst)
Result is Importance Score
Add up Importance Scores for each option
Rank order the alternatives according to importance
See completed the diagram
CS621 – Software Quality Management Unit - I
MTech CSE (PT, 2011-14) SRM, Ramapuram 14 hcr:innovationcse@gg
BUSINESS PROCESS RE-ENGINEERING Reengineering is the fundamental rethinking and redesign of business processes to achieve dramatic
improvements in critical, contemporary measures of performance, such as cost, quality, service and speed
Process
A specific ordering of work activities across time and space, with a beginning, an end, and clearly identified
inputs and outputs: a structure for action
Business Process
A group of logically related tasks that use the firm's resources to provide customer-oriented results in
support of the organization's objectives.
A designed succession of actions to the accomplish of some result in a business.
Why Reengineer?
Customers – Demanding, Sophistication, Changing Needs
Competition – Local, Global
Change – Technology,
Customer Preferences
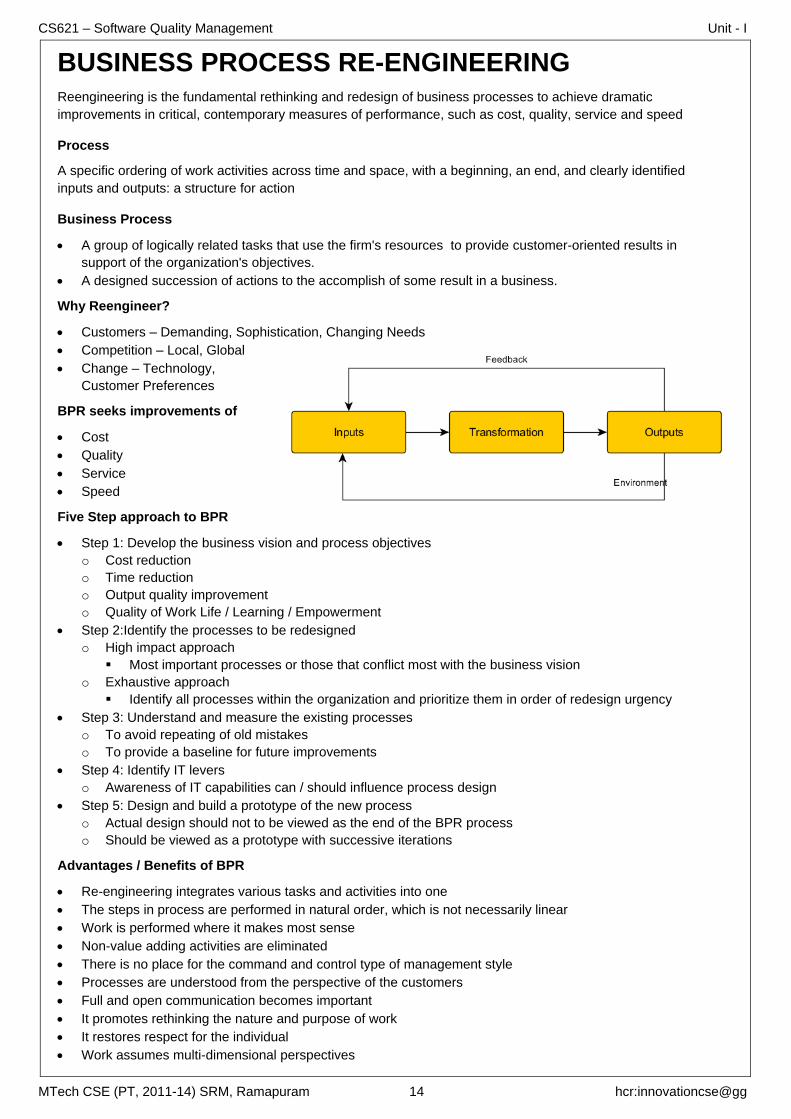
BPR seeks improvements of
Cost
Quality
Service
Speed
Five Step approach to BPR
Step 1: Develop the business vision and process objectives
o Cost reduction
o Time reduction
o Output quality improvement
o Quality of Work Life / Learning / Empowerment
Step 2:Identify the processes to be redesigned
o High impact approach
Most important processes or those that conflict most with the business vision
o Exhaustive approach
Identify all processes within the organization and prioritize them in order of redesign urgency
Step 3: Understand and measure the existing processes
o To avoid repeating of old mistakes
o To provide a baseline for future improvements
Step 4: Identify IT levers
o Awareness of IT capabilities can / should influence process design
Step 5: Design and build a prototype of the new process
o Actual design should not to be viewed as the end of the BPR process
o Should be viewed as a prototype with successive iterations
Advantages / Benefits of BPR
Re-engineering integrates various tasks and activities into one
The steps in process are performed in natural order, which is not necessarily linear
Work is performed where it makes most sense
Non-value adding activities are eliminated
There is no place for the command and control type of management style
Processes are understood from the perspective of the customers
Full and open communication becomes important
It promotes rethinking the nature and purpose of work
It restores respect for the individual
Work assumes multi-dimensional perspectives
CS621 – Software Quality Management Unit - I
MTech CSE (PT, 2011-14) SRM, Ramapuram 15 hcr:innovationcse@gg
Corporate and individual values change from being protective to productive
Smart work rather than hard work becomes the norm
Organizational structure becomes flat and functional silos and functional stovepipes disappear
Technology as an enabler becomes an important agent of business transformation and success
The organizations attention is focused on where to compete rather than how to compete
It promotes provocative culture – questioning, everything an organization does and seeking innovative ways
of doing work
It aligns core processes to business strategy
It promotes an organization’s capability to adapt
Process Simplification BPR
Incremental Change
Process-Led
Assume Attitudes & Behaviours
Management-Led
Various Simultaneous Projects
Radical Transformation
Vision-Led
Change Attitudes & Behaviours
Director-Led
Limited Number of Initiatives
Continuous Improvement BPR
Incremental Change
People Focus
Low Investment
Improve Existing
Work Unit Driven
Radical Transformation
People & Technology Focus
High Investment
Rebuild
Champion Driven
Common Problems with BPR / Why Re-engineering fails
Process under review too big or too small
Reliance on existing process too strong
The Costs of the Change Seem Too Large
BPR Isolated Activity not Aligned to the Business Objectives
Allocation of Resources
Poor Timing and Planning
Keeping the Team and Organization on Target
ZERO DEFECT Refer to 5
th Unit for more details
Practice of developing software that is maintained in the highest quality state throughout the entire
development process
Maintain your product in what you believe to be a defect-free state throughout the development process
By focusing on product quality throughout the development lifecycle, you will actually complete products
faster than if you didn't pay attention to quality until the end of the project

CS621 – Software Quality Management Unit - I
MTech CSE (PT, 2011-14) SRM, Ramapuram 16 hcr:innovationcse@gg
SIX SIGMA Sigma is a measure of “goodness: the capability of a process to produce perfect work.
Six Sigma’s goal is the near elimination of defects from any process, product, or service.
A “defect” is any mistake that results in customer dissatisfaction.
Sigma indicates how often defects are likely to occur.
The higher the sigma level, the lower the defect rate.
The lower the defect rate, the higher the quality.
Why Sigma as a Quality Measure
Sigma allows comparison of products and services of varying complexity on an apples to apples basis.
Also, it provides a common basis for benchmarking (competitors and non-competitors).
The higher the sigma level, the better your operation is performing.
Sigma measures how well you’re doing in getting to zero defects.
Six Step to Six Sigma
Step1: Identify the product you create or the service you provide.
Step2: Identify the Customer(s) for your product or service and determine what they consider important.
Step3: Identify your needs (to provide product/service so that it satisfies the Customer).
Step4: Define the process for doing the work.
Step5: Mistake-proof the process and eliminate wasted effort.
Step6: Ensure continuous improvement by measuring, analyzing, and controlling the improved process.
Six Sigma Process Capability
SIGMA DPMO COPQ CAPABILITY
6 sigma 3.4 < 10% of sales World Class
5 230 10 – 15%
4 6200 15 – 20% Industry average
3 67000 20 – 30%
2 310000 30 – 40% Noncompetitive
1 700000
Normal distribution Curve
CS621 – Software Quality Management Unit - I
MTech CSE (PT, 2011-14) SRM, Ramapuram 17 hcr:innovationcse@gg
Example: Six Sigma Project: Engineering Changes
Define
o Large number of changes from client after approving engineering design. Schedule slipping.
Measure
o Number of changes, time involved in changes, compliance to critical path schedule.
Analyze
o No clear authority on client team to establish scope, any of client team could make changes, verbal
communication of changes, conflicting changes by client team members. Language issues between
client and engineers.
Improve
o Regular engineering/client meetings where topics include: scope for each section and desired
objective, known limitations defined, unclear requirements were questioned and options discussed.
Written plan signed by client representative and engineering lead. Change requests in writing and
signed by client representative. Changes decrease by factor of 4.7 and schedule met.
Control
o Change requests all in writing. Shared approach with other disciplines on project.
What are the Challenges of Six Sigma?
The perception of “Sick Sigma”
Culture change
Understanding the DFSS (Design For Six Sigma)
It is not a quick fix nor a recipe.
Consultants can’t make it happen
Implementation tends to be uneven and lapses occur frequently.
Not everything has to be Six Sigma; this was our downfall on reengineering efforts!
Lack of discipline and accountability
Training – especially management level
Takes careful preparation and a commitment to the foundational change efforts required.
Statistical analysis is not generally part of the engineering discipline in most IT shops
Reliability of data from the field.
People must not fear giving “bad news”.
Design is critical and yet many IT organizations continue to go straight from poor requirements into coding
without the benefits of even one design review
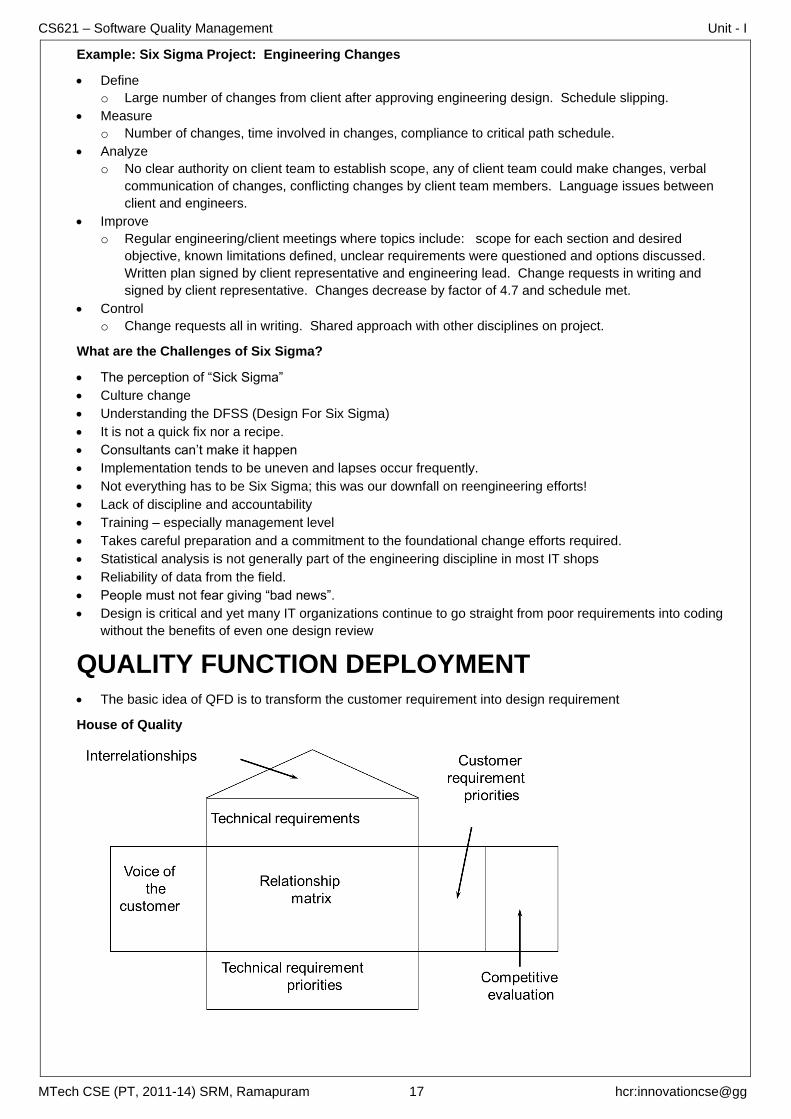
QUALITY FUNCTION DEPLOYMENT The basic idea of QFD is to transform the customer requirement into design requirement
House of Quality

CS621 – Software Quality Management Unit - I
MTech CSE (PT, 2011-14) SRM, Ramapuram 18 hcr:innovationcse@gg
How to Build a house of quality
Gather customer attributes (in the words of the customer)
Group attributes logically
Assess relative importance of the attributes
Assess competitive performance on the attributes
Describe product in terms of engineering characteristics
Detail influence of engineering characteristics on customer attributes
Detail interaction between engineering characteristics
How to Use a house of quality
Prioritize on attributes that we do poorly on, or where we might increase our lead
Determine what engineering characteristics strongly influence the desired attribute
Check for adverse interactions and weigh tradeoffs
Set target levels (not ranges)
Link to lower level houses
o Parts characteristics
o Key process operations
o Production requirements
Quality Function Deployment
Six steps for building a house of quality
Step 1. The primary customer requirements are normally expanded into secondary and tertiary
requirements using AND/OR tree.
Step 2. The design requirements must be related to the customer requirements and should be selectively
deployed throughout the manufacturing, assembly, and service process to manifest themselves in the final
product performance and customer acceptance.
Step 3. Developing a matrix describing the customer requirements and the design requirements is
accomplished
Step 4. Market evaluation which covers the customer-expressed importance ratings, requirements, and
competitive products is performed.
Step 5. The target for each of the design requirement is defined.
Step 6. Selection of the best solution should be deployed
Benefits of QFD
Product objectives based on customer requirements are not misinterpreted at the subsequent stages
Particular marketing strategies or sales points do not become lost or blurred during the translation process
from marketing through planning to execution
Important production control points are not overlooked - everything necessary to achieve the desired
outcome is understood
Efficiency is improved as the misinterpretation of design objectives, marketing perception, and critical
control points, and the need for changes is minimized

CS621 – Software Quality Management Unit - I
MTech CSE (PT, 2011-14) SRM, Ramapuram 19 hcr:innovationcse@gg
Problem with QFD
Matrix is too large
o Prioritize on important attributes
o Analyzes independent subsystems independently
Customer priorities not clear
o Consider segmenting market
Customers’ stated preferences and actions differ
o Use revealed preference techniques if you suspect a problem
QFD is messy
o Not QFD, but rather the interaction between diverse groups is cause
o Stick with it, the results are worthwhile
BENCHMARKING The practice of establishing internal standards of performance by looking to how world-class companies run
their businesses
Benchmarking is about identifying and measuring best practice processes that work elsewhere and then
emulating them.
The aim is to reduce duplication by learning from others who have already found the solution.
It is about:
o Understanding your weaknesses
o Comparison with your peers
What other type of benchmarking activities are useful?
Monitoring Content Quality and ‘Freshness’
New developments and technologies - scripts, other markup languages, personalisation
Stress and security
Search engine used on site and 404 pages
Server numbers
Visibility on search engines
Usability e.g. by evaluating user feedback
Performance checkers and Independent testing services
Malcolm Baldrige Award
The Malcolm Baldrige National Quality Award originated in 1987 to recognize companies that have
achieved a level of world-class competition through quality management.
Given by the President of the United States to U.S. businesses.
Three awards each year in different categories:
o Manufacturing, Service, Small business, Education and health care
CS621 – Software Quality Management Unit - I
MTech CSE (PT, 2011-14) SRM, Ramapuram 20 hcr:innovationcse@gg
STATISTICAL PROCESS CONTROL The application of statistical techniques to the control and improvement of processes.
Tool to supplement, not replace the existing knowledge your people have of your process
Basic of SPC
Statistical Process Control (SPC)
o monitoring production process to detect and prevent poor quality
Sample
o subset of items produced to use for inspection
Control Charts
o process is within statistical control limits
Benefits of SPC
increased profits
increased productivity
increased employee involvement in the process
increased morale
Who is Responsible for SPC
Everyone in the plant – Management, Production, Engineering and design, sales
Managing Variation over time
Statistical Process Control often takes the form of a continuous Hypothesis testing.
The idea is to detect, as quickly as possible, a significant departure from the norm.
A significant change is often attributed to what is known as an assignable cause.
An assignable cause is something that can be discovered and corrected at the machine level.
Variability
Random
o common causes
o inherent in a process
o can be eliminated only through improvements in the system
Non-Random
o special causes
o due to identifiable factors
o can be modified through operator or management action
What are the sources of variation in a process?
Machine variation
Raw Material variation
Different methods used
Measurement variation
Operator variation
Environmental factors
Assignable Cause
An "Assignable Cause" relates to relatively strong changes, outside the random pattern of the process.
It is "Assignable", i.e. it can be discovered and corrected at the machine level.
Although the detection of an assignable cause can be automated, its identification and correction often
requires intimate understanding of the manufacturing process.
For example
o Symptom: significant yield drop.
o Assignable Cause: leaky etcher load lock door seal.
o Symptom: increased e-test rejections
o Assignable Cause: probe card worn out.

CS621 – Software Quality Management Unit - I
MTech CSE (PT, 2011-14) SRM, Ramapuram 21 hcr:innovationcse@gg
10 Steps of Implementing SPC
Analyze the process
Decrease obvious variability
Gauge capability study
Sampling plan
Implement CONTROL CHARTS
Put the operator in charge
Process capability study
Improve the process
Reduce sampling
Return to step 1
Control Chart
A graph that establishes control limits of a process
Control limits - upper and lower bands of a control chart
Quality Measure
Attribute
o a product characteristic that can be evaluated with a discrete response : good – bad; yes - no
Variable
o a product characteristic that is continuous and can be measured
o weight – length
Types of charts
Attributes
o p-chart
o c-chart
Variables
o range (R-chart)
o mean (x bar – chart)
Process Control Chart
Credits
Thanks to the SRM MTech staff, who have provided us the PPTs, which were very helpful in creating this
Comments & Feedback
Thanks to my family members who supported me while I spent hours and hours to prepare this.
Your feedback is welcome at [email protected]