unit 5 research project final referral
TRANSCRIPT

Unit 5 Research Project
Worthing College Sports ScienceSam Murray
2015

Assessment Criteria Pages 3-17 & 27-38
• P2: carry out sport science or exercise science-based research
• P3: collect and record data from the research project conducted
• M2: correctly analyse collected data, describing techniques used
• D1: correctly analyse data, explaining techniques used
• P4: produce a full research report using a standard scientific structure

DOES SPEED AFFECT CROSSING IN FOOTBALL?
P2: Carry out / P4: Produce

AbstractThe aim of my project was to investigate whether speed affects the amount of crosses a winger at the participation level of football can put into the opposition box. I based my research around 8 young male athletes between the ages of 16-18. I collected my data through notational analysis to gather information on the amount of crosses the wingers put into the box. I measured their speed using the 35m sprint test with flying start. The results of my data were shown on a Spearman correlation on Microsoft Excel. This showed that there was a strong correlation between the speed of players and the amount of crosses they put into the box in a match. My hypothesis was proved right as my results showed that in general, the players with the higher sprint speeds managed more crosses per match. My research could impact the recruitment of football managers at a low level in the game who may look for faster wingers who will put more crosses into the box.
P2: Carry out / P4: Produce

Contents: General
Page 1- Unit titlePage 2- Assessment criteria pages 3-17 & 27-32Page 3- Research Project aim titlePage 4- AbstractPage 5- ContentsPage 6- Contents: AppendicesPage 7- Contents: Figures and TablesPage 8- AcknowledgementsPage 9- IntroductionPage 10- Literature Review and ReferencesPage 11- Project HypothesisPage 12- MethodPage 13- Data Collection
P2: Carry out / P4: Produce
Page 14- Data AnalysisPage 15- ResultsPage 16- DiscussionPage 17- ConclusionPage 18- Assessment criteria pages 19-26Page 19- Review 1/3Page 20- Review 2/3Page 21- Review 3/3Page 22- Future Recommendations 1/5Page 23- Future Recommendations 2/5Page 24- Future Recommendations 3/5Page 25- Future Recommendations 4/5Page 26- Future Recommendations 5/5

Contents: Appendices
Page 27- Title pagePage 28- Appendices 1Page 29- Appendices 2
P2: Carry out / P4: Produce

Contents: Figures and Tables
Page 30- Title pagePage 31- Figures and Tables 1Page 32- Figures and Tables 2
P2: Carry out / P4: Produce

Acknowledgements
• I would like to thank my participants who took part in the research because without them the study wouldn’t have been possible.
• Also I thank my teacher Paul Cox for helping to guide me through conducting a successful research project.
P2: Carry out / P4: Produce

Introduction
The aim of my project is ‘to investigate whether speed affects the amount of crosses a winger at the participation level of football can put into the opposition box’. I chose this because I was interested to see if there was anything other than skill that can affect the amount of crosses put into the box by a winger in a football match. I enjoy football related topics so I knew that I would be able to work my hardest throughout the project as I would revel in it. My project timescale was 8 weeks which allowed me to work with each of my participants.
P2: Carry out / P4: Produce

Literature Review and References
https://worthingsportscience.wordpress.com/2015/02/27/unit-5-sam-murray-literacy-review
/
P2: Carry out / P4: Produce

Project Hypothesis
By the end of this project I expect to find that the speed of players has an effect on the amount of crosses they put into the box.
P2: Carry out / P4: Produce

Method
Firstly, I will create a table where I can enter my data so it is all in the same place to be able to use for the research project. I will have 5 columns labelled; athlete number/ name, speed time, speed rank, crosses, crossing rank. Before my athletes take part in any physical activity I will ask them to fill in a PAR-Q to make sure they are suitable for my study (see Appendix 2 for two of my participants PAR-Q’s). I will then attend matches for each one of my athletes and will us notational analysis to observe their performance and use a tally chart to mark down how many crosses they put into the box in the match and enter results into table. I will then meet up with each one of my athletes to get them to undertake the 35m sprint test with flying start where they will each have 3 attempts then an average will be calculated and results put into the table. After filling out my table and placing the athletes in rank order, I will enter my data into an Excel document to find out whether there is a correlation using a Spearman graph. I will then put my data into a scatter graph which will show the strength of association between speed and crosses. I will then write a conclusion to my study to show whether or not there is a correlation between speed of players and the amount of crosses they put into the box.
P3: Collect and record / M2: Correctly analyse & describe techniques / D1: Correctly analyse & explain techniques

Data CollectionThe data I am collecting is quantitative data as it involves numerical data- the amount of crosses put into the box and the time my participants can run the 35m flying sprint test. The type of data technique I am using is primary as it is information that I am collecting myself, with help from others. It is not secondary as I am not using any data that anybody else has found previously. My data is being collected through notational analysis. I attend matches where my participants are playing in a wide position. Throughout the match I observe my participants performance when they get on the ball in a wide position and then put crosses into the opposition penalty area. This part of my project is called observational as I am simply observing my participants without intervening. I use a tally chart to measure the amount of crosses and the success rate of crosses by each of my participants. After collecting all of the data through a tally chart I then measure my player’s speeds by finding an average of them each doing three 35m flying sprint tests. Then place in order the participants ranking of speed and look to see if there is a correlation between speed and amount of crosses/ successful crosses. The research design of my project is experimental as I am looking at how speed affects the amount of crosses.
P3: Collect and record / M2: Correctly analyse & describe techniques / D1: Correctly analyse & explain techniques

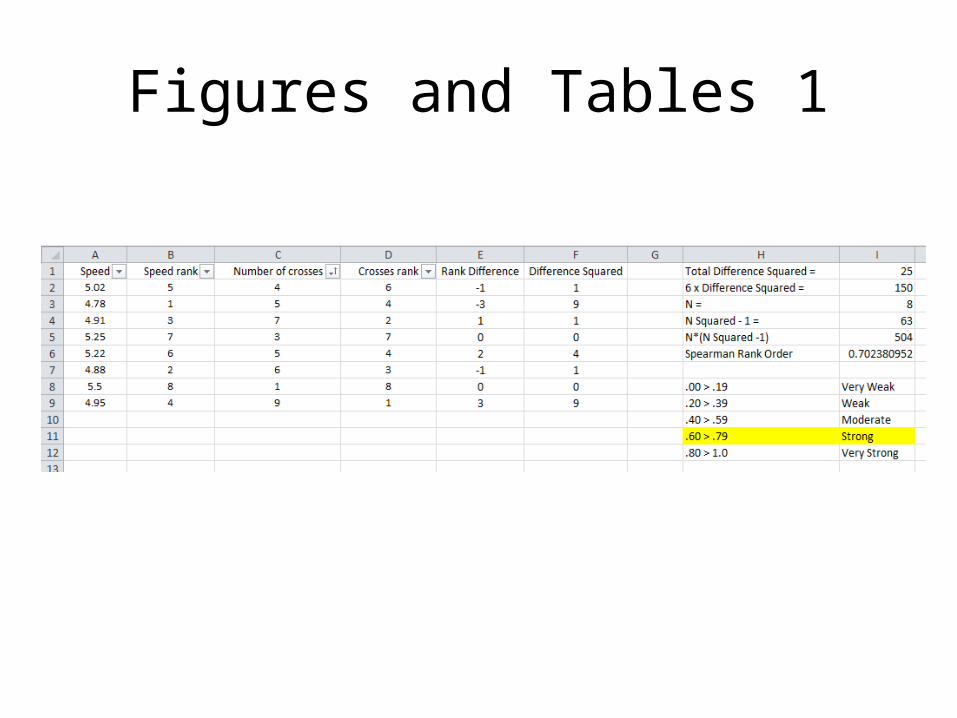
Data AnalysisMy data will be organised in rank order from the least fastest to the fastest person, looking at the successful amount of crosses they have put into the box to see if there is a correlation. The way my data is displayed is in a graph as this way it will show any trends between speed and amount of crosses (see figures and tables 2). I put my data into a Spearman rank order on Microsoft Excel (see figures and tables 1) to see if there was a strong, negative or no correlation between the sprint speed of my participants and the amount of crosses they put into the oppositions box. I used the Spearman rank as it is useful when using ordinal data, like mine, to determine if there is a relationship between two variables. When using the Spearman rank, I had to first place the speed of my players, which I recorded using the 35m sprint test, into a rank order from the fastest to the slowest. I then had to do the same for the number of crosses which I recorded in the matches I observed. After doing both of these I had to enter a couple of formulas which then gave me a number which I compared to a key table showing me that the results from my research. By using this rank order, my results were more reliable than just working them out myself, trying to see if there was a correlation. As my data was quantitative I feel that putting the results into a Spearman rank order on excel was a lot easier and probably saved me some time as well rather than using another type of rank order or working it out myself. My teacher Paul was very helpful as I only had a basic understanding in how to use excel, but after one lesson I was able to create my own Spearman rank order to place my results in. I used the data from my rank order to create a scatter graph to help show the relationship between the speed of my participants and the amount of crosses they put into the box. I chose this because it clearly shows the trend between the two variables, which helps sum up my whole research project. My results that I gathered from my participants can be seen in appendix 1.
P3: Collect and record / M2: Correctly analyse & describe techniques / D1: Correctly analyse & explain techniques

Results
After analysing my data and information through the Spearman rank order. I was able to determine that there is a strong correlation between the sprint speed of young participation level wingers and the amount of crosses they put into the opposition box. My results do show that in general the faster the sprint speed of these athletes, the more crosses they managed to put into the box. However, this wasn’t always the case as some slower paced players managed a high number of crosses.
P3: Collect and record / M2: Correctly analyse & describe techniques / D1: Correctly analyse & explain techniques

Discussion
After collecting my data and then analysing it I found that the faster the wingers sprint speed, the more amount of crosses they put into the box. This wasn’t always the case however my results showed a strong correlation to prove that in general. Before I started my research I was expecting these results as I believe that faster players are more likely to beat their opposition and get down the line to put crosses into the box. However there are a number of factors which can affect how many crosses a winger will put into the box in a match. One of these factors is down to the coach of the teams playing style. They may coach their players to play short passes, keep the ball on the ground and play most their football in the middle of the pitch. Therefore a player who did not put many crosses into the box in my research may argue that its not in their teams ‘philosophy’ to use wide players and put balls into the box to feed the striker. Also the skill level of my athletes may vary. If a players skill level is high, they are more likely to be able to get the ball and put crosses into the box after taking on players. My argument to this is that the players in my research are all at the participation level so they should have a similar skill level to one another.
P2: Carry out / P4: Produce

Conclusion
My aim of my research project was ‘to investigate whether speed affects the amount of crosses a winger at the participation level of football can put into the opposition box’. The results I gathered do support my hypothesis as I found that the players with the faster sprint speed managed more crosses into the box in a match. From my scatter graph (see figures and tables 2) I can see there was a trend that faster paced players achieved more crosses into the box. However, my discussion does not support my hypothesis because of a number of factors that could have affected my results such as team playing style and player ability. I can though sum up my research by saying that young male wingers at the participation level of football who have a faster sprint speed, manage more crosses put into the opposition penalty area in a match.
P2: Carry out / P4: Produce

Assessment Criteria Pages 19-26
• P5: carry out a review of the research project conducted, describing strengths, areas for improvement and future recommendations.
• M3: carry out a review of the research project, explaining strengths, areas for improvement and future recommendations.
• D2: carry out a review of the research project, justifying future recommendations for further research.

Review (1/3)
I was pleased with how I was able to collect the data I needed. My participants were easy to work with and allowed me to test their sprint speed and observe them play. I collected my data using a table I created which allowed me to easily view all of the information (see appendices 1) My teacher, Paul, was very helpful throughout the project, especially when showing me how to put my data into a Spearman Rank so show if there was a correlation.
P5: Describe / M3: Explain / D2: Justify

Review (2/3)
As I am a big football fan I have a reasonably good knowledge in the game so my project aim was to my strengths. As I enjoy watching football, I found the observing part of my research amusing. I think that if I didn’t have such an interest in the sport, maybe my research wouldn’t have been such a success as I could have lost concentration easily. It was also to my strengths that my participants were very good at understanding what was needed to be done and they got on with it.
P5: Describe / M3: Explain / D2: Justify

Review (3/3)
I feel that the amount of participants I used for my research project wasn’t entirely representative of the population. I had 8 participants who were all males between the ages of 16-18, this makes my research very limited. If I was to carry out the project again I would make sure I have a larger range of participants and that there is an even ratio of male to female athletes to sure that my research is more representative of the population. I would also research athletes of a higher level e.g. performance.
P5: Describe / M3: Explain / D2: Justify

Future Recommendations (1/5)If I was to carry out the same project again, I would most certainly include a larger amount of participants as it would be more representative of the population. I am making this recommendation as my research would then become more reliable as it only included participants. I have also only included male participants so next time I would have some females in the study to balance it out and also people from above the age groups of 16-18 as these were the ages of my participants in this project. By having a larger group of people taking part in my research, my results would be backed up much more as some people may argue I didn’t base my study around the whole population. Also it would interest me to see if people from different age groups or gender would have similar results to my participants from this study. By making these recommendations, which makes my research more reliable, it can benefit coaches. This is because coaches may be looking for certain types of players such as wingers that get down the line and put crosses into the opposition area, therefore by looking at my research they can see that faster paced players are more likely to do this so they can look to recruit players with faster sprint speeds.
P4: Produce / P5: Describe / M3: Explain / D2: Justify

Future Recommendations (2/5)Next time I would also look into the number of successful/ unsuccessful crosses put into the box by the wingers as this would open up different avenues to explore. I would base this on a tally chart and tally the number of crosses that were converted into goals, number of crosses met by teammate, number of crosses cleared by opposition, number of crosses outside the penalty area and the number of blocked crosses. I am making this recommendation because it would then bring another element into the research as I could look to see if faster wing players had a better percentage of successful crosses which would help look to see how many of the crosses the faster wing players put into the box are successful. This would help benefit my research as it is backed up and isn’t restricted to just the amount of crosses into the box. My results showed that in general faster players put more crosses into the box, however it could have been the case that the success rate of their crosses was lower.
P4: Produce / P5: Describe / M3: Explain / D2: Justify

Future Recommendations (3/5)If I was to do my research project again I would also look to conduct it on players of a higher level- performance level for example. This is because the higher level athletes will have a higher skill level compared to the athletes that I studied in my research, who were all at the participation level of football. The higher level athletes may bring different results, however this could be down to their teams style of play and their skill level. I am making this recommendation as it is less likely coaches who manage participation level teams look to recruit players with certain attributes, they will just recruit anybody from that position most of the time. However, if my research was conducted on a higher level, then coaches could find this to their benefit. Their style of play may include many crosses into the striker so they will look at the results of my study an recruit faster players as they may have the higher cross rate.
P4: Produce / P5: Describe / M3: Explain / D2: Justify

Future Recommendations (4/5)I would observe my athletes play in more matches if I was to carry this out again. I only observed my participants play in one match which could be seen as unfair as one player could have been playing a much more difficult game than another player, so they were more able to beat players down the line and put a cross into the box. An athlete could have had a poor game, carrying a knock or been substituted which would put them at a disadvantage. So next time I would certainly watch them play in more matches as this would be a fairer way to judge their performance. If this recommendation was carried out, my results would be more valid and reliable, therefore helping benefit the people who wish to use my research. By having my participants play in a larger amount of matches, more people are likely to use my research, such as coaches, as it is done on a larger scale making the results much more realistic.
P4: Produce / P5: Describe / M3: Explain / D2: Justify

Future Recommendations (5/5)I would count other statistics of my athletes performance which could have had an impact on their results. I would look at how many touches the player had in the game because if they only had a little amount of touches then they wouldn’t be able to put in many crosses. I would count the number of crosses the team in total managed to put into the box in open play as this would give me a general idea of their teams playing style. The coach of the team may want his players to keep the ball on the floor and play their football in the middle of the pitch rather than getting the ball to the wide men who would put crosses into the box. By making these recommendations these factors would certainly back up my results more as I would be looking into much more detail to why I got the results I would got. This would be a benefit to any coaches who use my research looking for wingers as they can see what attributes are useful for players in this position. It would also benefit the players as they can look at areas they need to improve to help improve their overall game.
P4: Produce / P5: Describe / M3: Explain / D2: Justify

Research Project Appendices
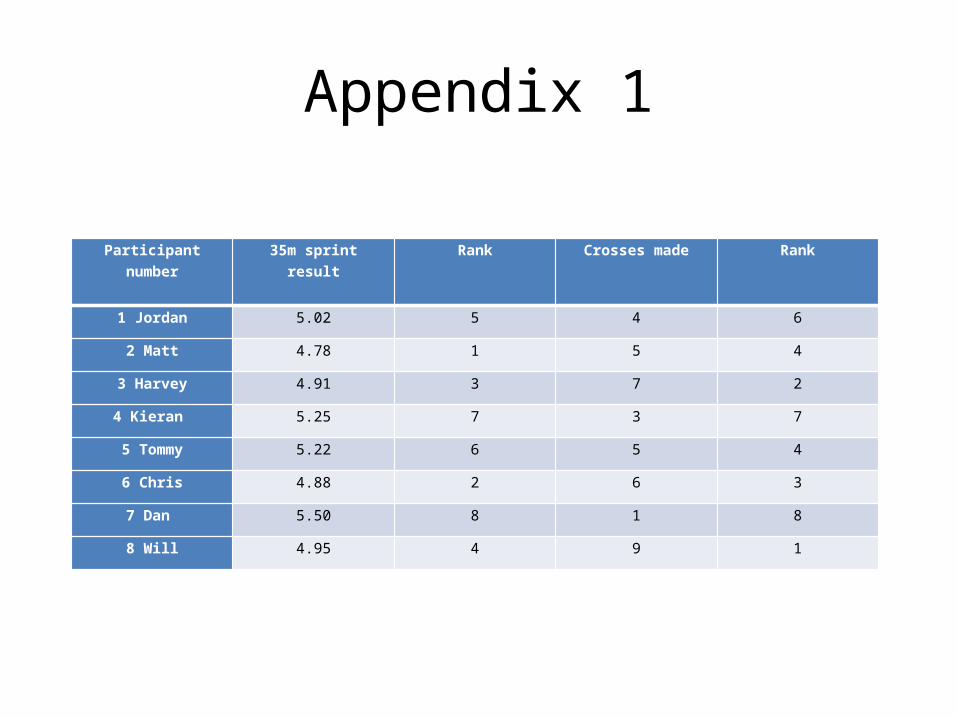
Appendix 1
Participant number 35m sprint result Rank Crosses made Rank
1 Jordan 5.02 5 4 6
2 Matt 4.78 1 5 4
3 Harvey 4.91 3 7 2
4 Kieran 5.25 7 3 7
5 Tommy 5.22 6 5 4
6 Chris 4.88 2 6 3
7 Dan 5.50 8 1 8
8 Will 4.95 4 9 1

Appendix 2 Matt Rigglesworth’s PAR-Q Harvey Robinson’s PAR-Q

Research Project Figures and Tables
Figures and Tables 1

Figures and Tables 2
4.7 4.8 4.9 5 5.1 5.2 5.3 5.4 5.5 5.60
1
2
3
4
5
6
7
8
9
10
A graph to show the trend between players sprint speed and the number of crosses they put into the box