unit 5: individual and market demand...
TRANSCRIPT

UNIT 5: INDIVIDUAL AND MARKET
DEMAND FUNCTIONS
J. Alberto Molina – J. I. Giménez Nadal

UNIT 5: INDIVIDUAL AND MARKET DEMAND FUNCTIONS
5.1 Income effect and substitution effect (Pindyck → 4.2 & Appendix 4)
5.2 The consumer surplus (Pindyck → 4.4)
5.3 From the individual demand function to the market demand function (Pindyck → 4.3)
Unit 5 – Pg. 1

UNIT 5: INDIVIDUAL AND MARKET DEMAND FUNCTIONS• Aims of the lesson:
To analyze the effect of variations in the price of a good on the quantity demanded of the same or different good (decomposing this total variation in both substitution and income effects).
To be able to classify the complement and substitute goods in both gross and net terms.
To measure the consumer welfare effect of a change in a price by the “consumer surplus”.
To obtain, by aggegation, the market demand curve from the individual demand curves.
Unit 5 – Pg. 2

5.1 Income and substitution effects
• The change in the quantity demanded when the price changes (caeteris paribus) is the TOTAL EFFECT:
Initial situation: E0 = (q01, q02)↓ p1 E1 = (q11, q12)
q10
q20
Y/p10
E0
Q1
Q2
E1q21
q11 Y/p1
1
Y/p20
↓ p1
Unit 5 – Pg 3

5.1 Income and substitution effects
• We can consider:
Total Direct effect (T11): change in the quantity of q1 when p1 changes
Total Crossed effect (T21): change in the quantity of q2 when p1 changes
q10
q20
Y/p10
E0
Q1
Q2
E1q21
q11 Y/p1
1
T11
T21
Y/p20
1 011 1 1
11
1 021 2 2
21
Total direct effect
0
Total crossed effect
T 0
T q q
T
T q q
↓ p1
Unit 5 – Pg. 4
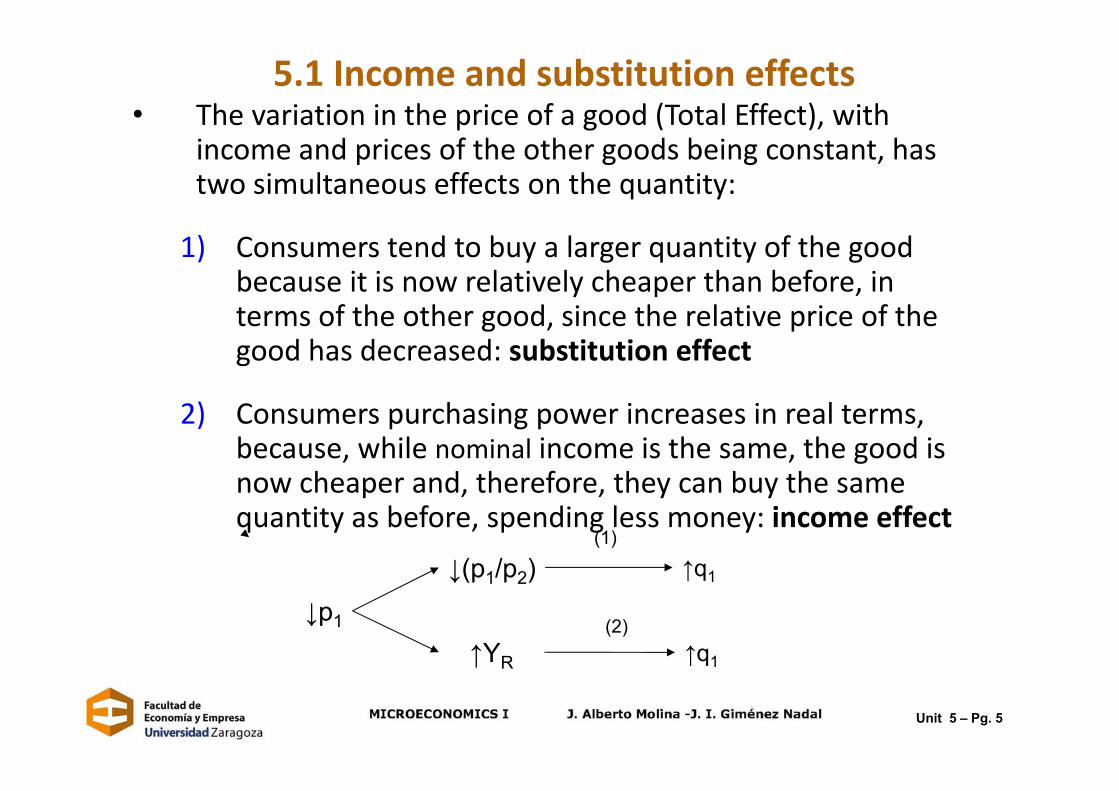
5.1 Income and substitution effects• The variation in the price of a good (Total Effect), with
income and prices of the other goods being constant, has two simultaneous effects on the quantity:
1) Consumers tend to buy a larger quantity of the good because it is now relatively cheaper than before, in terms of the other good, since the relative price of the good has decreased: substitution effect
2) Consumers purchasing power increases in real terms, because, while nominal income is the same, the good is now cheaper and, therefore, they can buy the same quantity as before, spending less money: income effect
↓p1
↓(p1/p2) ↑q1
↑YR ↑q1
(1)
(2)
Unit 5 – Pg. 5

5.1 Income and substitution effectsThe total effect can be, theoretically, assumed as the sum of two
different effects:
• Substitution Effect : Change in consumption of the good dueto the change in a price, with the income and other pricesbeing constant:
Sij= Substitution effect of good Qi when pj changes
• Income Effect : Change in consumption of the good when thereal income and the relative prices are constant:
Rij= Income effect of good Qi when pj changes
Tij = Sij + RijT11 = S11 + R11 Total direct effectT21 = S21 + R21 Total crossed effect
Unit 5 – Pg. 6

5.1 Income and substitution effects
• The decomposition depends on how we define “real income”:
The Slutsky criterion identifies real income with purchasingpower: after the change in the price, the consumer can
purchase, if he/she wishes, the market basket initially chosenbefore the price change:
– The substitution effect is the change in the quantitydemanded due to the change in one price, with purchasingpower being constant (↓P1/P2)
– The income effect is the change in the quantity demandedas a consequence of the change in the purchasing powerafter the change in the price of the good. (↑Y/P1)
•
Unit 5 – Pg. 7

5.1 Income and substitution effects
• Graphical analysis:
(1) Initial budget line Initial equilibrium E0
(2) ↓ p1 ↑(Y/p1) New budget line New equilibrium E1
(3) Now we move the new budget line towards the origin, in parallel, in such a way that it passes through the initial equilibrium, corresponding to a hypothetical budget line with purchasing power (YS/p1) hypothetical/theoretical equilibrium ES
q10
q20
Y/p10
E0
q1
q2
E1q21
q11 Y/p1
1
Y/p20
ES
q1S
q2S
YS/p11
1 3 2
Unit 5 – Pg. 8

5.1 Income and substitution effects
• Graphical analysis:
q10
q20
Y/p10
E0
q1
q2
E1q21
q11 Y/p1
1
Y/p20
ES
q1S
q2S
YS/p11
1 3 2
(i) Equilibrium E0: max U(q1,q2)s.t Y = p0
1q1 + p02q2
(ii) Equilibrium E1: max U(q1,q2)s.t Y = p1
1q1 + p02q2
(iii) Equilibrium ES: max U(q1,q2)s.t YS = p1
1q1 + p02q2
Unit 5 – Pg. 9

5.1 Income and substitution effects
• Graphical analysis:
q10
q20
Y/p10
E0
q1
q2
E1q21
q11 Y/p1
1
Total effect
Y/p20
ES
q1S
q2S
Substitution effect Income effect
YS/p11
effect Income Fromeffect on Substituti From
effect Total From
1S
0
10
EEEEEE
S
Unit 5 – Pg. 10

5.1 Income and substitution effects
• Graphical analysis: Direct effects
q10
q20
Y/p10
E0
q1
q2
E1q21
q11 Y/p1
1
T11
Y/p20
ES
q1S
q2S
S11 R11
YS/p11
111111
111
1S
1
11S
10
1
111
10
1
)(R effect incomeDirect From
)(Seffect on substitutiDirect From
)(T effect alDirect tot From
RST
Unit 5 – Pg. 11
5.1 Income and substitution effects
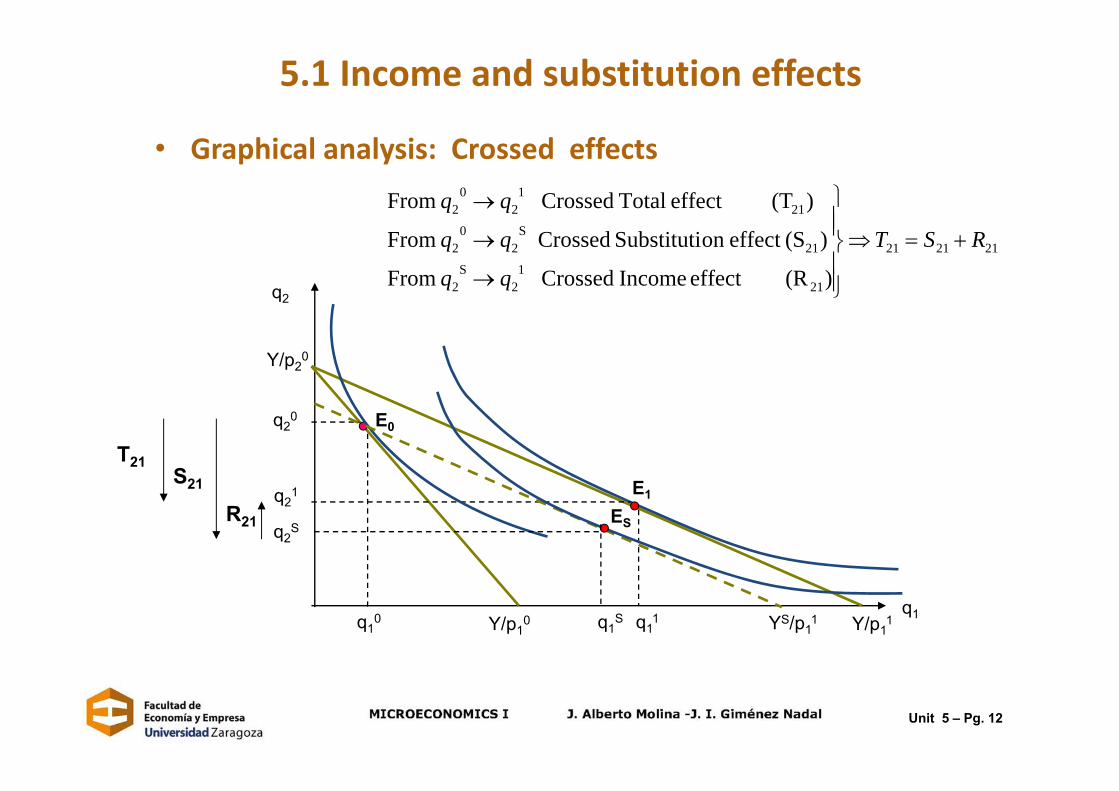
• Graphical analysis: Crossed effects
q10
q20
Y/p10
E0
q1
q2
E1q21
q11 Y/p1
1
T21
Y/p20
ES
q1S
q2S
S21
R21
YS/p11
212121
211
2S
2
21S
20
2
211
20
2
)(R effect Income Crossed From
)(Seffect on Substituti Crossed From
)(T effect Total Crossed From
RST
Unit 5 – Pg. 12

5.1 Income and substitution effectsSign and size of the effects:
• The sign of the effects shows whether the change in prices and the change in quantities goes in the same or the opposite direction:
– Same direction → Positive sign
– Opposite direction → Negative sign
• The sign and size of the total, direct and crossed, effects determine the relation between the goods in gross terms
• The sign and size of the substitution effects determine the relation between the goods in net terms
• The sign of the direct total effect indicates the type of the individual demand: normal (‐) or abnormal (+)
• The sign of the crossed total effect indicates the type of the crossed demand
• The sign of the total income effect indicates the type and shape of the Engel curve: normal, inferior or neutral good
Unit 5 – Pg. 13

5.1 Income and substitution effectsSign and size of the effects:
• The direct substitution effect S11 is always negative (as a consequence of the strict convexity of preferences).
• The crossed susbtitution effect S21 is always positive when there are onlytwo goods (Q1 and Q2 ). When there are more than two goods, it can exhibitany sign:
(↓p1 → ↓ p1/ p2 → ↓ q2)
• The income effectmay have any sign:
– R11<0 if the good Q1 is NORMAL (↓p1 → ↑ Y/p1 → ↑ q1)
– R11=0 if the good Q1 is NEUTRAL (↓p1 → ↑ Y/p1 → ni ↑ ni ↓ q1)
– R11>0 if the good Q1 is INFERIOR (↓p1 → ↑ Y/p1 → ↓ q1)
Unit 5 – Pg. 14

5.1 Income and substitution effectsClassification of the goods in gross‐net terms:
(1) GROSS TERMS (using the crossed price elasticity): ↓P1
If T11 and T21 have the same sign Gross complements
If T11 and T21 have opposite sign Gross substitutes
If T21 = 0 Gross independent
(2) NET TERMS (given S11< 0):
If S21 > 0↓p1→ ↑ q1 → ↓q2 Net substitutes
If S21< 0↓p1 → ↑ q1 → ↑ q2 Net complements
If S21 = 0↓p1 → ↑ q1 → neither ↑ nor ↓ q1 Net independent
In a two‐goods economy (Q1 and Q2 ) the crossed substitution effects are always POSITIVE the goods are always NET SUBSTITUTES
Unit 5 – Pg. 15

5.1 Income and substitution effects
Classification of demand by means of the total effect:
Decreases the price of good 1:
Type of good(sign of R11)
S11 R11 T11 Demand
(1) Normal good (R11<0) <0 <0 NEGATIVE Normal
(2) Neutral good (R11=0) <0 0 NEGATIVE Normal
(3) Inferior good (R11>0) <0 >0
i) |S11|>|R11| NEGATIVE Normal
ii) |S11|=|R11| ZERO Rigid
iii) |S11|<|R11| POSITIVE Abnormal
Unit 5 – Pg. 16

5.1)¡ Income and substitution effects
• Classification of demand by means of the total effect:
(1) Normal good (R11< 0) & Normal Demand T11 = S11+ R11 <0
R11 <0
q1
q2
E1
ESEº
S11 <0
T11 <0
Unit 5 – Pg. 17

5.1 Income and substitution effects
• Classification of demand by means of the total effect:
(2) Neutral good (R11= 0) & Normal Demand T11 = S11+ R11 <0
q1
q2
E1
ESEº
T11<0
S11<0 R11= 0
Unit 5 – Pg. 18

5.1) Income and substitution effects
• Classification of demand by means of the total effect:
(3) Inferior good (R11 > 0)& Normal Demand:(i) if S11> R11T11 < 0
q1
q2
E1
ES
Eº
T11 <0
S11 <0 R11 >0
Unit 5 – Pg. 19

5.1 Income and substitution effects
• Classification of demand by means of the total effect:
(3) Inferior good (R11 > 0)& Rigid Demand:(ii) S11 =R11 T11 = 0
q1
q2
E1
ES
Eº
T11=0
S11 <0
R11 >0
Unit 5 – Pg. 20

5.1 Income and substitution effects
• Classification of demand by means of the total effect:
(3) Inferior good (R11 > 0)& Abnormal Demand:(iii) if S11<R11T11>0
q1
q2
E1
ESEº
T11 >0
S11 <0
R11 >0
Unit 5 – Pg. 21
5.2 The consumer surplus
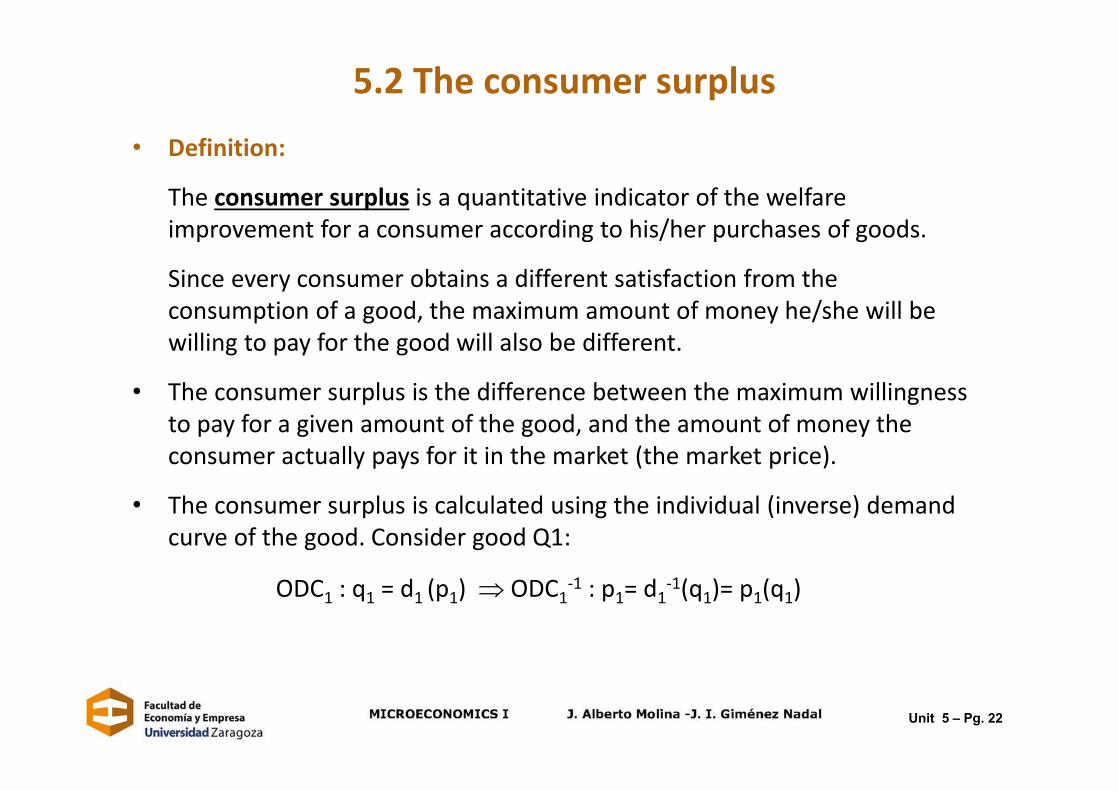
• Definition:
The consumer surplus is a quantitative indicator of the welfare improvement for a consumer according to his/her purchases of goods.
Since every consumer obtains a different satisfaction from the consumption of a good, the maximum amount of money he/she will be willing to pay for the good will also be different.
• The consumer surplus is the difference between the maximum willingness to pay for a given amount of the good, and the amount of money the consumer actually pays for it in the market (the market price).
• The consumer surplus is calculated using the individual (inverse) demand curve of the good. Consider good Q1:
ODC1 : q1 = d1 (p1) ODC1‐1 : p1= d1‐1(q1)= p1(q1)
Unit 5 – Pg. 22

5.2 The consumer surplus• The consumer surplus is the consumer net gain from consuming all
desired units of the good (maximum willingness to pay minus the real cost of the consumption):
q1
p1
q1(p1)
q1o
p10 CS
01
0
01
01111
01 )()(
q
qpdqqpqCS
p1(q1) → Inverse of the ordinary demand curve of the individual. Indicates the maximum price the consumer is willing to pay for each unit of the good
Unit 5 – Pg. 23
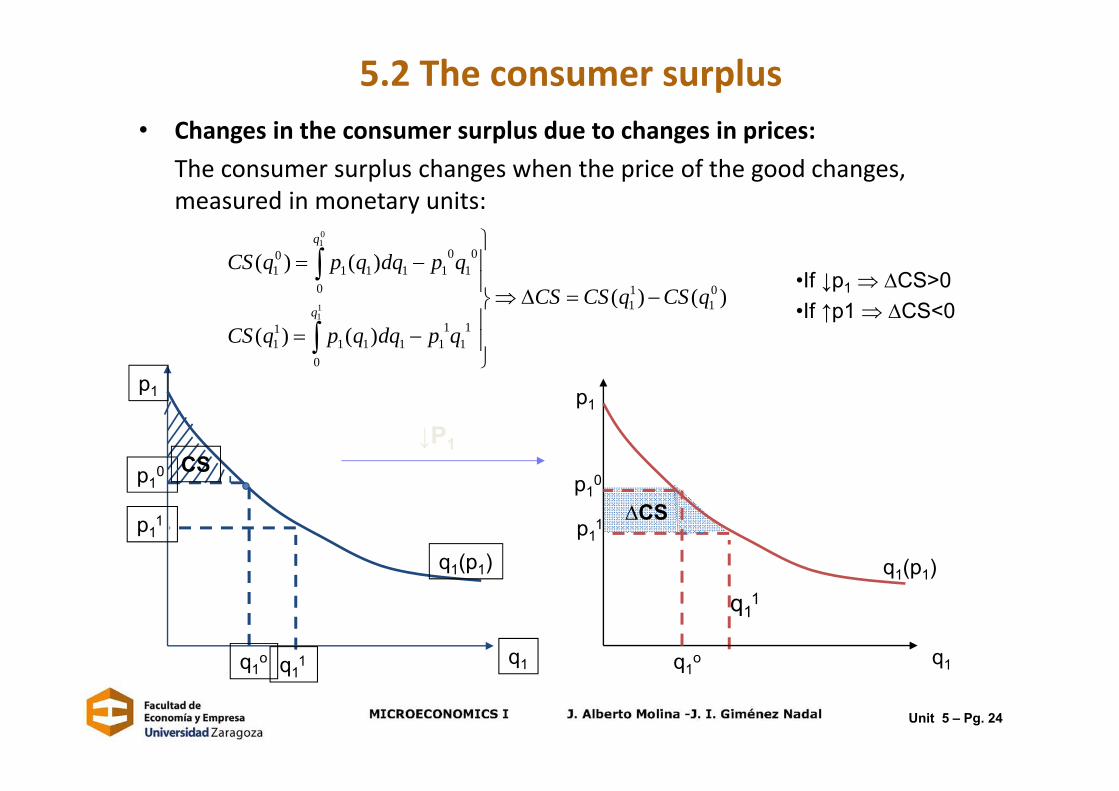
5.2 The consumer surplus• Changes in the consumer surplus due to changes in prices:
The consumer surplus changes when the price of the good changes, measured in monetary units:
q1
p1
q1(p1)
q1o
p10 CS
p11
q11
q11
p11
q1
p1
q1(p1)
q1o
p10
CS
↓P1
)()(
)()(
)()(01
11
0
11
11111
11
0
01
01111
01
11
01
qCSqCSCS
qpdqqpqCS
qpdqqpqCS
q
q
•If ↓p1 CS>0•If ↑p1 CS<0
Unit 5 – Pg. 24

5.3 From the individual demand functions to the market demand function
• The market demand is the function that provides the total quantity demanded of the good in the market for each possible price. To obtain this market demand, we sum all quantities demanded by all consumers at the same price.
• The market demand curve is the sum of theindividual demand curves of all consumers in themarket of the good.
Unit 5 – Pg. 25

5.3 From the individual demand functions to the market demand function
• The market demand curve is graphically obtained by adding for the same price all individual demand curves:
• The market demand curve moves to the right as more consumers enter the market.
• All variables affecting the individual demand curves also affect the market demand curve.
P
q
P
q
P
q
Individual A Individual B MARTET
Pº Pº Pº
a b a+b
Unit 5 – Pg. 26

5.3 From the individual demand functions to the market demand function
• Example 1:
1 6 10 16 32
2 4 8 13 25
3 2 6 10 18
4 0 4 7 11
5 0 2 4 6
Price Individual A Individual B Individual C Market(euro) (units bought) (units bought) (units bought) (units bought)
Unit 5 – Pg. 27

5.3) From the individual demand functions to the market demand function
• Example 1:
Quantity
1
2
3
4
Price
0
5
5 10 15 20 25 30
DB DC
Market demand
DA
The market demand curve is obtainedby adding horizontally the individual demand curves.
Unit 5 – Pg. 28

5.3 From the individual demand functions to the market demand function
The total demand of wheatis the horizontal sum of the
domestic demand AB and the demand for export CD.
The domestic demand of wheat is given by equation:QDD = 1.700 - 107P
The demand of wheat for export is given by the equation:QDE = 1.544 - 176P
Example 2:
C
D
Demandforexport
A
B
Domesticdemand
F
Total demand
E
Wheat
Price
0
2
4
6
8
10
12
14
16
18
20
1000 2000 3000 4000
AESegment 8.77P if 1071700EFSegment 8.77P if 2833244
PP
QQQ EDDDtotal
Unit 5 – Pg. 29

Exercises1.‐ The preferences of a family between food (Q1) and other goods (Q2) are represented by the utility function: We know that the family’s total income is 22 m.u. and the price of each unit of (Q2) is 2. Answer the following questions:
a) Obtain the equilibrium assuming that the unitary price of food is 1.b) Assume that the price of food increases to p1 = 8. Obtain the income
needed for the consumer’s purchasing power to be constant.c) Obtain the income and substitution effects and represent the situation
graphically.d) Classify the goods in gross and net terms.
2.‐ The preferences can be represented by the utility function: Answer the following questions:
a) Calculate the quantities at equilibrium when the consumer income is 24., the price of good Q1 is 2 and the price of good Q2 is 1
b) The government establishes a unitary tax on consumption of good Q1 of 6. Obtain the income and substitution effects under the Slutsky decomposition criterion and represent the situation graphically.
c) Classify the goods in gross and net terms.Unit 5 – Pg. 30

3.‐ The preferences of a consumer are represented by the function: Answer the following questions:
a) Calculate the quantities demanded of both goods when the consumer’s income is 600, the price of good Q1 is 2 and the price of good Q2 is 4.
b) As a consequences of the liberalization of imports in the market of good Q2 the price falls to P2=3. Obtain the income and substitution effects and represent the situation graphically. Classify the good in gross and net terms.
c) Starting from the situation in point b) above, the government is planning to tax the consumption of Q2 and there are two possibilities:
I. A tax of 2 per unit of Q2.II. An income tax designed to achieve exactly the same revenue as
the tax in (i).Determine the appropriate income tax in (ii) and argue which tax will be preferred by the consumer.
Unit 5 – Pg. 30

4.‐ Given the utility function: , answer the following questions:a) Calculate the quantities demanded at equilibrium if the income is 400, the
price of good Q1 is 4 and the price of good Q2 is 8.b) Calculate the change in consumer surplus if the price of good Q1 rises to 8
5.‐ Considering the utility function: answer the following: a) Decompose the total effect (direct and crossed) from an initial situation
(Y=8; P1=2; P2=1) and a final where P1’=1, and represent graphically.b) Explain the relation between the goods in both gross and net terms.
6.‐ Consider the utility function: and answer the following:a) Decompose the total effect (direct and crossed) from an initial situation
(Y=50; P1=3; P2=4) and a final where P2’=2, and represent graphically.b) Explain the relation between the goods in both gross and net terms.
312
2113 qqU
)4)(2( 21 qqU
3/12
2/11 qqU
Unit 5 – Pg. 31
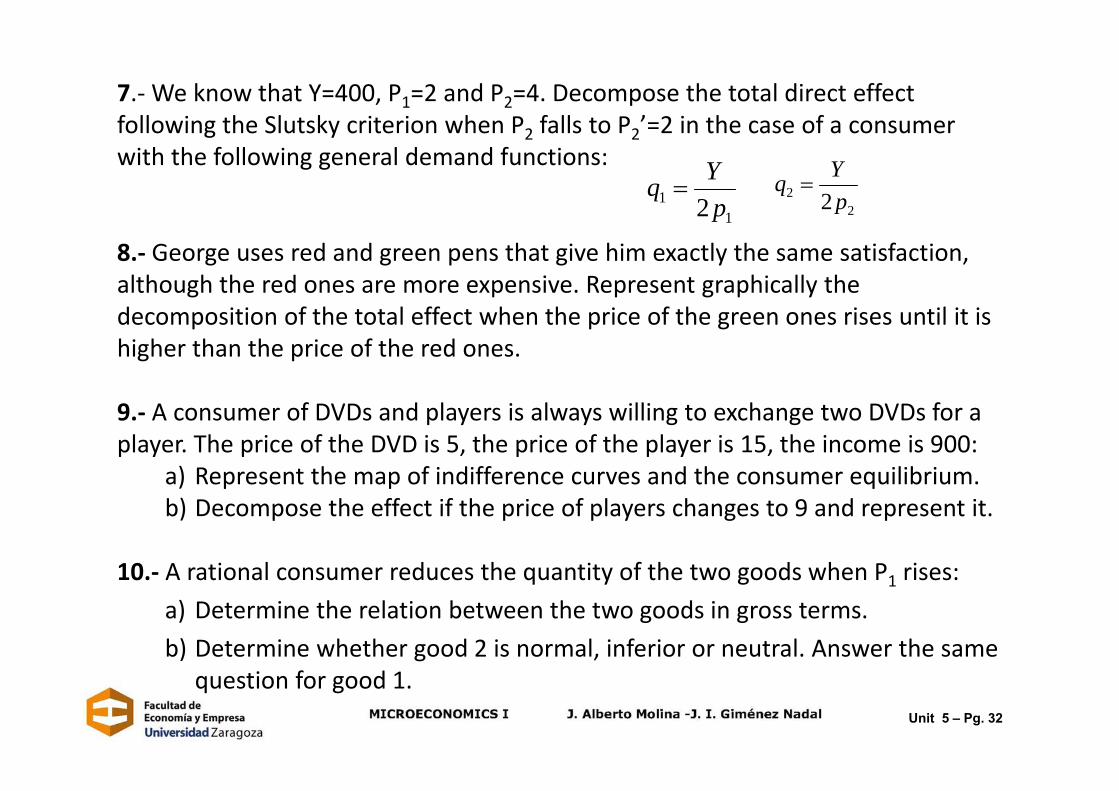
7.‐We know that Y=400, P1=2 and P2=4. Decompose the total direct effect following the Slutsky criterion when P2 falls to P2’=2 in the case of a consumer with the following general demand functions:
8.‐ George uses red and green pens that give him exactly the same satisfaction, although the red ones are more expensive. Represent graphically the decomposition of the total effect when the price of the green ones rises until it is higher than the price of the red ones.
9.‐ A consumer of DVDs and players is always willing to exchange two DVDs for a player. The price of the DVD is 5, the price of the player is 15, the income is 900:
a) Represent the map of indifference curves and the consumer equilibrium.b) Decompose the effect if the price of players changes to 9 and represent it.
10.‐ A rational consumer reduces the quantity of the two goods when P1 rises:a) Determine the relation between the two goods in gross terms.b) Determine whether good 2 is normal, inferior or neutral. Answer the same
question for good 1.
11 2 p
Yq 2
2 2 pYq
Unit 5 – Pg. 32

11.‐ Considering goods 1 and 2 are perfect substitutes, with P1=6; P2=8; Y=48. Decompose the total effect when P1 falls to P1’=4 and represent it graphically.
12.‐You are in charge of opening a bridge with variable use Q in which the user fee is denoted by P. The (inverse) total demand of the use of the bridge is P= 15 – (1/2)Q. Answer the following questions:
a) Represent graphically the demand curve of the bridge.b) How many people will cross the bridge if its use is free. c) Calculate the loss in consumer surplus associated with a user fee of 5 Є.d) You are studying the possibility of increasing the fee to 7. How many people will now
cross the bridge? Will revenue rise? Is the answer to the previous question related to the price elasticity of the market demand? Explain.
e) Find the loss in consumer surplus when the user fee rises from 5 to 7 .
13.‐ The “Internacional” restaurant (1) in Manhattan, restaurant “Shabeen” in Miami (2) and restaurant “Chon” in Mexico (3) are the only restaurants in the world that buy a delicious species of insect for cooking the dish called “crunchy bees larvae covered with hot chocolate”. The three restaurant’s demand curves are, respectively:
Find the total demand for the market of bees larvae and represent it graphically.
1 11502
p q 11 4
140 qp 11 5130 qp
Unit 5 – Pg. 33