unit 4: data relationships - grade 6 is...
TRANSCRIPT

unit 4 notes.notebook
1
Unit 4: Data Relationships

unit 4 notes.notebook
2
We will discuss the following outcomes during this unit:6SP1 Create, label and interpret line graphs to draw conclusions.
6SP2 Select, justify and use appropriate methods of collecting data, including:• questionnaires• experiments• databases• electronic media.
6SP3 Graph collected data, and analyze the graph to solve problems.
6SS8 Identify and plot points in the first quadrant of a Cartesian plane, using whole number ordered pairs.
6PR2 Represent and describe patterns and relationships, using graphs and tables.

unit 4 notes.notebook
3
Review
First-hand Data Information you collect
Second-hand Data Information others collect (e.g., the most downloaded song
this week).

unit 4 notes.notebook
4
Methods of Gathering Information
Questionnaire

unit 4 notes.notebook
5
What makes a good question to use when conducting a questionnaire?

unit 4 notes.notebook
6
Decide whether or not each sample is a good choice for the population it represents. Justify your decision.
a) Should dog owners be forced to keep their dogs on a leash when in public?SAMPLE: selection of dog owners
b) Are telephone customers satisfied with the quality of service?SAMPLE: randomly selected telephone customers
c) Which is the best Canadian hockey team?SAMPLE: fans at a Montreal Canadian game
d) How should the school cafeteria be redecorated?SAMPLE: students going in and out of the cafeteria

unit 4 notes.notebook
7
Carmen's QuestionnaireCarmen designed and handed out 100 questionnaires to students in her school. She asked this question:
What do you want to be?- Doctor/Dentist - Teacher - Lawyer- Sports manager - Coach
50 questionnaires were returned. Here are the results:
Boys Girls
Doctor/Dentist 10 6
Teacher 2 11
Lawyer 13 7
Sports Manager 5 1
Carmen reached the conclusion that most students will become doctors or dentists. Do you agree with her conclusion? Explain.
Describe what she might have done to improve:• The wording of her question: • The method of gathering data: • The sample she chose to survey:

unit 4 notes.notebook
8
Review: Types of Graphs (Notebook File)
After review: Create three questions based on the bar graph.
unit 4 notes.notebook
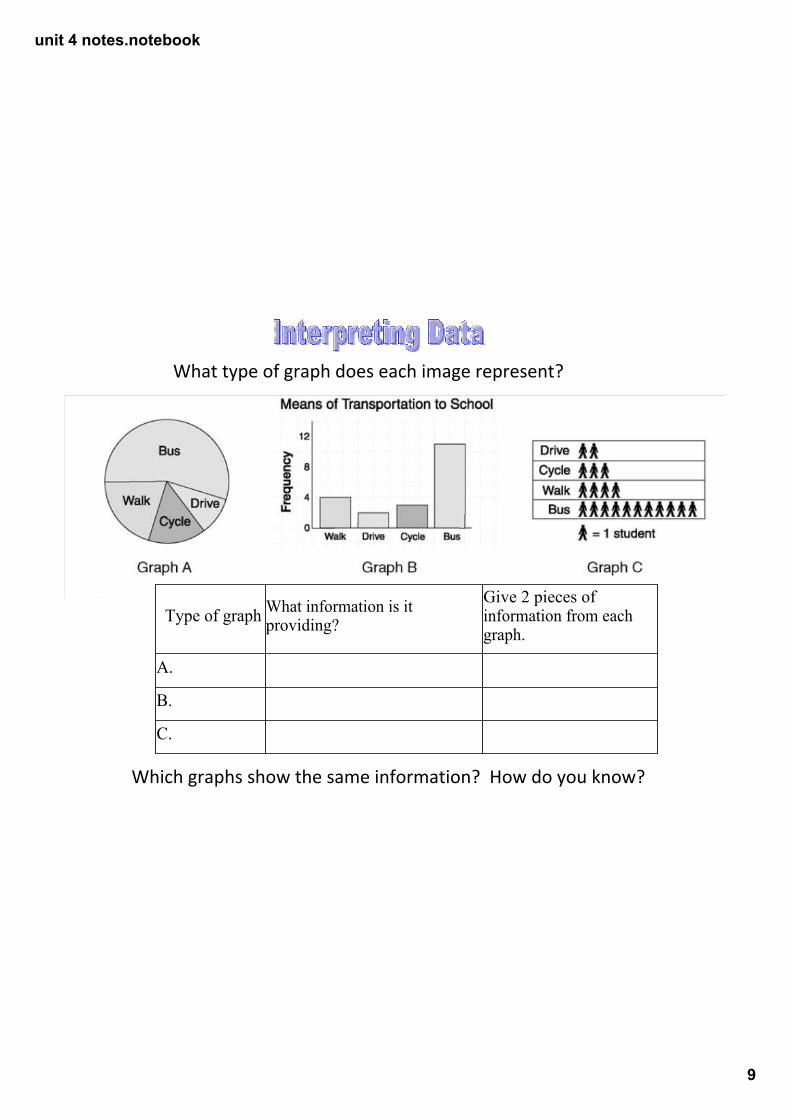
9
What type of graph does each image represent?
Type of graph What information is it providing?
Give 2 pieces of information from each graph.
A.
B.
C.
Which graphs show the same information? How do you know?

unit 4 notes.notebook
10
Assignment 1: Creating a Questionnaire ﴾partner activity﴿
1. You will be assigned to a grade for which you must complete a survey/questionnaire. Brainstorm different topics for which you would like to create a survey or questionnaire. Record your brainstorm on a piece of paper ﴾to be submitted with your assignment﴿.
2. Select one topic on which you will gather information. Your group will create the survey questions or questionnaire, carry out the survey, and record the results ﴾to be submitted with your assignment﴿.
3. Your group will present your collected data to the class using a bar graph ﴾to be submitted with your assignment﴿. You are required to create three questions to ask the class which can be answered from your results.
Survey Date: ________________
Presentation Date: ________________

unit 4 notes.notebook
11
DatabasesWhat is a Database?• An organized set of a large amount of information, often stored on a computer (e.g., There are databases that show yearly high and low temperatures and precipitation for major cities, and databases that show Olympic medial won by every country). • The type of database you choose to explore depends on the type of question you want answered. (E.g., NHL, music data, Stats Canada) • You could use a database to look for information from the past, or to look for information that covers a particular period of time.
What kinds of information would be contained within these databases?
Enrolments in schools, Canada, provinces and territories
Undergraduate tuition fees for full time Canadian students

unit 4 notes.notebook
12
ExperimentsWhat is an Experiment?• A situation or test that you set up so you can observe the results. • We can use experiments to gather information. • Sample questions you can ask after conducting an experiment:- What do you notice about the results? - Is there another method you could use to answer the same question?- Why was this experiment a good method to find out the answer to your question?- Why would you not use another method of collecting your data?
Try this experiment: Working in pairs, roll a die 50 times. Record how many times each number occurs in a tally chart. Draw conclusions from this experiment.

unit 4 notes.notebook
13
Which data collection method (questionnaires, experiments, or databases) would be most appropriate for each question?
• How many books did each student in a Grade 4 class read over the summer?• What is the relationship between the ‘drop height‛ and the ‘bounce height‛ of a ball?• How much has the moose population in Newfoundland and Labrador increased over the past 25 years?• How many times would TAILS show up if you flipped a coin 50 times? • Which NHL hockey player holds the record for most goals in one season? • Which type of music is most preferred in your grade? • Which subject area is least preferred in your class?
Show What You Know! (worksheet)

unit 4 notes.notebook
14
horizontal axis (xaxis)
vertical axis (yaxis)
Origin (0, 0)The point where the xaxis and yaxis intersect
(5, 3) ordered pair (x, y)

unit 4 notes.notebook
15
• The order in which you write x and ycoordinates in an ordered pair is very important. • The xcoordinate always comes first, followed by the ycoordinate. • As you can see in the coordinate grid above, the ordered pairs (3,4) and (4,3) refer to two different points!

unit 4 notes.notebook
16
The location of (2,5) is shown on the coordinate grid below. The xcoordinate is 2. The ycoordinate is 5. To locate (2,5):First step: Move 2 units to the right on the xaxisSecond step: Move 5 units up on the yaxis.

unit 4 notes.notebook
17
Practice plotting coordinates1. Copy this grid onto squared paper. 2. Label the xaxis, yaxis, and origin. 3. Write the coordinates of points P and Q next to the letters.4. Plot the point R, with coordinates (4, 7).5. Plot the point S, with the coordinates (6, 9).6. Plot the point T, with the coordinates (10, 3).
unit 4 notes.notebook
18
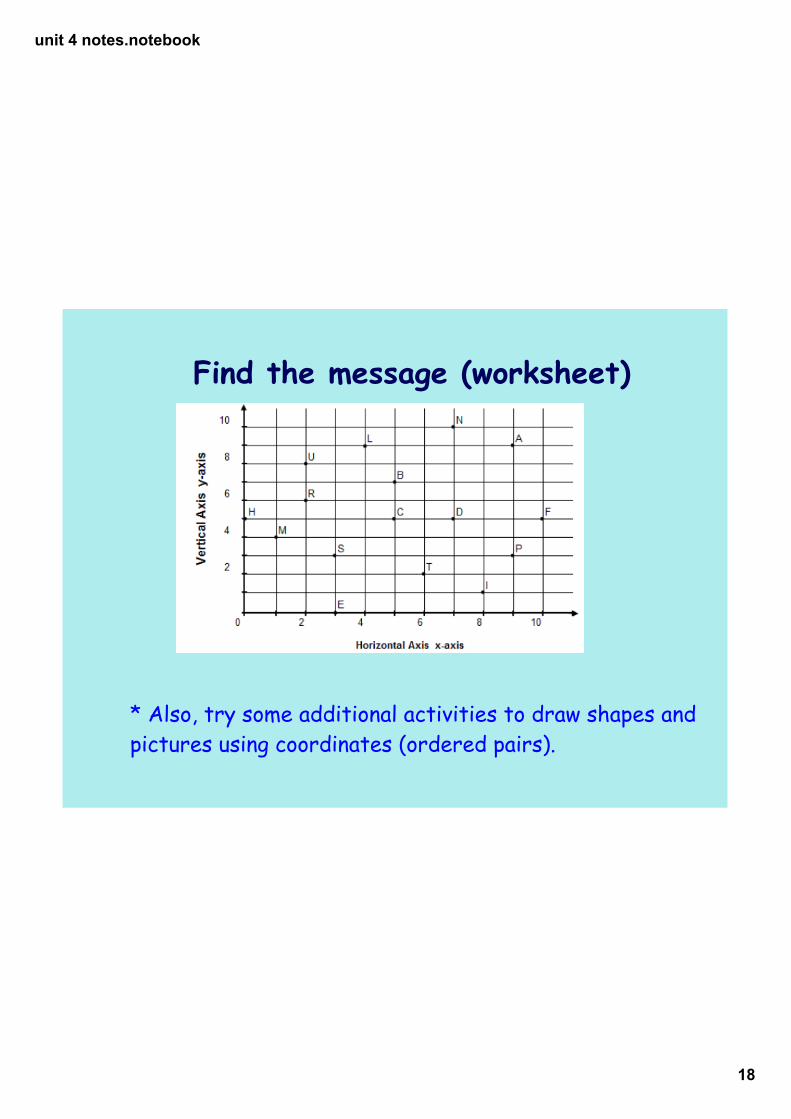
Find the message (worksheet)
* Also, try some additional activities to draw shapes and pictures using coordinates (ordered pairs).

unit 4 notes.notebook
19
Battleship How to Play:Each student gets a blank grid and draws 4 different battleships anywhere on the grid. Each battleship should cover 3, 4, 5 or 6 coordinates (one battleship for each number of coordinates). Students work in pairs and take turns calling ordered pairs to try to locate their partner‛s battleships. As the ordered pairs are called, each player will indicate HIT, MISS or SUNK. The first student to sink all of their opponent‛s battleships wins.

unit 4 notes.notebook
20
Determine the distance between points along horizontal and vertical lines.

unit 4 notes.notebook
21
* Use a coordinate grid with axes labelled from 0 to 10. * Plot each pair of points on the grid, join the points with a line
segment and find the length of each line segment. ﴾a﴿ ﴾4,2﴿ and ﴾7,2﴿ ﴾b﴿ ﴾5,7﴿ and ﴾10,7﴿
* Work with a partner to share pairs of points and find the distance between them.

unit 4 notes.notebook
22
Line GraphA line graph is used when there is a numeric value associated with equally spaced points along a continuous number scale. Points are plotted and a line is drawn to connect the points. Every point on the line should have a value.
Line graphs are used to show trends in data, usually over time. The points are plotted to show relationships between two variables (one is usually time) and the points are joined with a line to make it easier to see trends.
Like bar graph, line graphs have a title, they are labeled and they use a clear scale.

unit 4 notes.notebook
23
When to Use a Line graph
* Line graphs are used to track changes over short and long periods of time.
* When smaller changes exist, line graphs are better to use than bar graphs.
* Line graphs can also be used to compare changes over the same period of time for more than one group.

unit 4 notes.notebook
24
To ‘infer’ is to reach a conclusion by reasoning. 1. What can you ‘infer’ from the following graph? Be sure to explain your reasoning.
2. Write three questions that can be answered from this graph.
3. Trade questions with a classmate. Answer your classmate’s questions.

unit 4 notes.notebook
25
What information can you get from this graph?What questions can be answered by looking at the graph?
Think - Pair - Share

unit 4 notes.notebook
26
Create a table of values to display the information shown in this graph.

unit 4 notes.notebook
27
Use the line graph to create a table of values.
What patterns (trends) do you notice?

unit 4 notes.notebook
28
Checklist for your line graph:
My graph has a title
My xaxis is labeled
My yaxis is labeled
My points are plotted
There is a legend (An explanation of the symbols or colours in a graph)
My graph is neat and easy to read
My space is well used
I choose an appropriate scale to reflect the numbers in my data

unit 4 notes.notebook
29
1. The table of values shows the relationship between the number of plastic drinking cups and the number of millilitres they hold.
Number of Cups Capacity (Millilitres)
0 0
1 25
2 50
3 75
4 100
5 125
a. Display the data on a line graph.b. What scale did you use? Why?

unit 4 notes.notebook
30
2. During a snowstorm in St. John's in January, a Grade Six class measured the total depth of snow each half hour and recorded the data in a table.
Time 11:00 11:30 12:00 12:30 1:00 1:30 2:00 2:30
Depth (cm) 0 2 4 7 11 15 17 20
a. Display the data on a line graph.b. What scale did you use? Why?

unit 4 notes.notebook
31
3. Heather was asked to find out the cost to rent a popcorn machine for a school event. The rental company sent the table at the left, showing the rental fees.
Number of Hours Cost
1 $25
2 $35
3 $45
4 $55
a. Display the data on a line graph.b. What scale did you use? Why?

unit 4 notes.notebook
32
Assignment: Number of Awards Given in Grades 5, 6 and 7
Represent the following data on a line graph. Each grade level should be represented by a different colour.
Number of Weeks Number of Awards in Given in Grade 5
Number of Awards Given in Grade 6
Number of Awards Given in Grade 7
1 30 15 12
2 26 18 16
3 24 19 22
4 17 21 16
5 20 24 18

unit 4 notes.notebook
33
My graph has a title
My xaxis is labeled
My yaxis is labeled
My points are plotted
There is a legend
My graph is neat and easy to read
My space is well used
I choose an appropriate scale to reflect the numbers in my data
Checklist for your graph:
List three conclusions you can form based on your data and your graph.

unit 4 notes.notebook
34