unit 2 weather
TRANSCRIPT
Weather
Prior KnowledgeThe student has1. described evaporation, condensation2. listed and described three forms of water3. described the earth’s rotation on its axis4. grouped objects by a given single-digit number5. counted and constructed sets to 100 and skip-counted by fives
and 10s6. placed two-digit numbers correctly on a place value chart and
ordered them7. measured lines.
Mathematics, Science and Language ObjectivesMathematicsThe student will
1. use numbers through 1000 2. skip-count by fives, 10s and 100s3. write and order two- and three-digit numbers 4. draw a chart to describe a rate such as miles per hour5. use fractional parts of a set or unit to describe a part of a set or
unit6. convert a rate given in fractions to an equivalent rate, such as
1/2 inch per hour to one inch in two hours7. use addition/subtraction and/or grouping by a base to solve
problems related to time, distance and volume 8. use appropriate geometric terms to describe objects9. estimate linear measurements in blocks, feet, yards and miles
10. read and interpret instrument scales 11. measure time, distance and temperature.
ScienceThe student will
1. list the activity of the sun and the rotation of the earth asmajor causes of weather
2. describe the earth’s atmosphere 3. describe the effects of the sun’s heat on land and water on the
weather4. list, describe and give causes for the seasons5. list and describe the benefits of “good” weather6. list and describe the disasters caused by “foul” weather7. list and describe the various types of clouds and the types of
precipitation they cause
u n i t
2
8. describe different forms of precipitation such as fog, drizzle,ice crystals, snow, hale, dew and sleet
9. describe different forms of air movement such as wind, torna-does and hurricanes
10. describe the cause of air currents, wind and high winds11. find the dew point at a given time and location12. find the relative humidity of a given location at a given time13. describe weather forecasting.
LanguageThe student will
1. engage in dialogue/discussion2. engage in observation activities/demonstration3. record observations about unit activities in a journal4. identify the main idea of a paragraph5. create stories using theme-related vocabulary6. use description to narrate events7. write complete sentences8. give reasons to persuade9. organize information/data
10. use appropriate mathematical expressions and quantities todescribe.
2 Unit 2 Weather
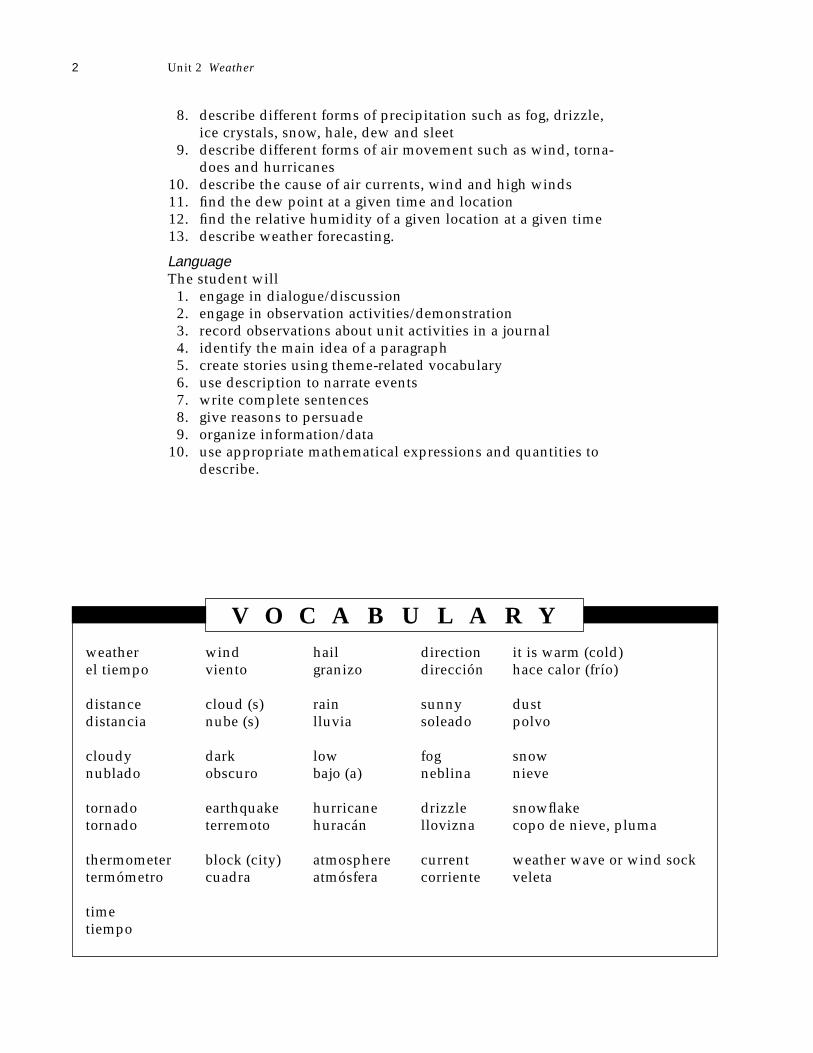
weather wind hail direction it is warm (cold)el tiempo viento granizo dirección hace calor (frío)
distance cloud (s) rain sunny dustdistancia nube (s) lluvia soleado polvo
cloudy dark low fog snownublado obscuro bajo (a) neblina nieve
tornado earthquake hurricane drizzle snowflaketornado terremoto huracán llovizna copo de nieve, pluma
thermometer block (city) atmosphere current weather wave or wind socktermómetro cuadra atmósfera corriente veleta
timetiempo
V O C A B U L A R Y
Unit 2 Weather 3
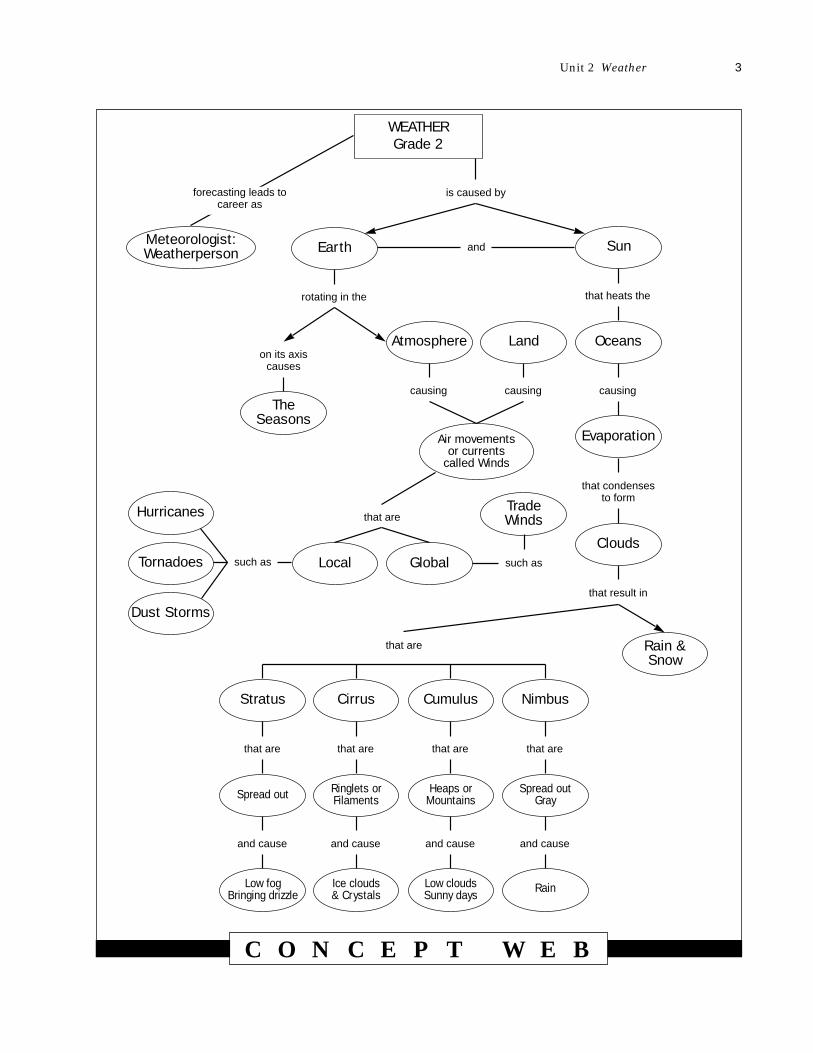
is caused byforecasting leads to career as
Meteorologist:Weatherperson
that result in
that are
WEATHERGrade 2
Sun
OceansLandAtmosphere
Air movements or currents
called Winds
that heats the
Earth
rotating in the
Evaporation
causingcausingcausing
Nimbus
Spread outGray
that are
Rain
and cause
Cumulus
Heaps orMountains
that are
Low cloudsSunny days
and cause
Cirrus
Ringlets orFilaments
that are
Ice clouds & Crystals
and cause
Stratus
Spread out
that are
Low fog Bringing drizzle
and cause
Clouds
Rain & Snow
that condensesto form
Trade Winds
such assuch as GlobalLocalTornadoes
Hurricanes
Dust Storms
that are
The Seasons
on its axiscauses
and
C O N C E P T W E B
Teacher Background Information
The weather is so important that it is a topic of daily conversation everywhere onearth. The weather affects every single person on a 24-hour basis. The amount offood available for humans to eat around the planet depends on the weather, as dothe types of food we eat, the types of houses we live in, the kinds of clothes wewear, the kinds of jobs we have, the ways we find recreation, and the weathereven affects our moods, whether we feel good, sad, and so on. The trouble withthe weather, however, is that no one can do anything about it. Science and tech-nology help us forecast the weather, but that is not the same as doing somethingabout it.
In this unit the students will find out in more specific terms about the types ofweather all of us have experienced. They draw on these experiences by perform-ing the activities that help them understand what causes clouds and rain, windand snow and, generally, the seasons. They understand the role that the sun andthe earth play in causing the weather. As they develop these understandings theywill be able to discuss among themselves and with others, using appropriateterms and quantifiers, the causes of particular types of weather.
The suggested activities require that students participate in whole- or small-group activities that focus on simulations of certain conditions (physical phe-nomena). Although complex, these atmospheric conditions can become under-standable through the use of appropriate analogues. The students will makecharts to describe current weather conditions and then try their hands at forecast-ing the weather on the basis of what they have learned.
It is strongly recommended that students have the opportunity to watch tapedsegments of the Weather Channel on cable television. They can keep track of theforecasts for one to two weeks, make judgments about the accuracy of thesereports and use them as a basis for their own forecasts.
4 Unit 2 Weather
Unit 2 Weather 5
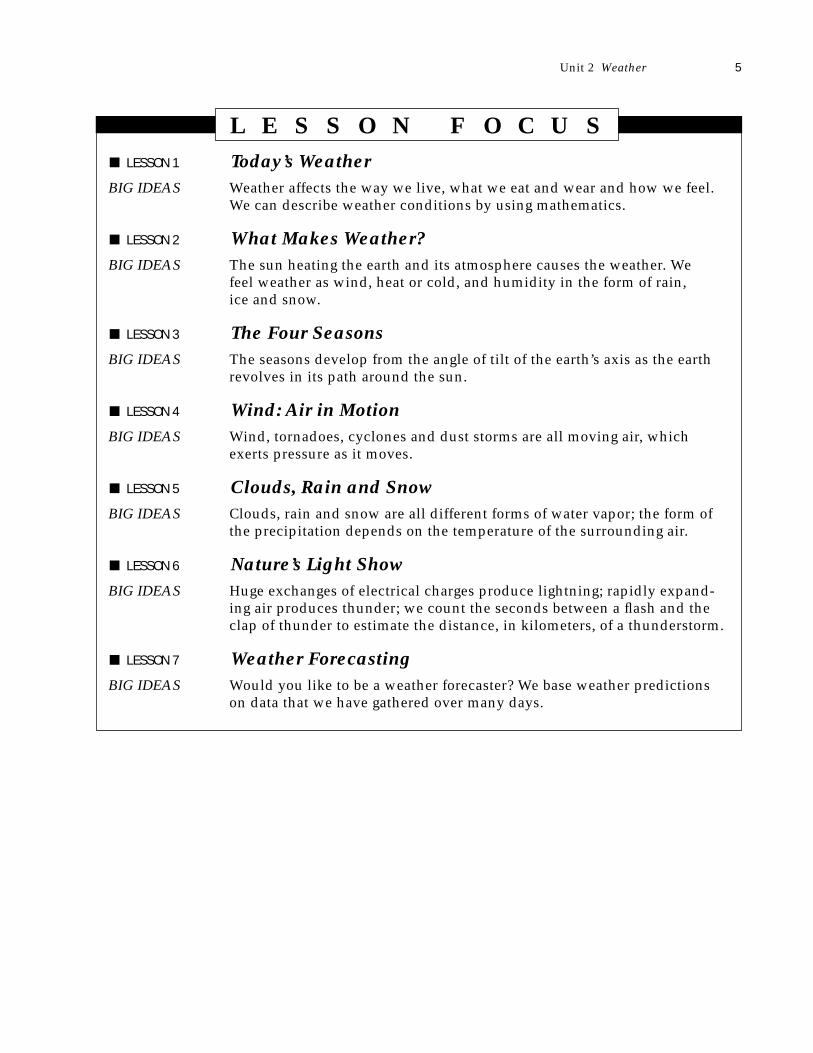
■ LESSON 1 Today’s Weather BIG IDEAS Weather affects the way we live, what we eat and wear and how we feel.
We can describe weather conditions by using mathematics.
■ LESSON 2 What Makes Weather?BIG IDEAS The sun heating the earth and its atmosphere causes the weather. We
feel weather as wind, heat or cold, and humidity in the form of rain, ice and snow.
■ LESSON 3 The Four Seasons BIG IDEAS The seasons develop from the angle of tilt of the earth’s axis as the earth
revolves in its path around the sun.
■ LESSON 4 Wind: Air in MotionBIG IDEAS Wind, tornadoes, cyclones and dust storms are all moving air, which
exerts pressure as it moves.
■ LESSON 5 Clouds, Rain and SnowBIG IDEAS Clouds, rain and snow are all different forms of water vapor; the form of
the precipitation depends on the temperature of the surrounding air.
■ LESSON 6 Nature’s Light ShowBIG IDEAS Huge exchanges of electrical charges produce lightning; rapidly expand-
ing air produces thunder; we count the seconds between a flash and theclap of thunder to estimate the distance, in kilometers, of a thunderstorm.
■ LESSON 7 Weather Forecasting BIG IDEAS Would you like to be a weather forecaster? We base weather predictions
on data that we have gathered over many days.
L E S S O N F O C U S
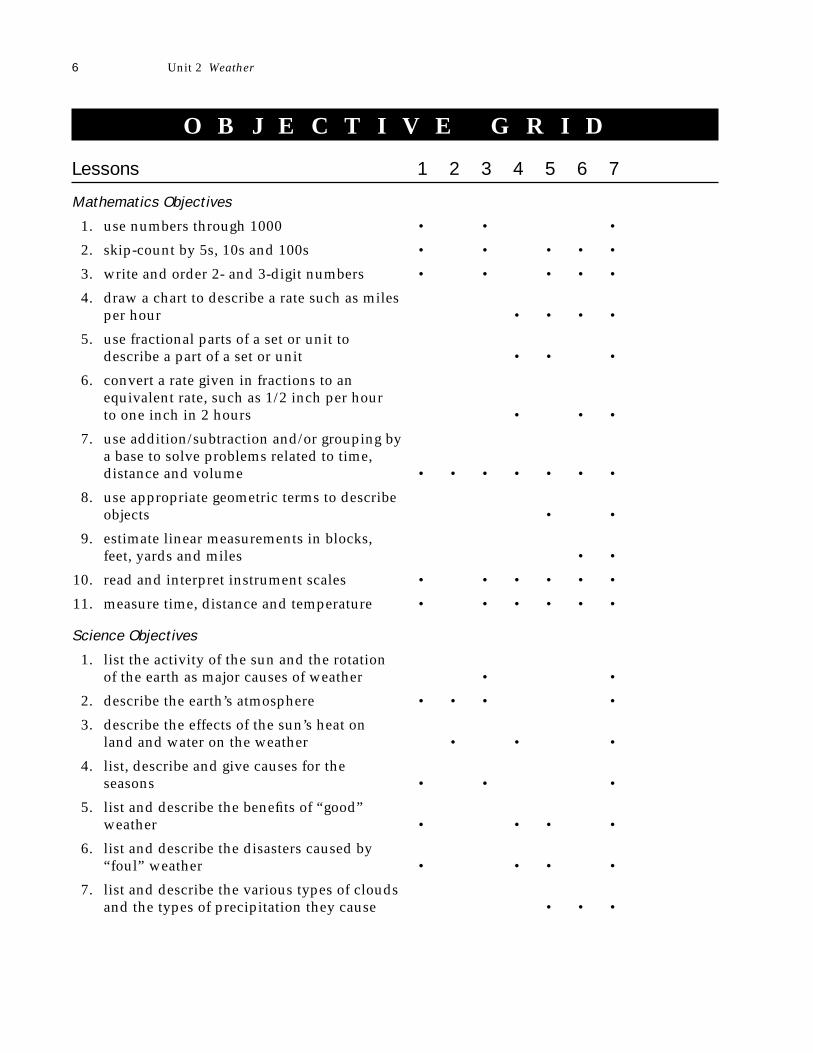
O B J E C T I V E G R I D
Lessons 1 2 3 4 5 6 7
Mathematics Objectives
1. use numbers through 1000 • • •
2. skip-count by 5s, 10s and 100s • • • • •
3. write and order 2- and 3-digit numbers • • • • •
4. draw a chart to describe a rate such as miles per hour • • • •
5. use fractional parts of a set or unit to describe a part of a set or unit • • •
6. convert a rate given in fractions to an equivalent rate, such as 1/2 inch per hour to one inch in 2 hours • • •
7. use addition/subtraction and/or grouping by a base to solve problems related to time, distance and volume • • • • • • •
8. use appropriate geometric terms to describe objects • •
9. estimate linear measurements in blocks, feet, yards and miles • •
10. read and interpret instrument scales • • • • • •
11. measure time, distance and temperature • • • • • •
Science Objectives
1. list the activity of the sun and the rotation of the earth as major causes of weather • •
2. describe the earth’s atmosphere • • • •
3. describe the effects of the sun’s heat on land and water on the weather • • •
4. list, describe and give causes for the seasons • • •
5. list and describe the benefits of “good” weather • • • •
6. list and describe the disasters caused by “foul” weather • • • •
7. list and describe the various types of clouds and the types of precipitation they cause • • •
6 Unit 2 Weather
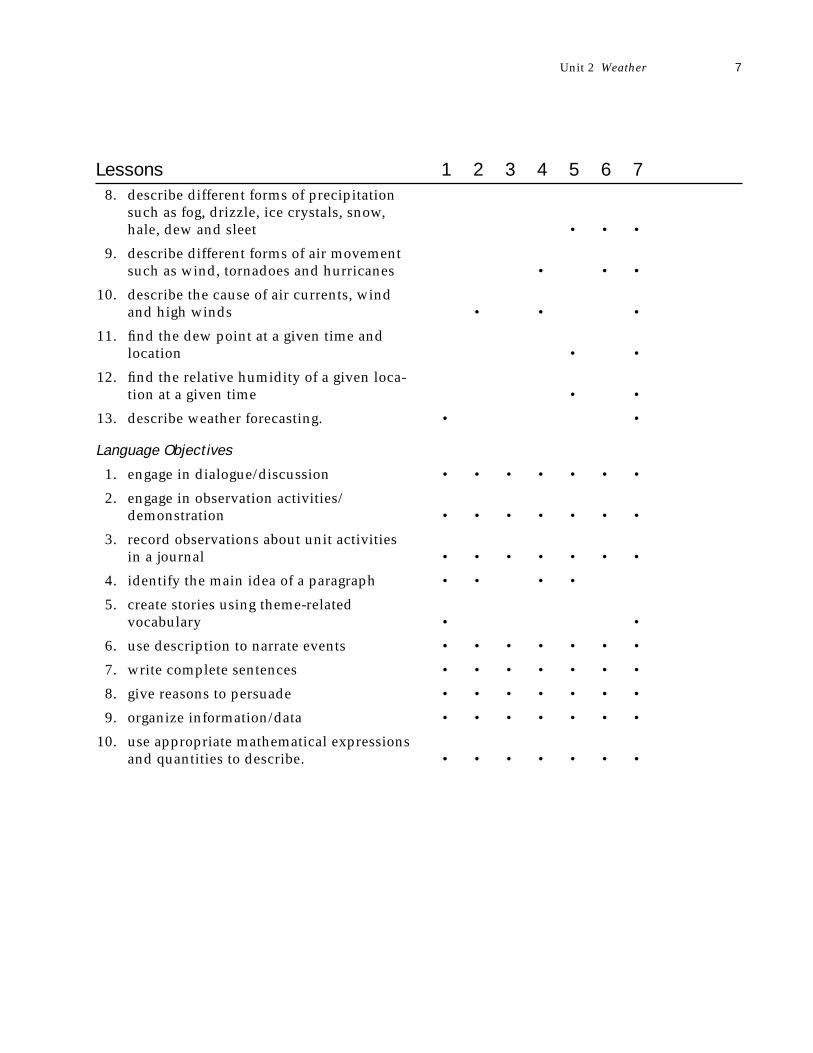
Lessons 1 2 3 4 5 6 78. describe different forms of precipitation
such as fog, drizzle, ice crystals, snow, hale, dew and sleet • • •
9. describe different forms of air movement such as wind, tornadoes and hurricanes • • •
10. describe the cause of air currents, wind and high winds • • •
11. find the dew point at a given time and location • •
12. find the relative humidity of a given loca-tion at a given time • •
13. describe weather forecasting. • •
Language Objectives
1. engage in dialogue/discussion • • • • • • •
2. engage in observation activities/demonstration • • • • • • •
3. record observations about unit activities in a journal • • • • • • •
4. identify the main idea of a paragraph • • • •
5. create stories using theme-related vocabulary • •
6. use description to narrate events • • • • • • •
7. write complete sentences • • • • • • •
8. give reasons to persuade • • • • • • •
9. organize information/data • • • • • • •
10. use appropriate mathematical expressions and quantities to describe. • • • • • • •
Unit 2 Weather 7
BIG IDEAS Weather affects the way we live, what we eat and wear and how wefeel. We can describe weather conditions by using mathematics.
Whole Group WorkMaterialsBooks: Storms in the Night by M. Stolz, The Good Rain by A.E. Gondey or The
Very Windy Day by E. MacDonaldChart tablet (divided into columns with labels: Kind of Weather; Clothes; Work;
Homes; Recreation; What We Cannot Do, etc.)Two strips of bulletin board paper for frame sentencesSeveral books and magazines with illustrations of weather conditions, to place
later in the Library CenterWord tags: weather, forecast, thermometer, predict
Encountering the IdeaThe teacher shows the book Storms in the Night to the students and asks them topredict what the story is about. The teacher reads the story aloud, asking studentsto visualize how it must feel to be in the dark during a thunderstorm. At the con-clusion, the teacher asks the students to recall how the thunderstorm affected thegrandfather and the grandson. (They remained inside, shut windows, couldn’tread or watch TV, had to go to bed early, were afraid of storms, etc.) The teacherand students enter into a discussion of how the weather affects our lives.
Exploring the IdeaIn a whole group activity, the students organize and plan a field trip to experiencethe current weather conditions outside the classroom. They plan their routearound the school and into the neighborhood. They list what they want to see,smell and feel. They also plan how far they will walk and how they will measurethat distance. Then they will measure or estimate the distance. In preparation forthis walk the students, working in groups, design a weather chart to keep the datathey collect each day.
At the Science Center, the students1. begin work on Activity — Weather Forecasting to continue for approximately
three weeks. This activity requires collecting weather data on a daily basis atapproximately the same time each day for two to three weeks. At the end ofthe third week, the students make predictions about the weather for the fourthweek. They check their predictions during the fourth week.
2. make a wind sock to carry with them by completing Activity — A Wind Sockbefore going outside. They discuss the function of the wind sock. Has anyoneseen a wind sock? How do we use it? (At the airport to tell which way the
8 Unit 2 Weather
Today’s WeatherL E S S O N
1
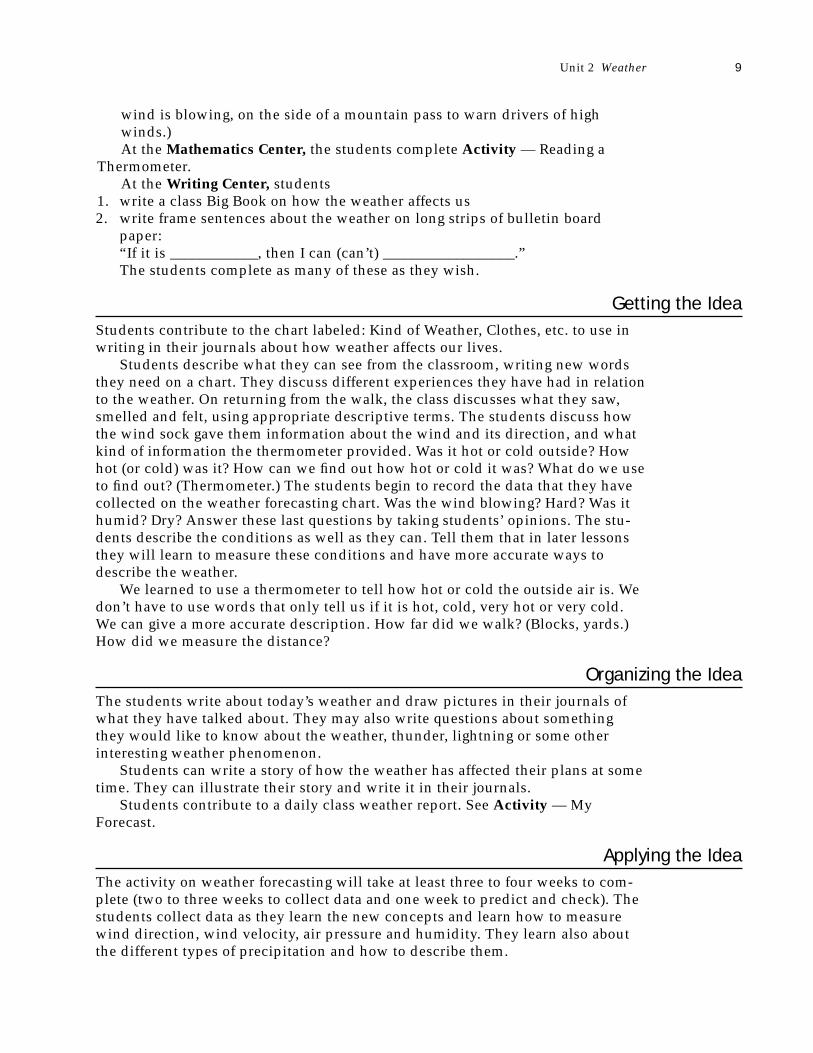
wind is blowing, on the side of a mountain pass to warn drivers of highwinds.)At the Mathematics Center, the students complete Activity — Reading a
Thermometer.At the Writing Center, students
1. write a class Big Book on how the weather affects us2. write frame sentences about the weather on long strips of bulletin board
paper:“If it is ____________, then I can (can’t) __________________.” The students complete as many of these as they wish.
Getting the IdeaStudents contribute to the chart labeled: Kind of Weather, Clothes, etc. to use inwriting in their journals about how weather affects our lives.
Students describe what they can see from the classroom, writing new wordsthey need on a chart. They discuss different experiences they have had in relationto the weather. On returning from the walk, the class discusses what they saw,smelled and felt, using appropriate descriptive terms. The students discuss howthe wind sock gave them information about the wind and its direction, and whatkind of information the thermometer provided. Was it hot or cold outside? Howhot (or cold) was it? How can we find out how hot or cold it was? What do we useto find out? (Thermometer.) The students begin to record the data that they havecollected on the weather forecasting chart. Was the wind blowing? Hard? Was ithumid? Dry? Answer these last questions by taking students’ opinions. The stu-dents describe the conditions as well as they can. Tell them that in later lessonsthey will learn to measure these conditions and have more accurate ways todescribe the weather.
We learned to use a thermometer to tell how hot or cold the outside air is. Wedon’t have to use words that only tell us if it is hot, cold, very hot or very cold.We can give a more accurate description. How far did we walk? (Blocks, yards.)How did we measure the distance?
Organizing the IdeaThe students write about today’s weather and draw pictures in their journals ofwhat they have talked about. They may also write questions about somethingthey would like to know about the weather, thunder, lightning or some otherinteresting weather phenomenon.
Students can write a story of how the weather has affected their plans at sometime. They can illustrate their story and write it in their journals.
Students contribute to a daily class weather report. See Activity — MyForecast.
Applying the IdeaThe activity on weather forecasting will take at least three to four weeks to com-plete (two to three weeks to collect data and one week to predict and check). Thestudents collect data as they learn the new concepts and learn how to measurewind direction, wind velocity, air pressure and humidity. They learn also aboutthe different types of precipitation and how to describe them.
Unit 2 Weather 9
The students select a name for their weather forecasting station. See Activity — Weather Forecasting.1. They begin to record the data on the weather chart to keep track of the
weather. Remember, weekends count too; draw pictures to tell the weather.2. Read an outside thermometer every day just before lunch and record the tem-
perature on the weather chart.3. Learn how to use the windometer made in Lesson 4; take measurements every
day just before lunch and record wind velocity on the chart. Record dewpoint, humidity.
4. Maintain the chart for three weeks. Translate the data from the chart to linegraphs, if appropriate, to make predictions. At the end of the third week makea forecast for the fourth week; students check their predictions with their ownobservations and newspaper or television observations.
5. Review the symbols of the forecasting chart on the first day. The students willadd more data every day as they learn to use the instruments.
Closure and AssessmentHow far did we walk? How did you measure the distance? (Blocks, feet, etc.) Canwe use blocks to tell us how far we walked? Are all the blocks the same length?Can we estimate how far we walked? Can we use blocks to estimate the distance?
Students summarize what new things they learned about the weather focusingon these questions:1. How did the weather affect us today?2. Was the weather sunny or cloudy? Windy? Is it raining? Is it foggy? Is it
dusty? 3. What instruments did we use to help us describe the weather?4. Why is it important to use instruments in describing the weather?
Students summarize their experiences in measuring the distance they walkedand in collecting data.
If we wanted more than an estimate of how far we walked, what could we useto measure the distance?
List of Activities for this Lesson▲ Weather Forecasting
▲ A Wind Sock
▲ Reading a Thermometer
▲ My Forecast (continued in Lesson 7)
10 Unit 2 Weather
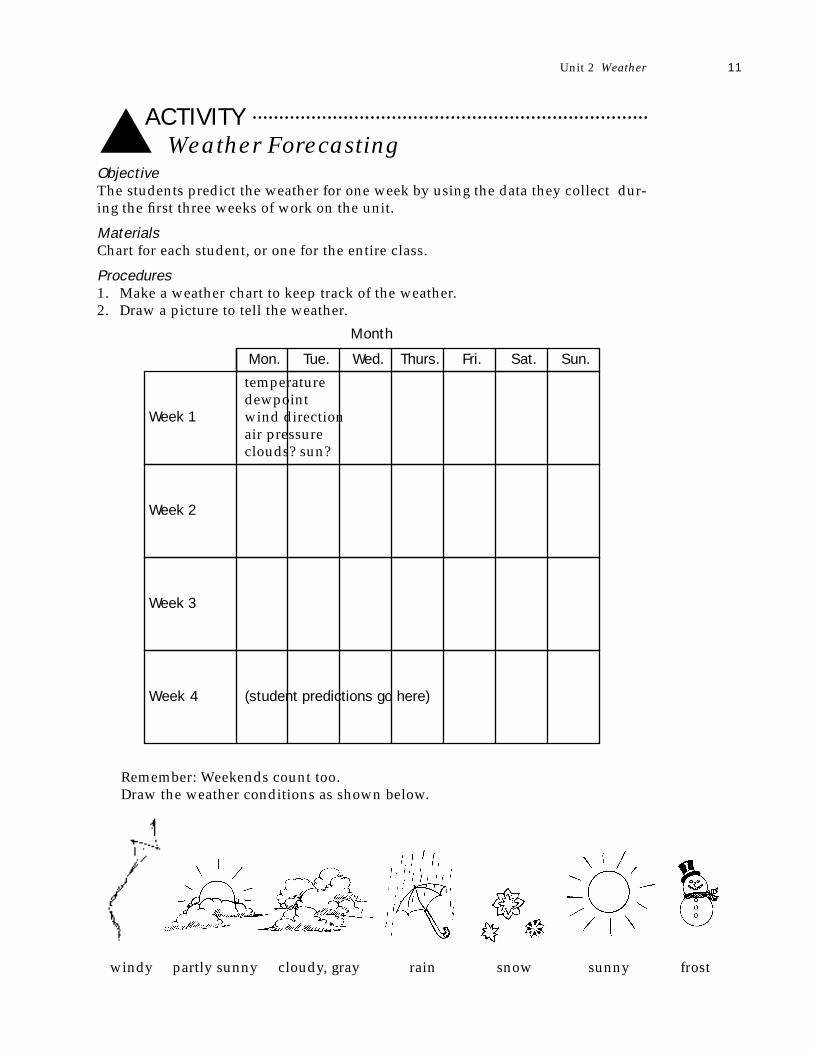
ACTIVITY▲ Weather ForecastingObjectiveThe students predict the weather for one week by using the data they collect dur-ing the first three weeks of work on the unit.
MaterialsChart for each student, or one for the entire class.
Procedures1. Make a weather chart to keep track of the weather.2. Draw a picture to tell the weather.
Remember: Weekends count too.Draw the weather conditions as shown below.
windy partly sunny cloudy, gray rain snow sunny frost
Unit 2 Weather 11
temperaturedewpoint
Week 1 wind directionair pressureclouds? sun?
Mon. Tue. Wed. Thurs. Fri. Sat. Sun.
Week 2
Week 3
Week 4 (student predictions go here)
Month
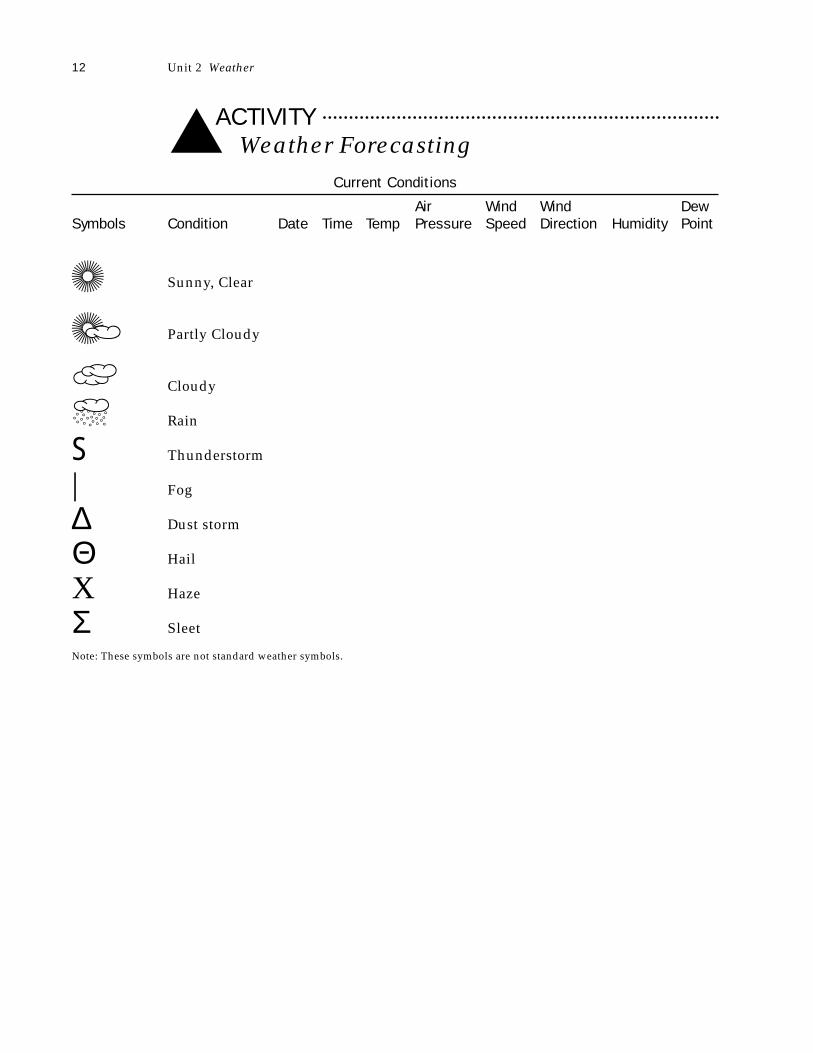
ACTIVITY▲ Weather ForecastingCurrent Conditions
Air Wind Wind DewSymbols Condition Date Time Temp Pressure Speed Direction Humidity Point
- Sunny, Clear
= Partly Cloudy
' Cloudy
/ Rain
S Thunderstorm
| Fog
∆ Dust storm
Θ Hail
X Haze
Σ Sleet
Note: These symbols are not standard weather symbols.
12 Unit 2 Weather
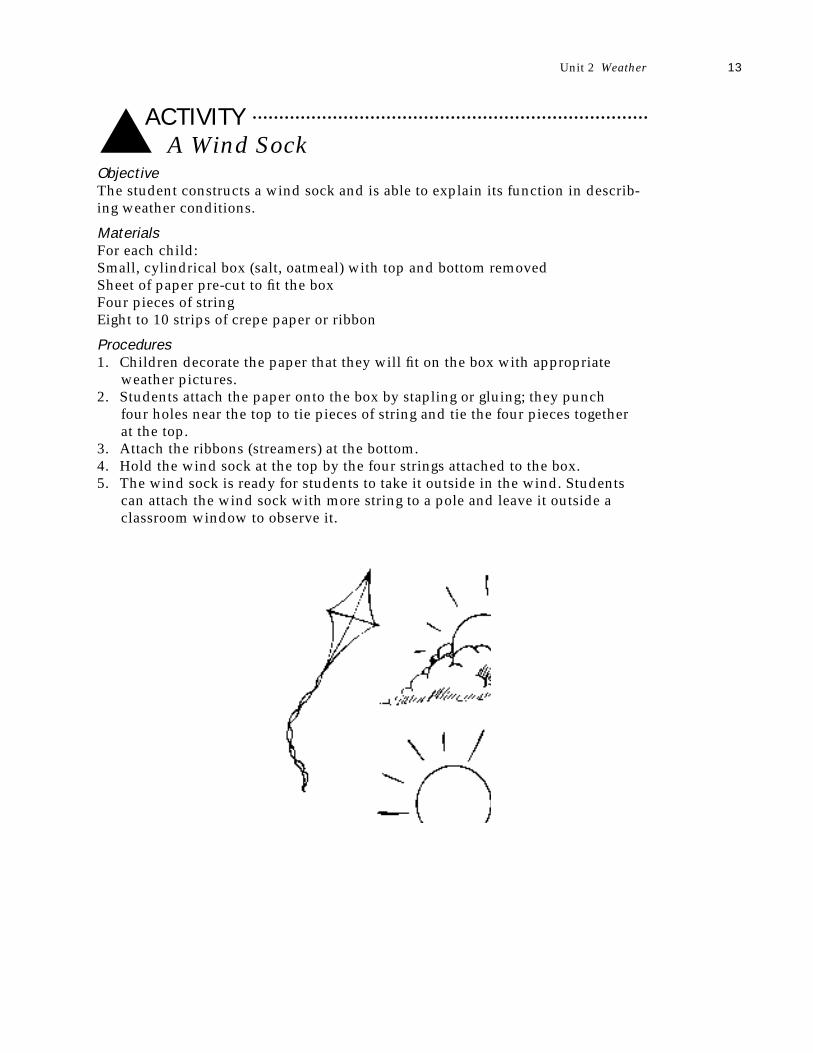
ACTIVITY▲ A Wind SockObjectiveThe student constructs a wind sock and is able to explain its function in describ-ing weather conditions.
MaterialsFor each child:Small, cylindrical box (salt, oatmeal) with top and bottom removedSheet of paper pre-cut to fit the boxFour pieces of stringEight to 10 strips of crepe paper or ribbon
Procedures1. Children decorate the paper that they will fit on the box with appropriate
weather pictures.2. Students attach the paper onto the box by stapling or gluing; they punch
four holes near the top to tie pieces of string and tie the four pieces together at the top.
3. Attach the ribbons (streamers) at the bottom.4. Hold the wind sock at the top by the four strings attached to the box.5. The wind sock is ready for students to take it outside in the wind. Students
can attach the wind sock with more string to a pole and leave it outside aclassroom window to observe it.
Unit 2 Weather 13
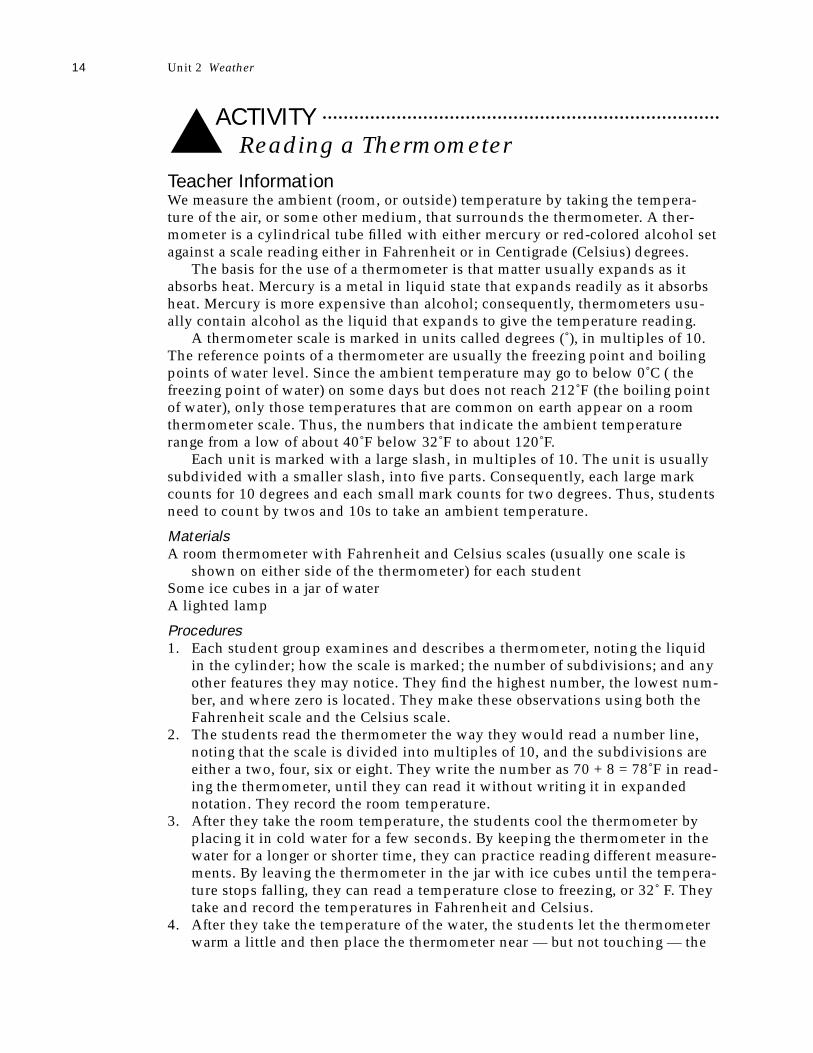
ACTIVITY▲ Reading a ThermometerTeacher InformationWe measure the ambient (room, or outside) temperature by taking the tempera-ture of the air, or some other medium, that surrounds the thermometer. A ther-mometer is a cylindrical tube filled with either mercury or red-colored alcohol setagainst a scale reading either in Fahrenheit or in Centigrade (Celsius) degrees.
The basis for the use of a thermometer is that matter usually expands as itabsorbs heat. Mercury is a metal in liquid state that expands readily as it absorbsheat. Mercury is more expensive than alcohol; consequently, thermometers usu-ally contain alcohol as the liquid that expands to give the temperature reading.
A thermometer scale is marked in units called degrees (˚), in multiples of 10.The reference points of a thermometer are usually the freezing point and boilingpoints of water level. Since the ambient temperature may go to below 0˚C ( thefreezing point of water) on some days but does not reach 212˚F (the boiling pointof water), only those temperatures that are common on earth appear on a roomthermometer scale. Thus, the numbers that indicate the ambient temperaturerange from a low of about 40˚F below 32˚F to about 120˚F.
Each unit is marked with a large slash, in multiples of 10. The unit is usuallysubdivided with a smaller slash, into five parts. Consequently, each large markcounts for 10 degrees and each small mark counts for two degrees. Thus, studentsneed to count by twos and 10s to take an ambient temperature.
MaterialsA room thermometer with Fahrenheit and Celsius scales (usually one scale is
shown on either side of the thermometer) for each studentSome ice cubes in a jar of waterA lighted lamp
Procedures1. Each student group examines and describes a thermometer, noting the liquid
in the cylinder; how the scale is marked; the number of subdivisions; and anyother features they may notice. They find the highest number, the lowest num-ber, and where zero is located. They make these observations using both theFahrenheit scale and the Celsius scale.
2. The students read the thermometer the way they would read a number line,noting that the scale is divided into multiples of 10, and the subdivisions areeither a two, four, six or eight. They write the number as 70 + 8 = 78˚F in read-ing the thermometer, until they can read it without writing it in expandednotation. They record the room temperature.
3. After they take the room temperature, the students cool the thermometer byplacing it in cold water for a few seconds. By keeping the thermometer in thewater for a longer or shorter time, they can practice reading different measure-ments. By leaving the thermometer in the jar with ice cubes until the tempera-ture stops falling, they can read a temperature close to freezing, or 32˚ F. Theytake and record the temperatures in Fahrenheit and Celsius.
4. After they take the temperature of the water, the students let the thermometerwarm a little and then place the thermometer near — but not touching — the
14 Unit 2 Weather
lighted lamp. They take and record the temperature. They take different mea-surements by varying the amount of time they leave the thermometer close tothe lamp.
5. After taking several measurements of the temperature of the cold water andthe air near the lighted lamp, the students order the temperatures from lowestto highest, find a middle temperature, state the range of temperatures anddescribe them in any other way they choose, for both the Fahrenheit andCentigrade scales.
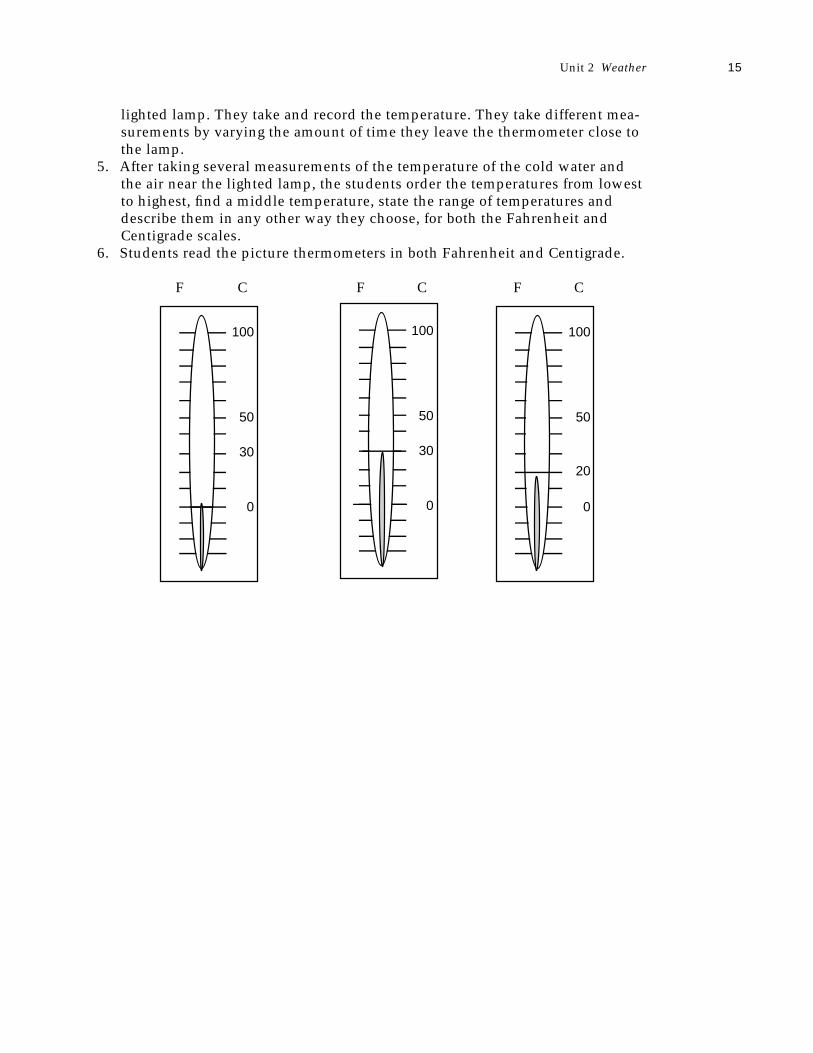
6. Students read the picture thermometers in both Fahrenheit and Centigrade.
F C F C F C
??W2@@6X? ??7@??@1? ??@@??@@? ??@@??@@? ??@@??@@? ??@@??@@? ??@@??@@? ??3@??@5? ??V4@@0Y? ?
????
??W2@@6X? ??7@??@1? ??@@??@@? ??@@??@@? ??@@??@@? ??@@??@@? ??@@??@@? ??3@??@5? ??V4@@0Y? ?
????
?W2@@6X?hf?7@??@1?hf?@@??@@?hf?@@??@@?hf?@@??@@?hf?@@??@@?hf?@@??@@?hf?3@??@5?hf?V4@@0Y?hf
??W2@eW2@@6KO2@@6X ??*@@e7@e@@@@e@1 ??N@@e@@e@@@@e@@ ?@@e@@e@@@@e@@ ?@@e@@e@@@@e@@ ?@@e@@e@@@@e@@ ?
?J@@L?3@e@@@@e@5 ??@@@@?V4@@0MI4@@0Y ?
????
??W2@eW2@@6KO2@@6X ??*@@e7@e@@@@e@1 ??N@@e@@e@@@@e@@ ?@@e@@e@@@@e@@ ?@@e@@e@@@@e@@ ?@@e@@e@@@@e@@ ?
?J@@L?3@e@@@@e@5 ??@@@@?V4@@0MI4@@0Y ?
????
?W2@eW2@@6KO2@@6Xhg?*@@e7@e@@@@e@1hg?N@@e@@e@@@@e@@hg@@e@@e@@@@e@@hg@@e@@e@@@@e@@hg@@e@@e@@@@e@@hg
?J@@L?3@e@@@@e@5hg?@@@@?V4@@0MI4@@0Yhg
?@@@@@6T2@@6X ?@@e?B@@e@1 ?@@f@@e@@ ?@@@@6X@@e@@ ?
@@@@e@@ ?@@@@e@@ ?
'6K?@@@@e@5 ?V4@@0MI4@@0Y ?
????
?@@@@@6T2@@6X ?@@e?B@@e@1 ?@@f@@e@@ ?@@@@6X@@e@@ ?
@@@@e@@ ?@@@@e@@ ?
'6K?@@@@e@5 ?V4@@0MI4@@0Y ?
????
@@@@@6T2@@6Xhf@@e?B@@e@1hf@@f@@e@@hf@@@@6X@@e@@hf
@@@@e@@hf@@@@e@@hf
'6K?@@@@e@5hfV4@@0MI4@@0Yhf
?W2@@6KO2@@6X ?&0M?@@@@e@1 ?
@@@@e@@ ?@@@?@@e@@ ?@@@@e@@ ?@@@@e@@ ?
'6K?@@@@e@5 ?V4@@0MI4@@0Y ?
????
?W2@@6KO2@@6X ?&0M?@@@@e@1 ?
@@@@e@@ ?@@@?@@e@@ ?@@@@e@@ ?@@@@e@@ ?
'6K?@@@@e@5 ?V4@@0MI4@@0Y ?
????
W2@@6KO2@@6Xhe&0M?@@@@e@1he?J@@@@e@@heW&(Y@@e@@he
?W&(Y?@@e@@heW&(Ye@@e@@he7@YO2@@@e@5he@@@@0MI4@@0Yhe
Unit 2 Weather 15
100
50
30
0
100
50
30
0
100
50
20
0
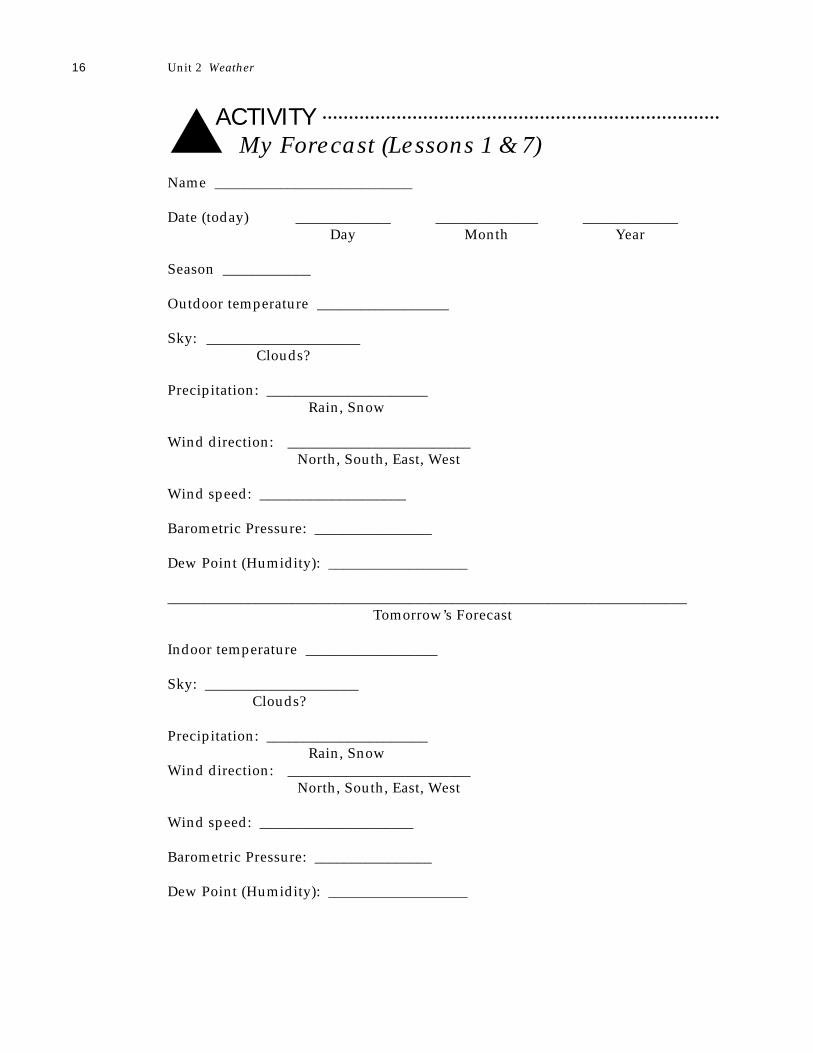
ACTIVITY▲ My Forecast (Lessons 1 & 7)Name ___________________________
Date (today) _____________ ______________ _____________Day Month Year
Season ____________
Outdoor temperature __________________
Sky: _____________________Clouds?
Precipitation: ______________________Rain, Snow
Wind direction: _________________________North, South, East, West
Wind speed: ____________________
Barometric Pressure: ________________
Dew Point (Humidity): ___________________
_______________________________________________________________________Tomorrow’s Forecast
Indoor temperature __________________
Sky: _____________________Clouds?
Precipitation: ______________________Rain, Snow
Wind direction: _________________________North, South, East, West
Wind speed: _____________________
Barometric Pressure: ________________
Dew Point (Humidity): ___________________
16 Unit 2 Weather
BIG IDEAS The sun heating the earth and its atmosphere causes the weather;we feel weather as wind, heat or cold, and humidity in the form ofrain, ice and snow.
Whole Group WorkMaterialsLarge chart tablet for new words provided by classLarge world globePlastic jar with colored waterReference books on weatherThermometerCurrent copy of a daily newspaperWind socks
Encountering the IdeaThe teacher asks students to gather as much data as they can with the instru-ments they have learned to use (wind socks; thermometers) to describe the cur-rent weather conditions. Students can suggest using the thermometer to measurethe temperature and using the wind sock to measure the direction of the wind.What are some other weather conditions that can occur? Tell the students theywill explore making weather conditions right in the classroom. After they explorethese ideas, they are to hypothesize about what causes different weather condi-tions. They will also make suggestions on how to gather data to be more accuratein their descriptions of weather.
Exploring the IdeaIn this lesson, students will discover how nature produces wind and precipita-tion. Give the first activity involving air currents in two parts. By using talcumpowder, the students can see the powder moving in an air current. In the secondpart, heating the air around a light bulb produces air currents that move a paperswirl above the bulb.
At the Science Center, students 1. complete Activity — Air Currents2. complete Activity — Rain in the Classroom3. complete Activity — Water Tornado, as shown below.Water TornadoFill a plastic jar halfway with lightly colored water. Do not cover it with a lid. Astudent vigorously stirs the water in the plastic jar and looks down through thetop of the jar to see a water tornado.
DiscussionIn making a water tornado, what happens when you move your hands back andforth in the water? Slowly? Rapidly? Can you push the water away from you?
Unit 2 Weather 17
What Makes Weather?L E S S O N
2
What caused the tornado in the bottle? (You moved the water rapidly with yourhand.) What do you think causes a wind tornado? (The sun heats air that beginsto move rapidly, causing air currents to swirl.)
Getting the IdeaUsing a world globe, the teacher demonstrates and discusses the following ideas. 1. The earth has a deep layer of air that surrounds it. This layer of air we call the
atmosphere. Weather develops usually from the sun heating the land on earthand the earth’s atmosphere while as the earth rotates on its axis. As the earthrotates, it rotates in a layer of air and causes the air to move. These move-ments of air we call air currents. The currents make wind. In the meantime,however, the sun is heating the land and the oceans on the earth as well. Asthe sun heats the land, the land reflects some of the heat it gets from the suninto the atmosphere, heating it more. This process causes more air currents.
2. As the sun heats the water in the oceans, it causes evaporation of the water.The evaporation then forms clouds. Clouds are a form of water vapor that hascondensed. The water in the clouds turns to rain, snow, sleet, frost and otherforms of water and water vapor, depending on the temperature of the air. Wewill see this happening when we make rain in the classroom.
3. Usually we feel weather conditions as movement of air, or wind, how dry thewind is, or its humidity, and its temperature. We can measure each of theseconditions. That’s what makes accurate weather prediction possible.
4. We can study the use of the wind sock. What is its purpose? The wind socktells us the direction the wind is blowing. But, the wind sock does not tell ushow fast the wind is blowing. We will learn how to measure wind velocity inanother lesson.
5. What is the purpose of the thermometer? Does the temperature have anything todo with the movement of the wind sock? (No, only the direction and velocityof the wind affect the wind sock.) How do we use the two instrumentstogether?
Organizing the IdeaAt the Writing Center, the students write and illustrate how the sun’s heat causesweather. The description includes information about the atmosphere (air aroundthe earth) and about air currents.
At the Mathematics Center, the students 1. examine the data collected for the weather forecasting activity2. again, compare the high and low temperatures and note the differences by
subtracting the two temperatures using both Fahrenheit and Celsius scales 3. find the temperature on both scales by reading them off the thermometer —
not by converting — but simply reading the two scales.
Applying the IdeaIn their school library, students research books or almanacs or the daily newspaperfor the number of days of sunshine in their city, the inches of rainfall and the windvelocity; students compare these data with data from other cities in the nation.The students can also research how we measure a day of sunshine, as well as howwe measure rainfall and wind velocity. They report these findings to the class.
18 Unit 2 Weather
Sample reports:
For City _______, the weather conditions were ____________ on (date). The high
temperature was _______, while the low temperature was ________. It’s rainfall (or
snowfall, etc.) was ____________. The wind was blowing from ______ at
_______miles per hour. The relative humidity was ______________.
Closure and Assessment
Oral interview1. How important is the sun in affecting our weather? What does it do to affect
the weather?2. Wind is moving air. What causes air to move fast? 3. Show your teacher your up-to-date weather forecasting chart. Interpret your
chart for your teacher or your partner.
Performance Assessment1. Demonstrate what causes rain.2. Demonstrate one of the causes of wind currents.
List of Activities for this Lesson▲ Air Currents
▲ Rain in the Classroom
Unit 2 Weather 19
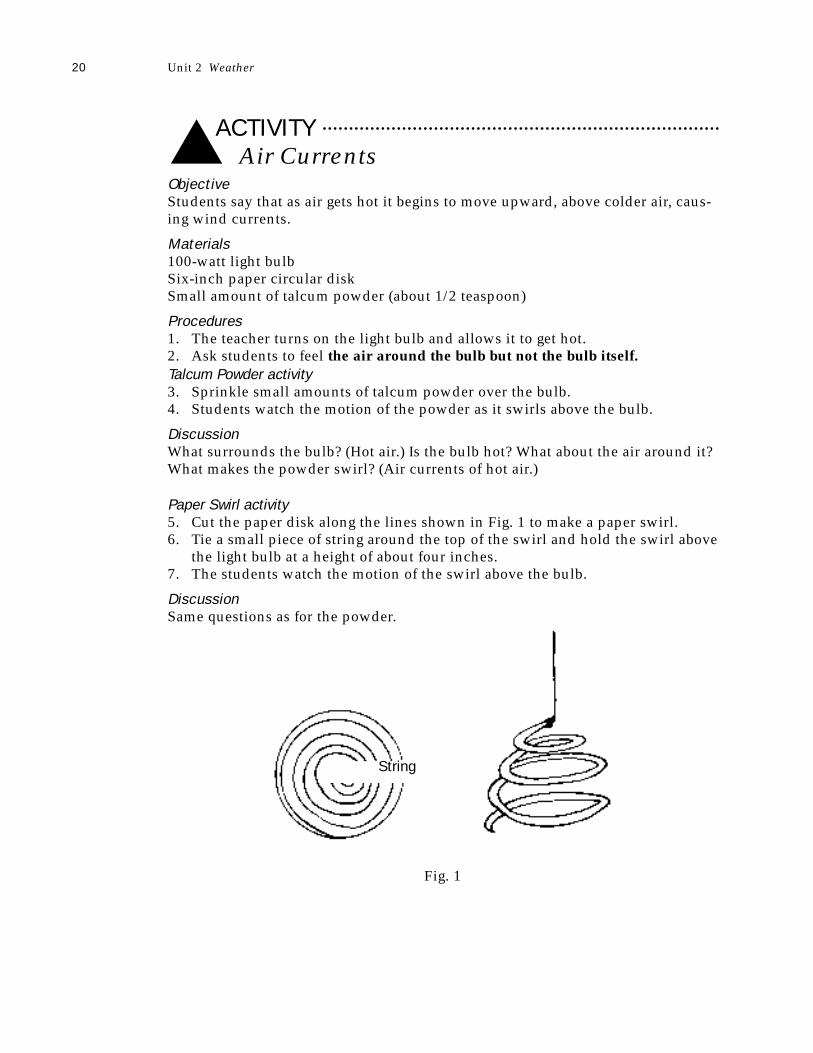
ACTIVITY▲ Air CurrentsObjectiveStudents say that as air gets hot it begins to move upward, above colder air, caus-ing wind currents.
Materials100-watt light bulbSix-inch paper circular diskSmall amount of talcum powder (about 1/2 teaspoon)
Procedures1. The teacher turns on the light bulb and allows it to get hot. 2. Ask students to feel the air around the bulb but not the bulb itself.Talcum Powder activity3. Sprinkle small amounts of talcum powder over the bulb.4. Students watch the motion of the powder as it swirls above the bulb.
DiscussionWhat surrounds the bulb? (Hot air.) Is the bulb hot? What about the air around it?What makes the powder swirl? (Air currents of hot air.)
Paper Swirl activity5. Cut the paper disk along the lines shown in Fig. 1 to make a paper swirl.6. Tie a small piece of string around the top of the swirl and hold the swirl above
the light bulb at a height of about four inches. 7. The students watch the motion of the swirl above the bulb.
DiscussionSame questions as for the powder.
Fig. 1
20 Unit 2 Weather
String
ACTIVITY▲ Rain in the ClassroomNote: This is a teacher demonstration to avoid having the students work with hotwater.
MaterialsSkillet or hot plate; pie pan; sponge; water; clock; ice cubes; clear glass large-
mouth gallon jar
ProceduresPlace a pot of water on a skillet or hot plate to boil. Hold a pie pan that has a
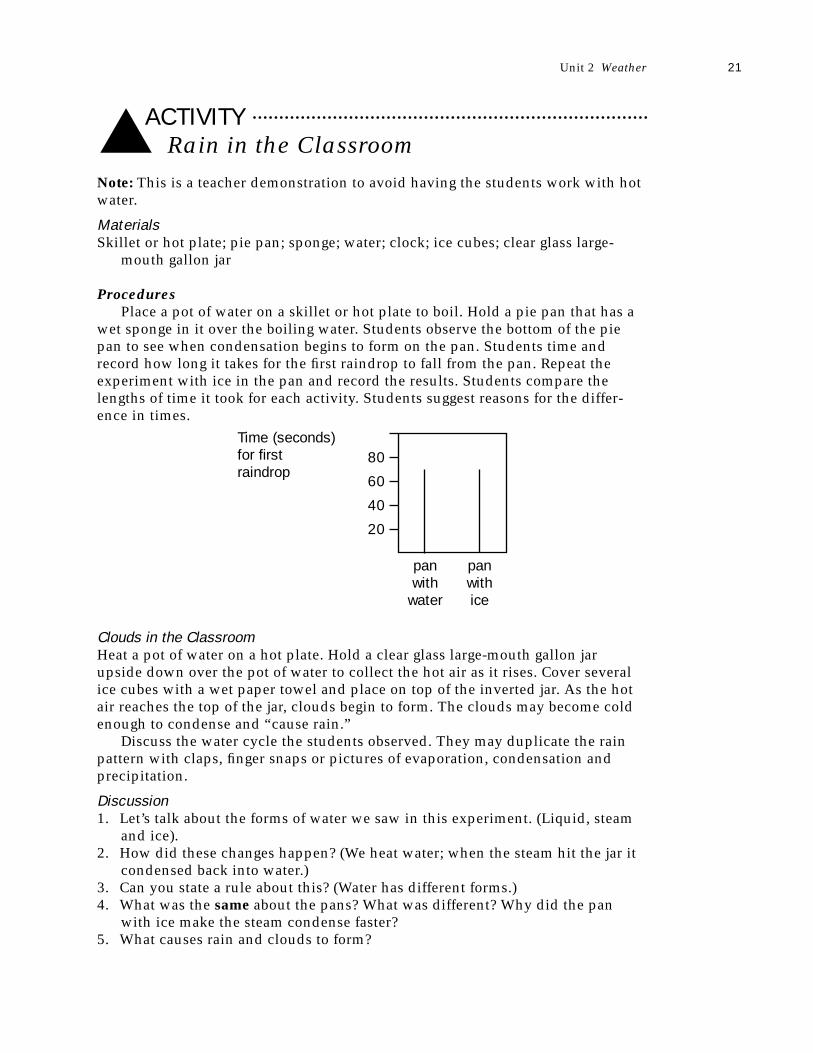
wet sponge in it over the boiling water. Students observe the bottom of the piepan to see when condensation begins to form on the pan. Students time andrecord how long it takes for the first raindrop to fall from the pan. Repeat theexperiment with ice in the pan and record the results. Students compare thelengths of time it took for each activity. Students suggest reasons for the differ-ence in times.
Clouds in the Classroom Heat a pot of water on a hot plate. Hold a clear glass large-mouth gallon jarupside down over the pot of water to collect the hot air as it rises. Cover severalice cubes with a wet paper towel and place on top of the inverted jar. As the hotair reaches the top of the jar, clouds begin to form. The clouds may become coldenough to condense and “cause rain.”
Discuss the water cycle the students observed. They may duplicate the rainpattern with claps, finger snaps or pictures of evaporation, condensation and precipitation.
Discussion1. Let’s talk about the forms of water we saw in this experiment. (Liquid, steam
and ice).2. How did these changes happen? (We heat water; when the steam hit the jar it
condensed back into water.)3. Can you state a rule about this? (Water has different forms.)4. What was the same about the pans? What was different? Why did the pan
with ice make the steam condense faster?5. What causes rain and clouds to form?
Unit 2 Weather 21
80
60
40
20
panwith
water
Time (seconds)for firstraindrop
panwithice
BIG IDEAS The seasons develop from the angle of tilt of the earth’s axis as theearth revolves in its path around the sun.
Whole Group WorkMaterialsCurrent year-long calendar; world globe; flashlight (pen light preferred); ther-
mometers; wind socks; copies of questions from Activity — Mathematics ofthe Seasons
Word tags: season, summer, winter, spring, fall, tropics, hemisphere, northern,southern, equinox
Encountering the IdeaBegin the lesson by asking the students to review what the main cause of weatheris (Lesson 2). Ask them to keep this in mind as they hypothesize as to the causeof the seasons. The students name the seasons and describe what they knowabout them. What is special about each season? Students are to hypothesize aboutthe following.
Why does it get cold in the winter and hot in the summer? What happens dur-ing the spring and the fall? As the children express their ideas, write some of themore plausible ones on a chart tablet, for students to use later in writing theirexplanations of the seasons in the Writing Center. Tell them that you will conducttwo demonstrations using a flashlight to simulate the sun as a source of light andheat and using the globe as the earth. After the two demonstrations, studentsagain hypothesize as to what causes the seasons.
Exploring the IdeaAt the Science Center, students
1. complete Activity — Temperature and Distance. It is important for students togo through this activity first so they can see the earth’s tilt in relation to thedistance from the sun of a specific area on earth.
2. complete the following activity.Using the flashlight to simulate the sun as a source of light and heat and using
the globe as the earth, ask a student to hold the globe at an angle, as shown in thepicture below. (Place a styrofoam ball at the end of a stick to hold it at an angle,as shown.) The student rotates the earth (globe) while keeping it tilted in theapproximate angle shown in the illustration below; at the same time the earthrevolves around the “sun.” The flashlight’s rays follow the globe (earth) as itrotates in an elliptical path.
The winter months in the Northern Hemisphere (usually November, Decem-ber, January and February) do not correspond to the winter months in the
22 Unit 2 Weather
The Four SeasonsL E S S O N
3
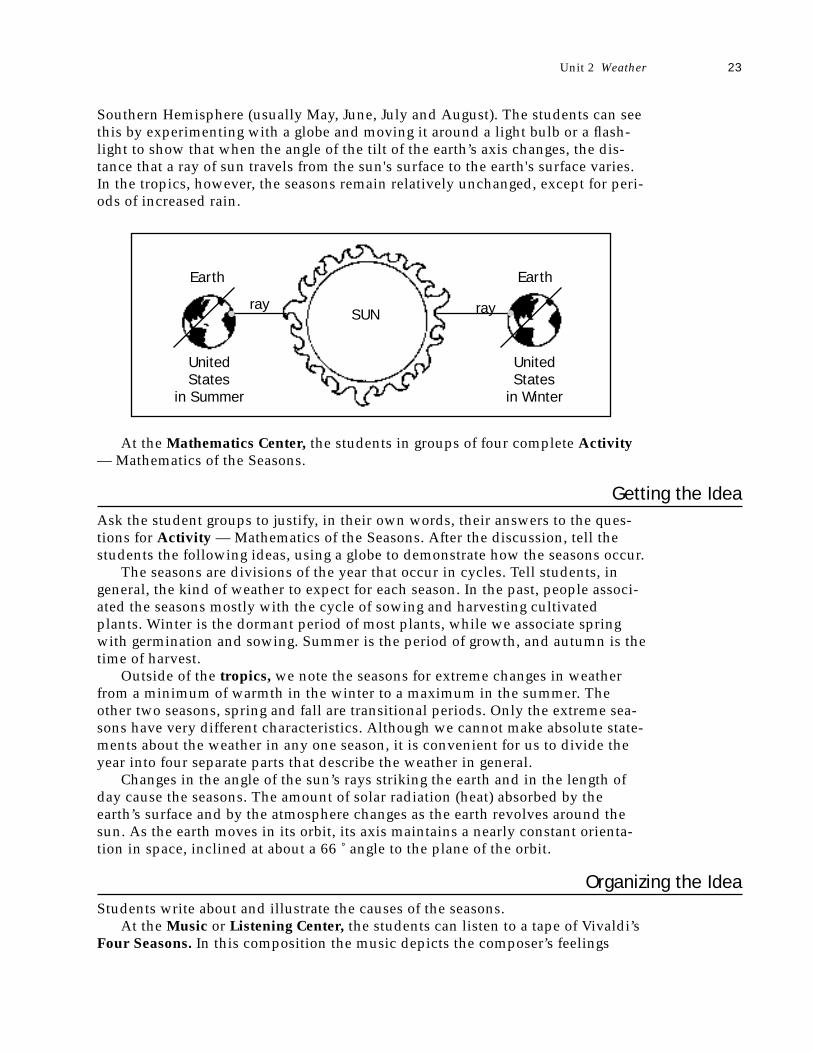
Southern Hemisphere (usually May, June, July and August). The students can seethis by experimenting with a globe and moving it around a light bulb or a flash-light to show that when the angle of the tilt of the earth’s axis changes, the dis-tance that a ray of sun travels from the sun's surface to the earth's surface varies.In the tropics, however, the seasons remain relatively unchanged, except for peri-ods of increased rain.
At the Mathematics Center, the students in groups of four complete Activity— Mathematics of the Seasons.
Getting the IdeaAsk the student groups to justify, in their own words, their answers to the ques-tions for Activity — Mathematics of the Seasons. After the discussion, tell thestudents the following ideas, using a globe to demonstrate how the seasons occur.
The seasons are divisions of the year that occur in cycles. Tell students, ingeneral, the kind of weather to expect for each season. In the past, people associ-ated the seasons mostly with the cycle of sowing and harvesting cultivatedplants. Winter is the dormant period of most plants, while we associate springwith germination and sowing. Summer is the period of growth, and autumn is thetime of harvest.
Outside of the tropics, we note the seasons for extreme changes in weatherfrom a minimum of warmth in the winter to a maximum in the summer. Theother two seasons, spring and fall are transitional periods. Only the extreme sea-sons have very different characteristics. Although we cannot make absolute state-ments about the weather in any one season, it is convenient for us to divide theyear into four separate parts that describe the weather in general.
Changes in the angle of the sun’s rays striking the earth and in the length ofday cause the seasons. The amount of solar radiation (heat) absorbed by theearth’s surface and by the atmosphere changes as the earth revolves around thesun. As the earth moves in its orbit, its axis maintains a nearly constant orienta-tion in space, inclined at about a 66 ˚ angle to the plane of the orbit.
Organizing the IdeaStudents write about and illustrate the causes of the seasons.
At the Music or Listening Center, the students can listen to a tape of Vivaldi’sFour Seasons. In this composition the music depicts the composer’s feelings
Unit 2 Weather 23
ray
Earth Earth
SUN
UnitedStates
in Summer
UnitedStates
in Winter
ray
about winter, spring, summer and autumn. The students try to identify thoseparts of the music that remind them of a winter storm or a summer day.
Applying the Idea
Problem Solving1. Can you show on the world globe where the area of the eternal night, or the
eternal day, could be? (At the poles.) What does eternal mean? What causes aday to be that long? Students demonstrate this with the globe and flashlight.
2. Can you show on the world globe where there might be eternal summer onearth? (In the tropics.) Eternal winter? The students demonstrate this.
Closure and Assessment1. The students illustrate the tilting of the earth’s axis and its relationship to the
seasons along with a drawing of a seasonal activity.2. Students write a poem about their favorite season.3. Students can justify their answers to questions on Activity — Mathematics of
the Seasons.4. Students write a rule that relates distance from a heat source (the sun or a
light bulb) to the temperature of an object.
List of Activities for this Lesson▲ Mathematics of the Seasons
▲ Temperature and Distance
24 Unit 2 Weather
ACTIVITY▲ Mathematics of the SeasonsObjectiveUsing the topic of the seasons, the students use whole number operations to solveproblems.
MaterialsCopy of a year-long calendar for the current yearList of questionsWorld globeFlashlight, if necessary
ProceduresGroups of four students work on the following calendar activities.Make a chart with a list of facts.
On the chart make a heading for each of the four (4) seasons. Under eachseason list the months of the year that go with that season for the NorthernHemisphere.On the chart make a fact list of the seasons.
1. There are _____ days in the Winter.There are _____ days in the Spring.There are _____ days in the Summer.There are _____ days in the Fall.
2. The shortest day of the year is _______________ in the Northern Hemisphere.It is _______ hours long.The night is _________ hours long.
3. The longest day of the year is ________________ in the Northern Hemisphere.It is _____________hours long.The night is _________ hours long.
4. The word “equinox” means ___________________.5. The two days of the equinox are ________________ and _________________.6. There are _________ hours of ___________ and __________ hours of __________
on the equinox.7. On the globe find Argentina. What month is it in Argentina when it is
December in the United States? (Same month.) In Argentina, in what seasondoes Christmas occur? Explain.
Do the same for the seasons in the Southern Hemisphere.
Unit 2 Weather 25
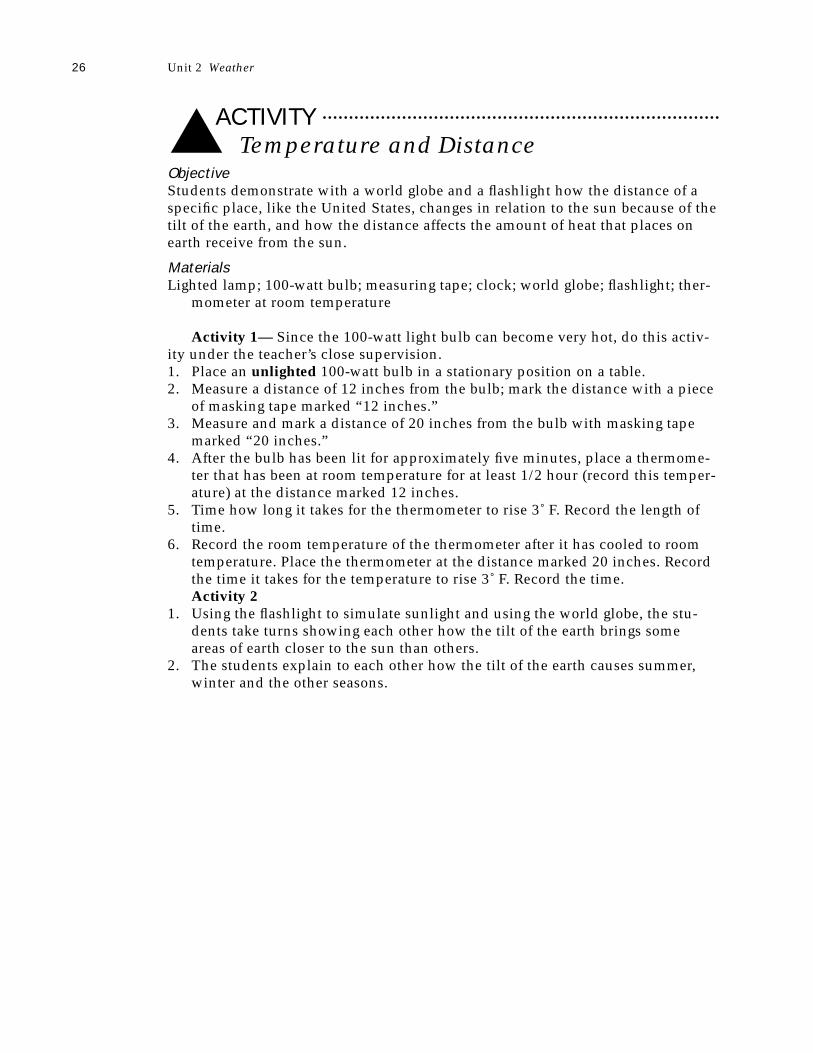
ACTIVITY▲ Temperature and DistanceObjectiveStudents demonstrate with a world globe and a flashlight how the distance of aspecific place, like the United States, changes in relation to the sun because of thetilt of the earth, and how the distance affects the amount of heat that places onearth receive from the sun.
MaterialsLighted lamp; 100-watt bulb; measuring tape; clock; world globe; flashlight; ther-
mometer at room temperature
Activity 1— Since the 100-watt light bulb can become very hot, do this activ-ity under the teacher’s close supervision.1. Place an unlighted 100-watt bulb in a stationary position on a table.2. Measure a distance of 12 inches from the bulb; mark the distance with a piece
of masking tape marked “12 inches.”3. Measure and mark a distance of 20 inches from the bulb with masking tape
marked “20 inches.”4. After the bulb has been lit for approximately five minutes, place a thermome-
ter that has been at room temperature for at least 1/2 hour (record this temper-ature) at the distance marked 12 inches.
5. Time how long it takes for the thermometer to rise 3˚ F. Record the length oftime.
6. Record the room temperature of the thermometer after it has cooled to roomtemperature. Place the thermometer at the distance marked 20 inches. Recordthe time it takes for the temperature to rise 3˚ F. Record the time.Activity 2
1. Using the flashlight to simulate sunlight and using the world globe, the stu-dents take turns showing each other how the tilt of the earth brings someareas of earth closer to the sun than others.
2. The students explain to each other how the tilt of the earth causes summer,winter and the other seasons.
26 Unit 2 Weather
BIG IDEAS Wind, tornadoes, cyclones and dust storms are all moving air,which exerts pressure as it moves.
Whole Group WorkMaterialsBook: Iva Dunnit and the Big Wind by C. PurdyBlow-dryer with two temperature settings (slow and fast) and a no-heat settingWind socksThermometersFor each student group: drinking straws, cotton balls, pieces of paper, pieces
of tissue
Encountering the IdeaThe teacher presents the book Iva Dunnit and the Big Wind to the students andasks them to predict the plot of the story. The teacher reads the story and thenasks: Is this story meant as a tall tale? Why? Do you think the wind was strong?What made you think this?
The teacher tells the students they will discover how wind causes weatherand the kind of weather conditions it produces. The following activities will helpthem learn about the strength of the wind.
Exploring the IdeaAt the Science Center, the students perform the following activities.Activity 1: Using Wind Socks
Using the wind socks made in Lesson One, the students again go outside todescribe the current wind conditions. They can describe the direction from whichthe wind is blowing and whether they believe it is a strong wind or a light breeze.Ask students to think of a way to determine the direction of the wind with moreaccuracy than by merely identifying one of the four directions of the compass.Activity 2: Air Exerts Pressure
Children explore one of the important characteristics of air — it exerts pres-sure. As it moves from one place to another, it pushes against itself and againstthings. That is how we can see air. In this activity, children can see how air pres-sure is created by blowing or sucking through a straw. The air pressure affectsobjects.
MaterialsFor each child: A drinking straw, a cotton ball, a piece of paper, a piece of tissue
ProceduresStudents working in small groups1. blow through the straw against their hand2. blow against the cotton ball to make it move
Unit 2 Weather 27
Wind: Air in MotionL E S S O N
4
3. pick up a sheet of paper using only the straw4. pick up a piece of tissue using only the straw.
Discussion1. What did you feel against your hand when you blew on the straw ? (Air.)
How do you know that it is air? Can you see air? Can you feel air? Why canyou feel it?
2. Why did the cotton ball move? (Air pushed it.) 3. Can you make the piece of paper stay on the end of the straw? What is making
it stay there? (Air is pulling on it.)Students name at least two other situations that require the use of air (cooling
food, drying clothes fast).Activity 3Students complete Activity — Making a Windometer and Activity — Make YourOwn Barometer.Activity 4Students explore air pressure. Do Activity — Colliding Balls. Do Activity — AirPushes in All Directions.
At the Mathematics Center, the students complete Activity —DestructiveWind.
Getting the Idea and Organizing the IdeaAir that is in rapid motion causes many changes in the weather. We can experi-ence wind as a pleasant cooling or warming breeze, but when its velocity is greatwe experience it as a tornado (a whirling wind seen as a funnel-shaped cloudtraveling in a narrow area over land) or a cyclone (a strong wind traveling in awide circle around a center and often bringing much rain). In each of these nat-ural phenomena, air pressure is an important component of the storms, for exam-ple, in the calm in the eye of a storm.1. Students discuss the wind conditions they have measured. The students use
their windometer to take some more measurements of the current wind condi-tions. They talk about the velocity of the wind and its direction.
2. Students discuss ways to determine the wind’s direction with more accuracythan only one of the compass directions. If the students don’t suggest it, theteacher suggests the idea of a weather vane, and how we could construct one.
3. Students also discuss the air pressure experiment. The teacher asks the stu-dents to think of ways that we could use air pressure.
4. When you have been running and get hot, what do you do? (Drink water, etc.)You want to get some AIR to cool you off by fanning yourself. Why? If you have wet hair and want to dry it quickly, what do you do? Blow-dry it.
Does the air have to be hot for your hair to dry? No, but it’s faster. Put a wet wash-cloth on a student’s arm. With the blow dryer on low, and no heat, blow on thewashcloth. Now, set the dryer on high, no heat, and blow on the washcloth. Thestudent describes the difference. (If there is no blow-dryer, fan a cardboard slowlyand then quickly.)
The students make a rule about air and cooling, for example, the harder thewind blows, the colder the temperature.5. After using the windometer, the students discuss the wind velocity as shown
by the data they collected and discuss whether the Beaufort scale describesthe current conditions accurately. They write in their journals about the cur-
28 Unit 2 Weather
rent weather conditions including their experiences with air pressure, thewind sock, the weather vane and the windometer.
6. At the Writing Center, the students write about air pressure, how we measureit and how we measure the velocity of the wind.
7. What information does a barometer give us to help us forecast the weather? (Abarometer measures the pressure that air is exerting at a particular location ata specific time. It also tells us if the pressure is increasing or decreasing.)
Applying the IdeaStudents complete Activity — Go Fly A Kite!
Students begin to summarize the collected data, as time permits. See Activity— Data and Line Graphs, Lesson 7.
Problem SolvingCan you make a piece of tissue stay on the end of a straw? Is it harder to make thepiece of tissue stay on the end of the straw than the piece of paper, or is it easier?What about the cotton ball? Is it easier or harder to keep it on the end of the strawthan the piece of tissue? How many cotton balls can you make to stay on the endof the straw?
Closure and Assessment1. Show what causes tornadoes.2. What is a cyclone?3. How does air pressure affect the weather?4. What is wind?5. What did we do today to show that air exerts pressure?6. How do we measure the velocity of the wind?7. What is a weather vane? Is it the same as a wind sock? How are they different?8. What makes a kite fly?9. What did you record on your weather chart for today? (Temperature; wind
direction and velocity; air pressure; cloud/clear conditions; precipitation.)
List of Activities for this Lesson▲ Making a Windometer
▲ Make Your Own Barometer
▲ Colliding Balls
▲ Air Pushes in All Directions
▲ Destructive Wind
▲ Go Fly A Kite!
Unit 2 Weather 29
ACTIVITY▲ Making a WindometerA Windometer Measures Wind VelocityA windometer is an instrument that measures wind velocity. Students can makein the classroom a simple one that will provide fairly accurate information.
MaterialsFor each group of students:1. Cut a posterboard in the shape of a protractor with a handle as shown on the
drawing. Mark the protractor shape in degrees, in multiples of five.2. Attach a ping pong ball as shown on the figure.3. Use a piece of string about 33 cm; the string should measure 30 cm from the
attachment on the windometer to the top of the ball.4. Copy on the handle the scale associating windspeed in miles per hour (mph)
and angle in degrees. See below.
Procedures1. Holding the windometer by the handle, point it into the wind.2. Hold the windometer so that the ball is free to move along the scale.3. Read and record the angle the string marks on the protractor.4. Read the mph (miles per hour) associated with that angle.
Angle Miles per hour90 085 5.880 8.275 10.170 11.865 13.460 14.955 16.450 18.045 19.640 21.435 23.430 25.825 28.720 32.5
The Beaufort Scale associates a number, the Beaufort number, with a windspeed in mph that then translates into a description of how that wind velocityaffects climate conditions outdoors.
30 Unit 2 Weather
Beaufort # Observation Description 10 Smoke rises vertically Calm zero to one mph11 Smoke drifts slowly Light breeze two to three mph12 Leaves rustle Slight breeze four to seven mph13 Twigs move, flag extends Gentle breeze eight to 12 mph14 Branches move, dust and Moderate breeze 13-18 mph
papers rise15 Small trees sway Fresh breeze 19-24 mph16 Large branches sway, Strong breeze 25-31 mph
wires whistle17 Trees in motion, walking Moderate gale 32-38 mph
difficult18 Twigs break off trees Fresh gale 39-40 mph19 Branches break, roof Strong gale 41-54 mph
damaged10 Trees snap, damage Whole gale 55-63 mph
evident11 Widespread damage Storm 64-72 mph12 Extreme damage Hurricane 73-82 mph
Unit 2 Weather 31
ACTIVITY▲ Make Your Own BarometerObjectiveStudents experiment with air pressure by constructing a simple barometer; stu-dents relate barometric readings with weather conditions.
MaterialsReference (encyclopedia) on air pressureNarrow-mouth bottle filled with waterClean clear glass or plastic bowlTwo small pieces (same size) wood or plastic to balance the bottleTape to mark water levels
Procedures1. Fill the bottle with water. Hold the bowl over the bottle and tilt the bottle and
bowl together quickly.2. Tilt the bottle to let in air until the bottle is about 1/3 full of air.3. Rest the bottle on the two pieces of plastic or wood.4. Mark the water level both on the bowl and on the bottle. Take readings of the
water level at least twice a day and record weather conditions.
Day 1 1 2 2 3 3 4 4 5 5Water level (Bottle) __cm __cm __cm __cm __cm __cm __cm __cm __cm __cmWeather Today(sunny or cloudy?) ___________ ___________ ___________ ___________ ___________Water level (Bowl) __cm __cm __cm __cm __cm __cm __cm __cm __cm __cmWeather Today(sunny or cloudy?) ___________ ___________ ___________ ___________ ___________
5. Make two copies of the ruler below on paper. Glue one ruler on the outside ofthe bottle and the other one on the outside of the bowl. Be sure to put the zeromark on the first mark you put on the bowl and on the bottle.
32 Unit 2 Weather
0
cm
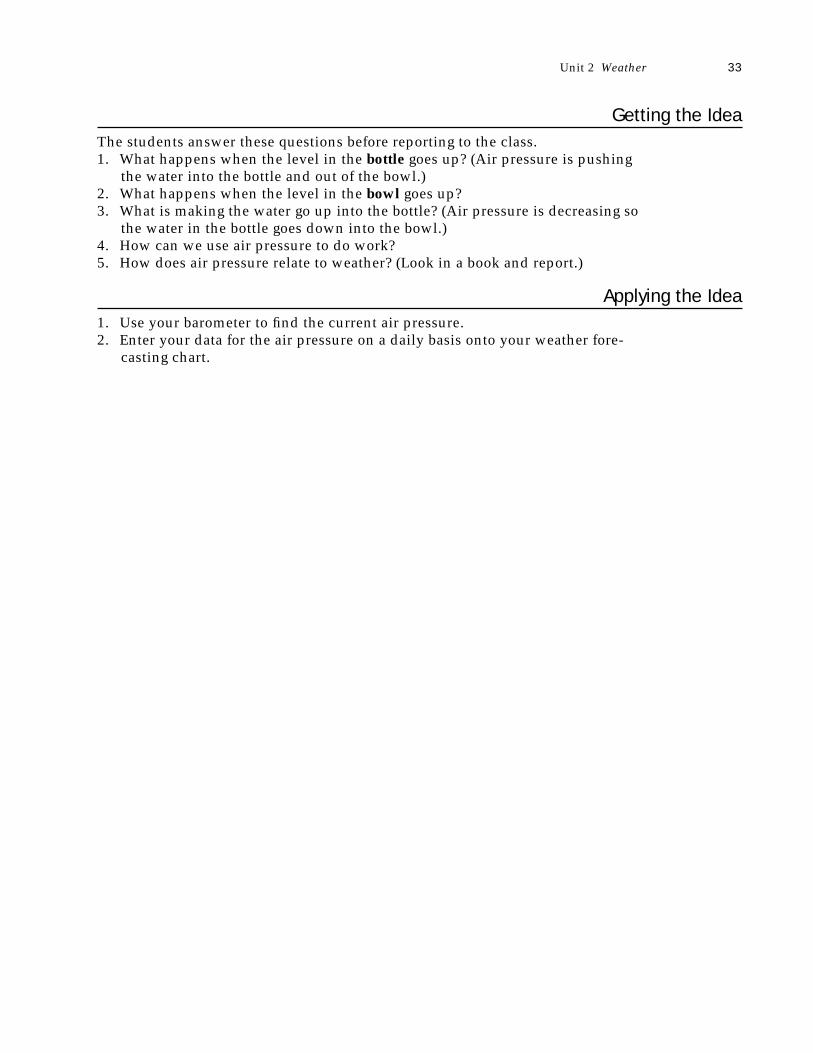
Getting the Idea The students answer these questions before reporting to the class.1. What happens when the level in the bottle goes up? (Air pressure is pushing
the water into the bottle and out of the bowl.)2. What happens when the level in the bowl goes up?3. What is making the water go up into the bottle? (Air pressure is decreasing so
the water in the bottle goes down into the bowl.)4. How can we use air pressure to do work?5. How does air pressure relate to weather? (Look in a book and report.)
Applying the Idea1. Use your barometer to find the current air pressure. 2. Enter your data for the air pressure on a daily basis onto your weather fore-
casting chart.
Unit 2 Weather 33
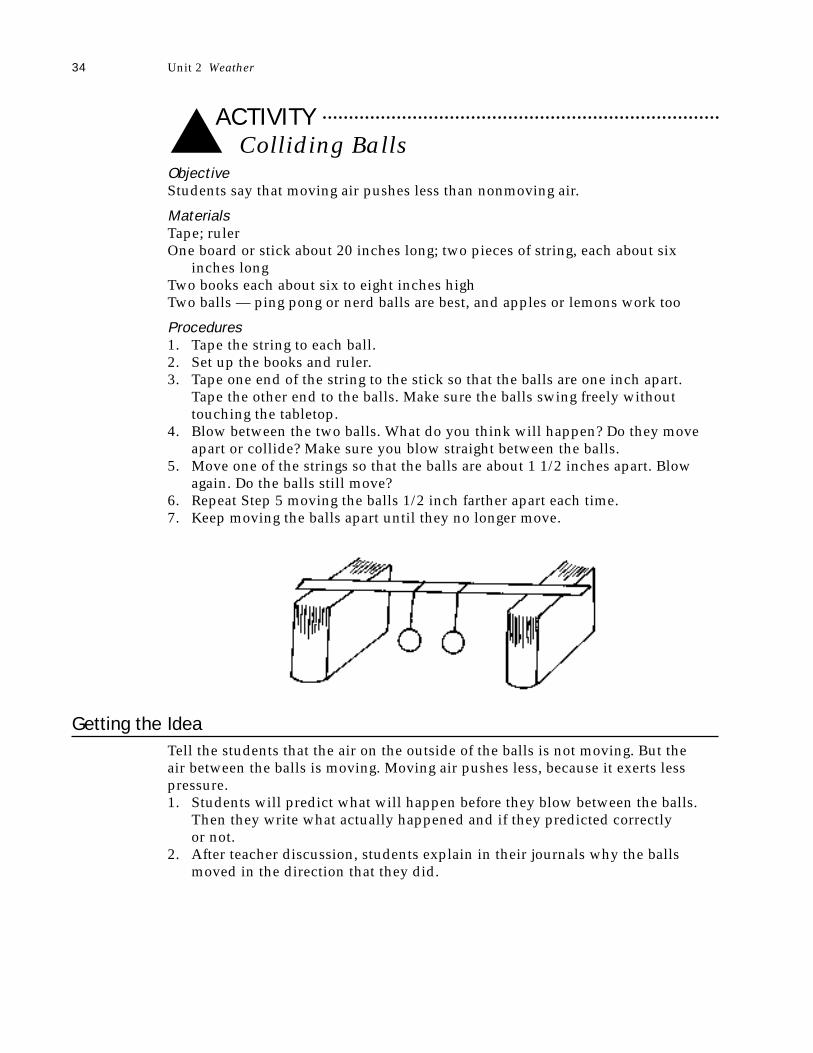
ACTIVITY▲ Colliding BallsObjectiveStudents say that moving air pushes less than nonmoving air.
MaterialsTape; rulerOne board or stick about 20 inches long; two pieces of string, each about six
inches longTwo books each about six to eight inches highTwo balls — ping pong or nerd balls are best, and apples or lemons work too
Procedures1. Tape the string to each ball.2. Set up the books and ruler.3. Tape one end of the string to the stick so that the balls are one inch apart.
Tape the other end to the balls. Make sure the balls swing freely withouttouching the tabletop.
4. Blow between the two balls. What do you think will happen? Do they moveapart or collide? Make sure you blow straight between the balls.
5. Move one of the strings so that the balls are about 1 1/2 inches apart. Blowagain. Do the balls still move?
6. Repeat Step 5 moving the balls 1/2 inch farther apart each time.7. Keep moving the balls apart until they no longer move.
Getting the IdeaTell the students that the air on the outside of the balls is not moving. But the air between the balls is moving. Moving air pushes less, because it exerts lesspressure. 1. Students will predict what will happen before they blow between the balls.
Then they write what actually happened and if they predicted correctly or not.
2. After teacher discussion, students explain in their journals why the ballsmoved in the direction that they did.
34 Unit 2 Weather
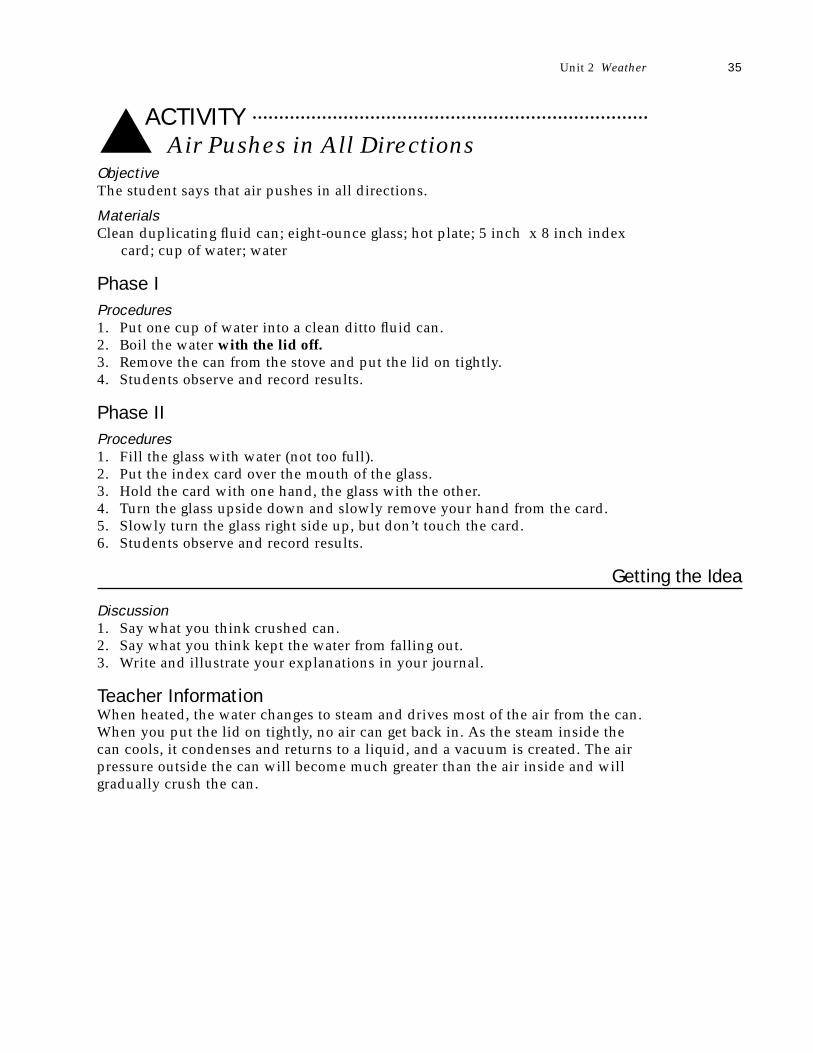
ACTIVITY▲ Air Pushes in All DirectionsObjectiveThe student says that air pushes in all directions.
MaterialsClean duplicating fluid can; eight-ounce glass; hot plate; 5 inch x 8 inch index
card; cup of water; water
Phase IProcedures1. Put one cup of water into a clean ditto fluid can.2. Boil the water with the lid off.3. Remove the can from the stove and put the lid on tightly.4. Students observe and record results.
Phase IIProcedures1. Fill the glass with water (not too full).2. Put the index card over the mouth of the glass.3. Hold the card with one hand, the glass with the other.4. Turn the glass upside down and slowly remove your hand from the card.5. Slowly turn the glass right side up, but don’t touch the card.6. Students observe and record results.
Getting the Idea
Discussion1. Say what you think crushed can.2. Say what you think kept the water from falling out.3. Write and illustrate your explanations in your journal.
Teacher InformationWhen heated, the water changes to steam and drives most of the air from the can.When you put the lid on tightly, no air can get back in. As the steam inside thecan cools, it condenses and returns to a liquid, and a vacuum is created. The airpressure outside the can will become much greater than the air inside and willgradually crush the can.
Unit 2 Weather 35
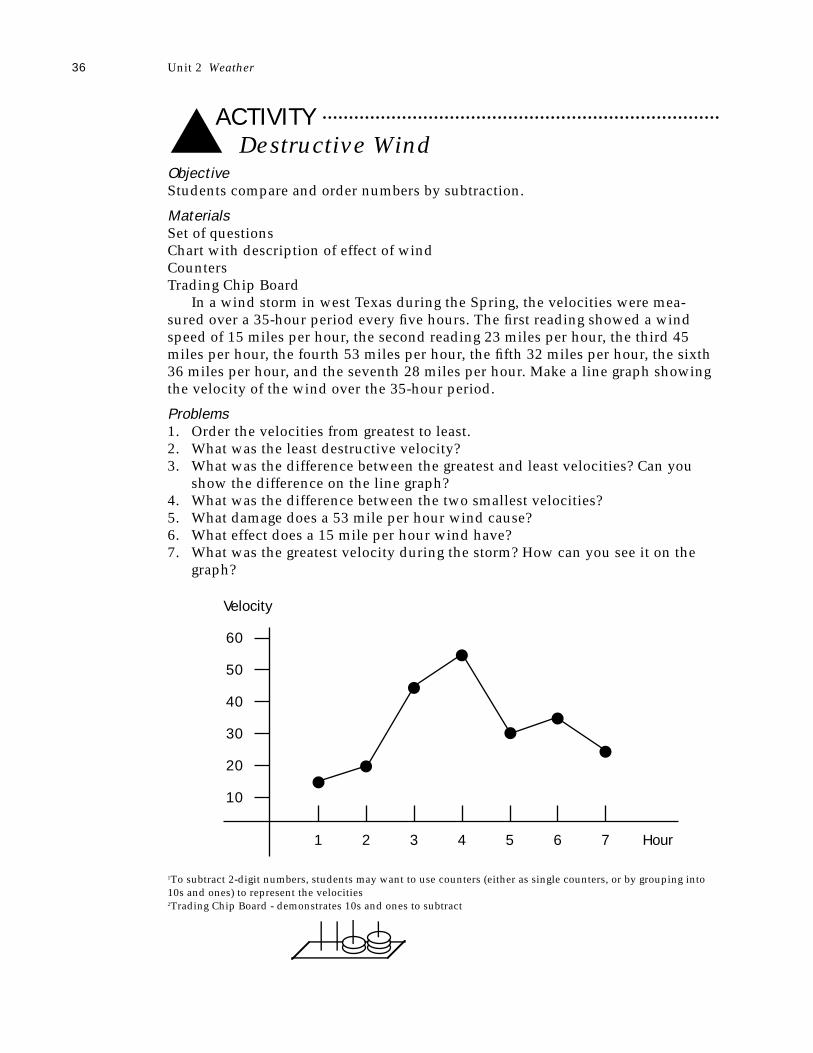
ACTIVITY▲ Destructive WindObjectiveStudents compare and order numbers by subtraction.
MaterialsSet of questionsChart with description of effect of windCountersTrading Chip Board
In a wind storm in west Texas during the Spring, the velocities were mea-sured over a 35-hour period every five hours. The first reading showed a windspeed of 15 miles per hour, the second reading 23 miles per hour, the third 45miles per hour, the fourth 53 miles per hour, the fifth 32 miles per hour, the sixth36 miles per hour, and the seventh 28 miles per hour. Make a line graph showingthe velocity of the wind over the 35-hour period.
Problems1. Order the velocities from greatest to least.2. What was the least destructive velocity?3. What was the difference between the greatest and least velocities? Can you
show the difference on the line graph?4. What was the difference between the two smallest velocities?5. What damage does a 53 mile per hour wind cause?6. What effect does a 15 mile per hour wind have?7. What was the greatest velocity during the storm? How can you see it on the
graph?
36 Unit 2 Weather
1To subtract 2-digit numbers, students may want to use counters (either as single counters, or by grouping into10s and ones) to represent the velocities2Trading Chip Board - demonstrates 10s and ones to subtract
1 2
10
3 4 5 6 7 Hour
20
30
40
50
60
Velocity
8. After answering the questions, the students write or draw and explain theiranswers. Students may use 1. a Trading Chip Board to perform the subtraction.2. an expanded notation format to help them subtract using the idea of
“renaming” instead of “borrowing”, e.g.,-5 tens 3 ones renamed to -4 tens 13 ones-1 tens 5 ones -1 tens 15 ones______________
-3 tens 18 onesUse a laminated chart with 10s and ones labels and erasable markers.
Assessment
Paper and Pencil Assessment1. Use the numerals 1,2,3 only once each to write as many different numbers as
you can. For example, 123 is one number and 312 is another.2. Put the numbers in order from least to greatest.
Performance Assessment1. Use a counter, a Trading Chip Board or a Place Value Chart to show which
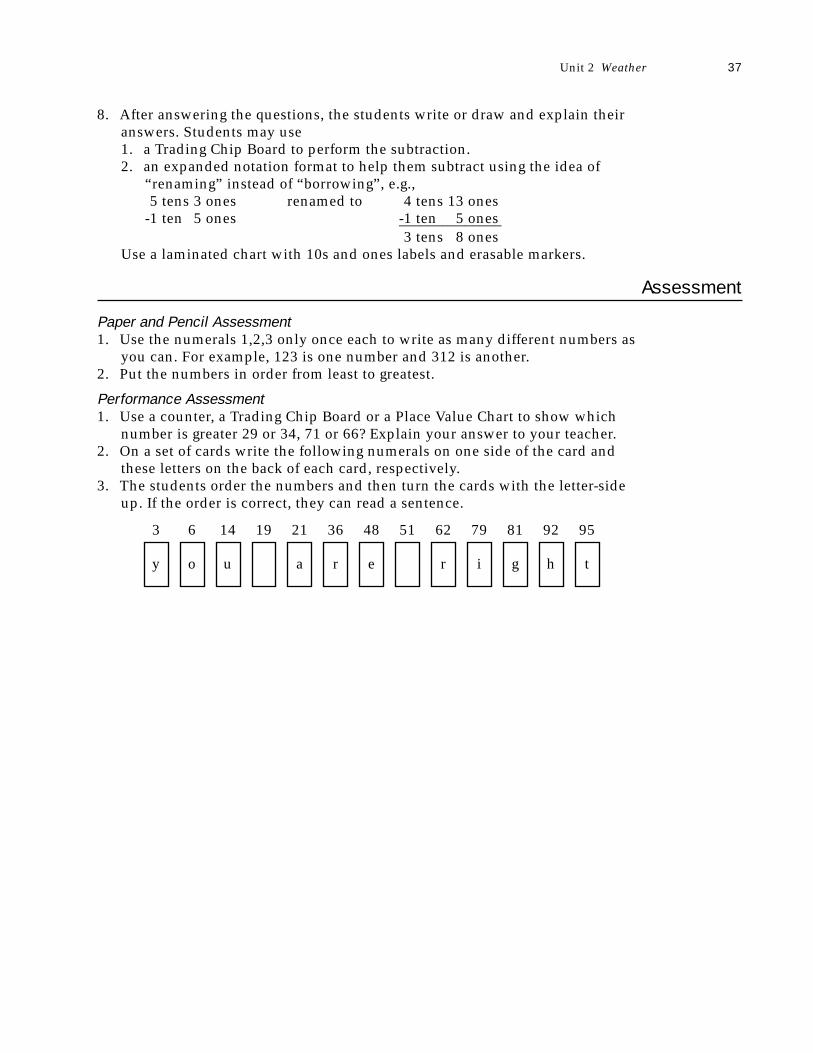
number is greater 29 or 34, 71 or 66? Explain your answer to your teacher.2. On a set of cards write the following numerals on one side of the card and
these letters on the back of each card, respectively.3. The students order the numbers and then turn the cards with the letter-side
up. If the order is correct, they can read a sentence.
Unit 2 Weather 37
y
3
o
6
u
14 19
a
21
r
36
e
48 51
r
62
i
79
g
81
h
92
t
95
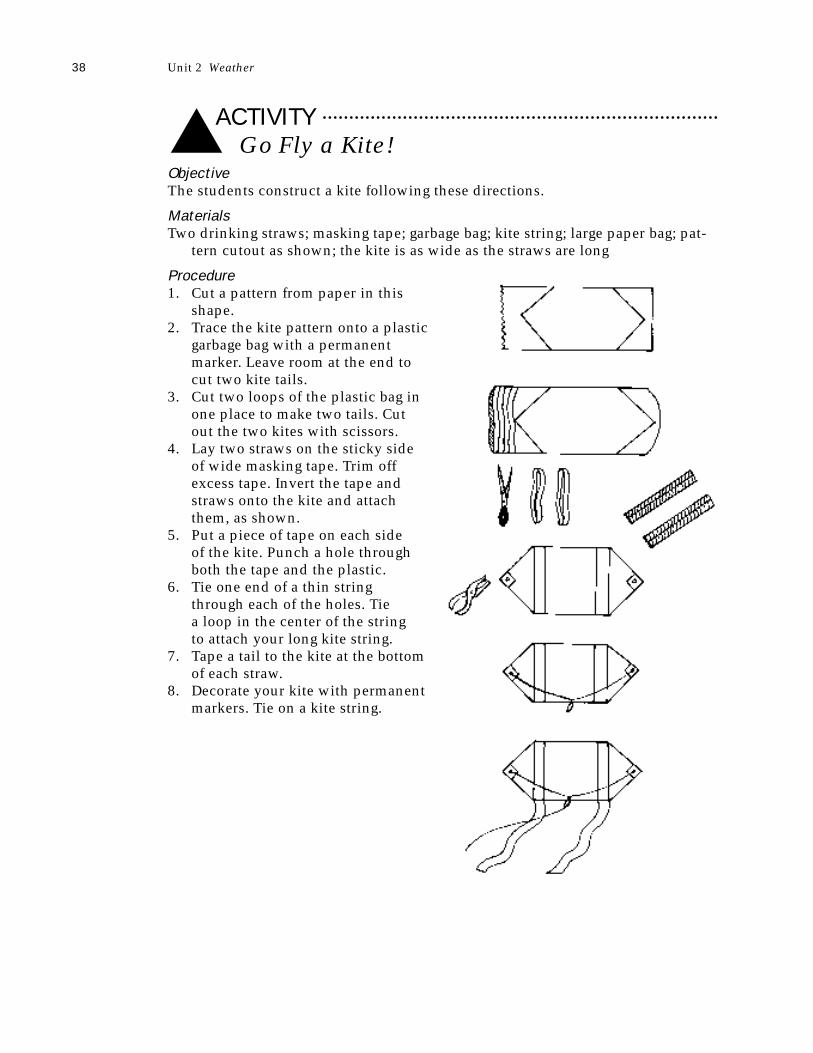
ACTIVITY▲ Go Fly a Kite!ObjectiveThe students construct a kite following these directions.
MaterialsTwo drinking straws; masking tape; garbage bag; kite string; large paper bag; pat-
tern cutout as shown; the kite is as wide as the straws are long
Procedure1. Cut a pattern from paper in this
shape.2. Trace the kite pattern onto a plastic
garbage bag with a permanentmarker. Leave room at the end tocut two kite tails.
3. Cut two loops of the plastic bag inone place to make two tails. Cutout the two kites with scissors.
4. Lay two straws on the sticky sideof wide masking tape. Trim offexcess tape. Invert the tape andstraws onto the kite and attachthem, as shown.
5. Put a piece of tape on each side of the kite. Punch a hole throughboth the tape and the plastic.
6. Tie one end of a thin stringthrough each of the holes. Tie a loop in the center of the string to attach your long kite string.
7. Tape a tail to the kite at the bottomof each straw.
8. Decorate your kite with permanentmarkers. Tie on a kite string.
38 Unit 2 Weather
BIG IDEAS Clouds, rain and snow are all different forms of water vapor; theform of the precipitation depends on the temperature of the sur-rounding air.
Whole Group WorkMaterialsThermometer; stopwatch/digital clock marking seconds; glass tumbler with
frozen water; two washcloths; piece of stringReferences on the Dust Bowl in the United States; reference books on precipita-
tionWord tags: snow, cloud, rain, precipitation, freezing, dew point, condensation,
evaporation, names of the types of clouds, humidity
Prior PreparationVery early in the day, students working in small groups fill a bottle almost to thetop with water and then cap it to prevent water from leaking. A piece of tapemarks the top of the water level on each group’s bottle.
Place the filled bottles in the freezer. Put a piece of clear tape around the topof each bottle so if the cap is opened the tape will pull off. The students can seethat no additional water went into the bottle.
After the water has had an opportunity to freeze, the students hypothesize asto the cause of the increase in volume of the water that is now frozen. Caution: Ifstudents fill the bottle to the top or very close to the top, the bottle will break andmay cause an injury. Before removing the bottles from the freezer, check to see thatnone are broken. If one has broken, the teacher removes the bottle and the pieces.
Encountering the IdeaA few minutes before beginning this lesson, bring out the bottles with the frozenwater. Ask the students to predict what will happen if you leave the bottle out-side the freezer for several minutes. As they offer answers, have them watch theoutside of the bottles carefully. Soon, frost will begin to collect on the sides. Askstudents what it is. Yes, it is frost, but what is frost? (Water, water vapor.) Wheredid it come from? It is in the air. Water vapor is one of the gases in the air webreathe. Sometimes there is more water vapor in the air than at other times, andsometimes less. The water vapor in the air we call humidity. Humidity is one ofthe conditions we feel in weather. High humidity in the air can make us feel hot-ter at a particular temperature than we would feel at the same temperature if theair were not humid. We will learn how to measure the humidity in the air.
Showing pictures of different types of clouds, ask the students what a cloudis. Write the correct responses such as water, water vapor, rain, etc. on the chalk-board for further use.
Unit 2 Weather 39
Clouds, Rain and SnowL E S S O N
5
Look outside the classroom and ask the students if they can see clouds. Ifthere are clouds, the students go outside to describe the clouds. Students note thedifferent shapes, colors, size, number (many, few, or just one large one covering alarge area, etc.) and as many other weather conditions as possible.
On returning to the classroom ask what makes clouds have different colors.What makes clouds have different shapes? Size? Ask students what makes rain.Where does the water come from that makes rain? When does rain turn to snow?Yes, when it gets cold. What is snow? How are rain, snow and clouds different?Are rain, snow and clouds the same in any way? Tell students that they will dis-cover what makes clouds, why clouds have different shapes and what rain andsnow are.
Exploring the IdeaAt the Science Center:1. Before letting the students work on their own in the center, ask a student to
take a wet washcloth, place it on his/her arm and secure it with a piece ofstring. Place and secure the other wash cloth on the other arm. The studentswings his/her arms around rapidly. The student describes what he/she feels.The students hypothesize as to the reason for the sensation of cold. Studentsdiscuss their experiences of getting out of the swimming pool or shower andfeeling cold when wet but warm when dry. Ask the students to think aboutthis as they complete the activities in the learning centers.
2. Complete Activity — Making a Hygrometer3. Complete Activity — Clouds 4. Complete Activity — The Dew Point5. Complete Activity — Six-sided Snowflakes.
Getting the IdeaAfter students have had an opportunity to complete the activities, ask:1. Why does a wet washrag feel cold on your arm?2. What makes rain? Where does the water come from that makes rain? (Water,
in the form of water vapor, is always in the air. As warm air rises, it condensesinto small droplets of water that come down as rain.) Review the experimentin which students made rain and clouds in the classroom. The students maywish to repeat the activity. When does rain turn to snow?
3. Did you discover what makes clouds have different colors? Guess what itmight be.
4. What makes clouds have different shapes? Size? 5. What is snow? How are rain, snow and clouds different? Are rain, snow,
clouds and water vapor the same in any way? If so, how? 6. From the experiments we completed, what would you guess are the main
things, or factors, that make rain, snow and clouds? (Humidity and tempera-ture of the air.) Give students the names of the clouds and a general descrip-tion of the clouds’ appearance.
7. What word is used to refer to clouds, rain, drizzle, fog, snow, hail, frost, iceand so on? (Precipitation.)
8. What happened to the water that was frozen overnight? What made the vol-ume (the space that it took up in the bottle) of the water increase? Did we put
40 Unit 2 Weather
more water in the bottle? How do you know someone didn’t put more water inthe bottle? (Water expands as it freezes. At 4˚ C water has its lowest density.)
Cloud TypesCirrus (curl, “churro”) — high, ice crystal clouds that look like wispy curls, are
often signs of bad weather.Cumulus (heap, collection) — fluffy puffs that look like cauliflowers, appear in
sunny, summer skies.Nimbus (rain, “neblina”) — thick, dark gray clouds that bring rain or snow.Stratus (layer) — low, gray blanket that often brings drizzle, cover high ground
and cause hill fog.Fog — condensed water vapor in the air, usually lying close to the ground.Hail — ice crystals in a cumulonimbus cloud can form hail. The ice crystals are
tossed around in the cloud, and caps of frozen water form on the crystals likeskins on an onion. When they get big and heavy, the hailstones fall to theearth.
Dust Bowl — when there is no rain in a region for a long time, the soil becomesso dry that the wind blows it away easily.
Snow — the solid form of water that freezes and grows while floating, rising orfalling in the free air of the atmosphere. Snow is a crystal of six sides. Snow-flakes usually have the shape of plates, or of stars.
Organizing the IdeaAfter students complete Activity — Clouds, they make a chart showing the differ-ences and likenesses among the different types of precipitation. (Air temperatureis an important factor as is the humidity in the air.)
Applying the Idea
Problems1. Why does frost form on ice cubes in the refrigerator?2. Why do the insides of car windows get cloudy if you blow on them in cold
weather? (The frost that forms in ice cube compartments of refrigerators andin freezers develops from the water vapor condensing on surfaces that arebelow 0˚ C, the temperature at which water freezes. The more often we openthe door, the more warm, moist air gets in. The insides of auto windows arecold; warm, moist breath condenses and, if it is cold enough, turns to frost.)
3. Research and report on the causes a “Dust Bowl.” (The lack of humidity in theair and the lack of plants to secure the soil.)
Problem Solving1. Draw a picture of a frozen lake in the winter. What can people do and not do
on a frozen lake? Explain your answer.2. Will a river freeze? When?3. What happens to the fish under the lake?4. What would happen if the lake froze from the bottom to the top, instead of
freezing on the surface first?
Unit 2 Weather 41
Closure and Assessment1. The student constructs a hygrometer (or another of the instruments to collect
weather data that students have constructed) and explains to his/her partnersand/or the teacher how it works. The student also explains what informationabout weather conditions a hygrometer (or other instrument) provides.
2. Student describes and/or draws a snowflake. The student explains howsnowflakes (and/or other forms of precipitation) form.
List of Activities for this Lesson▲ Making a Hygrometer
▲ Clouds
▲ The Dew Point
▲ Six-sided Snowflakes
42 Unit 2 Weather
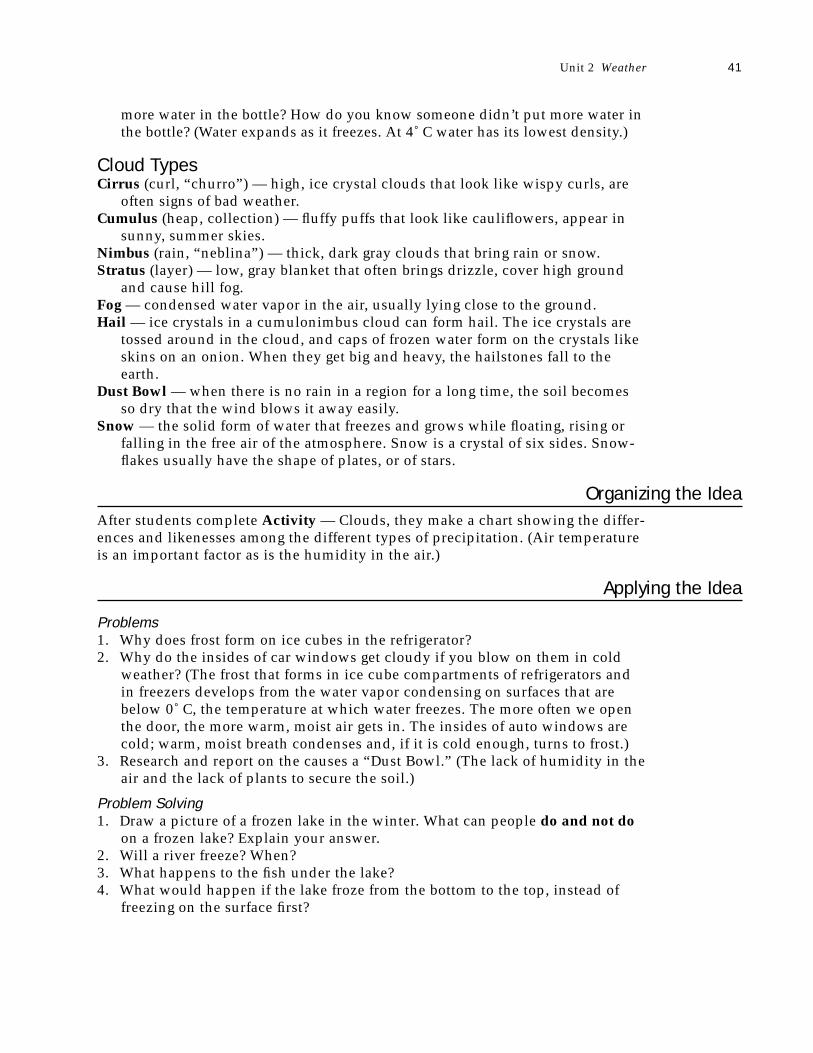
ACTIVITY▲ Making a HygrometerObjectiveStudents construct a hygrometer and read the relative humidity.
MaterialsTwo identical thermometers; shoelace (with tips cut off) 20 cm. (eight in.) long;
two rubber bands; piece of styrofoam 12 x 6 inches long
Procedures1. Use the rubber band. Fasten the two thermometers side by side on the styro-
foam about four inches apart with the rubber bands.2. Moisten the shoelace and wrap one end around the bulb of one thermometer.
Put the other end of the shoelace in the glass of water.3. After about five minutes, compare the temperatures of the thermometers.4. What do you think caused the temperature to drop? Convert the wet-dry dif-
ference in temperature to relative humidity.
Getting the IdeaTell students that, after a few minutes, the wet bulb will have a lower tempera-ture. This is a wet-dry bulb hygrometer. The shoelace cools from the evaporationof the water on it into the air. Humidity is the amount of moisture the air containscompared to the amount it can contain. The less moisture the air contains, thegreater the amount it can absorb. As the ability to absorb water increases, thetemperature drops. The greater the difference in temperature between the wetand dry bulbs, the lower the humidity (amount of moisture already in the air). Or the greater the difference in temperature between the wet and dry thermome-ters, the greater the amount of moisture the air can still absorb.
Unit 2 Weather 43
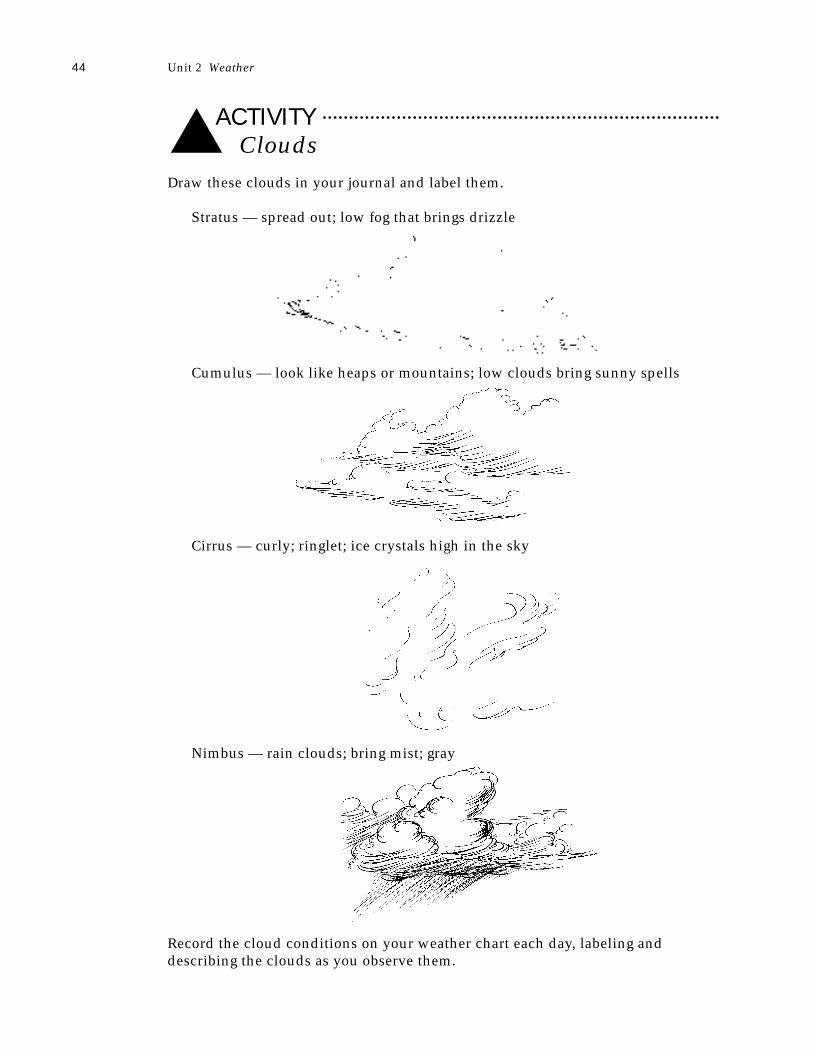
ACTIVITY▲ CloudsDraw these clouds in your journal and label them.
Stratus — spread out; low fog that brings drizzle
Cumulus — look like heaps or mountains; low clouds bring sunny spells
Cirrus — curly; ringlet; ice crystals high in the sky
Nimbus — rain clouds; bring mist; gray
Record the cloud conditions on your weather chart each day, labeling anddescribing the clouds as you observe them.
44 Unit 2 Weather
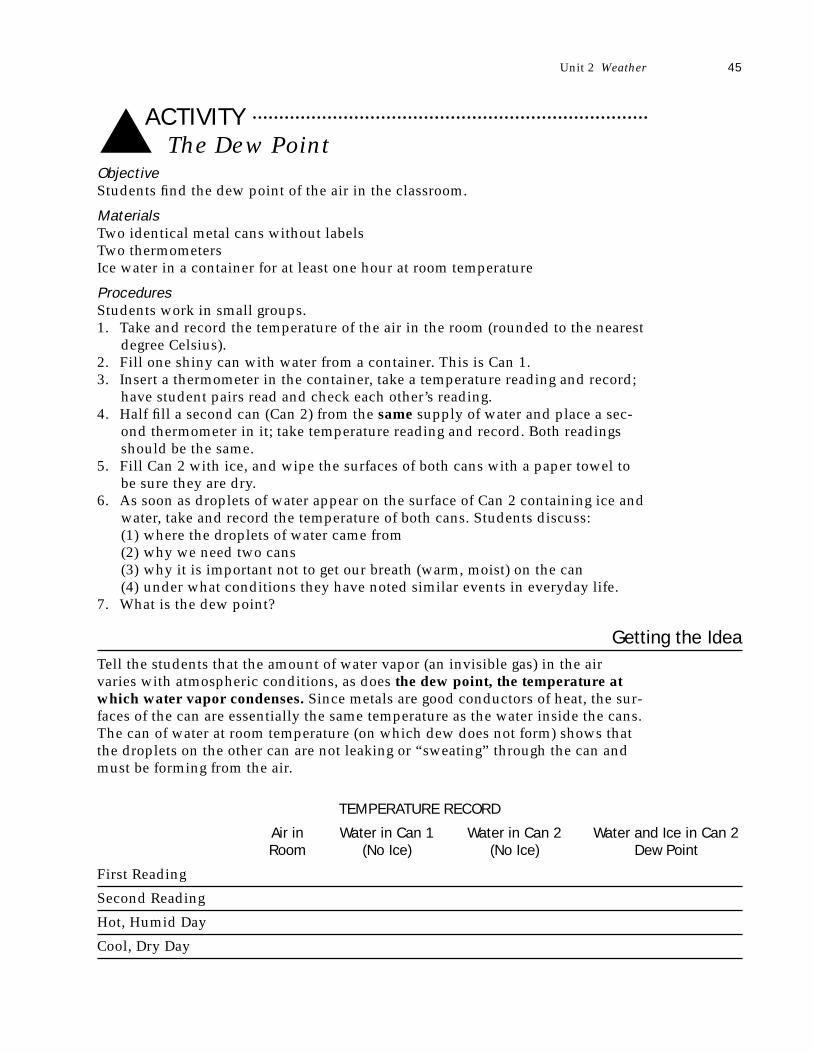
ACTIVITY▲ The Dew PointObjectiveStudents find the dew point of the air in the classroom.
MaterialsTwo identical metal cans without labelsTwo thermometersIce water in a container for at least one hour at room temperature
ProceduresStudents work in small groups.1. Take and record the temperature of the air in the room (rounded to the nearest
degree Celsius). 2. Fill one shiny can with water from a container. This is Can 1.3. Insert a thermometer in the container, take a temperature reading and record;
have student pairs read and check each other’s reading. 4. Half fill a second can (Can 2) from the same supply of water and place a sec-
ond thermometer in it; take temperature reading and record. Both readingsshould be the same.
5. Fill Can 2 with ice, and wipe the surfaces of both cans with a paper towel tobe sure they are dry.
6. As soon as droplets of water appear on the surface of Can 2 containing ice andwater, take and record the temperature of both cans. Students discuss:(1) where the droplets of water came from(2) why we need two cans(3) why it is important not to get our breath (warm, moist) on the can(4) under what conditions they have noted similar events in everyday life.
7. What is the dew point?
Getting the IdeaTell the students that the amount of water vapor (an invisible gas) in the airvaries with atmospheric conditions, as does the dew point, the temperature atwhich water vapor condenses. Since metals are good conductors of heat, the sur-faces of the can are essentially the same temperature as the water inside the cans.The can of water at room temperature (on which dew does not form) shows thatthe droplets on the other can are not leaking or “sweating” through the can andmust be forming from the air.
TEMPERATURE RECORD
Air in Water in Can 1 Water in Can 2 Water and Ice in Can 2Room (No Ice) (No Ice) Dew Point
First Reading
Second Reading
Hot, Humid Day
Cool, Dry Day
Unit 2 Weather 45
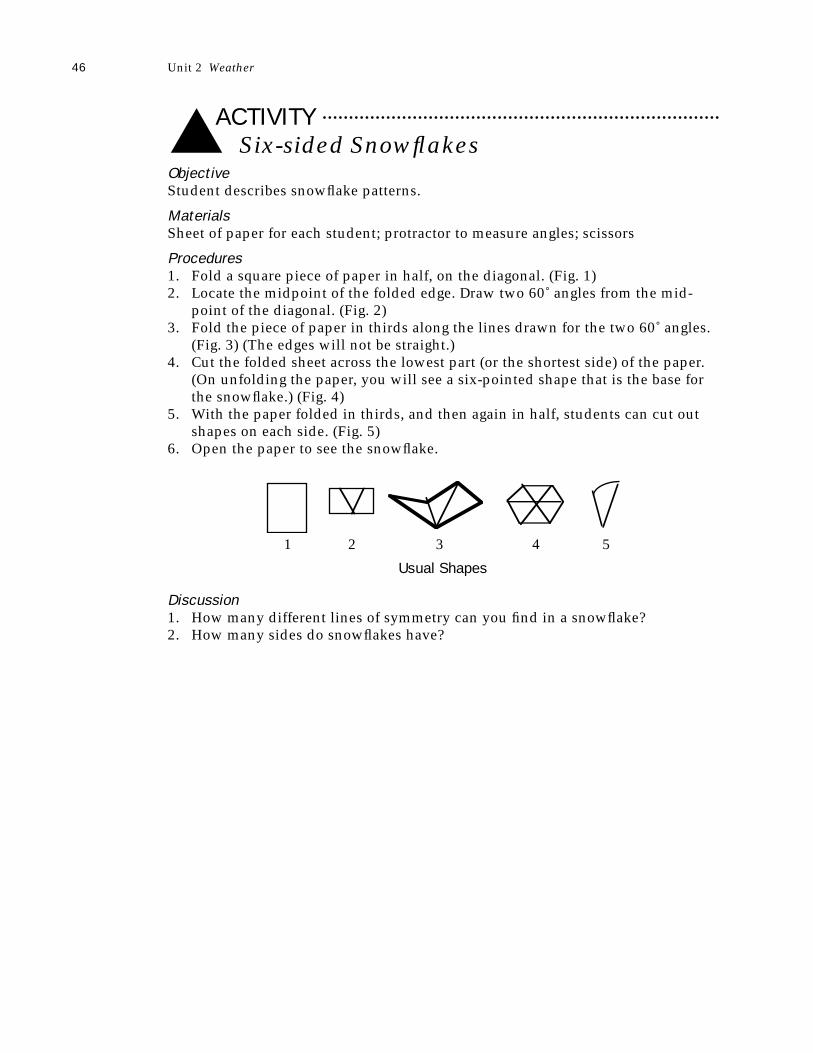
ACTIVITY▲ Six-sided SnowflakesObjectiveStudent describes snowflake patterns.
MaterialsSheet of paper for each student; protractor to measure angles; scissors
Procedures1. Fold a square piece of paper in half, on the diagonal. (Fig. 1)2. Locate the midpoint of the folded edge. Draw two 60˚ angles from the mid-
point of the diagonal. (Fig. 2)3. Fold the piece of paper in thirds along the lines drawn for the two 60˚ angles.
(Fig. 3) (The edges will not be straight.)4. Cut the folded sheet across the lowest part (or the shortest side) of the paper.
(On unfolding the paper, you will see a six-pointed shape that is the base forthe snowflake.) (Fig. 4)
5. With the paper folded in thirds, and then again in half, students can cut outshapes on each side. (Fig. 5)
6. Open the paper to see the snowflake.
1 2 3 4 5
Usual Shapes
Discussion1. How many different lines of symmetry can you find in a snowflake?2. How many sides do snowflakes have?
@?@?
?
46 Unit 2 Weather
BIG IDEAS Lightning is produced by huge exchanges of electrical charges;thunder is produced by expanding air; we can estimate the dis-tance of a thunderstorm.
Whole Group WorkMaterialsSmall pieces of tissue; piece of rabbit fur or wool cloth; paper sack; inflated bal-
loon; piece of carpet, 2 x 2 feet; rubber mat; chart showing the distance/timerelation
Encountering the IdeaAsk students if any of them have ever walked on a thick carpet across a room,then touched the television set or some other object and had a spark hit them.The spark was an electrical discharge, like lightning. Take the inflated balloonand pop it with a pin. Ask the students what they think caused the noise. Whathappened to the air in the balloon when the balloon popped? Tell the studentsthat by doing the following experiments they will discover some of the condi-tions that cause lightning and thunder.
Exploring the IdeaAsk a student to stand on the piece of carpet close to a metal object (like a drink-ing fountain) and shuffle her/his feet briskly on the carpet, then reach out totouch the piece of metal. What happened? Take the piece of fur, rub it briskly onthe glass rod and then pick up pieces of tissue with the rod. (The rod acts like amagnet and attracts the pieces of tissue. As the glass rod is over the paper, the rodmay even crackle and spark.) Both of these actions — walking on a carpet and thepiece of fur — have the same thing in common: both of them involved rubbing.Ask the students to hypothesize as to the reasons for the spark. Write the ideas ona chalkboard.
A student stands on a rubber pad. Another student rubs the first student’sback briskly with the piece of fur. Place the glass rod over the student’s head.What happens?
Take the paper sack and pop it with your hand. Take the soda pop bottle,shake it and then open it. Again, ask the students what they think caused thenoise. They can hypothesize about the cause of the noise.
Students complete Activity — Estimating the Distance of a Thunderstorm.
Getting the IdeaLightning is a form of electrical energy. When clouds move against each other,one of the clouds receives electrical charges from the other cloud. The cloud with
Unit 2 Weather 47
Nature’s Light ShowL E S S O N
6

extra charges is now at a different energy level than the other cloud and/or theearth. This difference in the number of electrical charges between the clouds wecall “static electricity.” Static electricity builds up in a thundercloud and releasesas a brilliant flash of light into the ground, or into another cloud, in order toobtain a balance with the electrical charges.
Sound waves traveling in the air cause noise. When air heats, it expands, andwhen it expands rapidly, it causes sound waves in the surrounding air. Rapid heat-ing of air, because it is expanding like the air released from the balloon, causes thenoise. Lightning causes thunder as it heats the air in its path to 30,000˚ C (54,000˚F), which is five times hotter than the sun’s surface. As the air expands veryrapidly, the speed of the moving air causes the booming noise called thunder.
Thunderstorms usually occur when the air is humid and warm. Cumulo-nimbus clouds form and, as these clouds form, the air begins to move rapidly,causing gusty winds. Lightning can occur between the earth and a cloud, or fromcloud to cloud.
Organizing the IdeaIf you have listened to Vivaldi’s The Four Seasons, were you able to detect thelightning and thunderstorm the composer included in the music? In what seasondid the thunder appear? Try to find the thunder in the music. Can you imaginethe thunderstorm? Is Spring usually the season for thunderstorms? Why?
At the Writing Center, write a poem that describes your favorite season, forexample, how “April showers bring May flowers” or about Frosty the Snowman.
Applying the Idea and AssessmentIn the activity on estimating the distance of a thunderstorm, read the line graph toanswer the following questions.1. How far is the lightning if you see the flash and hear the clap of thunder
almost immediately after?2. If you are four kilometers from a thunderstorm, how long will the noise of
thunder take to reach you after you see the lightning?
List of Activities for this Lesson▲ Estimating the Distance of a Thunderstorm
48 Unit 2 Weather

ACTIVITY▲ Estimating the Distance of a ThunderstormObjectiveStudents read and interpret a graph.
MaterialsA copy of the graph for each student group.
Procedures1. Explain to students the difference between the speed of sound and the speed
of light.2. Students study the line graph.
• What does the horizontal line (axis) tell us? (Seconds it takes the thunderto reach the listener after the lightning.)
• What does the vertical line tell us? (The kilometer.)Lightning and the ensuing clap of thunder occur at the same time. We some-
times think the lightning occurs first because we see it first, and then we hear thethunder. The reason for this delay is that light travels much faster than sound.
If you see a bolt of lightning and begin to count the number of seconds it takesto hear the clap of thunder, the storm is a little less than half that number of kilo-meters away. For example, if you hear thunder six seconds after you see the flash,the storm is about three km away. You can estimate the number of seconds bycounting one thousand one, one thousand two, one thousand three, one thousandfour, and so on, or time them on a watch with a second hand.
You can use this chart to estimate the distance between you and a thunder-storm. 3. How far is a thunderstorm if it takes eight seconds for the sound of thunder to
reach you after you see the flash?4. How far is a thunderstorm if it takes three seconds for the sound of thunder to
reach you after you see the flash?
Unit 2 Weather 49
1 2
1
3 4 5 6 7 8 Sec.
2
3
4
5
Km.
BIG IDEAS Would you like to be a weather forecaster? We base weather predic-tions on data that we have gathered over many days.
Whole Group WorkMaterialsChart from Activity — Groundhog Weather Station and Activity — Data and Line
GraphsMarkersAll the data collected to dateAll the instruments used in collecting weather data
Encountering the IdeaTell the students that they will now become weather forecasters at GroundhogWeather Station (or any name they wish to give to their weather station — nameof school, school mascot, etc.) They will predict the weather for the next weekand compare their forecast to the radio or television forecast, one day at a time.
Ask students to suggest ways of making a weather prediction for the next day.What information will they use? Why? What temperature will they predict fortomorrow? Air pressure? And so on.
Exploring and Organizing the IdeaIf the students do not suggest it, suggest that since the class has been keepingrecords of weather conditions such as outside temperature, dew point (humidity),air pressure (barometer), precipitation, wind direction (wind sock) and speed(windometer), they can use this data to make predictions, to make a forecast. Inmaking their predictions, the students must defend their forecast with reasonsbased on the data.
At the Groundhog Weather Station (GHWS), the students complete1. Activity — Data and Line Graphs2. Activity — Weather Forecasting, continued from Lesson One.
Using the idea suggested in Activity — Data and Line Graphs, the studentssummarize the data collected on the previous days into line graphs.
Getting the Idea1. Discuss making decisions based on data, as given in the activities.2. The class may wish to invite a local meteorologist to review the work of the
class and to give further explanations. The meteorologist may want to discussforecasting the weather as a career.
3. The students design, organize, write and draw weather maps for a daily televi-sion program to forecast the next day’s weather.
50 Unit 2 Weather
Weather ForecastingL E S S O N
7
Closure and Assessment1. At the Music Center, the students may want to sing and listen to a tape of Oh,
What a Beautiful Morning! The students write a paragraph telling about howthe weather affects their feelings during a beautiful day or during an ugly,cold, wet day.
2. The entire lesson may serve as a final unit assessment, involving oral, perfor-mance and written activities that indicate the level of a student’s understand-ing of the concepts and the level of performance in the various skills requiredin the unit.
3. Individual assessments can be made on the chart for Activity — My Forecast.
List of Activities for this Lesson▲ Data and Line Graphs
▲ Weather Forecasting (see Lesson One)
▲ My Forecast
Unit 2 Weather 51
ACTIVITY▲ Data and Line GraphsObjectiveStudents show summarized data on a line graph.
ProcedureRewrite the information on a graph that shows the date and the temperature atthe same time.
RECORD OF OUTSIDE TEMPERATURE
Information to consider:1. Which is the most frequent, or common, temperature?2. Which is the highest temperature? What other weather conditions occurred at
that time? Was it sunny? Air pressure?3. Which is the lowest? What other weather conditions occurred at that time?
Was it cloudy? Air pressure?4. What is your temperature forecast for tomorrow?
52 Unit 2 Weather
1 2
50
3 4 5 6 7 1 2 3 4 5 6 7 1 2 3 4
5560657075808590
˚F
ACTIVITY▲ My Forecast (continued from Lesson 1)Name ___________________________
Date (today) _____________ ______________ _____________Day Month Year
Season ____________
Outdoor temperature __________________
Sky: _____________________Clouds?
Precipitation: ______________________Rain, Snow
Wind direction: _________________________North, South, East, West
Wind speed: ____________________
Barometric Pressure: ________________
Dew Point (Humidity): ___________________
_______________________________________________________________________Tomorrow’s Forecast
Indoor temperature __________________
Sky: _____________________Clouds?
Precipitation: ______________________Rain, Snow
Wind direction: _________________________North, South, East, West
Wind speed: _____________________
Barometric Pressure: ________________
Dew Point (Humidity): ___________________
Unit 2 Weather 53
U N I T A S S E S S M E N TStudents answer the following, using the words evaporate, cold, warm, rain tocomplete the sentences.
Oral or Written Assessment1. When water vapor cools we get _____________.2. When water vapor becomes ____, it will evaporate.3. When the water in the lake becomes warm, it will _________.4. When water vapor becomes ________, it will condense.
Performance Assessment1. A snowstorm is moving at 45 miles an hour. Complete this chart to show how
far the storm will have traveled after five hours.
2. Draw a snowflake and describe it to your teacher. Be sure to use the geometricterms you learned in this unit when you describe your snowflake.
3. Describe the current weather conditions to your teacher. Tell your teacherwhat you predict the weather will be for tomorrow. Be sure to take all theinformation you can find about the weather outside your classroom with youbefore you talk to your teacher; use a chart to help you summarize yourreport. (E.g., outside temperature, wind direction, wind velocity, type of cloudcover, and prediction of the conditions that are likely to prevail, etc.)
4. A weather map shows that Grand City and Small City are 3 1/2 inches apart. If 1/2 inch represents (stands for) each 80 miles, how many miles apart areGrand City and Small City? You may want to draw a chart to help you explainhow you decided on the distance between the two cities.
54 Unit 2 Weather
hours
miles
1⁄2
45
1 1 and 1⁄2 2 2 and 1⁄2
inches
miles
1
(80)
1 and 1⁄2
(160)
2
(240)
2 and 1⁄2
(320)
3
(400)
3 and 1⁄2
(480)
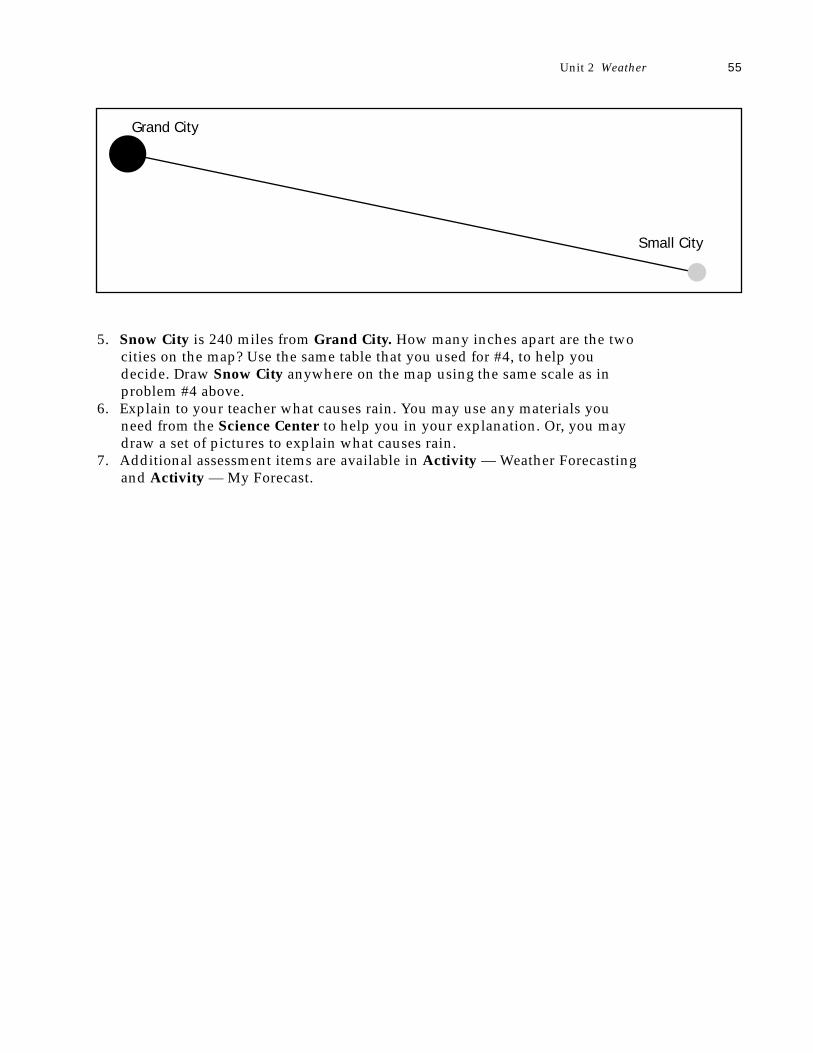
5. Snow City is 240 miles from Grand City. How many inches apart are the twocities on the map? Use the same table that you used for #4, to help youdecide. Draw Snow City anywhere on the map using the same scale as inproblem #4 above.
6. Explain to your teacher what causes rain. You may use any materials youneed from the Science Center to help you in your explanation. Or, you maydraw a set of pictures to explain what causes rain.
7. Additional assessment items are available in Activity — Weather Forecastingand Activity — My Forecast.
Unit 2 Weather 55
Grand City
Small City
ReferencesAnnoted Children’s Books
56 Unit 2 Weather
Branley, F. M. (1962). Air is all around you. New York:Thomas Y. Crowell.
A basic book about air. It contains very simple text.
Branley, F. M. (1983). Rain and hail. New York: ThomasY. Crowell.
Contains a clear explanation of the fornation of rainand hail.
Branley, F. M. (1985). Flash, crash, rumble, and roll. NewYork: Thomas Y. Crowell.
Explains formation of thunder clouds, occurrence anddangers of lightning, and the causes of sound of thunder.
Branley, F. M. (1985). Hurricane watch. New York:Thomas Y. Crowell.
Contains descriptions of the origin and nature of hurri-canes. It also suggests ways of staying safe when in hurri-cane areas.
Branley, F. M. (1986). Snow is falling. New York: ThomasY. Crowell.
Explains the ecology of snow and includes some sim-ple experiments for grades PK-2.
Branley, F. M. (1987). It’s raining cats and dogs: All kindsof weather and why we have it. New York: HoughtonMifflin.
Describes strange weather condition such as pink andgreen snowstorms, mixed with scientific explanations ofthe weather.
Branley, F. M. (1988). Tornado alert. New York: HarperCollins Childrens Books.
This K-4 volume provides explanation of the tornado.
Broeckel, R. (1982). Storms. Chicago: Children’s Press.Illustrated for grades 1-4, this contains causes and
effects of storms.
Busch, P. S. (1971). A walk in the snow. New York: J. B.Lippincott.
Shows winter scenes, enabling children to raise andanswer questions about snow. It is recommened forgrades 2-4.
Catherall, E. (1991). Exploring weather. Austin, TX:Steck-Vaughn.
A textbook-style volume, which contains questions, aglossary, books to read, and an index. It addresses aircurrents, temperature, air pollution, and other topics.
De Paola, T. (1975). The cloud book. New York: HolidayHouse.
Illustrated by the author, this K-3 volume providesinformation on the 10 most common types of clouds.
Dickinson, T. (1988). Exploring the sky by day: Theequinox guide to weather and the atmosphere.Ontario: Camden House.
Provides explanation of weather and its formation.
Dorros, A. (1989). Feel the wind. New York: Thomas Y.Crowell.
Explains causes, effects and usefulness of wind.
Editorial Molina. (1971). Mi primera biblioteca básica: Elaire. Barcelona: Author.
This is one of a series in a basic science library inSpanish. Describes several experiments to detect thepresence of air.
Editorial Molina, (1972). Mi primera biblioteca básica:Tiempo atmosférico. Barcelona: Author.
One of a series, this addresses wind velocity, kinds ofclouds, and many other atmospheric conditions.
Ellentuck, S. (1968). A sunflower as big as the sun.Garden City, NY: Doubleday & Company.
Uncle Vanya’s boasting leads to darkness and cold andthe end of the world.
Evans, E. K. (1965). The snow book. Boston: Little,Brown and Company.
In addition to defining and explaining snow formation,the author addresses how snow affects different seg-ments of our population.
Gibbons, G. (1987). Weather forecasting. New York: FourWinds Press.
Provides a tour of a weather station during the fourseasons.
Goudey, A.E. (1950). The good rain. New York: E. P.Dutton.
This is the story of what the lack of rain can mean bothto a city and a country child. For shared reading or justfor sustained reading.
Hood, F. (1966). One luminaria for Antonio. New York:G. P. Putnam’s Sons.
Story about Antonio, a poor boy, who finds a blessingon Christmas Eve.
Horton, B. S. (1992). What comes in spring? New York:Alfred A. Knopf.
The story describes events in the different seasons,including how a baby grew inside her mother as the sea-sons changed.
Larrick, N. (1961). Rain, hail, sleet and snow.Champaign, IL: Garrard.
Offers clear explanations of the formation of hail, sleet,dew, frost, and many other weather conditions. Containsa simple illustration of the water cycle.
MacDonald, E. (1992). The very windy day. New York:Willian Morrow and Company.
Humorous tale of how four people running errands ona very windy day lose their possessions by the force ofthe wind, and by the same force, regain them.
Unit 2 Weather 57
Teacher References
Munsch, N. (1984). Millicent and the wind. Ontario:Annick Press.
Story of a young girl whose only playmate is the wind.
Newton, J. R. (1983). Rain shadow. New York: Thomas Y.Crowell.
Contains an explanation of how the “rain shadow” ordry environment develops on the leeward side of manyhigh mountain ranges.
Purdy, C. (1985). Iva Dunnit and the big wind. New York:Dial Books for Young Readers.
A tall tale about a pioneer women with six childrenand their experience with a windstorm.
Simon, S. (1969). Wet & dry. New York: McGraw-Hill.This volume poses questions and suggests projects for
young readers.
Simon, S. (1989). Storms. New York: Morrow Junior Books.This book is an excellent way to introduce children to
meteorology.
Stolz, M. (1988). Storm in the night. New York: HarperCollins.
A fictional story for ages 5-8 tells of how a grandfatherand his grandson sit through a thundersorm and get toknow more about each other.
Webster, V. R.(1982). Weather experiments. Chicago:Childrens Press.
Provides a simple explanation of how weather evolves.
Wyler, R. (1986). Science fun with peanuts and popcorn.New York: Julian Messner
Contains simple experiments that explain scientificprinciples.
Zim, H. S. (1952). Lightning and thunder. New York:William Morrow and Company.
Presents a good explanation of lightning and thunder.Contains do’s and don’ts during a lightning and thunderstorm.
Adler, I. (1959). Weather in your life. New York: TheJohn Day Company.
Addresses many questions about weather. It includesan explanation and illustration of the Beaufort scale.
Alcántara, R. (1989). Baul de cuentos. La bruja que quisomatar el sol. Madrid: Hymsa.
Andersen, H. C. (1987). Cuento de Hadas: La reina de lasnieves. Costa Mesa, CA: Everest
Balzola, A. & Parramón, J. M. (1986). La Primavera.Woodbury, NY: Barron’s.
Barret. J. (1978). Cloudy with a chance of meatballs. NewYork: Macmillan.
Jean-Claude, B. (1990). Albumes ilustrados: Un inviernoen la vida de gran oso. Madrid: Ediciones Susaeta.
López-Lomas, E. A. (1991). El hombre de la lluvia.Mexico: Edamex.
Ross, F. Jr. (1965). Weather: The science of meteorologyfrom ancient times to the Space Age. New York:Lothrop, Lee & Shepard.
This is a book for a general reading, yet scientificenough. It contains some illustrations and good back-ground information.
Schneider, H. (1961). Everyday weather and how itworks. New York: McGraw-Hill.
With good illustrations, this volume cover manyaspects of weather.
Turin, A., & Bosnia, N. (1980). Una feliz catástrofe.Barcelona: Editorial Lumen.
Vasquez, Z., & Montelongo, J. (1980). Cuentos del abuelo:El naranjo que no daba naranjas. Mexico: Trillas.
Webster, V. R. (1986). Asi es mi mundo. Experimentosatmosféricos. Chicago: Childrens Press.

58 Unit 2 Weather