unit 1 populations and samplings learning map unit 1
TRANSCRIPT

Unit 1 Populations and Samplings• Learning Map Unit 1


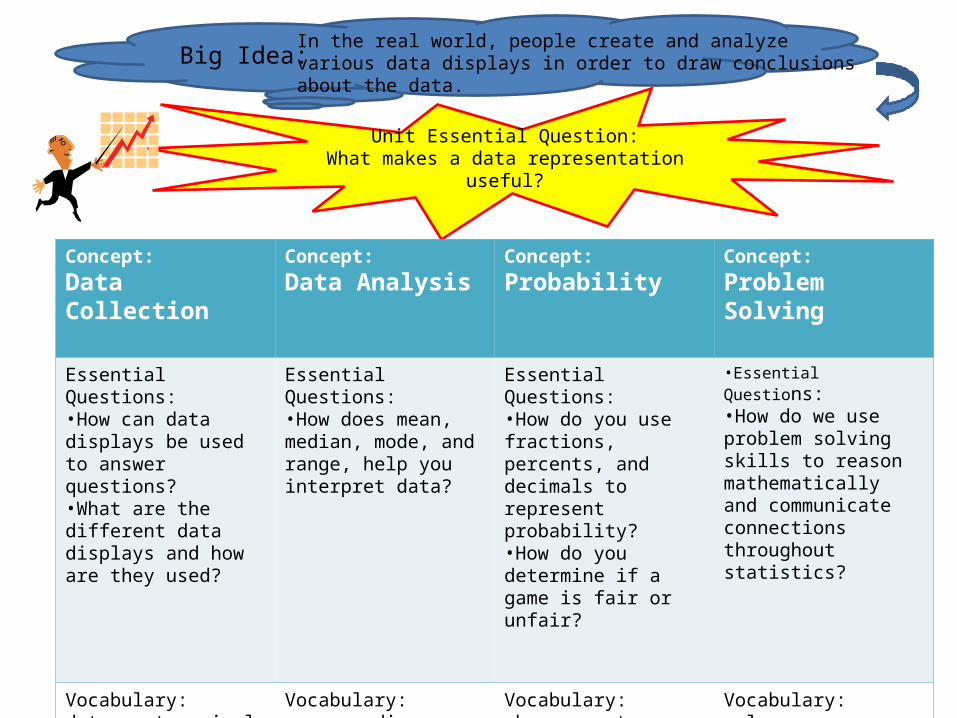
Big Idea:In the real world, people create and analyze various data displays in order to draw conclusions about the data.
Unit Essential Question:What makes a data representation
useful?
Concept:Data Collection
Concept:Data Analysis
Concept:Probability
Concept:Problem Solving
Essential Questions:•How can data displays be used to answer questions?•What are the different data displays and how are they used?
Essential Questions:•How does mean, median, mode, and range, help you interpret data?
Essential Questions:•How do you use fractions, percents, and decimals to represent probability?•How do you determine if a game is fair or unfair?
•Essential Questions:•How do we use problem solving skills to reason mathematically and communicate connections throughout statistics?
Vocabulary:data, catagorical data, numerical data, value, varibles
Vocabulary:mean, median, mode, typical value, average, range, trend, outlier, data
Vocabulary:chance, outcome, impossible, certain, probability, likely, unlikely, maybe
Vocabulary:solve, compare, estimate, apply, analyze, strategies, arguments and proofs, evaluate, communicate


Let’s see what you know!
• In your summary tab, make a KWL chart. Fold in 3rds then fold top down. Watch me!
What I think I KNOW
What I WANT to learn
What I LEARNED
Math Unit 1
Populations and Samples

Unit 1 Lesson 1 Eyelets• In this lesson, students will study the number of eyelets in shoes in the classroom.
Students will collect data, organize data, graph data and analyze data on bar graphs.• Essential Question: How can data displays be used to answer questions?• What are the different data displays and how are they used?• Vocabulary
– categorical variable – Data – mode – numerical variable – values – variable
• Big Ideas– Variables – Values – Bar Graphs

Vocabulary You Need To Know
• Survey• variable• value• numerical variable• categorical variable• data• mode
Goals for the lesson
• Gather, organize, graph, and analyze data using variables, making data tables, and drawing bar graphs.
• Connect math and science to everyday life• Work cooperatively with others• Math can be fun
Brainstorm
WHAT IS A SURVEY???

What do we know from the data?
• DO you think the data will help convince Blanca’s mom that slip-ons are not fashionable?
• Would a graph help?• What the most common kind of shoe in
Blanca’s class?• What would the data look like if we surveyed
our school?

Blanca & Irma’s Data
0123456789
HighTops
LaceBoots
Slip-ons
# Of Pairs of Shoes

What is a variable?
• Things that change or vary in an experiment or survey
• Example: – kind of shoes – number of shoes
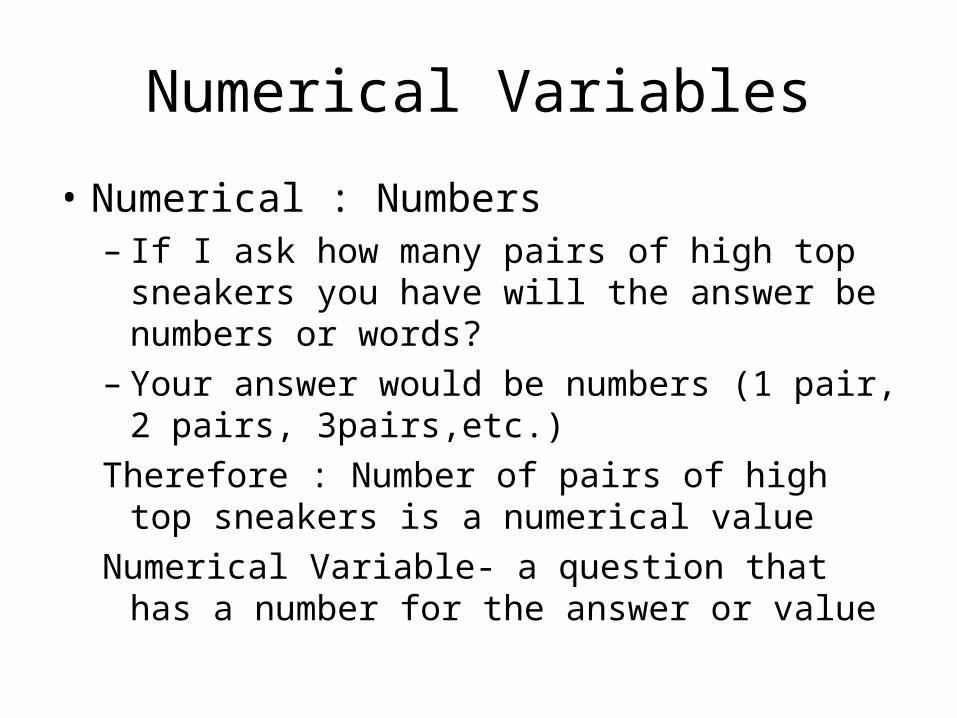
Numerical Variables
• Numerical : Numbers– If I ask how many pairs of high top sneakers you
have will the answer be numbers or words?– Your answer would be numbers (1 pair, 2 pairs,
3pairs,etc.)Therefore : Number of pairs of high top sneakers is a
numerical value Numerical Variable- a question that has a number
for the answer or value

Categorical Variables
• Categorical : Words NOT numbers– Type of shoe is a categorical variable– If I ask you what kind of shoes you have on, you
will give me words (sandals, tennis shoes, boots, etc)
Therefore, type of shoe is a categorical variableCategorical variable- a question with words for the
answers or values
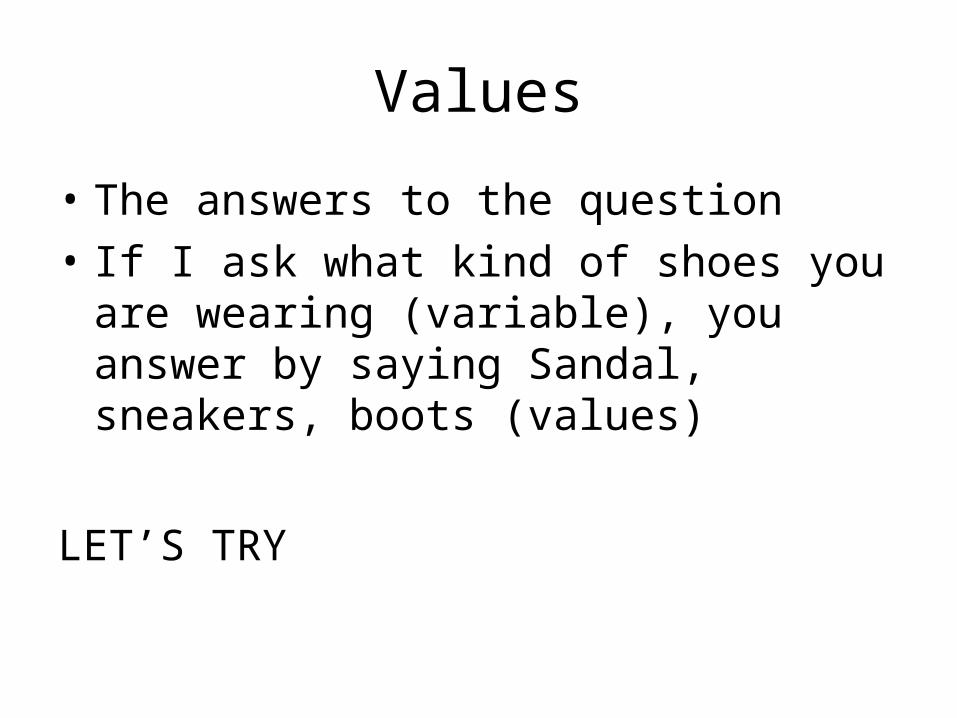
Values
• The answers to the question• If I ask what kind of shoes you are wearing
(variable), you answer by saying Sandal, sneakers, boots (values)
LET’S TRY
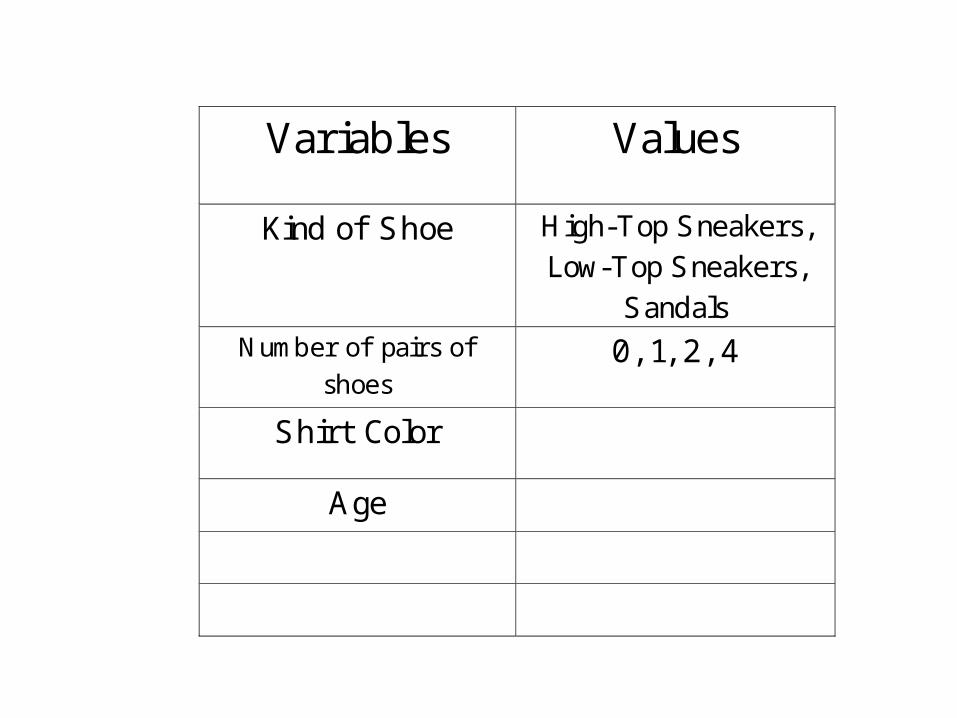
Variables Values
Kind of Shoe High-Top Sneakers, Low-Top Sneakers,
Sandals Number of pairs of
shoes 0, 1, 2, 4
Shirt Color
Age
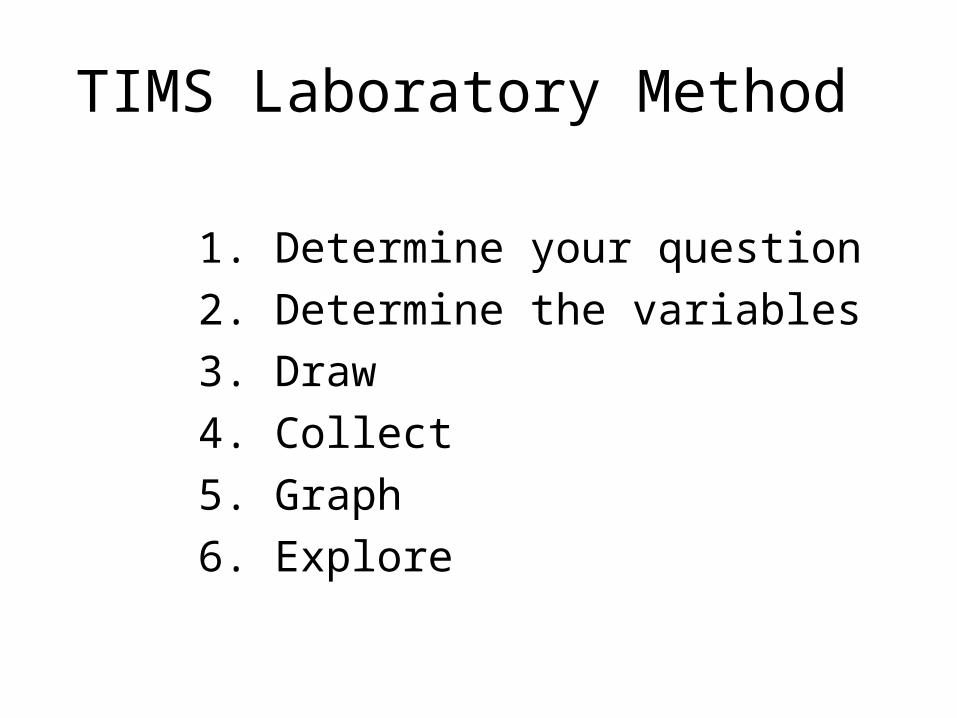
TIMS Laboratory Method
1. Determine your question 2. Determine the variables 3. Draw 4. Collect 5. Graph 6. Explore

Question of the Day
• How can I use a graph to analyze data?• Warm-up: DPP F• 1. Be ready to sing “Skip Counting”!• 2. Review vocabulary• 3. Continue with survey

Vocabulary Word Definition or Sentence Picture or Clue
Variable The quantity that changes.
Question in a survey ?EX: What color eyes do you have?
Value The possible outcome of a variable.
Variable: Color of EyesPossible values: green, brown, blue, hazel
Categorical Variable
Variables with values that are not numbers.
Color of EyesKind of favorite foodsDays of the week
Numerical Variable
Variables with values that are numbers
Number of animalsNumber of siblingsNumber of eyelets
Data Information collected in a survey
8 people have 2 siblings10 people have 22 eyelets3 people have 1 animal
Let’s Begin
How many eyelets are on the shoes of the students in your class?
What are the variables?Number of Eyelets
Number of Pairs of Shoes

Let’s Draw
• Include both variables• Include possible values• LABEL EVERYTHING!
Collect the Data
E Number of Eyelets
P Pairs of Shoes
How can I use a graph to analyze data?
• 9-1-10– Warm-up: Compare your homework with your
partner. Do your charts and or graph look alike or different?
1.Check the data (slide)2.Analyze the data3.Describe the graph
–

Let’s Check The Data
• Did we include everyone?• How do we know?

Graph the Data
• All graphs must include:– Title– Label both Axis with the correct values
and variables– Values must be equally spaced on the
axis– Put the value 0 where the axis meet
What will we do in math today?
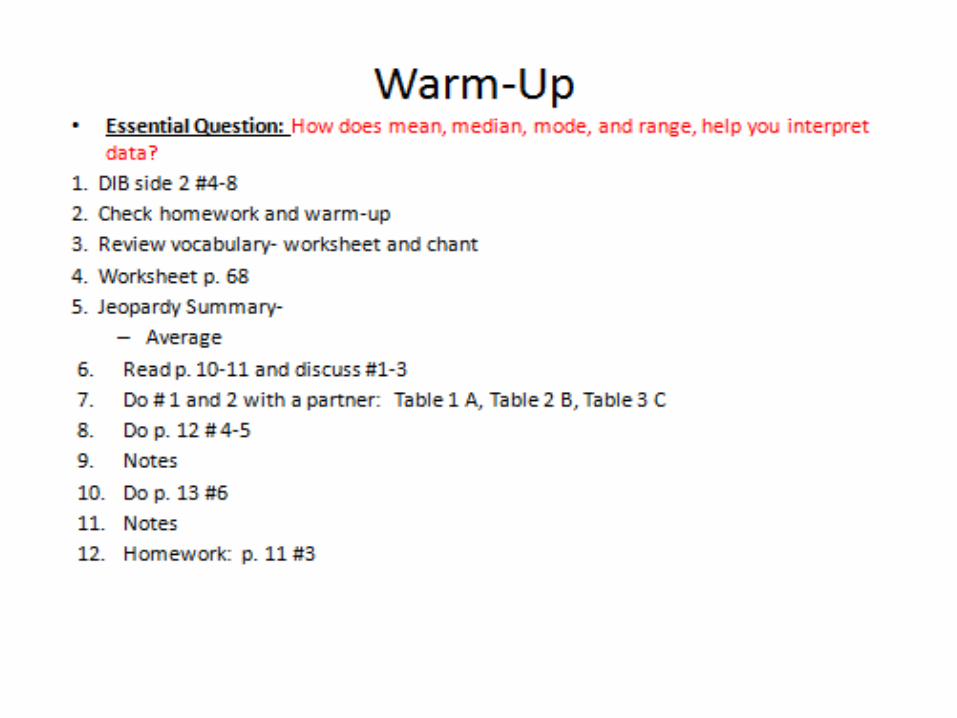
• Question of the Day: How do I use a graph to analyze data?
• Warm-up: Drop in the Bucket worksheet side 1 problems #7 and 8 only
• Worksheet p. 63-65• Homework: DPP H

Explore: Analyze the Data
• How many have 20 eyelets? 8? 0?• What is the MODE? (most common
number of eyelets)• What are the values for number of
eyelets?• What do we notice about those values?• Alexis said she had 14 eyelets on her
pair of shoes. Do you think she is correct? Why or why not?

Describing the graph using words. 4 things to include:
• How many bars are on the graph?• What is the tallest and shortest bar?• Where are the bars located?
– Beginning of the graph– Middle of the graph– End of the graph
• What is the mode (tallest bar) on the graph?
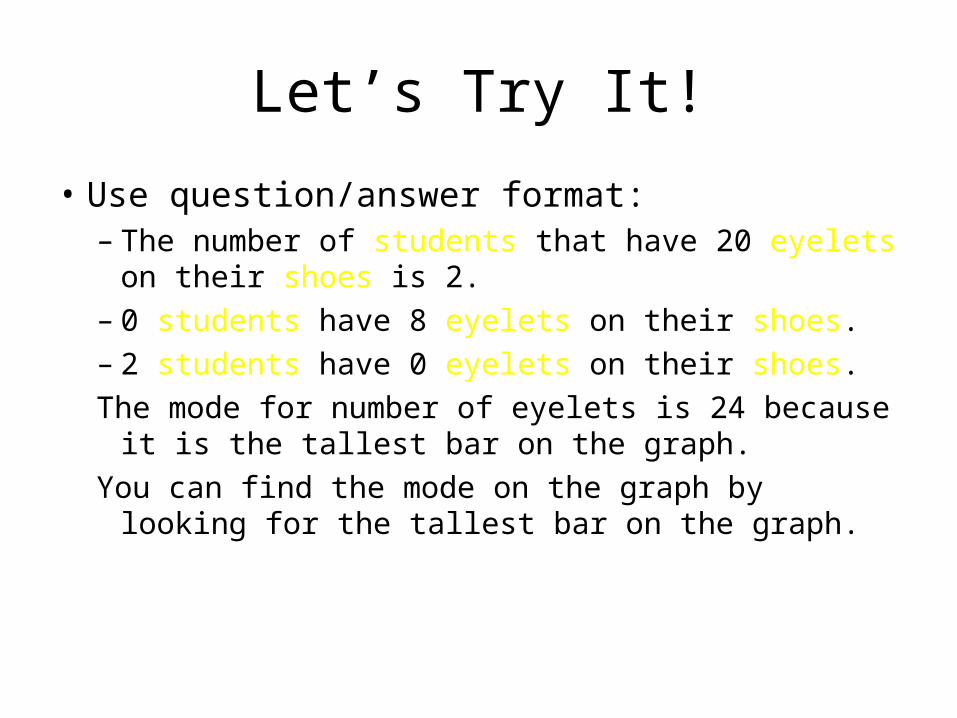
Let’s Try It!
• Use question/answer format:– The number of students that have 20 eyelets on
their shoes is 2.– 0 students have 8 eyelets on their shoes.– 2 students have 0 eyelets on their shoes.The mode for number of eyelets is 24 because it is
the tallest bar on the graph.You can find the mode on the graph by looking for
the tallest bar on the graph.
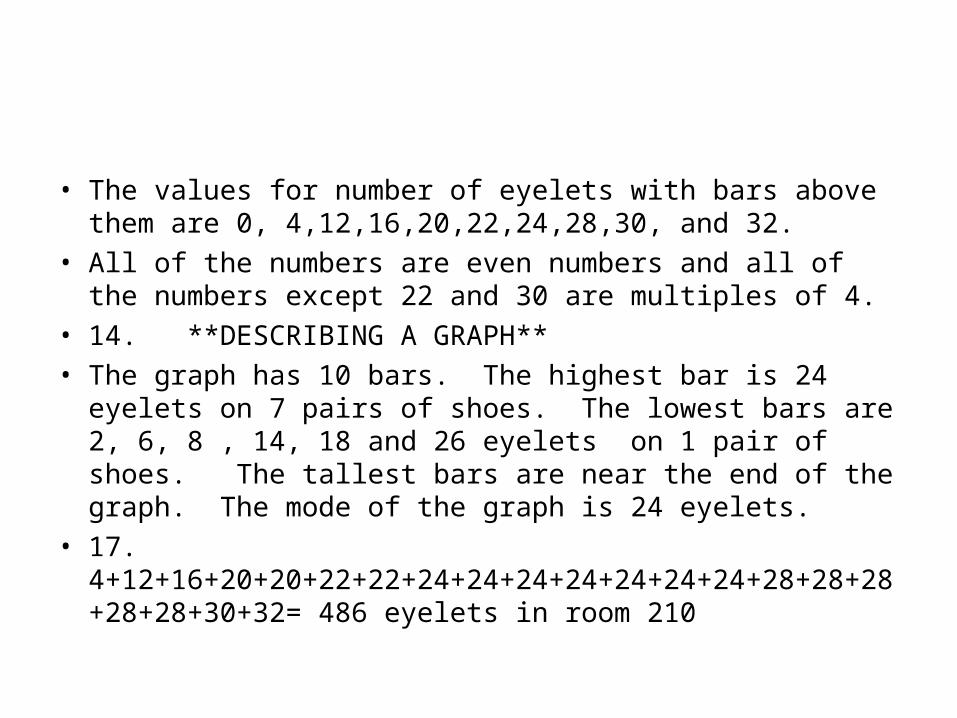
• The values for number of eyelets with bars above them are 0, 4,12,16,20,22,24,28,30, and 32.
• All of the numbers are even numbers and all of the numbers except 22 and 30 are multiples of 4.
• 14. **DESCRIBING A GRAPH** • The graph has 10 bars. The highest bar is 24 eyelets on 7 pairs
of shoes. The lowest bars are 2, 6, 8 , 14, 18 and 26 eyelets on 1 pair of shoes. The tallest bars are near the end of the graph. The mode of the graph is 24 eyelets.
• 17. 4+12+16+20+20+22+22+24+24+24+24+24+24+24+28+28+28+28+28+30+32= 486 eyelets in room 210

Describe the Eyelets graphs for:
• A professional basketball team in uniform.• The basketball team wears high top sneakers which have a lot eyelets. There would not be a lot of bars
because they all wear the same type of shoe. The tallest bars would be at the end of the graph.
• Vacationers on a beach• Most people wear flip-flops to the beach, so the tallest
bars will be at the beginning with 0 eyelets. Some people will wear sneakers, so there will be some eyelets shown on the graph.
• Where would the tallest bars be on the graph? • Would there be many bars or just one or two?

Questions
• What is the total number of eyelets on all the shoes of all the students in your class?
• 486 eyelets in room 210• Estimate (about) the total number of eyelets for the
entire 5th grade.• About 500 eyelets in room 210, so 500 x 2= 1,000.
There are about 1,000 eyelets in the 5th grade at SIMA.• How did you make your estimate?• How would the graph be different if you gathered data
from all the fifth graders in your school?
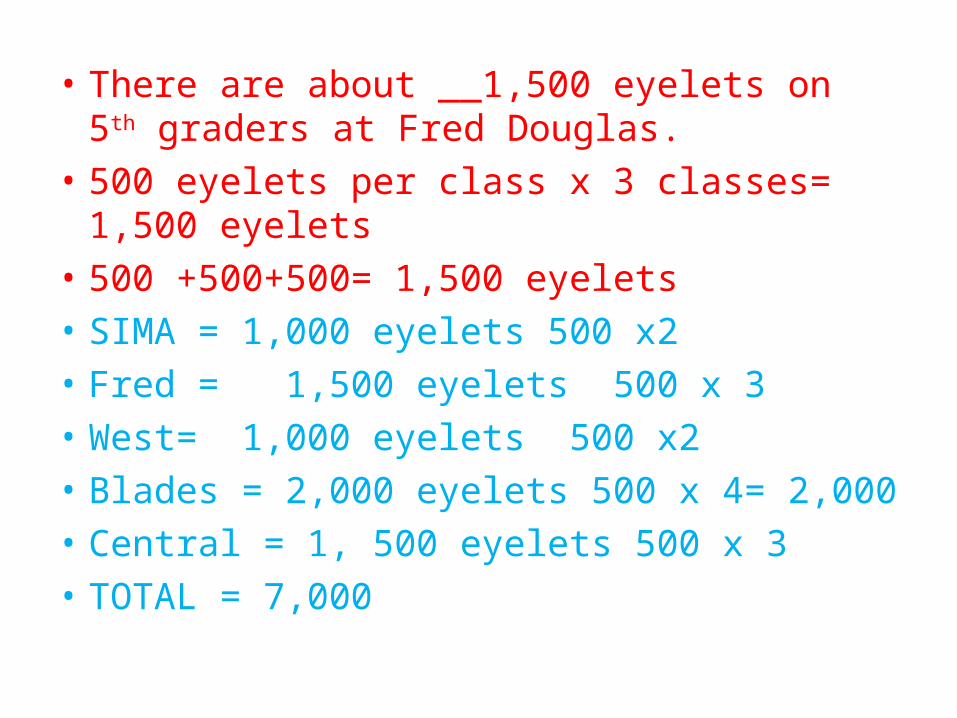
• There are about __1,500 eyelets on 5th graders at Fred Douglas.
• 500 eyelets per class x 3 classes= 1,500 eyelets• 500 +500+500= 1,500 eyelets• SIMA = 1,000 eyelets 500 x2• Fred = 1,500 eyelets 500 x 3• West= 1,000 eyelets 500 x2• Blades = 2,000 eyelets 500 x 4= 2,000• Central = 1, 500 eyelets 500 x 3• TOTAL = 7,000
Did we reach our goals?
• Gather, organize, graph, and analyze data using variables, making data tables, and drawing bar graphs.
• Connect math and science to everyday life• Work cooperatively with others• Math can be fun
Think and Write About It!
• What would happen if some students counted the eyelets on only one shoe while other students counted the eyelets on both sides?– Write your response in your math journal.– Include your answer to the question and support
your answer with facts and examples.– Remember to strive for five!

How will my response be graded?
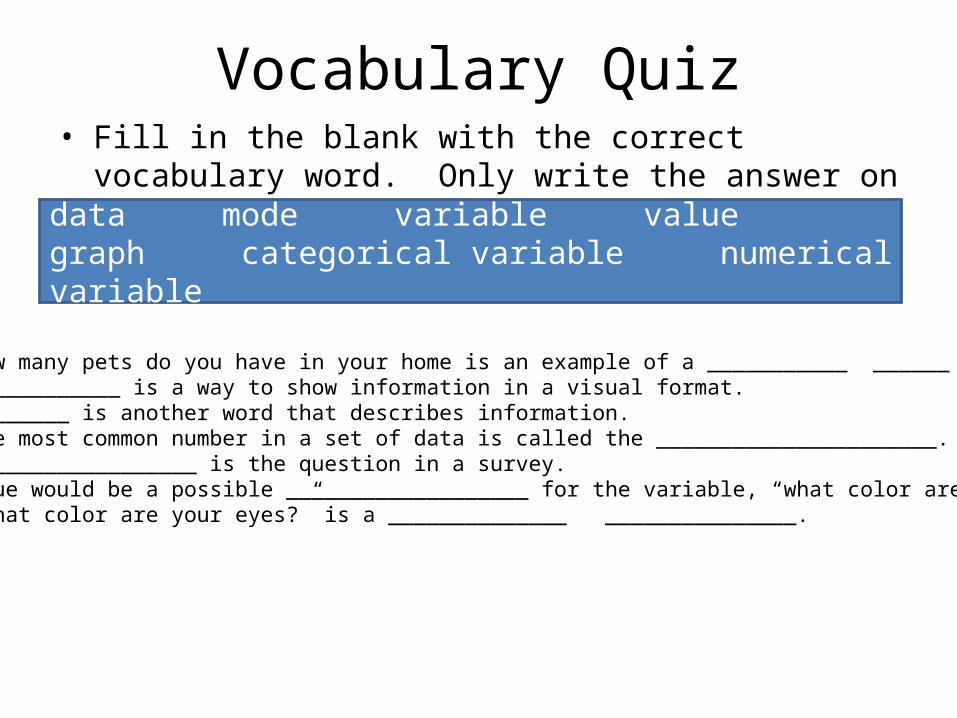
Vocabulary Quiz• Fill in the blank with the correct vocabulary word. Only write
the answer on your paper.
data mode variable value graph categorical variable numerical variable
1. How many pets do you have in your home is an example of a ___________ ______2. A __________ is a way to show information in a visual format.3. ________ is another word that describes information.4. The most common number in a set of data is called the ______________________.5. A ________________ is the question in a survey. 6. Blue would be a possible ___________________ for the variable, “what color are your eyes?7. “What color are your eyes?” is a ______________ _______________.
Big Idea:In the real world, people create and analyze various data displays in order to draw conclusions about the data.
Unit Essential Question:What makes a data representation
useful?
Concept:Data Collection
Concept:Data Analysis
Concept:Probability
Concept:Problem Solving
Essential Questions:•How can data displays be used to answer questions?•What are the different data displays and how are they used?
Essential Questions:•How does mean, median, mode, and range, help you interpret data?
Essential Questions:•How do you use fractions, percents, and decimals to represent probability?•How do you determine if a game is fair or unfair?
•Essential Questions:•How do we use problem solving skills to reason mathematically and communicate connections throughout statistics?
Vocabulary:data, catagorical data, numerical data, value, varibles
Vocabulary:mean, median, mode, typical value, average, range, trend, outlier, data
Vocabulary:chance, outcome, impossible, certain, probability, likely, unlikely, maybe
Vocabulary:solve, compare, estimate, apply, analyze, strategies, arguments and proofs, evaluate, communicate

Unit 1 Lesson 2 and 3 Analyzing Data• Lesson 2 and 3-Review: Representing Data and Analyzing Data• In this lesson, students will review bar graphing and use the median to average data. Students will
compare and analyze data in graphs. They use median, mode and average to represent data.• Essential Question: How does mean, median, mode, and range, help you interpret data?• Vocabulary
– average – median – numerical variable – value – Variable– Mode– mean
• Big Ideas– Bar graphs – Averages – Median– Analyzing graphs – Finding median – Using averages to represent data

Average
A number that can be used to represent a typical value in aset of data.
Median
Mode
Mean
7777
7 1,1,1,3,3,4,5,5,6,71 is the mode
1+2+4+5=12/4=3 mean is 3

Warm-Up

Vocabulary Word Definition or Sentence Picture or Clue
Average
Median
Mean
Mode
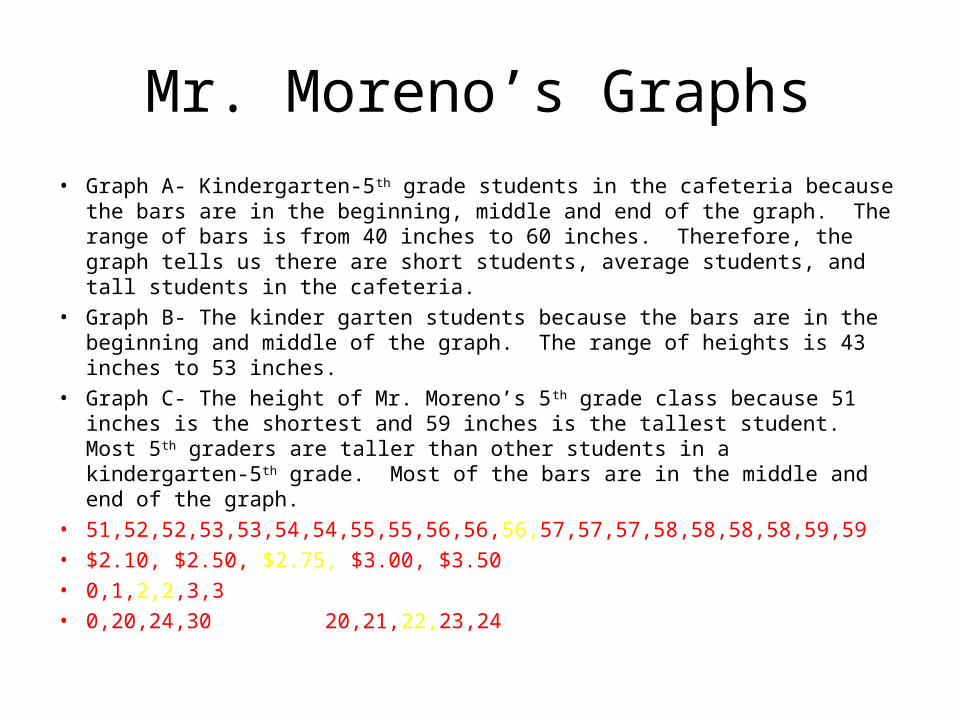
Mr. Moreno’s Graphs• Graph A- Kindergarten-5th grade students in the cafeteria because the bars
are in the beginning, middle and end of the graph. The range of bars is from 40 inches to 60 inches. Therefore, the graph tells us there are short students, average students, and tall students in the cafeteria.
• Graph B- The kinder garten students because the bars are in the beginning and middle of the graph. The range of heights is 43 inches to 53 inches.
• Graph C- The height of Mr. Moreno’s 5th grade class because 51 inches is the shortest and 59 inches is the tallest student. Most 5th graders are taller than other students in a kindergarten-5th grade. Most of the bars are in the middle and end of the graph.
• 51,52,52,53,53,54,54,55,55,56,56,56,57,57,57,58,58,58,58,59,59• $2.10, $2.50, $2.75, $3.00, $3.50• 0,1,2,2,3,3• 0,20,24,30 20,21,22,23,24


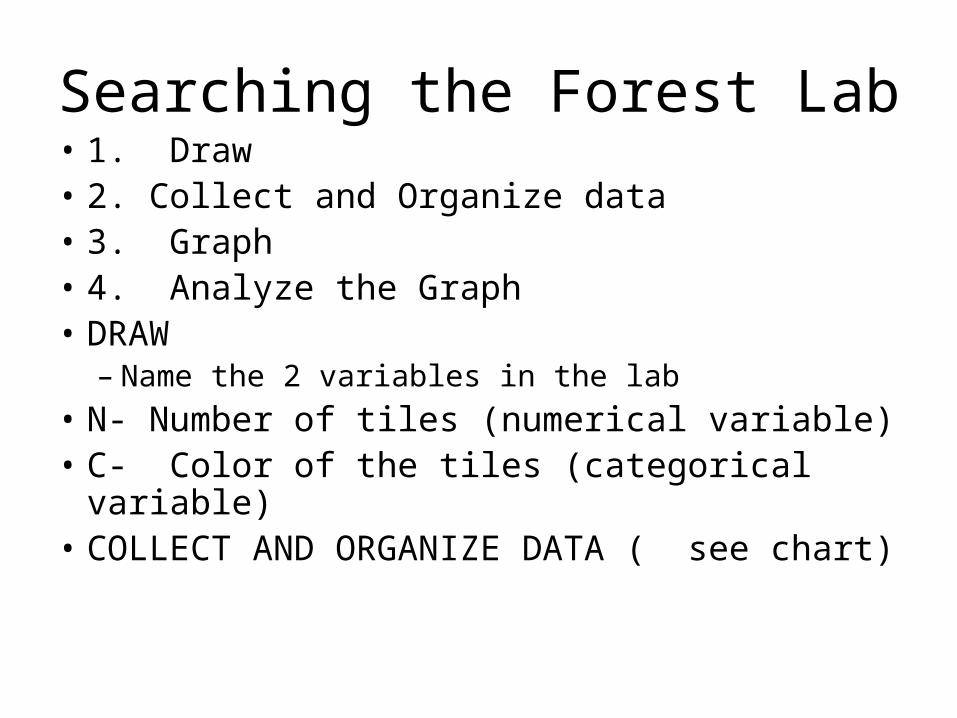
Searching the Forest Lab• 1. Draw• 2. Collect and Organize data• 3. Graph• 4. Analyze the Graph• DRAW
– Name the 2 variables in the lab• N- Number of tiles (numerical variable)• C- Color of the tiles (categorical variable)• COLLECT AND ORGANIZE DATA ( see chart)

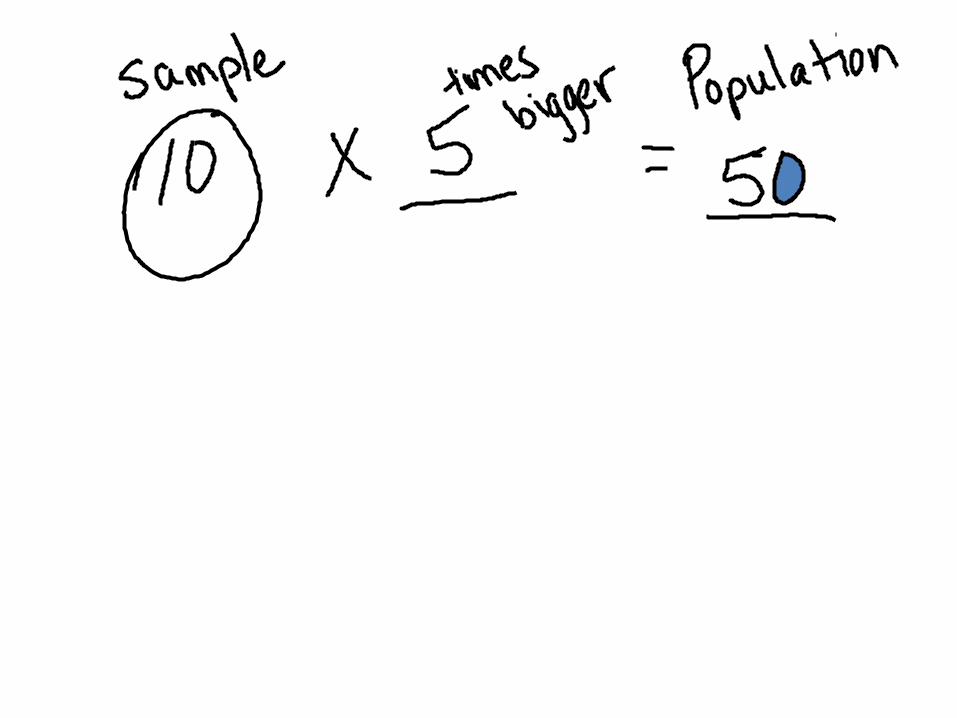
Essential Question: How do you use fractions, percents, and decimals to represent probability?
• Warm-up: DIB side 4 #1 and 2• Tear out workbook p. 47• Facts race- square numbers• Notes on square numbers• Vocabulary• Review Lab• Analyze data

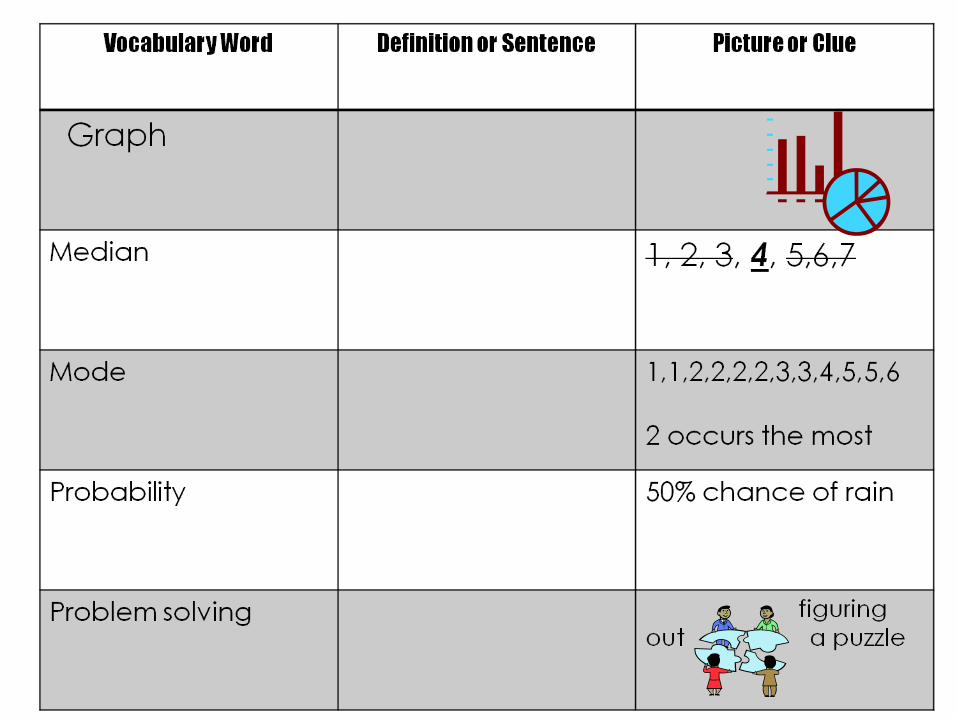
Vocabulary Word Definition or Sentence Picture or Clue

Vocabulary Word Definition or Sentence Picture or Clue
Median The number exactly in the middle of a set of data which respresents the average.
Estimate About or close to; prediction
Prediction Using background knowledge with what you have seen, heard or read to make an educated guess
Actual To find the exact answer
Fraction The number of parts out of the whole.

Vocabulary Word Definition or Sentence Picture or Clue
Probability How likely something is to happen out of 100%.
Problem Solving To figure a problem Solving a puzzle

Predication/Actual
• Color Prediction Actual• Blue 20 20• Green 0 0• Red 10 10• Yellow 20 20

Lin’s Data
• Red 20/50 20 out of 50• Green 10/50 10 out of 50• Blue 20/50 20 out of 50
Essential Question: How do you use fractions, percents, and decimals to represent probability?
• Warm-up: DIB side 4 #3 and 4• Check warm-up and homework• Review vocabulary• Graded assignment- Joselyn’s Wildflowers