unify markov model for rational design and synthesis of ... · unify markov model for rational...
TRANSCRIPT
1
Unify Markov model for rational design and synthesis of more safe drugs. Predicting multiple drugs side effects
Maykel Cruz-Monteagudo a, b, Humberto González-Díaz b, c, *, Miguel A. Cabrera-Pérez b, d, Reinaldo
Molina-Ruiz b, e and Yunierkis Pérez-Castillo b
a Applied Chemistry Research Center, Central University of “Las Villas”, Santa Clara, 54830, Cuba b Chemical Bioactives Center, Central University of “Las Villas”, Santa Clara, 54830, Cuba
c Department of Organic Chemistry, Faculty of Pharmacy, University of Santiago de Compostela, Santiago de Compostela, 15782, Spain
d Deparment of pharmacy and pharmaceutical technology, University of Velencia, Valencia, Spain. e Universitat Rostock, FB Chemie, Albert-Einstein-Str. 3a, D 18059 Rostock, Germany.
________________________________________________________________________________________ Abstract Most of present mathematical models for rational design and synthesis of new drugs consider just the molecular structure. In the present article we pretend extending the use of Markov Chain models to define novel molecular descriptors, which consider in addition other parameters like target site or biological effect. Specifically, this model takes into consideration not only the molecular structure but the specific biological system the drug affects too. Herein, it is developed a general Markov model that describes 19 different drugs side effects grouped in 8 affected biological systems for 178 drugs, being 270 cases finally. The data was processed by Linear Discriminant Analysis (LDA) classifying drugs according to their specific side effects, forward stepwise was fixed as strategy for variables selection. The average percentage of good classification and number of compounds used in the training/predicting sets were 100/95.8% for endocrine manifestations (18 out of 18)/(13 out of 14); 90.5/92.3% for gastrointestinal manifestations (38 out of 42)/(30 out of 32); 88.5/86.5% for systemic phenomena (23 out of 26)/(17 out of 20); 81.8/77.3% for neurological manifestations (27 out of 33)/(19 out of 25); 81.6/86.2% for dermal manifestations (31 out of 38)/(25 out of 29); 78.4/85.1% for cardiovascular manifestation (29 out of 37)/(24 out of 28); 77.1/75.7% for breathing manifestations (27 out of 35)/(20 out of 26) and 75.6/75% for psychiatric manifestations (31 out of 41)/(23 out of 31). Additionally a Back-Projection Analysis (BPA) was carried out for two ulcerogenic drugs to prove in structural terms the physic interpretation of the models obtained. This article develops a model that encompasses a large number of drugs side effects grouped in specifics biological systems using stochastic absolute probabilities of interaction (Aπk (j)) by the first time. ________________________________________________________________________________________
*corresponding address: Department of Organic Chemistry, Faculty of Pharmacy, University of Santiago de Compostela, Santiago de Compostela, 15782, Spain
E-mails: [email protected]
1. INTRODUCTION The spectrum of the undesirable effects of a chemical substance can be wide and not very defined. In
therapy, a drug produces typically numerous effects, but only one of them is generally looked for as main objective of the treatment; almost all the other ones are considered side effects of that drug for that therapeutic indication. Very few doctors believe that a drug, for trivial that are their actions, it can be exempt of producing toxic effects.
The use of terms like "safe" or "inoffensive" may cause unnecessary misunderstandings between the responsible organisms, the medical profession and the consumers of drugs, that is translated in a non justified trust and an expectation in the safety of the drugs by the public consumer of drugs. On the other hand, focus alarmists of the consequences of the side effects of the drugs affirm that thousands of patients die
2
unnecessarily due to secondary effects of the drugs. As it almost always happens, the truth is on the middle of the way between the two tops, but it is not known with accuracy, not even approximately, where (Goodman and Gilman, 2001).
A prominent goal in pharmaceutical industry is the development of new drugs to avoid more serious side effects. Consequently, novel paradigms for drugs discovery and synthesis have been introduced recently, based on the ability of large chemicals libraries and robotic system for bioassays. This system of high-throughput biochemical assays allow for the synthesis and testing of hundreds of compounds each day (Lutz et al., 1996).
During last year, the pharmaceutical industries have reoriented their research strategies in order to give more attention to those mathematical methods that permit the “rational” selection or design and synthesis of novel compounds whit the desired biological properties (Briggs et al., 1996; Wess, 1996). In these sense, Quantitative Structure-Toxicity Relationships (QSTR) are used as a predictive tools for a preliminary evaluation of the hazard of chemical compounds by using a computer aided mathematical models (Cronin, 1998; Lewis, 1992; Cronin and Dearden, 1995). These mathematical models represent an alternative to the “real” world of assaying chemical compounds for determining their toxicological properties on live organisms in the laboratory avoiding the expensive, time-consuming and in many cases animal aggressive bioassays, which are now made only after preliminary predictions with computational models (Dearden et al., 1995; Roberts, 1987).
In general, González M.P. et al., have recently discussed that QSTR mathematical models can be applied to congeneric and non-congeneric data sets of compounds. The first permits the understanding of specific biological mechanism of toxic action for molecules structurally related as well as to identify the different toxicological power of groups or substituents in such chemicals. On the other hand, the use of QSTR models for non-congeneric data sets permits the generalization of such mechanism to structurally diverse compounds as well as the identification of possible toxicophores of different structural nature (González et al., 2004a, b, c; Morales et al., 2004).
On the other hand, Markov models are well-known mathematical tools for characterizing biomolecules structure. Markov models have been used for analyzing biological sequence data and they have been used to find new genes from the open reading frames (Vorodovsky et al., 1994, 1995). Another use of these mathematical models is data-based searching and multiple sequence alignment of protein families and protein domains. Protein turn types and sub-cellular locations have been successfully predicted (Krogh et al., 1994; Chou, 1997; Yuan, 1999; Hua and Sun, 2001). Hubbard and Park (Hubbard and Park, 1995) used amino acid sequence-based hidden Markov Models to predict secondary structures. In this sense, Krogh et al. (Krogh et al., 1994) have also proposed a hidden Markov Model architecture. In addition, Markov’s stochastic process has been used for protein folding recognition (Di Francesco et al., 1999). This approach can also be used for the prediction of protein signal sequences (Chou, 2001, 2002). Another seminar works can be found related to the application of Markov Chains (MCH) Theory to Proteomic and Bioinformatics. Chou applied Markov Models to predict beta turns and their types, and the prediction of protein cleavage sites by HIV protease (Chou, 1993). Anyhow, have not been very used Markov models to develop QSTR studies and predict drugs side effect.
In this connection, our group has introduced elsewhere a physically meaningful mathematical approach based on Markov models (MARkovian CHemicals IN SIlico DEsign: MARCH-INSIDE) encoding molecular backbones information, with several applications in mathematical biology. It allowed us introducing matrix invariants such as stochastic entropies and spectral moments for the study of molecular properties. Specifically, the stochastic spectral moments introduced by our group have been largely used for small molecules QSAR problems including design of fluckicidal, anticancer and antihypertensive drugs. Applications to macromolecules have been restricted to the field of RNA without applications to proteins (González-Díaz et al., 2002a, b, 2003a, b, c, 2004a). In addition, the entropy like molecular descriptors has demonstrated flexibility in many mathematical biology problems such as: estimation of anticoccidial activity, modeling the interaction between drugs and HIV-packaging-region RNA, and predicting proteins and virus

3
activity (González-Díaz et al., 2003d, 2004b, c, d; Ramos de A., 2004a, b). In the field of QSTR our group has reported the first model to predict chemically-induced agranulocytocis by small-to-medium sized drug like molecules (González-Díaz et al., 2003e).
However, in spite of several QSTR studies reported there have not been seriously studied almost drug side effects. Unfortunately, the more than 1 500 molecular descriptors reported have not only been applied to study drug side effects but have very disperse theoretical definition and some times not very well established physical definition. Consequently, becomes a forefront problem applying molecular descriptors to drugs side effect study but at the same time represent them in unified mathematical framework giving better opportunities for physicochemical interpretation (Todeschini and Consonni, 2000). In the current paper we attempt to develop a more serious physicochemical interpretation of the MARCH-INSIDE descriptors in thermodynamic terms, which allow us to contrast the relationship among these descriptors and topologic, flexibility, and quadratic molecular descriptors (Kubinyi et al., 1990). These new interpretation allows us built up a molecular thermodynamic basis in free energy terms (Villa et al., 2003) for predicting how likely a given drugs cause a specific side effect with respect to others side effects. This approach is able to take into consideration not only the molecular structure of the drug but the specific system the drug affects too. In particular will be possible correlate more than one property at time, in our case, drugs side effects, making it superior weigh against most of molecular descriptors which simply permit to correlate no more than one property at time, this advantage may be appropriately used in preliminary biological, pharmacological or toxicological studies, specially for comparative studies in early drugs develop stages. In the present work were modeled 19 multiple drugs side effects using a non-congeneric data set of 270 cases represented by 178 drugs of diverse molecular structure.
2. METHODS
2.1. Markov Thermodynamics for drug-target step-by-step interaction Let be, a hypothetical situation in which a drug molecule is free in the space at an arbitrary initial time (t0).
It is then interesting to develop a simple stochastic model for a step-by-step interaction between the atoms of a drug molecule and a molecular receptor in the time on the induction of a side effect. For the sake of simplicity, we are going to consider from now on a general structureless receptor. Understanding as structure-less molecular receptor a model of receptor which chemical structure it is not taken into consideration. The initial free energy of the drug-receptor interaction (0gj) is a state function so a reversible process of interaction may be separated on several elemental interactions between the j-th atom and the receptor (Villa et al., 2003). Afterwards, interaction continues and we have to define the free energy of interaction between the j-th atom and the receptor given that i-th atom has been interacted at previous time tk (kgij). In particular, immediately after of the first interaction (t0 = 0) takes place an interaction 1gij at time t1 = 1 and so on. So, one can suppose that, atoms begin its interaction whit the structureless molecular receptor binding to this receptor in discrete intervals of time tk. However, there are several alternative ways in which such step-by-step binding process may occur. Figure 1 illustrates this idea.

4
+ O C
H
O
H
O C
H
O
H
O
CH O
H
O
C H
OH
OC
H
OH
OC
H
OH
OC
H
O
H
O
CH
O H OC
H
O
H
OC
H
O
H
Step 2
Step 1 Step 2 Step 3
Step 0 Step 1
Step 0
Step 3
Step 0 Step 1 Step 2 Step 3
+ O C
H
O
H
+ O C
H
O
H
Figure1. Stochastic drug-target step-by-step interaction The free energy 0gj will be considered here as a function of the absolute temperature (T) of the system and
the equilibrium local constant of interaction between the j-th atom and the receptor (0kj) (Villa et al., 2003). Additionally, the energy 1gij can be defined by analogy as 1k ij:
( ) ( )2log1log 1100ijijjj kTRgkTRg ⋅⋅−=⋅⋅−=
The present approach to drug-receptor interaction has two main drawbacks. The first is the difficulty on the definition of the constants. In this work, we solve the first question estimating 0kj as the rate of occurrence (nj) of the j-th atom on molecules inducing the effect under study by molecule-receptor interaction with respect to the number of atoms in the molecule (n). With respect to 1k ij we must taking into consideration that once the j-th atom have interacted the preferred candidates for the next interaction are such i-th atoms bound to j by a chemical bond. Both constants can be then written down as:
( ) ( )4enn
k3enn
k TRg
ijji1TR
g
j0
ij1
j0
⋅−
⋅−
=⋅α=== jj
Where, αij are the elements of the atom adjacency matrix, nj, n, 0gj, 1gij have been defined in the paragraph above, and R is the gases universal constant.
The second problem relates to the description of the interaction process at higher times tk > t1. Therefore, a Markov chains model (MCH) (González-Díaz et al., 2002a, b, 2003a, b, c, 2004a) enables a simple calculation of the probabilities with which the drug-receptor interaction takes place in the time until the studied effect is achieved. In this work we are going to focus on drugs side effects. As depicted in Figure 1, this model deals with the calculation of the probabilities (kπij) with which any arbitrary molecular atom j-th bind to the structureless molecular receptor given that other atom i-th has been bound before; along discrete

5
time periods tk (k = 1, 2, 3, …); (k = 1 in grey), (k = 2 in blue) and (k = 3 in red) throughout the chemical bonding system.
The procedure described here considers as states of the MCH the atoms of the molecule. We can built up the corresponding absolute initial probability vector Aπ0 and the stochastic matrix 1Π, which has the elements Aπ0 (j) and 1πij respectively. The elements Aπ0 (j) of the above mentioned vector Aπ0 constitutes the absolute probabilities with which the j-th atom interact with the receptor at the initial time with respect to any atom in the molecule:
( ) ( )( )
( )51
1
11110
00
∑∑∑∑====
=⋅
⋅=== m
aa
jm
aa
j
m
a
a
j
m
a
A
n
n
nn
nn
nn
nn
ag
jgjπ
Where, a represents all the atoms in the molecule including the j-th, na is the rate of occurrence of any atom a including the j-th with value nj. On the other hand, the matrix is called the 1-step drug-target interaction stochastic matrix 1Π is built too as a squared table of order n, where n represents the number of atoms in the molecule. The elements (1πij) of the 1-step drug-target interaction stochastic matrix are the binding probabilities with which a j-th atom bind to a structureless molecular receptor given that other i-th atoms have been interacted before at time t1 = 1 (considering t0 = 0):
( )61
1
1
1
1
1
1
1
1
1
1
11
∑∑∑∑+
=
+
=
+
=
+
=
⋅
⋅=
⋅⋅
⋅⋅=
⋅
⋅== δδδδ
α
α
α
α
α
απ
aaia
jij
aaia
jij
a
aia
jij
aia
ijij
n
n
nn
nn
nn
nn
g
g
Where, δ is the valence of the j-th atom. The method arranges all the Aπ0 (j) values in a vector (Aπ0) and all the 1πij constants as a squared table (1Π) of n x n dimension. The calculation of Aπ0 and 1Π is illustrated in Figure 2. By using, both Aπ0 and 1Π and Chapman-Kolgomorov equations one can describe the further evolution of the system, determining the average constant of interaction between the j-th atom and the receptor at higher times. Summing up all the constants of interaction for each atom we can derive the stochastic absolute probability of interaction (Aπk) between the drug and the receptor at a specific time:
( ) ( )∑∑∑ ⋅⋅=⋅⋅=Sr
kA
Sr
k
Sr
k jkA (7))()(1
00 ππ uΠπuΠπ AA
Where, Aπ0 is a 1 x n vector whose elements are the Aπ0 (j) probabilities for the n atoms in the molecule and kΠ are the kth natural powers of the 1Π matrix and u is an unitary vector. As the sum up to all atoms in the molecule of Aπk(j) is ever equal to 1, the atoms were groped in sets or classes (sr): s0 = CSat = Saturated carbon atom; s1 = CInst = Unsaturated carbon atom; s2 = Hal = Halogens; s3 = Het = Heteroatoms; or s4 = HX = Hydrogen bonded to heteroatom in order to describe local aspects of molecular structure.
Such a model is stochastic per se (probabilistic step-by-step atom-receptor interaction in time) but also considers molecular connectivity (the step-by-step atom union in space throughout the chemical bonding system). The selection of a Markov chain process (Gnedenko, 1978; Freund and Poschel, 2000) is not arbitrary. Due to atoms interactions are not dependent of previous atoms interactions we can affirm that a MCH-based model of a stochastic drug-target step-by-step interaction obeys perfectly to the main characteristics of MCH (a memoryless property). This implies that the probability of the occurrence of an event (atom union) does not depend on the history of the process. In other words, such a model will not depend of atoms unions at previous times.

6
2.2. Data set methodology The data set was conformed by series of the more frequently used drugs which produce side effects in
different human organs systems, being these ones extensively tested in clinic and the side effects reported obtained by pharmacovigilance studies. The use of marketed drugs in data set confers a high confidence about the side effect reported. The set of drugs where extracted from a report of drugs side effects listed in literature (Garcia and Horga de la Parte, 1994). The data set was conformed by 19 different drugs side effects grouped in 8 affected biological systems for 178 structurally diverse drugs (see Figure 2.), being 270 cases finally, taking into consideration that all side effects groups were statistically represented having each one at least 7 drugs in order to perform a balanced training series.
O
OH
OH
O
OH
O
OH
O
HO
OH
H2N
OH
OH
OHOH
O
OHO
PolienesAmphotericin B
OH
N
OH O
OH
HO
O
NH2
OOH
Tetracyclines(Tetracycline)
O
HN
N
NH
O
O NH
O
O
N
OH
HO
OOH
HO
N
H2N
OH
HN
HN
O
OOHOH
NH2O
NH2O
NH2
NH
O
HO
NH2
ON
S
N
S
HNO
S+
Polypeptides(Bleomycin)
HO
O
O
OO
HOOO
HOOO
HOHO Cardiotonic glycosides
(Digitoxine)
N
NOH
O
OOO
O
O
NH
O
ON
OH
Vinca Alkaloids(Vincristine)
OHAlcohols
(Ethyl Alcohol)
N
HO
O
N
Quinine derivatives(Quinidine)
O
CH3
HO OH
O
OH
H H
H
Steroids(6-methylprednisolone)
NN
O O
OH
Quinolones(Nalidixic Acid)
Penicyllins(Amoxicillin)
NS
O
NH
HO O
O
NH2
HON
N
Cl
O
Benzodiazepines(Diazepam)
N
S
O
NH
HO O
S
ON
S
N
N
N
NN
Cephalosporins(Cefazolin)
N
Tricyclic Antidepressants(Amitriptyline)
SNH
O O N
H2N
O
Sulphonamides(Co-Trimoxazole)
Figure 2. Random, but not exhaustive sample of the molecular families of compounds studied
7
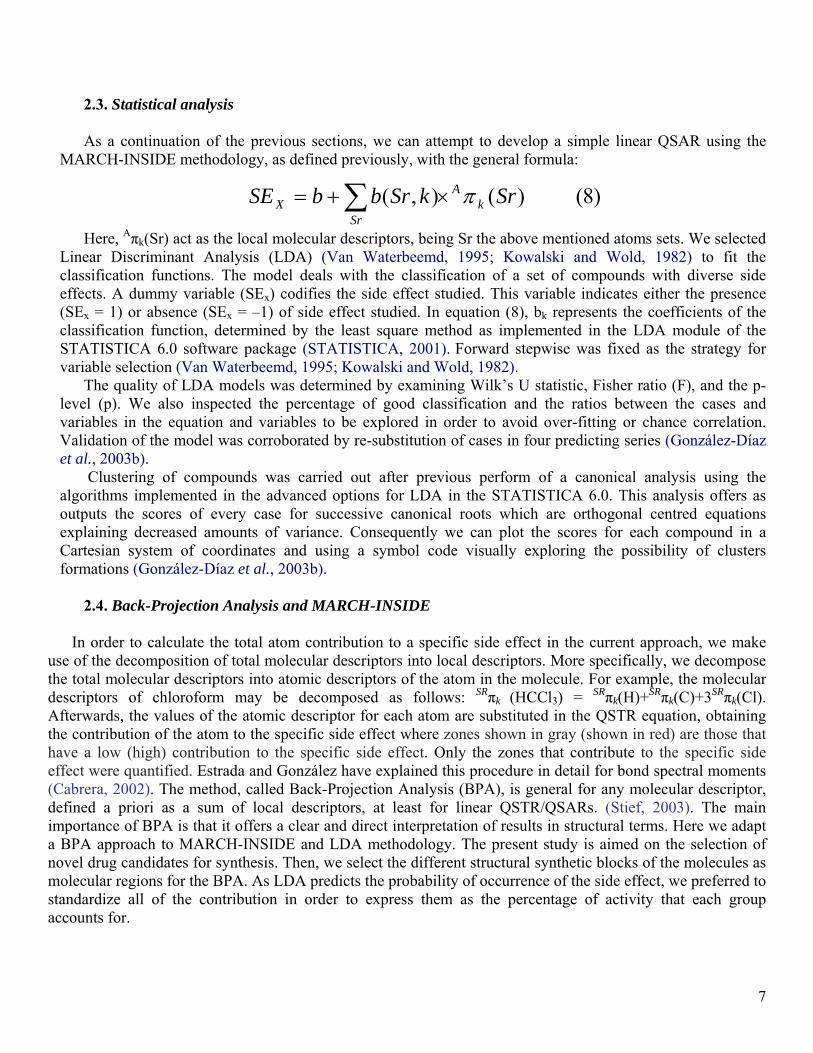
2.3. Statistical analysis As a continuation of the previous sections, we can attempt to develop a simple linear QSAR using the
MARCH-INSIDE methodology, as defined previously, with the general formula:
∑ ×+=Sr
kA
X SrkSrbbSE )8()(),( π
Here, Aπk(Sr) act as the local molecular descriptors, being Sr the above mentioned atoms sets. We selected Linear Discriminant Analysis (LDA) (Van Waterbeemd, 1995; Kowalski and Wold, 1982) to fit the classification functions. The model deals with the classification of a set of compounds with diverse side effects. A dummy variable (SEx) codifies the side effect studied. This variable indicates either the presence (SEx = 1) or absence (SEx = –1) of side effect studied. In equation (8), bk represents the coefficients of the classification function, determined by the least square method as implemented in the LDA module of the STATISTICA 6.0 software package (STATISTICA, 2001). Forward stepwise was fixed as the strategy for variable selection (Van Waterbeemd, 1995; Kowalski and Wold, 1982).
The quality of LDA models was determined by examining Wilk’s U statistic, Fisher ratio (F), and the p-level (p). We also inspected the percentage of good classification and the ratios between the cases and variables in the equation and variables to be explored in order to avoid over-fitting or chance correlation. Validation of the model was corroborated by re-substitution of cases in four predicting series (González-Díaz et al., 2003b).
Clustering of compounds was carried out after previous perform of a canonical analysis using the algorithms implemented in the advanced options for LDA in the STATISTICA 6.0. This analysis offers as outputs the scores of every case for successive canonical roots which are orthogonal centred equations explaining decreased amounts of variance. Consequently we can plot the scores for each compound in a Cartesian system of coordinates and using a symbol code visually exploring the possibility of clusters formations (González-Díaz et al., 2003b).
2.4. Back-Projection Analysis and MARCH-INSIDE
In order to calculate the total atom contribution to a specific side effect in the current approach, we make use of the decomposition of total molecular descriptors into local descriptors. More specifically, we decompose the total molecular descriptors into atomic descriptors of the atom in the molecule. For example, the molecular descriptors of chloroform may be decomposed as follows: SRπk (HCCl3) = SRπk(H)+SRπk(C)+3SRπk(Cl). Afterwards, the values of the atomic descriptor for each atom are substituted in the QSTR equation, obtaining the contribution of the atom to the specific side effect where zones shown in gray (shown in red) are those that have a low (high) contribution to the specific side effect. Only the zones that contribute to the specific side effect were quantified. Estrada and González have explained this procedure in detail for bond spectral moments (Cabrera, 2002). The method, called Back-Projection Analysis (BPA), is general for any molecular descriptor, defined a priori as a sum of local descriptors, at least for linear QSTR/QSARs. (Stief, 2003). The main importance of BPA is that it offers a clear and direct interpretation of results in structural terms. Here we adapt a BPA approach to MARCH-INSIDE and LDA methodology. The present study is aimed on the selection of novel drug candidates for synthesis. Then, we select the different structural synthetic blocks of the molecules as molecular regions for the BPA. As LDA predicts the probability of occurrence of the side effect, we preferred to standardize all of the contribution in order to express them as the percentage of activity that each group accounts for.
8
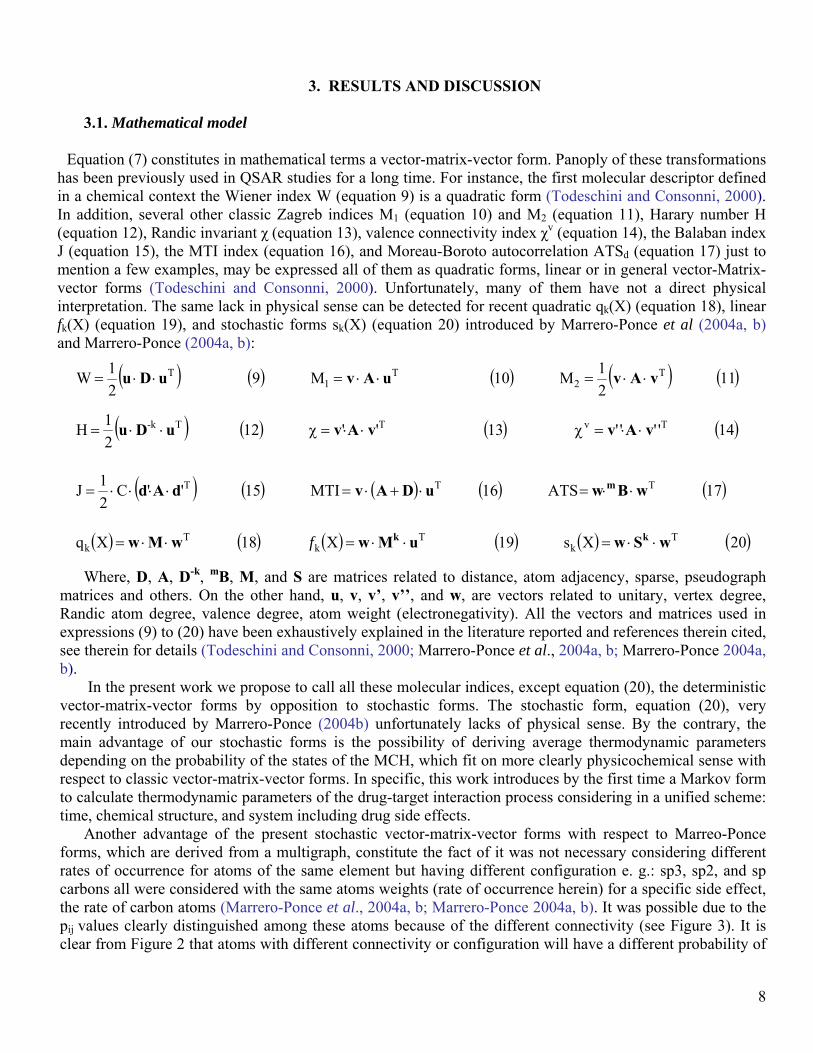
3. RESULTS AND DISCUSSION
3.1. Mathematical model
Equation (7) constitutes in mathematical terms a vector-matrix-vector form. Panoply of these transformations has been previously used in QSAR studies for a long time. For instance, the first molecular descriptor defined in a chemical context the Wiener index W (equation 9) is a quadratic form (Todeschini and Consonni, 2000). In addition, several other classic Zagreb indices M1 (equation 10) and M2 (equation 11), Harary number H (equation 12), Randic invariant χ (equation 13), valence connectivity index χv (equation 14), the Balaban index J (equation 15), the MTI index (equation 16), and Moreau-Boroto autocorrelation ATSd (equation 17) just to mention a few examples, may be expressed all of them as quadratic forms, linear or in general vector-Matrix-vector forms (Todeschini and Consonni, 2000). Unfortunately, many of them have not a direct physical interpretation. The same lack in physical sense can be detected for recent quadratic qk(X) (equation 18), linear fk(X) (equation 19), and stochastic forms sk(X) (equation 20) introduced by Marrero-Ponce et al (2004a, b) and Marrero-Ponce (2004a, b):
( ) ( ) ( ) ( ) ( )
( ) ( ) ( ) ( )
( ) ( ) ( ) ( ) ( )
( ) ( ) ( ) ( ) ( ) ( )20Xs19X18Xq
17ATS16MTI15''C21J
14''''13''1221H
1121M10M9
21W
Tk
Tk
Tk
TTT
TvTTk-
T2
T1
T
wSwuMwwMw
wBwuDAvdAd
vAvvAvuDu
vAvuAvuDu
kk
m
⋅⋅=⋅⋅=⋅⋅=
⋅⋅=⋅+⋅=⋅⋅⋅⋅=
⋅⋅=χ⋅⋅=χ⋅⋅=
⋅⋅=⋅⋅=⋅⋅=
f
Where, D, A, D-k, mB, M, and S are matrices related to distance, atom adjacency, sparse, pseudograph matrices and others. On the other hand, u, v, v’, v’’, and w, are vectors related to unitary, vertex degree, Randic atom degree, valence degree, atom weight (electronegativity). All the vectors and matrices used in expressions (9) to (20) have been exhaustively explained in the literature reported and references therein cited, see therein for details (Todeschini and Consonni, 2000; Marrero-Ponce et al., 2004a, b; Marrero-Ponce 2004a, b).
In the present work we propose to call all these molecular indices, except equation (20), the deterministic vector-matrix-vector forms by opposition to stochastic forms. The stochastic form, equation (20), very recently introduced by Marrero-Ponce (2004b) unfortunately lacks of physical sense. By the contrary, the main advantage of our stochastic forms is the possibility of deriving average thermodynamic parameters depending on the probability of the states of the MCH, which fit on more clearly physicochemical sense with respect to classic vector-matrix-vector forms. In specific, this work introduces by the first time a Markov form to calculate thermodynamic parameters of the drug-target interaction process considering in a unified scheme: time, chemical structure, and system including drug side effects.
Another advantage of the present stochastic vector-matrix-vector forms with respect to Marreo-Ponce forms, which are derived from a multigraph, constitute the fact of it was not necessary considering different rates of occurrence for atoms of the same element but having different configuration e. g.: sp3, sp2, and sp carbons all were considered with the same atoms weights (rate of occurrence herein) for a specific side effect, the rate of carbon atoms (Marrero-Ponce et al., 2004a, b; Marrero-Ponce 2004a, b). It was possible due to the pij values clearly distinguished among these atoms because of the different connectivity (see Figure 3). It is clear from Figure 2 that atoms with different connectivity or configuration will have a different probability of

9
union to the structure-less molecular receptor in spite of having the same rate of occurrence. All these are the reasons for the selection in this work of our stochastic forms instead of others.
Structure:
N C C
O
Cl
21
Cyanoformyl chloride
5.7758.692000N10.5513.46713.46700C
014.93214.93214.76915.488C0014.5825.5660Cl0027.30205.775ONCCClO
2
1
21
1 =∏ Thr
25.56622.846000N50.13247.41247.41200C
065.44865.44876.43463.712C0014.5825.5660Cl0027.302025.566ONCCClO
2
1
21
1 =∏ Pat
4.5634.692000N8.1268.2558.25500C
014.95514.95512.34514.299C007.1734.5630Cl005.21904.563ONCCClO
2
1
21
1 =∏ PhD
Definition:
NCN
NC
CNCC
NNCC
C
NCC
CCCClO
C
CCClO
C
CCClOCl
CCClOO
ClC
C
ClCCl
CO
C
COO
++
++++++
++++++++++++
++
++
=∏
22
2000
2121
2
21
100
021
2
21
1
2121
001
1
10
001
101
1
N
C
C
Cl
O
NCCClO
2
1
21
Figure 3. Definition and calculation of Π1 matrix for a specific compound in three particular cases of side effects. The element symbol is used to denote the value of the rate of recurrence [i.e., Cl represents the rate of recurrence (nCl) of chlorine atom for the specific side effect]. Thr: Thromboembolism, Pat: Pancreatitis, PhD: Photodermatitis.
10
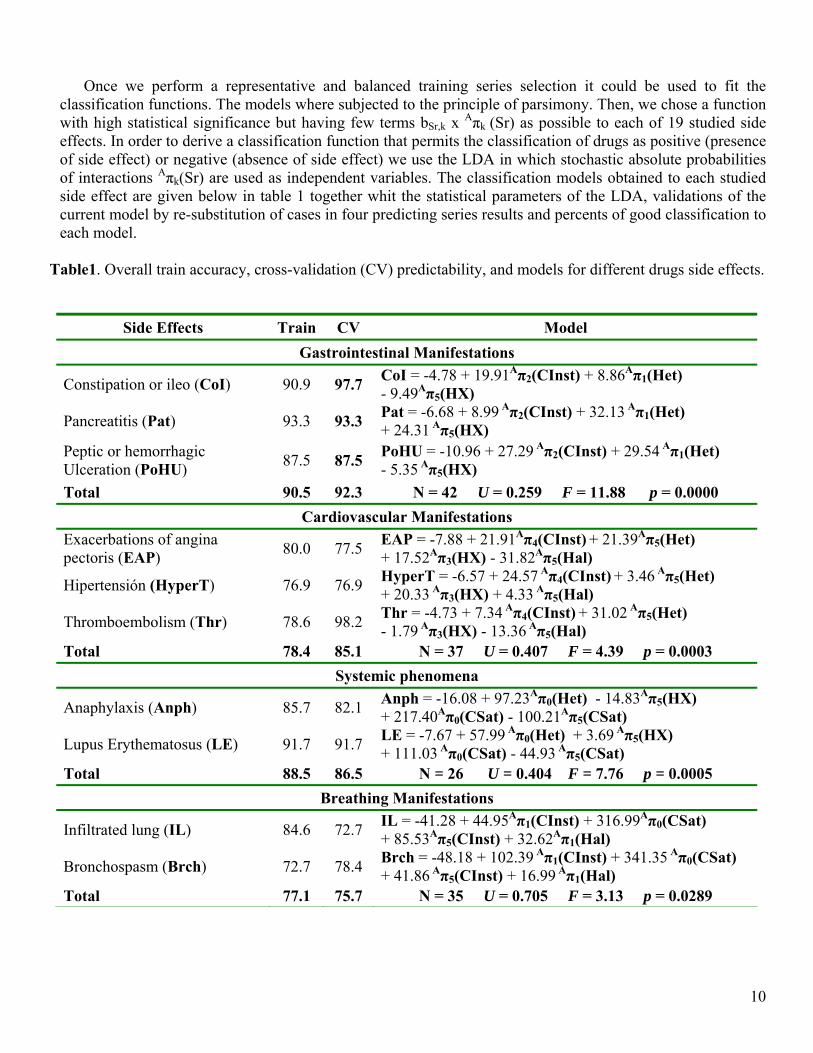
Once we perform a representative and balanced training series selection it could be used to fit the classification functions. The models where subjected to the principle of parsimony. Then, we chose a function with high statistical significance but having few terms bSr,k x Aπk (Sr) as possible to each of 19 studied side effects. In order to derive a classification function that permits the classification of drugs as positive (presence of side effect) or negative (absence of side effect) we use the LDA in which stochastic absolute probabilities of interactions Aπk(Sr) are used as independent variables. The classification models obtained to each studied side effect are given below in table 1 together whit the statistical parameters of the LDA, validations of the current model by re-substitution of cases in four predicting series results and percents of good classification to each model.
Table1. Overall train accuracy, cross-validation (CV) predictability, and models for different drugs side effects.
Side Effects Train CV Model Gastrointestinal Manifestations
Constipation or ileo (CoI) 90.9 97.7 CoI = -4.78 + 19.91Aπ2(CInst) + 8.86Aπ1(Het) - 9.49Aπ5(HX)
Pancreatitis (Pat) 93.3 93.3 Pat = -6.68 + 8.99 Aπ2(CInst) + 32.13 Aπ1(Het) + 24.31 Aπ5(HX)
Peptic or hemorrhagic Ulceration (PoHU) 87.5 87.5 PoHU = -10.96 + 27.29 Aπ2(CInst) + 29.54 Aπ1(Het)
- 5.35 Aπ5(HX) Total 90.5 92.3 N = 42 U = 0.259 F = 11.88 p = 0.0000
Cardiovascular Manifestations Exacerbations of angina pectoris (EAP) 80.0 77.5 EAP = -7.88 + 21.91Aπ4(CInst) + 21.39Aπ5(Het)
+ 17.52Aπ3(HX) - 31.82Aπ5(Hal)
Hipertensión (HyperT) 76.9 76.9 HyperT = -6.57 + 24.57 Aπ4(CInst) + 3.46 Aπ5(Het) + 20.33 Aπ3(HX) + 4.33 Aπ5(Hal)
Thromboembolism (Thr) 78.6 98.2 Thr = -4.73 + 7.34 Aπ4(CInst) + 31.02 Aπ5(Het) - 1.79 Aπ3(HX) - 13.36 Aπ5(Hal)
Total 78.4 85.1 N = 37 U = 0.407 F = 4.39 p = 0.0003 Systemic phenomena
Anaphylaxis (Anph) 85.7 82.1 Anph = -16.08 + 97.23Aπ0(Het) - 14.83Aπ5(HX) + 217.40Aπ0(CSat) - 100.21Aπ5(CSat)
Lupus Erythematosus (LE) 91.7 91.7 LE = -7.67 + 57.99 Aπ0(Het) + 3.69 Aπ5(HX) + 111.03 Aπ0(CSat) - 44.93 Aπ5(CSat)
Total 88.5 86.5 N = 26 U = 0.404 F = 7.76 p = 0.0005 Breathing Manifestations
Infiltrated lung (IL) 84.6 72.7 IL = -41.28 + 44.95Aπ1(CInst) + 316.99Aπ0(CSat) + 85.53Aπ5(CInst) + 32.62Aπ1(Hal)
Bronchospasm (Brch) 72.7 78.4 Brch = -48.18 + 102.39 Aπ1(CInst) + 341.35 Aπ0(CSat) + 41.86 Aπ5(CInst) + 16.99 Aπ1(Hal)
Total 77.1 75.7 N = 35 U = 0.705 F = 3.13 p = 0.0289
11
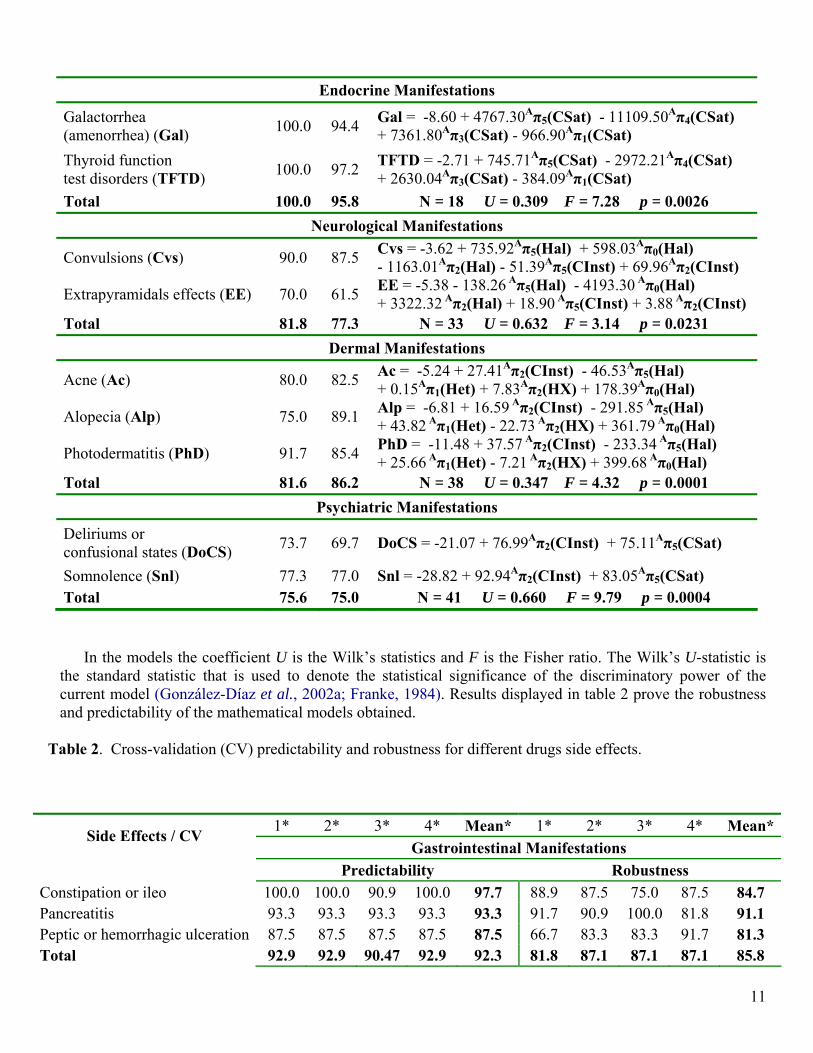
Endocrine Manifestations
Galactorrhea (amenorrhea) (Gal) 100.0 94.4 Gal = -8.60 + 4767.30Aπ5(CSat) - 11109.50Aπ4(CSat)
+ 7361.80Aπ3(CSat) - 966.90Aπ1(CSat) Thyroid function test disorders (TFTD) 100.0 97.2 TFTD = -2.71 + 745.71Aπ5(CSat) - 2972.21Aπ4(CSat)
+ 2630.04Aπ3(CSat) - 384.09Aπ1(CSat) Total 100.0 95.8 N = 18 U = 0.309 F = 7.28 p = 0.0026
Neurological Manifestations
Convulsions (Cvs) 90.0 87.5 Cvs = -3.62 + 735.92Aπ5(Hal) + 598.03Aπ0(Hal) - 1163.01Aπ2(Hal) - 51.39Aπ5(CInst) + 69.96Aπ2(CInst)
Extrapyramidals effects (EE) 70.0 61.5 EE = -5.38 - 138.26 Aπ5(Hal) - 4193.30 Aπ0(Hal) + 3322.32 Aπ2(Hal) + 18.90 Aπ5(CInst) + 3.88 Aπ2(CInst)
Total 81.8 77.3 N = 33 U = 0.632 F = 3.14 p = 0.0231 Dermal Manifestations
Acne (Ac) 80.0 82.5 Ac = -5.24 + 27.41Aπ2(CInst) - 46.53Aπ5(Hal) + 0.15Aπ1(Het) + 7.83Aπ2(HX) + 178.39Aπ0(Hal)
Alopecia (Alp) 75.0 89.1 Alp = -6.81 + 16.59 Aπ2(CInst) - 291.85 Aπ5(Hal) + 43.82 Aπ1(Het) - 22.73 Aπ2(HX) + 361.79 Aπ0(Hal)
Photodermatitis (PhD) 91.7 85.4 PhD = -11.48 + 37.57 Aπ2(CInst) - 233.34 Aπ5(Hal) + 25.66 Aπ1(Het) - 7.21 Aπ2(HX) + 399.68 Aπ0(Hal)
Total 81.6 86.2 N = 38 U = 0.347 F = 4.32 p = 0.0001 Psychiatric Manifestations
Deliriums or confusional states (DoCS) 73.7 69.7 DoCS = -21.07 + 76.99Aπ2(CInst) + 75.11Aπ5(CSat)
Somnolence (Snl) 77.3 77.0 Snl = -28.82 + 92.94Aπ2(CInst) + 83.05Aπ5(CSat) Total 75.6 75.0 N = 41 U = 0.660 F = 9.79 p = 0.0004
In the models the coefficient U is the Wilk’s statistics and F is the Fisher ratio. The Wilk’s U-statistic is
the standard statistic that is used to denote the statistical significance of the discriminatory power of the current model (González-Díaz et al., 2002a; Franke, 1984). Results displayed in table 2 prove the robustness and predictability of the mathematical models obtained.
Table 2. Cross-validation (CV) predictability and robustness for different drugs side effects.
1* 2* 3* 4* Mean* 1* 2* 3* 4* Mean*Side Effects / CV
Gastrointestinal Manifestations Predictability Robustness
Constipation or ileo 100.0 100.0 90.9 100.0 97.7 88.9 87.5 75.0 87.5 84.7 Pancreatitis 93.3 93.3 93.3 93.3 93.3 91.7 90.9 100.0 81.8 91.1 Peptic or hemorrhagic ulceration 87.5 87.5 87.5 87.5 87.5 66.7 83.3 83.3 91.7 81.3 Total 92.9 92.9 90.47 92.9 92.3 81.8 87.1 87.1 87.1 85.8

12
Cardiovascular Manifestations Predictability Robustness
Exacerbations of angina pectoris 80.0 70.0 90.0 70.0 77.5 87.5 75.0 85.7 100.0 87.1 Hipertension 76.9 69.2 76.9 84.6 76.9 70.0 80.0 60.0 77.8 71.9 Thromboembolism 100.0 100.0 100.0 92.9 98.2 72.7 90.9 90.0 50.0 75.9 Total 86.5 81.1 89.2 83.8 85.1 75.9 82.8 77.8 73.1 77.4
Systemic phenomena Predictability Robustness
Anaphylaxis 78.6 85.7 85.7 78.6 82.1 90.9 81.8 80.0 90.0 85.7 Lupus erythematosus 83.3 91.7 91.7 100.0 91.7 100.0 88.9 88.9 100.0 94.4 Total 80.8 88.5 88.5 88.5 86.5 95.0 85.0 84.2 94.7 89.7 Breathing Manifestations Predictability Robustness Infiltrated lung 84.6 46.2 79.9 79.9 72.7 70.0 60.0 80.0 88.9 74.7 Bronchospasm 86.4 81.8 68.2 77.3 78.4 82.4 76.5 75.0 81.3 78.8 Total 85.7 68.6 71.4 77.1 75.7 77.8 70.4 76.9 84.0 77.3
1* 2* 3* 4* Mean* 1* 2* 3* 4* Mean*Side Effects / CV Endocrine Manifestations
Predictability Robustness Galactorrhea (amenorrhea) 88.9 100.0 100.0 88.9 94.4 100.0 100.0 100.0 100.0 100.0 Thyroid function test disorders 100.0 100.0 88.9 100.0 97.2 100.0 100.0 100.0 100.0 100.0 Total 94.4 100.0 94.4 94.4 95.8 100.0 100.0 100.0 100.0 100.0
Neurological Manifestations Predictability Robustness
Convulsions 90.0 90.0 95.0 75.0 87.5 93.3 86.7 93.3 80.0 88.3 Extrapyramidals effects 69.2 53.8 53.8 69.2 61.5 70.0 50.0 60.0 77.8 64.4 Total 81.8 75.8 78.8 72.7 77.3 84.0 72.0 80.0 79.2 78.8 Dermal Manifestations Predictability Robustness Acne 80.0 80.0 80.0 90.0 82.5 62.5 62.5 71.4 85.7 70.5 Alopecia 87.5 93.8 87.5 87.5 89.1 91.7 83.3 83.3 66.7 81.3 Photodermatitis 66.7 100.0 91.7 83.3 85.4 77.8 77.8 88.9 77.8 80.6 Total 78.9 92.1 86.8 86.8 86.2 79.3 75.9 82.1 75.0 78.1 Psychiatric Manifestations Predictability Robustness Deliriums or confusional states 73.7 73.7 68.4 63.2 69.7 73.3 64.3 78.6 64.3 70.1 Somnolence 72.3 72.3 81.8 81.8 77.0 88.2 76.5 75.0 75.0 78.7 Total 75.6 75.6 75.6 73.2 75.0 81.3 71.0 76.7 70.0 74.7
* % of good classification based on posterior probabilities for four different training and predicting sets; predictability refers to compounds within predicting sets and robustness to compounds within training ones.

13
In order to simplify the equations for the purposes of interpretation and the possibility of graphical representation, we performed a canonical analysis (Van Waterbeemd, 1995) for gastrointestinal manifestations side effects group with the only purpose of illustrate the capability of the equations obtained to condense more than two side effects groups in only one simple equation (Root function) and its ability to discriminate between several side effects groups. The main root obtained (Root 1) proved to be a simple equation centered to 0:
)21((HX)π0.1336(Het)π0.7553(CInst)π0.4499Root2
(HX)π0.6783(Het)π0.3247(CInst)π0.8835Root1
5A
1A
2A
5A
1A
2A
++=
+−=
This canonical root presented an eigen-value of 1.32 and an acceptable regression coefficient of 0.75, which it is statistically significant (p-level<0.05), together whit a Chi-squared statistic of 51.28.
Aimed on finding some similarity whit others descriptors we could contrast our stochastic vector-matrix-vector forms Aπk(Sr) whit Toporov optimization of correlation weights of local graph invariants (OCWLI) named flexible descriptors (Toropov and Toropova, 2001, 2002, 2003; Toropov and Benfenati, 2004) (do not confound with flexibility descriptors). In this sense, both descriptors take into consideration more than one parameter. In flexible descriptors case, it is taken into consideration the abstract parameters (weights) which can be optimized in function of the pursued objectives. On the other hand, the parameters ours molecular descriptors take into consideration cannot be optimized, but have a direct physicochemical interpretation, such aspect has been analyzed in previous paragraphs of methods section.
3.2 Back-projection analysis
Finally, we applied a BPA in order to carry out a physical interpretation in structural terms of the models obtained. BPA graphics for two ulcerogenic drugs (Piroxicam and Droxicam) where developed. As was explained in the Methodology section, zones shown in gray (shown in red) are those that have a low (high) contribution to the specific side effect.
The ulcerogenic ability of the non steroid anti-inflammatory drugs (NSAID) generally is due to the inhibition of the synthesis of the prostaglandins E1 and E2, both depressors of the gastric secretion and intestinal mucosa vasodilator, this could promote the gastric secretion and to cause gastric vasoconstriction. This effect could derive in an ischemic necrosis that would originate a loss of gastric mucosa able to degenerate in a chronic gastric ulceration.
A hypothesis based on the structure-activity relationships for indomethacine and several NSAID; propose a receptor for these drugs, consistent in two non coplanares hydrophobic regions and a cationic core. Figure 4 shows the proposed receptor. This receptor consists essentially on an extensive flat surface, a hole to accommodate a group outside of the plane (for example an aromatic ring), and a cationic core in charge of associating to the acid anion (or a protonated amine) (Gund and Shen, 1977).
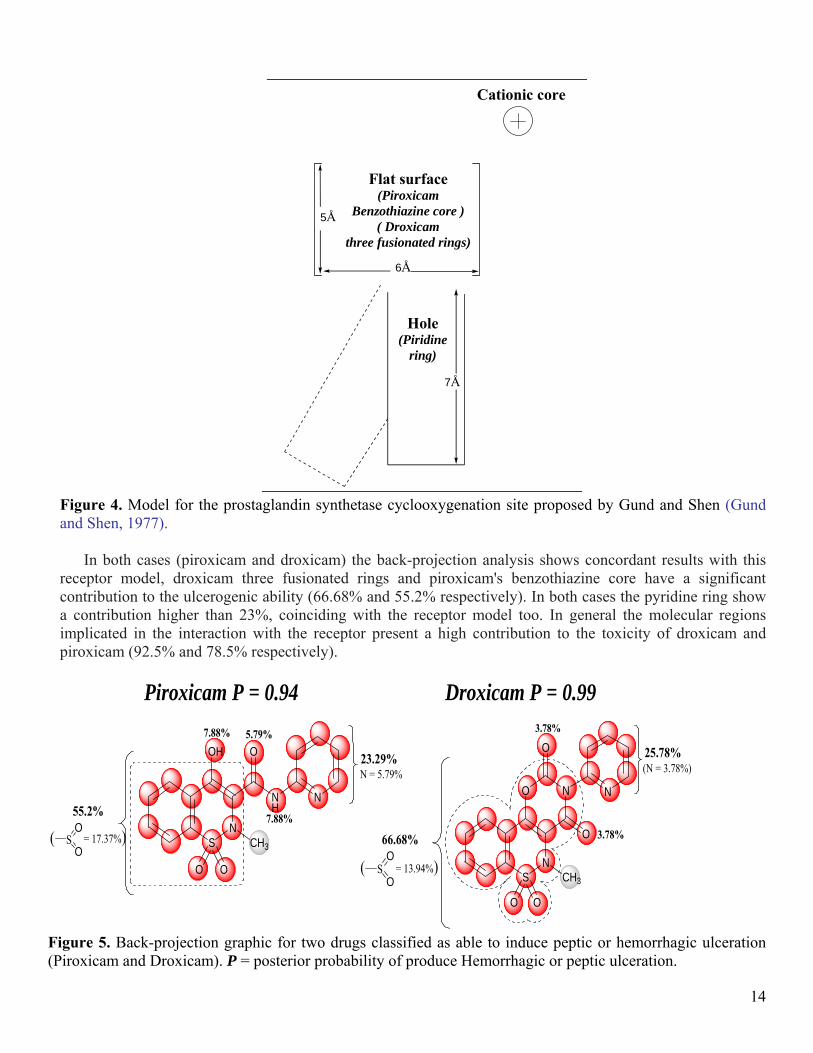
14
5Å
6Å
7Å
Cationic core
Flat surface(Piroxicam
Benzothiazine core )( Droxicam
three fusionated rings)
Hole(Piridine
ring)
Figure 4. Model for the prostaglandin synthetase cyclooxygenation site proposed by Gund and Shen (Gund and Shen, 1977).
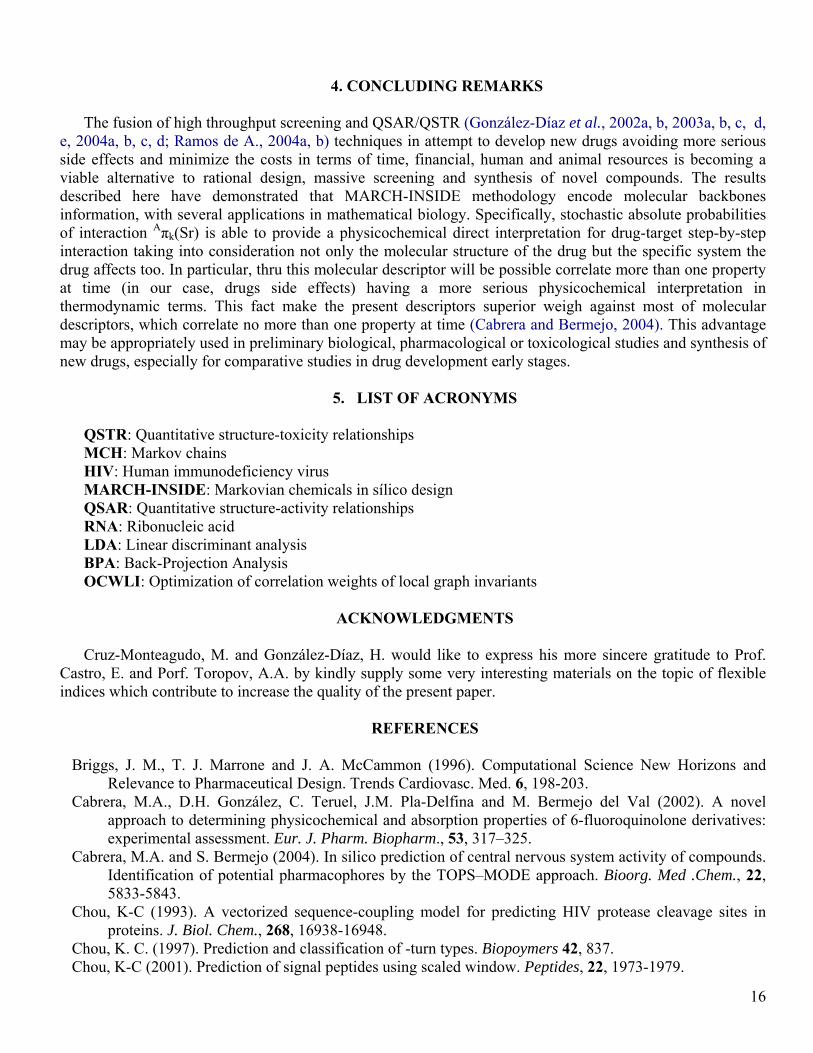
In both cases (piroxicam and droxicam) the back-projection analysis shows concordant results with this
receptor model, droxicam three fusionated rings and piroxicam's benzothiazine core have a significant contribution to the ulcerogenic ability (66.68% and 55.2% respectively). In both cases the pyridine ring show a contribution higher than 23%, coinciding with the receptor model too. In general the molecular regions implicated in the interaction with the receptor present a high contribution to the toxicity of droxicam and piroxicam (92.5% and 78.5% respectively).
S
OH
N
OO
CH3
NH
O
N
23.29%
5.79%7.88%
7.88%55.2%
= 17.37%)SO
O(
N = 5.79%
Piroxicam P = 0.94
N
O N
O
S CH3
OO
O
N
3.78%
66.68%
25.78%
= 13.94%)SO
O(
3.78%
(N = 3.78%)
Droxicam P = 0.99
Figure 5. Back-projection graphic for two drugs classified as able to induce peptic or hemorrhagic ulceration (Piroxicam and Droxicam). P = posterior probability of produce Hemorrhagic or peptic ulceration.

15
The same receptor model corresponds to the active center of the prostaglandin cyclooxygenase (COX), required enzyme for the biotransformation of the araquidonic acid to prostaglandins, causing the ulcerogenic effects above mentioned as a consequence of the inhibition of the synthesis of the prostaglandins E1 and E2 (Gund and Shen, 1977).
Additionally, the conformational geometry of both molecules was optimized using a PM3 semi-empirical method implemented in the software HyperChem Release® 7.03 for Windows® (HyperChem, 2002) proving the conformational affinity of these drugs for the COX receptor. This point may be confirmed in Figure 6.
Piroxicam. E = -3945.6167, Grad = 0.078, Conv = YES (91cycles 199 points), [Iter = 1 Diff = 0.00000]
Droxicam. E = -4098.6198, Grad = 0.087, Conv = YES (110 cycles 242 points), [Iter = 1 Diff = 0.00000] Figure 6. Conformational geometry optimization of Droxicam and Piroxicam using a PM3 semi-empirical calculation method.
Equation obtained for this drug side effect (PoHU = -10.96 + 27.29 Aπ2(CInst) + 29.54 Aπ1(Het) - 5.35
Aπ5(HX)) show a positive contribution of unsaturated carbons and heteroatoms and a negative contribution of the hydrogen bonden to a heteroatom, this probably due to the formation of intramolecular hydrogen bonds which could decrease the probability of union of the molecule to the molecular receptor. This tentative interpretation is supported by the results obtained in the BPA, proved in structural terms.
16
4. CONCLUDING REMARKS The fusion of high throughput screening and QSAR/QSTR (González-Díaz et al., 2002a, b, 2003a, b, c, d,
e, 2004a, b, c, d; Ramos de A., 2004a, b) techniques in attempt to develop new drugs avoiding more serious side effects and minimize the costs in terms of time, financial, human and animal resources is becoming a viable alternative to rational design, massive screening and synthesis of novel compounds. The results described here have demonstrated that MARCH-INSIDE methodology encode molecular backbones information, with several applications in mathematical biology. Specifically, stochastic absolute probabilities of interaction Aπk(Sr) is able to provide a physicochemical direct interpretation for drug-target step-by-step interaction taking into consideration not only the molecular structure of the drug but the specific system the drug affects too. In particular, thru this molecular descriptor will be possible correlate more than one property at time (in our case, drugs side effects) having a more serious physicochemical interpretation in thermodynamic terms. This fact make the present descriptors superior weigh against most of molecular descriptors, which correlate no more than one property at time (Cabrera and Bermejo, 2004). This advantage may be appropriately used in preliminary biological, pharmacological or toxicological studies and synthesis of new drugs, especially for comparative studies in drug development early stages.
5. LIST OF ACRONYMS
QSTR: Quantitative structure-toxicity relationships MCH: Markov chains HIV: Human immunodeficiency virus MARCH-INSIDE: Markovian chemicals in sílico design QSAR: Quantitative structure-activity relationships RNA: Ribonucleic acid LDA: Linear discriminant analysis BPA: Back-Projection Analysis OCWLI: Optimization of correlation weights of local graph invariants
ACKNOWLEDGMENTS
Cruz-Monteagudo, M. and González-Díaz, H. would like to express his more sincere gratitude to Prof.
Castro, E. and Porf. Toropov, A.A. by kindly supply some very interesting materials on the topic of flexible indices which contribute to increase the quality of the present paper.
REFERENCES
Briggs, J. M., T. J. Marrone and J. A. McCammon (1996). Computational Science New Horizons and
Relevance to Pharmaceutical Design. Trends Cardiovasc. Med. 6, 198-203. Cabrera, M.A., D.H. González, C. Teruel, J.M. Pla-Delfina and M. Bermejo del Val (2002). A novel
approach to determining physicochemical and absorption properties of 6-fluoroquinolone derivatives: experimental assessment. Eur. J. Pharm. Biopharm., 53, 317–325.
Cabrera, M.A. and S. Bermejo (2004). In silico prediction of central nervous system activity of compounds. Identification of potential pharmacophores by the TOPS–MODE approach. Bioorg. Med .Chem., 22, 5833-5843.
Chou, K-C (1993). A vectorized sequence-coupling model for predicting HIV protease cleavage sites in proteins. J. Biol. Chem., 268, 16938-16948.
Chou, K. C. (1997). Prediction and classification of -turn types. Biopoymers 42, 837. Chou, K-C (2001). Prediction of signal peptides using scaled window. Peptides, 22, 1973-1979.
17
Chou, K-C (2002). Prediction of protein signal sequences. Curr. Prot. and Pept. Sci., 3, 615-622. Cronin, M. T. D. and Dearden, J. C. (1995). Prediction of aquatic toxicity. Quant. Struct.-Act. Relat. 4, 1-7. Cronin, M. T. D. (1998). Computer aided prediction of drug toxicity in high throughput screening. Pharm.
Pharmacol. Commun. 157-163. Dearden, J. C., M. T. D. Cronin and A. J. Dobbs (1995). Quantitative structure-activity relationships as a
tool to assess the comparative toxicity of organic chemicals. Chemosphere, 31, 2521-2528. Di Francesco, V., P. J. Munson and J. Garnier (1999). FORESST: fold recognition from secondary structure
predictions of proteins. Bioinformatics, 15, 131. Estrada, E (2001). Generalization of topological indices. Chem. Phys. Lett., 336, 248-252. Franke, R. Theoretical Drug Design Methods, Elsevier: Amsterdam, (1984). Freund, J. A. and T. Poschel. Stochastic processes in physics, chemistry, and biology. In, Lect. Notes Phys.
Springer-Verlag Eds, Berlin, Germany. (2000). Garcia, A.G. and J.F. Horga de la Parte. Reacciones adversas a los fármacos. In, Índice de especialidades
farmacéuticas. Prescripción racional de fármacos. INTERCON. Ed. Editores Médicos S.A. EDIMSA. Madrid. (1994). p. 155-173.
Gnedenko, B. The theory of probability. Ed. Mir Publishers. Moscow. (1978). pp. 107-112. González, M. P., A. H. Morales, R. Molina and J. F. García (2004a). A topological sub-structural approach
of the mutagenic activity in dental monomers.1. Aromatic epoxides. Polymer, 45, 2773-2779. González, M. P., A. H. Morales and H. González-Díaz (2004b). A TOPS-MODE approach to predict
permeability coefficients. Polymer, 45, 2073-2079. González, M.P., H. González-Díaz, M. A. Cabrera-Pérez and R. R. Molina (2004c). A novel approach to
predict a toxicological property of aromatic compounds in the Tetrahymena pyriformis. Bioorg. Med. Chem., 12, 735-744.
González-Díaz, H., E. Olazábal, N. Castañedo, S. I. Hernádez, A. Morales, H. S. Serrano, J. González and R. Ramos de A. (2002a). Markovian chemicals ‘in silico’ design (MARCH-INSIDE), a promising approach for computer aided molecular design II: experimental and theoretical assessment of a novel method for virtual screening of fasciolicides. J. Mol. Mod., 8, 237-245.
González-Díaz, H., R. Ramos de A. and E. Uriarte (2002b). In Silico Markovian Bioinformatics for Predicting 1Hα-NMR Chemical Shifts in mouse Epidermis Growth Factor (mEGF). Online J. Bioinf., 1, 83-95.
González-Díaz, H., O. Gia, E. Uriarte, Hernádez I., R. Ramos, M. Chaviano, S. Seijo, J. A. Castillo, L. Morales, L. Santana, D. Akpaloo, E. Molina, M. Cruz-Monteagudo, L. A. Torres and M. A. Cabrera. (2003a). Markovian chemicals ‘in silico’ design (MARCH-INSIDE), a promising approach for computer-aided molecular design I: discovery of anticancer compounds. J. Mol. Mod., 9, 395-407.
González-Díaz, H., S. I. Hernández, E. Uriarte, and L. Santana (2003b). Symmetry Considerations in Markovian Chemicals “in silico” Design (MARCH-INSIDE) I: Central Chirality Codification, Classification of ACE inhibitors and Prediction of σ-Receptor Antagonist Activities. Comput. Biol. Chem., 27, 217-227.
González-Díaz, H., R. Ramos de A. and R. R. Molina (2003c). Vibrational Markovian modelling of footprints after the interaction of antibiotics with the packaging region of HIV Type 1. Bull. Math. Biol., 65, 991-1002.
González-Díaz, H., R. Ramos de A. and R. R. Molina (2003d). Markovian negentropies in bioinformatics. 1. A picture of footprints after the interaction of the HIV-1-Ψ-RNA packaging region with drugs. Bioinformatics, 19, 2079-2087.
González-Díaz, H., Y. Marrero, I. Hernández, I. Bastida, E. Tenorio, O. Nasco, E. Uriarte, N. C. Castañedo, M. A. Cabrera-Pérez, E. Aguila, O. Marrero, A. Morales and M. P. González (2003e). An Alternative “In Silico” Technique for Chemical Research in Toxycology. 1. Prediction of Chemically-induced Agranulocytosis. Chem. Res. Tox., 16, 1318-1327.

18
González-Díaz, H., E. Uriarte and R. Ramos de A. (2004a). Predicting stability of Arc repressor mutants with protein stochastic moments. Bioorg. Med. Chem., 13, 323-331.
González-Díaz, H., R. R. Molina and E. Uriarte (2004b). Markov entropy backbone electrostatic descriptors for predicting proteins biological activity. Bioorg. Med. Chem. Lett., 14, 4691-4695.
González-Díaz, H., R. R. Molina and E. Uriarte (2004c). Stochastic molecular descriptors for polymers. 1. Modelling the properties of icosahedral viruses with 3D-Markovian negentropies. Polymer, 45, 3845-3853.
González-Díaz, H., I. Bastida, N. Castañedo, O. Nasco, E. Olazabal, A. Morales, H. S. Serrano and R. Ramos de A. (2004d). Simple stochastic fingerprints towards mathematical modelling in biology and medicine. 1. The treatment of coccidiosis. Bull. Math. Biol., 66, 1285-1311.
Goodman and Gilman, A., L. S. Goodman, A. Gilman. Principles of Therapeutics. In: The pharmacological basis of therapeutics. Tenth Edition Eds: Mc Graw Hill, New York. (2001).
Gund, P. and T.Y. Shen (1977). A model for the prostaglandin synthetase cyclooxygenation site and its inhibition by antiinflammatory arylacetic acids. J.Med. Chem., 20, 1146-1152.
Hua, S. and Z. Sun (2001). Support vector machine approach for protein subcellular localization prediction. Bioinformatics, 17, 721-728.
Hubbard, T. J. and J. Park (1995). Fold recognition and ab initio structure predictions using Hidden Markov models and β-strand pair potential. Proteins Struc. Funct. Genet. 23, 398-402.
HyperChem ReleaseTM 7.03 for Windows®, Molecular Modeling System, Copyright 2002 Hypercube, Inc. Kowalski, R. B. and S. Wold. Pattern recognition in chemistry. In, Handbook of statistics. Ed, Krishnaiah,
P. R. and Kanal, L. N. North Holland Publishing Company, Amsterdam. (1982). pp 673-697. Krogh, A., M. Brown, I. S. Mian, K. Sjeander and D. Haussler (1994). Hidden Markov models in
computational biology: applications to protein modeling . J. Mol. Biol., 235, 1501. Kubinyi, H., J. Taylor and C. Ramdsen. Quantitative Drug Design. In, Comprehensive Medicinal
Chemistry. Ed. C. Hansch. Pergamon. (1990). vol. 4, pp. 589. Lewis, D. E. V. Computer assisted methods in the evaluation of chemical toxicity. In: Lipkowitz, K. B. and
Boyd, D. B., eds, Reviews in Computational Chemistry (VCH Publishers, New York) (1992).Vol. 3, 173-222.
Lutz, M. W., J. A. Menius, R. G. Laskody, P. L. Domanico, A. G. Goetz, D. L. Saussy, and T. Rimele (1996). Statistical considerations in High Throughput Screening. Network Science 2, Issue 9, September.
Marrero-Ponce, Y., H. González-Díaz, V. Romero-Zaldivar, F. Torrens and E. A. Castro (2004a). 3D-Chiral quadratic indices of the ‘molecular pseudograph atom adjacency matrix’ and their application to central chirality codification: classification of ACE inhibitors and prediction of σ-receptor agonist activities. Bioorg. Med. Chem. 12, 5331.
Marrero-Ponce, Y.; Montero-Torres, A.; Romero-Zaldivar, C.; Iyarreta-Veitía, M.; Mayón-Peréz, M.; García-Sánchez, R. (2004b) Non-Stochastic and Stochastic Linear Indices of the "Molecular Pseudograph's Atom Adjacency Matrix": Application to "in silico" Studies for the Rational Discovery of New Antimalarial Compounds. Bioorg. Med. Chem. doi: 10.1016/j.bmc.2004.11.008.
Marrero-Ponce, Y. (2004a) Linear Indices of the "Molecular Pseudograph's Atom Adjacency Matrix": Definition, Significance-Interpretation and Application to QSAR Analysis of Flavone Derivatives as HIV-1 Integrase Inhibitors. J. Chem. Inf. Comput. Sci. 44, 2010-2026.
Marrero-Ponce, Y. (2004b). Bioorg. Med. Chem. 12, 6351-6369. Morales, A. H., M. P. González and J. B. Rieumont (2004). TOPS-MODE approach to predict mutagenicity
in dental monomers. Polymer, 45, 2045-2050. Ramos de A., R., H. González Díaz, R. R. Molina, M. P. González and E. Uriarte (2004a). Stochastic-based
descriptors studying peptides biological properties: modeling the bitter tasting threshold of dipeptides. Bioorg. Med. Chem., 12, 4815-4822.
19
Ramos de A., R., H. González Díaz, R. R. Molina and E. Uriarte (2004b). Markovian Backbone Negentropies: Molecular Descriptors for Protein Research. I. Predicting Protein Stability in Arc Repressor Mutants. Proteins, Struct. Func. and Bioinf., 56, 715-723.
Roberts, D. W. An analysis of published data on fish toxicity of nitrobenzenes and aniline derivatives, In: Kaiser, K. L. E., ed, QSAR in Environmental Toxicology-II (D. Raidel, Dordrecht, The Netherlands) (1987). pp. 295-308.
STATISTICA for Windows release 6.0. Statsoft Inc., (2001). Stief, N. and K. Baumann (2003). Mapping Property Distributions of Molecular Surfaces: Algorithm and
Evaluation of a Novel 3D Quantitative Structure-Activity Relationship Technique. J. Med. Chem., 46, 1390-1407.
Todeschini, R. and V. Consonni. Handbook of Molecular Descriptors.. Wiley VCH, Weinheim, Germany. (2000).
Toropov, A. A. and A. P. Toropova (2001). Prediction of heteroaromatic amine mutagenicity by means of correlation weighting of atomic orbital graphs of local invariants. J. Mol. Struct. (Theochem)., 538, 287-293.
Toropov, A. A. and A. P. Toropova (2002). Modeling of acyclic carbonyl compounds normal boiling points by correlation weighting of nearest neighboring codes. J. Mol. Struct. (Theochem)., 581, 11-15.
Toropov, A. A. and A. P. Toropova (2003). QSPR modeling of alkanes properties based on graph of atomic orbitals. J. Mol. Struct. (Theochem)., 637, 1-10.
Toropov, A. A. and E. Benfenati (2004). QSAR modelling of aldehyde toxicity by means of optimisation of correlation weights of nearest neighbouring codes. J. Mol. Struct. (Theochem)., 676, 165-169.
Van Waterbeemd, H. “Discriminant analysis for activity prediction. In, Method and Principles in Medicinal Chemistry”, Ed, R. Manhnhold, Krogsgaard-Larsen, H. Timmerman, vol 2, “Chemometric methods in molecular design”. Ed, H. Van Waterbeemd, VCH, Weinhiem. (1995). pp 265-282.
Villa, A., R. Zangi, G. Pieffet and A.E. Mark (2003). Sampling and convergence in free energy calculations of protein-ligand interactions: the binding of triphenoxypyridine derivatives to factor Xa and trypsin. J Comput. Aid. Mol. Des., 17, 673-686.
Vorodovsky, M., E. V. Koonin and K. E. Rudd (1994). New genes in old sequence: a strategy for finding genes in the bacterial genome. Trends Biochem. Sci. 19, 309.
Vorodovsky, M., J. D. Macininch, E. V. Koonin, K. E. Rudd, C. Médigue and A. Danchin (1995). TI detection of new genes in a bacterial genome using Markov models for three gene classes. Nuc. Ac. Res., 23, 3554.
Wess, G. (1996). Challenges for medicinal chemistry. Drug Discovery Today, 1, 529-532. Yuan, Z. (1999). Prediction of protein subcellular location using Markov chain models. FEBS. Lett. 451, 23-
26.