unicredit group: 4q14 & fy14 preliminary results group - internal use only - 6 group – results...
TRANSCRIPT

UniCredit Group: 4Q14 & FY14 preliminary results
Milan, February 11th, 2015

UniCredit Group - INTERNAL USE ONLY -
2
Disclaimer
This Presentation may contain written and oral “forward-looking statements”, which includes all statements that do not relate solely to historical or current facts and which are therefore inherently uncertain. All forward-looking statements rely on a number of assumptions, expectations, projections and provisional data concerning future events and are subject to a number of uncertainties and other factors, many of which are outside the control of UniCredit S.p.A. (the “Company”). There are a variety of factors that may cause actual results and performance to be materially different from the explicit or implicit contents of any forward-looking statements and thus, such forward-looking statements are not a reliable indicator of future performance. The Company undertakes no obligation to publicly update or revise any forward-looking statements, whether as a result of new information, future events or otherwise, except as may be required by applicable law. The information and opinions contained in this Presentation are provided as at the date hereof and are subject to change without notice. Neither this Presentation nor any part of it nor the fact of its distribution may form the basis of, or be relied on or in connection with, any contract or investment decision.
The information, statements and opinions contained in this Presentation are for information purposes only and do not constitute a public offer under any applicable legislation or an offer to sell or solicitation of an offer to purchase or subscribe for securities or financial instruments or any advice or recommendation with respect to such securities or other financial instruments. None of the securities referred to herein have been, or will be, registered under the U.S. Securities Act of 1933, as amended, or the securities laws of any state or other jurisdiction of the United States or in Australia, Canada or Japan or any other jurisdiction where such an offer or solicitation would be unlawful (the “Other Countries”), and there will be no public offer of any such securities in the United States. This Presentation does not constitute or form a part of any offer or solicitation to purchase or subscribe for securities in the United States or the Other Countries.
Pursuant the consolidated law on financial intermediation of 24 February 1998 (article 154-bis, paragraph 2) Marina Natale, in her capacity as manager responsible for the preparation of the Company’s financial reports declares that the accounting information contained - preliminary results not audited yet - in this Presentation reflects the UniCredit Group’s documented results , financial accounts and accounting records.
The final approval of UniCredit Consolidated Financial Statements will take place next 12th March, date that qualifies as date of authorization for issue according to IAS 10 with reference to potential events after the reporting period.
Neither the Company nor any member of the UniCredit Group nor any of its or their respective representatives, directors or employees accept any liability whatsoever in connection with this Presentation or any of its contents or in relation to any loss arising from its use or from any reliance placed upon it.

UniCredit Group - INTERNAL USE ONLY -
Executive summary (1/2)
Management actions yielded remarkable achievements in 2014 …
Net profit target
delivered
Business
refocusing
3
Asset
quality
improving
Solid
balance
sheet
Group net profit 2 bn in 2014 with 12 cents scrip dividend (35% pay-out ratio)
despite macroeconomic and geopolitical challenges, supported by:
improving core revenues: net interest +1.1% y/y and net fees +2.9% y/y
tight cost discipline: operating costs down by 2.9% y/y
Core Bank's net profit 2014 at 3.7bn with RoAC at 11%
Commercial Bank Italy top contributor after a successful turnaround
Commercial loans up q/q suggesting an improving environment
Non Core portfolio run-down ahead of targets with gross loans -10bn y/y
Gross impaired loans at 84.4bn continuing to show signs of stabilization
In Italy, inflows from performing down by 25% vs. 2013 and by 32% vs. 2012,
confirming better performance of UniCredit SpA vs. the Italian system
Cost of risk at 90bp, the lowest since 2009, incorporating AQR
CET1 ratio fully loaded at 10%, CET1 ratio transitional at 10.4%
Leverage ratio Basel 3 fully loaded at a sound 4.5%
Impaired loans coverage ratio at 51.3% (62.2% on NPL)

UniCredit Group - INTERNAL USE ONLY -
4
Executive summary (2/2)
…moreover an important number of strategic actions still in progress are
yet to deliver net profit enhancement
INVEST IN
GROWTH
BUSINESSES
TRANSFORM
COMMERCIAL
BANKING IN
WESTERN
EUROPEAN
MARKETS
LEVERAGING
GLOBAL
PLATFORM
1
Strategic Plan key pillars
Western European branch network Rationalization and service model innovation
Branch closures, # 110 36 119
Multi-channel New clients acquisition, increase active online users in WE, development of mobile and tablet banking
Active online users, %
+1pp +2pp +2pp
Payments Increase in the number of plastic cards and transaction amount per card, enhancement of acquiring volumes, light POS, e-commerce development, digital payments launch in UC major countries
Beyond 470,000 net new issued cards in retail
Flexia: 1m of issued cards
Internationalization
Enhancement of the international centers and processes to
support customers' cross-border business (GTB and lending)
Beyond 570m loan new business in the 1st year
CEE Boost of the retail segment by optimizing the branch footprint, introducing itinerant specialists and promoting remote channels
Increasing MS on loans (5.3% vs 4.6% Dec. p/y) and deposits (4.7% vs 4.2% Dec. p/y)
Fineco Strong PFAs recruiting activity, sustain asset mix change focusing pure advice services
Net Sales, 4.0bn
Recruited PFA, # 125
Global Banking Services and Real Estate Cost efficiency initiatives now fully implemented
RE freed spaces, ca. 150k sqm RE savings, 39m
CIB Boost integration with commercial banking in WE markets and CEE
ROAC, 18.2% in 2014
Impacts on
Costs
2
3
Achievements 2014
Rev.

UniCredit Group - INTERNAL USE ONLY -
5
Group
Agenda
Non Core
Annex
Core Bank

UniCredit Group - INTERNAL USE ONLY -
6
Group – Results
Management actions delivered 2bn net profit in 2014, in line with target
despite a worse than expected scenario
Total assets, bn
Total RWA / Total assets, %
844856837840826
-1.4%
Dec-14 Mar-14 Dec-13 Jun-14 Sep-14
+2.2% Net profit, m
2,008
170
722
3Q14
-13,965
-14,979
4Q14 4Q13 FY14 FY13
Tangible equity, bn
Funding gap(2), bn
43.845.943.542.141.4
Sep-14 Jun-14 Mar-14 Dec-13
-4.5%
+5.9%
Dec-14
15.623.326.7
34.436.1
Dec-13 Jun-14
-20.5bn
Sep-14 Dec-14
-7.7bn
Mar-14
48.546.947.749.946.6
+1.6p.p.
Dec-14
+1.9p.p.
Jun-14 Sep-14 Dec-13 Mar-14
RoTE(1)
(1) RoTE: net profit / average tangible equity (excluding AT1).
(2) Funding gap: customers loans - (customer deposits + customer securities), pro-forma for DAB disposal.
n.m. 6.8% 1.6% n.m. 4.9%

7
Gross impaired loans, bn
43.1 39.7 40.9 41.1
Dec-14
84.4
Sep-14
83.5
Dec-13
83.6
Dec-12
79.7
Gross NPL(2), bn
Group – Asset quality
Gross impaired loans stabilizing in 2014 and coverage ratio up by 30bp q/q.
Other impaired down due to lower inflows to impaired, confirming positive trend
19.318.119.0 19.7
+8.8% +6.3%
Dec-14
52.1
Sep-14
50.6
Dec-13
49.1
Dec-12
45.1
22.2 24.9 24.0 23.3
7.8 6.2 5.8 6.3
4.6
-6.7% -0.3%
Doubtful
Restructured
Past due
Dec-14
32.2
2.6
Sep-14
32.9
3.1
Dec-13
34.5
3.4
Dec-12
34.6
Other gross impaired loans(3), bn
Gross impaired loans – Yearly variations(1)
Coverage ratio
Net impaired loans ratio
(1) Yearly variations for 1Q13, 2Q13 and 3Q13 are based on historical data.
(2) Non performing loans refer to "sofferenze".
(3) Other impaired loans include doubtful loans, restructured loans and past-due loans.
0.9%
4Q14 3Q14
0.0%
2Q14
0.4%
1Q14
1.7%
4Q13
4.9%
3Q13
8.7%
2Q13
11.2%
1Q13
13.1%
45.9% 52.5% 51.0% 51.3%
8.2% 8.2% 8.7% 8.7%
Coverage ratio 57.9% 63.1% 61.8% 62.2%
Net impaired
Net impaired
52.4%
ex. disposals
booked in FY14

8
Asset quality in Italy
Confirmed better asset quality trend vs. banking system.
Gross impaired growth rates decelerating driven by Non Core and workout
(1) Italian banking association - sample composed by approx. 80% of Italian banking system; households and non financial
corporations.
(2) Inflows from gross performing loans to gross impaired loans in the period; collections and recoveries are flows from gross
impaired loans back to gross performing loans and collections of gross impaired loans.
Gross impaired loans – yearly variations
5%
10%
15%
20%
25%
30%
35%
ABI Sample(1)
UniCredit SpA
Nov-14 Jun-14 Dec-13 Jun-13 Dec-12 Jun-12 Dec-11 Jun-11 Dec-10
-2,051 -2,128 -2,309
4,335 3,9362,934
2012
2,284
Collections and
recoveries
625
Inflows to
impaired
2014 2013
1,808
-65%
-25%
+9%
Net inflows to impaired(2) - quarterly average, m
Net flows -73%
-32%
+13%
2014 vs. 2012
var. %
2014 vs. 2013

UniCredit Group - INTERNAL USE ONLY -
9
16 18 1827
19 19 21
52
52
52
52
44 4444
-2.3%
+2.0%
Market
Credit
Oper.
Dec-14
409
344
Sep-14
401
338
Jun-14
399
335
Mar-14
419
339
Dec-13
385
315
Sept-13
400
330
Jun-13
411
343
RWA(1) eop, bn
Group – Regulatory capital (1/3)
RWA up by 8bn q/q in compliance with CRR regulatory requirements impacting
the credit component
Divisional breakdown - RWA, bn
Basel 2.5 Basel 3
(1) RWA as of December 2013 do not include the floor effect, which has no impact under Basel 3 framework.
q/q y/y
+0.1% -1.5%
-0.3% -0.9%
-0.1% -4.4%
+5.5% +9.2%
+2.7% +3%
-3.9% -9.5%
+7.2% -9%
+11.4% -17.3%
-1.8% +59.2%
+18.4% +24.5%
2
2
39 Non Core
Corp. Centre
& other 50
AM
AG
CIB 67
Poland 26
CEE 89
CB Austria 24
CB Germany 34
CB Italy 76

UniCredit Group - INTERNAL USE ONLY -
10
Basel 3 - Common Equity Tier I ratio: y/y evolution
Group – Regulatory capital (2/3)
CET1 ratio fully loaded at 10%, ahead of Strategic Plan target despite the
negative impact of FX reserves
(1) Assuming 2014 scrip dividend of 12 €cents per ordinary share with 75-25% shares-cash acceptance and assuming the full
absorption of DTA on goodwill tax redemption and tax losses carried forward.
(2) Assuming 2014 scrip dividend of 12 €cents per ordinary share with 75-25% shares-cash acceptance. CET 1 ratio transitional
including full cash dividend at 10.26%.
Reserves
& others
+23bp
FX reserve
-37bp
Fineco
& DAB
Dec-14
Transitional(2)
10.41%
Phase in
+39bp
Dec-14
Fully
loaded(1)
10.02%
Dividend
2014
-4bp
Earnings
2014
+46bp
+24bp
RWAs
+4bp
Scrip
dividend 2013
+10bp
Dec-13
Fully loaded
9.36%
Common Equity Tier 1 ratio at 10.02%, +66bp y/y, ahead of Strategic Plan target despite the negative impact of
FX reserves
Resilient capital ratio despite the negative macroeconomic developments of 2014 and embedding the impact of
Comprehensive Assessment implemented in 2014
Capital solidity consistent with UCG risk profile

UniCredit Group - INTERNAL USE ONLY -
11
Group – Regulatory capital (3/3)
UCG ready with plan to offset impact of interpretation of CRR regulation.
Basel 3 leverage ratio fully loaded at a sound 4.5%
-127bp
Tier 1 ratio
Total capital
ratio
Dec-14
13.63%
11.26%
Sep-14
14.90%
11.64%
Jun-14
14.98%
11.29%
Mar-14
14.21%
10.58%
Tier 1 and Total Capital ratios transitional(1) Basel 3 leverage ratio(2)
Dec-14
4.46%
4.85%
Sep-14
4.81%
5.22%
Jun-14
4.69%
5.11%
Mar-14
4.51%
4.94%
Fully loaded
Transitional
(1) Dec-14 ratios assume 2014 scrip dividend of 12 €cents per ordinary share with 75-25% shares-cash acceptance. Including full cash
dividend T1 and TC ratios transitional respectively at 11.12% and 13.49%.
(2) Leverage ratio based on CRR definition not considering amendments introduced by EC Delegated Act published in Jan-15. According
to EBA proposal, the implementation for the amended Leverage Ratio reporting is not expected before Dec-15. Proforma as for
regulatory capital ratios.
TC ratio at 13.63%, quarterly trend affected by compliance to CRR with reference to amortizing Tier 2
instruments. UCG already active with plan to further strengthening Total Capital
2bn AT1 placed in 2014 and further issuances planned within the Strategic Plan horizon to fill-up the 1.5%
bucket, confirming a well diversified capital base
Leverage ratio at 4.5% fully loaded, among the best in Europe, confirming UCG's conservative risk profile

UniCredit Group - INTERNAL USE ONLY -
12
Group – Medium-long term funding plan
2014 Funding Plan: well diversified execution thanks to effective issuances
and timely ALM
As of February 5th, 10% of Group Funding Plan 2015 realized for 2.6bn.
24.9bn LTRO repaid to date. The remaining 1.2bn will mature by end of February 2015.
Group Funding Plan 2014 successfully executed using a variety of instruments and taking advantage of the
TLTRO take up for 7.8bn in Sep-14 and 2.3bn in Dec-14(3):
execution of two AT1 for almost 2bn: UCG the first Italian bank placing Basel 3 compliant issuances
UniCredit SpA and Bank Austria decided to take up a total of around 10bn of TLTRO funds in the
September and December auctions. The funds were drawn down at a rate of 0.15%.
(1) Inter-company funding not included.
(2) Network bonds comprise only securities placed through UCG commercial and 3rd party networks.
(3) c.10.1bn at Group level, o/w 7.75bn in Italy, c.2.1bn in Austria, c.150m in Czech Republic and Slovakia and c.80m in Slovenia.
Funding mix, managerial data % of M/L term run offs by region(1)
% M/L Term Network bonds run offs(2)
24%
2016
Italy
Germany
Austria 16%
31.7
60%
2015
28.2
20%
28%
52%
26.6
2015 (planned)
13%
25%
8%
18%
14%
2014 (realized)
24.6
23%
Group retail network
Public sector & mortgages CBs Bank cap. bonds
Priv. plac. & schuldschein
Public market and wholesale MLT Supranational funding
69%
2017
28.9
18%
14%
10.1bn TLTRO
not included
32% 41% 41%
6%
Germany
Poland
Austria
71%
0%
23%
Italy
2015 (realized)

UniCredit Group - INTERNAL USE ONLY -
13
Group
Agenda
Non Core
Annex
Core Bank

UniCredit Group - INTERNAL USE ONLY -
14
Net profit, m
Core Bank – Net profit
Net profit at 3.7bn in FY14, supported by all divisions.
Sound RoAC at c.11%
36
27
83
AM
AG
CIB 399
CEE 129
Poland
CB Austria -67
CB Germany 215
CB Italy 459
Divisional breakdown – 4Q14 net profit, m
RoAC(1)
3,749
8681,102
-7,445
4Q14 3Q14 4Q13
-10,200
FY14
-21.3%
FY13
RoAC(1)
(1) RoAC calculated as net profit on allocated capital. Allocated capital calculated as 9% of RWAs, including deductions for shortfall
and securitizations.
24.9%
30.8%
n.m.
28.9%
6.4%
21.1%
107.2%
54.3%
n.m. 13.6% 9.8% n.m. 10.8%

UniCredit Group - INTERNAL USE ONLY -
15
Net operating profit, m
Revenues, m
Loan loss provisions, m
Costs, m
22,18322,644
5,5305,4755,650
+1.0%
-2.0%
FY14 FY13 4Q14 3Q14 4Q13
13,24713,649
3,3793,2633,591
+3.6%
-2.9%
FY14 FY13 4Q14 3Q14 4Q13
2,135
3,760
754254
2,033
-43.2%
n.m.
FY14 FY13 4Q14 3Q14 4Q13
Core Bank – Net operating profit
NOP strongly up in 2014 with cost discipline offsetting revenue pressure.
Significant reduction in LLP in 2014
6,801
5,234
1,3961,957
27
FY14
+29.9%
FY13 4Q14 3Q14 4Q13
-28.7%

UniCredit Group - INTERNAL USE ONLY -
16
22,18322,644
5,5305,4755,650
+1.0%
-2.0%
FY14 FY13 4Q14 3Q14 4Q13
Revenues, m
Core Bank – Total revenues (1/2)
Lower revenues in 2014 mainly due to buy-back in 2013 and CVA adjustments.
Revenue improvement accelerated in CB Italy
Divisional breakdown – 4Q14 revenues, m
q/q y/y
AM
AG
217
118
CIB 1,023
CEE 919
Poland 437
CB Austria 407
CB Germany 637
CB Italy 2,043
At const. FX
+0.9%
-0.1%
+8.8%
-2.4%
-15.4%
+27.1%
+9.6%
+9.1%
+4.2%
-6.3%
-4.1%
-4.2%
-21.7%
-2.6%
+7.3%
+8.5%
-1.5% -3.6%
-10.8% -15.5%

UniCredit Group - INTERNAL USE ONLY -
17
Core Bank – Total revenues (2/2)
Healthy progression of core revenues (net interest and fees).
Turkey progressed q/q with commercial efforts offsetting regulatory changes
Net fees and commissions, m
Dividends and other income(2), m
7,3557,053
1,8311,8041,782
+1.5%
+4.3%
FY14 FY13 4Q14 3Q14 4Q13
636
341113
549
112102
625
193110
+50.5%
-18.5%
FY14
966
FY13
1,185
4Q14
306
3Q14
203
93
4Q13
215
Net interest(1), m
Trading income, m
12,29311,894
3,0533,0793,061
-0.9%
+3.4%
FY14 FY13 4Q14 3Q14 4Q13
1,570
2,512
340388592
-12.3%
-37.5%
FY14 FY13 4Q14 3Q14 4Q13
(1) Contribution from macro hedging strategy on non-naturally hedged sight deposits in 4Q14 at 380m (1.4bn in FY14).
(2) Figures include dividends, equity investments income and balance of other operating income / expenses. Turkey contribution based
on a divisional view.
Turkey
Other dividends and balance

UniCredit Group - INTERNAL USE ONLY -
18
Core Bank – Net interest
Deposits re-pricing underpin a sound trend of NII in FY14. Lower rates in 4Q14
partly compensated by lower cost of liabilities and increasing lending volumes
Net interest bridge q/q (m)
Net interest bridge y/y (m)
+3.4%
FY14
12,293
Markets
activities
and other
+279
Term
funding
-186
FY13
11,894
-268
Loans volume
-94
Deposits
volume
-171
Loans
rate
+845
Deposits
rate
-7
FX effect
-0.9%
4Q14
3,053 +3
Term
funding
+66
Deposits rate
+42
Loans rate
-159
Deposits
volume
-22
Loans
volume
+95
FX effect
-46
3Q14
3,079
Markets
activities
and other

UniCredit Group - INTERNAL USE ONLY -
19
423.2420.9423.7431.2430.0
-1.6%
+0.5%
4Q14 3Q14 2Q14 1Q14 4Q13
Customer loans(1), bn
Core Bank – Customer loans
Commercial lending volumes up by 1.4bn in 4Q mainly driven by CIB,
offsetting negative FX effect in CEE & Poland
Divisional breakdown – Customer loans, bn
q/q y/y
Other
Institutional and
Market Counterparts 38.2
0.7
CIB 50.1
CEE 57.0
Poland 26.9
CB Austria 43.8
CB Germany 76.3
CB Italy 130.0
(1) Figures proforma for DAB disposal. In 3Q14 loans to customers for c.4bn have been reclassified to loans to banks; previous
quarters have been restated accordingly.
q/q +1.4bn
+4.1% +10.6%
-0.1%
-0.6%
+0.2%
+1.7%
-2.4%
+6.1%
-3.1%
+2.3%
-0.7%
-0.7%
+0.4%
+7.6%
-0.3%
-1.3%
+3.4%
-14.9%
+7.4% +13.2%
At const. FX

UniCredit Group - INTERNAL USE ONLY -
20
452.6
444.7445.4446.7
444.8
+1.8% +1.8%
3Q14 2Q14 1Q14 4Q13 4Q14
Customer direct funding(1), bn
Core Bank – Customer direct funding
Commercial direct funding up by almost 6.8bn, supported by all divisions
Divisional breakdown – Direct funding, bn
q/q y/y
Other
Institutional and
Market Counterparts 56.5
14.4
CIB 31.9
CEE 51.5
Poland 29.6
CB Austria 51.4
CB Germany 72.1
CB Italy 145.2
(1) Customer direct funding: total customer deposits + customer securities in issue. Proforma for DAB disposal.
q/q +6.8bn
At const. FX
+2%
+0.7%
+1.2%
+1.7%
+2.9%
+2.6%
+1.1%
+1.9%
-3.1%
+0.4%
+7.5%
+1.8%
+4%
+11.7%
+6.5%
-4.9%
+4.1%
+16.5%
+4.7%
+20.6%

UniCredit Group - INTERNAL USE ONLY -
21
-24bp
4Q14
3.50%
3Q14
3.72%
2Q14
3.81%
1Q14
3.82%
4Q13
3.74%
Lending customer rate, % (managerial figures)
Core Bank – Customer rates
Re-pricing actions on deposits offset lower interest rates translating into stable
margins y/y. Quarterly trend also affected by lower rates on TLTRO lending
4Q14
-22bp
0.56%
3Q14
0.63%
2Q14
0.68%
1Q14
0.71%
4Q13
0.78%
Deposits customer rate, % (managerial figures)
Euribor 3M
Euribor 1M 0.24% 0.30% 0.30% 0.16% 0.08% 0.16% 0.23% 0.22% 0.07% 0.01%

UniCredit Group - INTERNAL USE ONLY -
22
Core Bank – New loan origination in Commercial Bank Italy (1/2)
MLT new flows higher than run offs, with higher margins despite lower rates
and focused on best rating customers. Stock down y/y due to short term loans
130.0
Dec-14 Short term
& other
-3.0
Corporate
+5.2
Small
business
+2.3
Personal
loans
+2.2
Household
mortages
+3.4
Corporate
-3.1
Small
business
-2.1
Personal
loans
-2.2
Household
mortages
-3.7
Dec-13
130.9
Run off MLT: -11.1bn New Flows MLT: +13.2bn
(1) Run off and new flows excluding pooled loans.
Net customer loans(1), bn

UniCredit Group - INTERNAL USE ONLY -
23
Core Bank – New loan origination in Commercial Bank Italy (2/2)
Positive trend continued with over 13bn new MLT loans granted in FY14.
7.8bn TLTRO almost fully deployed to date
Household mortgages new flows, m Personal loans new flows, m
Corporate MLT loans new flows, m
3,442
1,627924870892755575
+111.6%
FY14 FY13 1Q14 4Q13 4Q14 3Q14 2Q14
Small business MLT loans new flows, m
2,2222,151
528472598624457
+3.3%
FY14 FY13 4Q14 3Q14 2Q14 1Q14 4Q13
2,316
1,721
797475572473532
+34.6%
FY14 FY13 1Q14 4Q13 2Q14 3Q14 4Q14
5,213
2,5452,342
9681,025877809
FY14
+104.9%
FY13 1Q14 4Q13 4Q14 3Q14 2Q14

UniCredit Group - INTERNAL USE ONLY -
24
Net fees and commissions, m
Investment services fees, m
Transactional and banking services fees, m
Financing services fees, m
3,2792,995
790800761
-1.3%
+9.5%
FY14 FY13 4Q14 3Q14 4Q13
1,7491,718
460420451
4Q14 3Q14 4Q13
+9.4%
+1.8%
FY14 FY13
2,3272,341
582584571
-0.4%
-0.6%
FY14 FY13 4Q14 3Q14 4Q13
Core Bank – Fees and commissions
Fees up y/y thanks to investments fees on the back of strong net sales.
Financing fees drive the q/q growth, thanks to the recovery in loan demand
7,3557,053
1,8311,8041,782
+4.3%
FY14
+1.5%
FY13 4Q14 3Q14 4Q13

UniCredit Group - INTERNAL USE ONLY -
25
Staff expenses, m
Depreciation & amortization, m
Other administrative expenses, m
Core Bank – Total costs
Cost efficiency under way, total costs down by 2.9% in FY14 supported by
lower staff expenses and depreciation
8,0538,228
2,0471,9932,007
+2.7%
-2.1%
FY14 FY13 4Q14 3Q14 4Q13
4,3014,188
1,0931,0501,109
+4.1%
+2.7%
FY14 FY13 4Q14 3Q14 4Q13
8941,233
239220475
+9.1%
-27.6%
FY14 FY13 4Q14 3Q14 4Q13
13,24713,649
3,3793,2633,591
4Q13
+3.6%
-5.9%
-2.9%
FY14 FY13 4Q14 3Q14
Costs, m
Cost income 64% 60% 61% 60% 60%

UniCredit Group - INTERNAL USE ONLY -
26
127,172
128,035
128,632
129,352
130,147
2Q14 4Q14 3Q14
-863 (-0.7%)
-2,975 (-2%)
1Q14 4Q13
Core Bank – FTE and branches
FTE further down by c.3,000 y/y, almost 900 q/q.
Network restructuring well on track with 500 branches less y/y, -150q/q
FTE (unit)
FTE further down q/q mainly driven by CEE (Croatia and Ukraine)
FTE in Turkey up by almost 1,800 y/y, registering over 18,200 FTE in 4Q14 (not included in consolidated figures)
Network restructuring is providing visible results with almost 500 branches less y/y, mainly in Western Europe
Branches(1) (unit)
-467 (-5.8%)
7,983
7,516
7,665
7,765
1Q14 3Q14
7,921 -149 (-1.9%)
2Q14 4Q14 4Q13
(1) Branches in 2013 excluding Turkey.

UniCredit Group - INTERNAL USE ONLY -
27
Core Bank – Total costs and FTE divisional breakdown
CIB and CEE & Poland most efficient divisions and CB Italy best in class.
FTE further down supporting positive trend in Cost / Income
Divisional breakdown – 4Q14 costs, m
q/q y/y
AM 129
AG 54
CIB 406
CEE 413
Poland 200
CB Austria 378
CB Germany 537
CB Italy 1,028
C/I
Divisional breakdown – FTE(1) (unit)
q/q y/y
AG
AM 2,021
974
CIB 4,020
CEE(1) 29,038
Poland 18,098
CB Austria 6,701
CB Germany 13,419
CB Italy 37,098
(1) FTE including Ukraine (4,830 in 4Q14, 5,015 in 3Q14, and 6,143 in 4Q13). Turkey not included in consolidated figures
(18.216 FTE in 4Q14, 18,488 FTE in 3Q14 and 16,423 in FTE in 4Q13).
(2) Fineco only.
(2)
+5.8% -2.1%
+0.7% +1.5%
+8% +0.2%
-3.9% -1.1%
+2.9% -10.3%
-5.4% -5.2%
+4.5% +14%
+3.6% -23.2%
50%
84%
93%
46%
45%
40%
46%
60%
+4 -443
-158 -329
-52 -190
+177 -54
-536 -1,809
+5 -280
+20 +40
-22 +27
-300 +64

UniCredit Group - INTERNAL USE ONLY -
28
2,135
3,760
754
254
2,033
+196.5%
-43.2%
FY14 FY13 4Q14 3Q14 4Q13
Loan loss provisions, m
Core Bank – Loan loss provisions
LLP up q/q after positive one-offs in 3Q14 but materially down y/y after
additional LLP in 4Q13 to enhance coverage. CoR at 50bp in 2014 (-34bp y/y)
Divisional breakdown – 4Q14 cost of risk, bp
q/q y/y
69
47
142
48
35
13
99
AM n.m.
AG
CIB
CEE
Poland
CB Austria
CB Germany
CB Italy
Cost of risk
186bp 24bp 71bp 84bp 50bp
+59bp -127bp
+22bp +1bp
+21bp -3bp
-1bp -21bp
+35bp -207bp
+78bp -201bp
+30bp -20bp
n.m. n.m.

UniCredit Group - INTERNAL USE ONLY -
29
Core Bank – CEE performance
Balanced contribution across countries in CEE.
South Eastern Europe and Central Europe gaining weight
CEE: shares of main contributors
37%31%
36%
29%
9%
17%
18%23%
Russia(4)
Turkey(3),(4)
2014
100%
2013
Central Europe(2)
South Eastern
Europe(1)
100%
CEE net profit(4) at const. FX, m
(1) South Eastern Europe: Croatia, Romania, Bulgaria, Bosnia, Serbia.
(2) Central Europe: Czech Republic & Slovakia, Hungary, Slovenia.
(3) Consolidated net profit for UCG. Following the consolidation of Yapi Kredi at equity, gross operating profit is managerial data.
(4) Data adjusted for the capital gain from the sale of Yapi Sigorta in Turkey and of MOEX in Russia in 2013.
y/y const. FX(4)
y/y const. FX
Net profit 341
589 GOP
226
GOP
Net profit
553 532
Net profit 354
GOP
Net profit
GOP 851
329
Turkey(3),(4)
Central Europe(2)
South Eastern Europe(1)
Russia(4)
y/y const. FX(4)
y/y const. FX
FY14 FY14
FY14 FY14
1,021 1,121
-9.1%
-5.4%
-6.7%
-1.9%
+111%
+24%
+46.2%
+1.0%

UniCredit Group - INTERNAL USE ONLY -
30
Core Bank – UniCredit Bank Russia
Resilient performance in 2014 despite headwinds. Given its sound
fundamentals UniCredit Bank Russia is better positioned to weather the crisis
Successful bank business model focused on corporate and multinational customers with limited
retail exposures (mainly secured)
Solid bank:
net lender to Group with a sound liquidity position
adequate capital level
Impaired ratios better than peers with sound coverage
Strong results despite ruble devaluation and proactive reaction to crisis aimed at rebalancing
lending portfolio, with reduction of retail unsecured and trading exposure vs. premium corporates
(1) Figures adjusted for the capital gain from the sale of MOEX in 2013.
Euro, m FY13(1) FY14 Y/Y curr. Y/Y const. FX
Revenues 942 796 -15.5% +1.6%
o/w net interest 676 697 3.1% +24.0%
o/w fees 130 126 -3.0% +16.7%
o/w trading profit 124 -30 n.m. n.m.
o/w dividends & other 12 4 -69.5% -63.3%
Costs 296 264 -10.8% 7.3%
Net operating profit 565 447 -20.9% -4.9%
Consolidated profit 457 354 -22.4% -6.7%
Cost/ Income 31% 33% +2pp +6pp
Cost of risk 64bp 66bp +3bp +3bp
Loans to customers 12,247 11,384 -7.0% +48.3%
Direct funding 12,781 12,058 -5.7% +50.6%
Total RWA 16,928 15,690 -7.3% +47.9%

UniCredit Group - INTERNAL USE ONLY -
31
Group
Agenda
Non Core
Core Bank
Annex
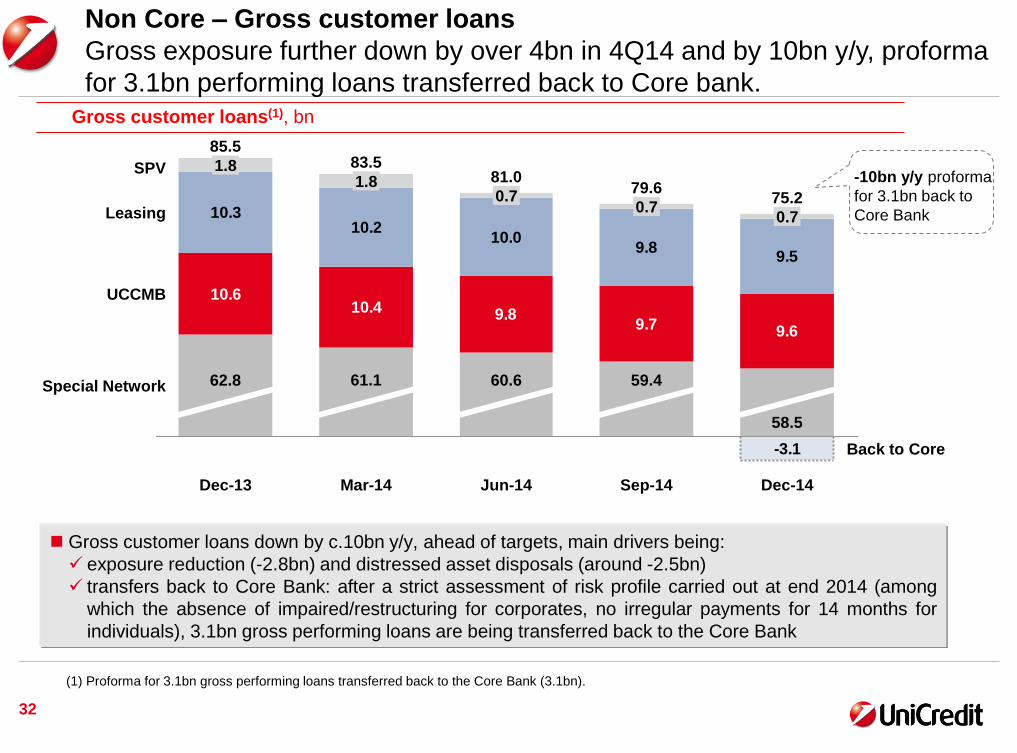
Non Core – Gross customer loans
Gross exposure further down by over 4bn in 4Q14 and by 10bn y/y, proforma
for 3.1bn performing loans transferred back to Core bank.
10.610.4 9.8
9.7 9.6
10.210.0
9.89.5
-3.1
10.3
Back to Core
Special Network
UCCMB
Leasing
SPV
Dec-14
75.2
58.5
0.7
Sep-14
79.6 81.0
60.6
0.7
Mar-14
83.5
61.1
1.8
Dec-13
62.8
85.5
1.8
0.7
Jun-14
59.4
Gross customer loans(1), bn
32
(1) Proforma for 3.1bn gross performing loans transferred back to the Core Bank (3.1bn).
-10bn y/y proforma
for 3.1bn back to
Core Bank
Gross customer loans down by c.10bn y/y, ahead of targets, main drivers being:
exposure reduction (-2.8bn) and distressed asset disposals (around -2.5bn)
transfers back to Core Bank: after a strict assessment of risk profile carried out at end 2014 (among
which the absence of impaired/restructuring for corporates, no irregular payments for 14 months for
individuals), 3.1bn gross performing loans are being transferred back to the Core Bank

33
Non Core – Asset quality
Downward trend of impaired loans confirmed y/y, with sound coverage at
53%. NPL up due to internal migrations whilst other impaired loans down NPL, bn
Restructured loans, bn
37.636.435.3
+3.1%
Dec-14 Sep-14 Dec-13
2.92.12.0
+35.2%
Dec-14 Sep-14 Dec-13
Total gross impaired loans, bn
56.956.657.9
+0.6%
Dec-14 Sep. 14 Dec-13
Doubtful loans, bn
Past due loans, bn
15.316.518.4
-7.5%
Dec-14 Sep-14 Dec-13
1.11.5
2.2 -22.3%
Dec-14 Sep. 14 Dec-13
Coverage ratio
52.9%52.0%53.8%
22.1% 20.5% 21.3%31.3% 30.0% 28.2%
39.8% 35.6% 35.9%64.4% 62.0% 62.7%

UniCredit Group - INTERNAL USE ONLY -
34
Non Core – Results
LLP up q/q after positive one-offs, significantly down y/y after additional LLP in
4Q13 to enhance coverage. Loss down to 1.7bn in FY14
Costs, m
Net loss, m
Revenues, m
LLP, m
330
691
6577139
FY14 FY13 3Q14 4Q14 4Q13
591604
127143155
-8.0%
4Q14 FY13 3Q14 4Q13 FY14
2,157
9,720
943499
7,262
+88.8%
-77.8%
FY14 FY13 4Q14 3Q14 4Q13
1,741
6,520
697380
4,778
+83.5%
-73.3%
FY14 FY13 4Q14 3Q14 4Q13

UniCredit Group - INTERNAL USE ONLY -
35
Concluding remarks
Management actions in 2014 succeeded to bring UniCredit back on a profitable path
leveraging on our sound balance sheet
UniCredit delivered 2bn net profit target in 2014 as a result of progressing core revenue mix,
effective cost-cutting and on the back of positive underlying trends in LLP. CET1 ratio at
10%, ahead of Strategic Plan
We achieved these results in a macro-economic scenario and geo-political environment
characterized by continued headwinds
Clear focus on the three pillars of the Strategic Plan allowed to reap the benefits from
commercial banking activities in Italy, our geographic diversification in CEE leveraging on
our global platforms (CIB and GBS) to achieve revenue and cost synergies
Non Core gross loans run-down ahead of target and cost of risk under control
Scrip dividend of 12 cents (+20% vs 2013) via new shares or cash option, corresponding to
a pay-out of 35%

UniCredit Group - INTERNAL USE ONLY -
36
Group
Agenda
Non Core
Core Bank
Annex

UniCredit Group - INTERNAL USE ONLY -
37
Group – Regulatory capital
CET1 ratio fully loaded at 10% at December 2014, with a quarterly trend
mostly affected by negative impact of FX reserve
SFT(3)
+11.4
Eligible
balance
sheet assets
747.3
Total
exposure
948.5
Regulatory
adjustments
Tier 1
-8.3
Off-balance
sheet
exposure
+154.5
Derivatives
+43.7
Other
Adjustments
+38.0
SFT(3)
-57.7
Derivatives
-71.6
Intangibles
-5.6
Balance
Sheet Assets
844.2
Basel 3 – Leverage ratio fully loaded: quarterly evolution of total exposure composition
Accounting Regulatory
Basel 3 - Common Equity Tier I ratio: q/q evolution
(1) Assuming 2014 scrip dividend of 12 €cents per ordinary share with 75-25% shares-cash acceptance and assuming the full absorption of
DTA on goodwill tax redemption and tax losses carried forward.
(2) Assuming 2014 scrip dividend of 12 €cents per ordinary share with 75-25% shares-cash acceptance. CET 1 ratio transitional including
full cash dividend at 10.26%.
(3) SFT: Securities Financial Transactions, i.e. Repos.
-3bp
FX reserve
-26bp
Dec-14
Transitional(2)
-6bp
Sep-14
Fully loaded
10.27% 10.41%
Phase in
+39bp
Dec-14
Fully loaded(1)
10.02%
Scrip dividend
+13bp
Dividend
-7bp
4Q14 earnings
+4bp
Reserves
& other
RWAs

UniCredit Group - INTERNAL USE ONLY -
38
Gross impaired loans, bn
30.5 31.6 31.6
+1.3%
Dec-14
65.1
Sep-14
64.3
Dec-13
64.5
Gross NPL(2), bn
Italy – Asset quality breakdown
Gross and net impaired loans stabilizing.
Sound coverage ratio above 51%, and 63% on NPL
13.0 14.4 14.6
+3.5%
Dec-14
39.5
Sep-14
38.2
Dec-13
36.5
Other gross impaired loans(2), bn
Coverage ratio(1)
Net impaired loans ratio
Coverage ratio
(1) Inflows from gross performing loans to gross impaired loans in the period; collections and recoveries are the flows from gross
impaired loans back to gross performing loans and the collections of gross impaired loans.
(2) Non performing loans refer to Sofferenze. Other impaired loans include doubtful loans, restructured loans and past-due loans.
Net impaired
Net NPL
12.7% 14.1% 14.3%
52.7% 50.8% 51.4%
64.5% 62.2% 63.0%
Additions to total impaired loans(2), m
52.9% ex. disposals
booked in
FY14
21.7 20.7 20.0
3.23.52.8
3.0
Restructured
Past due
Doubtful
-1.9%
25.6
Sep-14
26.1
2.1
Dec-13
27.9
2.5
Dec-14
-2,192 -2,058 -2,564 -2,807 -2,185 -2,512
3,608 3,644 3,5484,946
2,545 3,071 2,635 3,486
-1,732-1,698
2,382
2Q14
-262
1Q14
886
1Q13
1,453 1,909
3Q13 4Q13 2Q13
1,490 974
4Q14 3Q14
903
Inflows to Impaired
Collections and recoveries
Out '13: 8.5bn Out '14: 9.2bn (+8% y/y)

UniCredit Group - INTERNAL USE ONLY -
Italian total perimeter(1)
Italian businesses delivered positive results in 2014, supporting the
consolidation of a positive trend in a difficult environment
Costs, m Net profit, m
NII, m
-0.1%
+5.9%
FY14
5,106
FY13
4,824
4Q14
1,240
3Q14
1,281
4Q13
1,241
+6.1%
+5.9%
FY14
4,020
FY13
3,797
4Q14
997
3Q14
956
4Q13
940
FY14
5,301
FY13
5,422
4Q14
1,332
3Q14
1,283
4Q13
1,368
-2.6%
-2.2% 318
FY14 FY13
-5,064
4Q14
-373
3Q14
239
4Q13
-4,378
(1) Italian perimeter includes: Commercial Bank Italy, Non Core portfolio, CIB Italy, Asset Management related to funds
distributed through the Italian network, Fineco, GBS related to relevant Italian activities, Corporate Center activities related to
the Italian business.
Fees, m
39

UniCredit Group - INTERNAL USE ONLY -
40
Group – P&L and volumes
Net profit of 2bn for 2014, in line with target.
Revenue trend in 2014 affected by trading, despite improving core revenues
Euro (mln) 4Q13 1Q14 2Q14 3Q14 4Q14 ∆ % vs. ∆ % vs. FY13 FY14 ∆ % vs.
3Q14 4Q13 FY13
Total Revenues 5,789 5,578 5,789 5,551 5,595 +0.8% ▲ -3.4% ▼ 23,335 22,513 -3.5% ▼
Operating Costs -3,746 -3,510 -3,416 -3,406 -3,506 +2.9% ▲ -6.4% ▼ -14,253 -13,838 -2.9% ▼
Gross Operating Profit 2,043 2,068 2,373 2,145 2,089 -2.6% ▼ +2.2% ▲ 9,082 8,675 -4.5% ▼
LLP -9,295 -838 -1,003 -754 -1,697 +125.2% ▲ -81.7% ▼ -13,481 -4,292 -68.2% ▼
Profit Before Taxes -7,582 1,275 1,171 1,285 360 -72.0% ▼ n.m. ▲ -5,220 4,091 n.m. ▲
Net Profit -14,979 712 403 722 170 -76.4% ▼ n.m. ▲ -13,965 2,008 n.m. ▲
Cost / Income Ratio, % 65% 63% 59% 61% 63% +1pp ▲ -2pp ▼ 61% 61% +0pp ▲
Cost of Risk, bp 753bp 69bp 84bp 64bp 144bp +80bp ▲ -608bp ▼ 265bp 90bp -175bp ▼
RoTE n.m. 6.9% 3.9% 6.9% 1.6% -5.3pp ▼ n.m. ▲ n.m. 4.9% n.m. ▲
Customer Loans 483,684 483,782 474,798 470,356 470,569 +0.0% -2.7% 483,684 470,569 -2.7%
Direct Funding 557,379 560,163 561,005 554,908 560,688 +1.0% +0.6% 557,379 560,688 +0.6%
Total RWA 384,755 418,871 398,702 401,238 409,223 +2.0% +6.4% 384,755 409,223 +6.4%
FTE (#) 132,122 131,333 130,577 129,958 129,021 -0.7% -2.3% 132,122 129,021 -2.3%

UniCredit Group - INTERNAL USE ONLY -
41
Core Bank – P&L and volumes
Visible improvement delivered a sound net profit at almost 4bn in 2014
Net profit 2Q14 and 9M14 does not include the 215 m impact of the revised tax charge related to valuation of the stake in Banca d'Italia.
Euro (mln) 4Q13 1Q14 2Q14 3Q14 4Q14 ∆ % vs. ∆ % vs. FY13 FY14 ∆ % vs.
3Q14 4Q13 FY13
Total Revenues 5,650 5,479 5,699 5,475 5,530 +1.0% ▲ -2.1% ▼ 22,644 22,183 -2.0% ▼
Operating Costs -3,591 -3,337 -3,268 -3,263 -3,379 +3.6% ▲ -5.9% ▲ -13,649 -13,247 -2.9% ▼
Gross Operating Profit 2,059 2,143 2,431 2,212 2,150 -2.8% ▼ +4.4% ▲ 8,995 8,936 -0.7% ▼
LLP -2,033 -522 -604 -254 -754 n.m. ▲ -62.9% ▲ -3,760 -2,135 -43.2% ▼
Profit Before Taxes -257 1,686 1,698 1,854 1,405 -24.2% ▼ n.m. ▲ 4,486 6,644 +48.1% ▲
Net Profit -10,200 1,012 768 1,102 868 -21.3% ▼ n.m. ▲ -7,445 3,749 n.m. ▲
Cost / Income Ratio, % 64% 61% 57% 60% 61% +2pp ▲ -2pp ▼ 60% 60% -1pp ▼
Cost of Risk, bp 186bp 48bp 56bp 24bp 71bp +47bp ▲ -115bp ▼ 84bp 50bp -34bp ▼
RoAC n.m. 11.9% 8.2% 13.6% 9.8% -3.8pp ▼ n.m. ▲ n.m. 10.8% n.m. ▲
Customer Loans 430,311 431,541 423,988 420,871 423,152 +0.5% -1.7% 430,311 423,152 -1.7%
Direct Funding 554,902 557,833 558,643 552,573 558,353 +1.0% +0.6% 554,902 558,353 +0.6%
Total RWA 353,360 383,079 365,239 368,243 370,143 +0.5% +4.7% 353,360 370,143 +4.7%
FTE (#) 130,147 129,352 128,632 128,035 127,172 -0.7% -2.3% 130,147 127,172 -2.3%

UniCredit Group - INTERNAL USE ONLY -
42
Commercial Bank Italy – P&L and volumes
In 2014 net profit materially progressed with strong operating profitability and
lower LLP
Euro (mln) 4Q13 1Q14 2Q14 3Q14 4Q14 ∆ % vs. ∆ % vs. FY13 FY14 ∆ % vs.
3Q14 4Q13 FY13
Total Revenues 1,960 2,111 2,149 2,024 2,043 +0.9% ▲ +4.2% ▲ 7,836 8,327 +6.3% ▲
Operating Costs -1,051 -1,035 -986 -971 -1,028 +5.8% ▲ -2.1% ▼ -4,185 -4,020 -3.9% ▼
Gross Operating Profit 909 1,076 1,164 1,053 1,015 -3.6% ▼ +11.6% ▲ 3,650 4,307 +18.0% ▲
LLP -746 -280 -295 -129 -322 149.1% ▲ -56.8% ▼ -1,316 -1,026 -22.0% ▼
Profit Before Taxes -74 780 818 886 673 -24.0% ▼ n.m. ▲ 2,040 3,158 +54.8% ▲
Net Profit 75 497 569 590 459 -22.1% ▼ n.m. ▲ 1,441 2,114 +46.7% ▲
Cost / Income Ratio, % 54% 49% 46% 48% 50% +2pp ▲ -3pp ▼ 53% 48% -5pp ▼
Cost of Risk, bp 226bp 85bp 90bp 40bp 99bp +59bp ▲ -127bp ▼ 98bp 78bp -20bp ▼
RoAC 4.5% 27.9% 33.0% 31.7% 24.9% -6.8pp ▼ 20.5pp ▲ 20.3% 29.3% +9.0pp ▲
Customer Loans 130,931 131,804 130,929 130,136 130,005 -0.1% -0.7% 130,931 130,005 -0.7%
Direct Funding 149,802 147,799 143,983 142,362 145,215 +2.0% -3.1% 149,802 145,215 -3.1%
Total RWA 77,629 75,490 74,860 76,414 76,472 +0.1% -1.5% 77,629 76,472 -1.5%
TFA 317,017 321,900 321,502 323,461 327,136 +1.1% 3.2% 317,017 327,136 +3.2%
FTE (#) 37,541 37,370 37,412 37,094 37,098 +0.0% -1.2% 37,541 37,098 -1.2%

UniCredit Group - INTERNAL USE ONLY -
43
Commercial Bank Germany – P&L and volumes
In 2014 net profit improved significantly with cost cutting and sound cost of risk
offsetting revenue slowdown
Euro (mln) 4Q13 1Q14 2Q14 3Q14 4Q14 ∆ % vs. ∆ % vs. FY13 FY14 ∆ % vs.
3Q14 4Q13 FY13
Total Revenues 679 692 674 637 637 -0.1% ▼ -6.3% ▼ 2,874 2,640 -8.1% ▼
Operating Costs -529 -523 -510 -533 -537 0.7% ▲ +1.5% ▲ -2,123 -2,102 -1.0% ▼
Gross Operating Profit 150 169 164 104 100 -4.1% ▼ -33.5% ▼ 751 538 -28.4% ▼
LLP -23 -15 -5 18 -25 n.m. ▲ +6.0% ▲ 49 -26 n.m. ▲
Profit Before Taxes -252 158 166 107 236 120.1% ▲ n.m. ▲ 424 666 +57.2% ▲
Net Profit -155 105 111 73 215 195.0% ▲ n.m. ▲ 292 503 72.4% ▲
Cost / Income Ratio, % 78% 76% 76% 84% 84% +1pp ▲ +6pp ▲ 74% 80% +6pp ▲
Cost of Risk, bp 12bp 8bp 2bp -9bp 13bp +22bp ▲ +1bp ▲ -6bp 3bp +9bp ▲
RoAC n.m. 14.4% 15.5% 10.4% 30.8% +20.4pp ▲ n.m. ▲ 9.4% 17.7% +8.3pp ▲
Customer Loans 79,057 78,537 78,783 78,765 78,416 -0.4% -0.8% 79,057 78,416 -0.8%
Direct Funding 108,343 105,562 104,709 102,044 102,236 +0.2% -5.6% 108,343 102,236 -5.6%
Total RWA 33,823 35,199 32,683 33,598 33,510 -0.3% -0.9% 33,823 33,510 -0.9%
TFA 140,317 141,691 144,573 145,445 147,051 +1.1% +4.8% 140,317 147,051 +4.8%
FTE (#) 13,748 13,582 13,502 13,577 13,419 -1.2% -2.4% 13,748 13,419 -2.4%

UniCredit Group - INTERNAL USE ONLY -
44
Commercial Bank Austria – P&L and volumes
Management actions in place to offset low interest rates environment affecting
a business characterized by narrow margins
Euro (mln) 4Q13 1Q14 2Q14 3Q14 4Q14 ∆ % vs. ∆ % vs. FY13 FY14 ∆ % vs.
3Q14 4Q13 FY13
Total Revenues 425 387 439 374 407 8.8% ▲ -4.1% ▼ 1,619 1,607 -0.7% ▼
Operating Costs -378 -366 -366 -350 -378 8.0% ▲ +0.2% ▼ -1,451 -1,460 +0.6% ▲
Gross Operating Profit 47 21 72 24 29 20.6% ▲ -38.3% ▼ 168 147 -12.6% ▼
LLP -46 -48 -4 -17 -41 144.0% ▼ -10.6% ▲ -193 -111 -42.7% ▼
Profit Before Taxes -203 12 47 -5 -40 n.m. ▼ -80.1% ▲ -330 14 n.m. ▲
Net Profit -439 12 56 35 -67 n.m. ▼ n.m. ▲ -580 37 n.m. ▲
Cost / Income Ratio, % 89% 94% 83% 94% 93% -1pp ▼ +4pp ▲ 90% 91% +1pp ▲
Cost of Risk, bp 38bp 40bp 4bp 14bp 35bp +21bp ▲ -3bp ▼ 39bp 23bp -16bp ▼
RoAC n.m. 2.1% 9.5% 5.8% -15.2% -21.0pp ▼ n.m. ▼ -26.0% 1.7% +27.7pp ▲
Customer Loans 48,392 47,877 48,083 47,442 47,379 -0.1% -2.1% 48,392 47,379 -2.1%
Direct Funding 59,134 60,932 60,630 63,610 64,186 +0.9% +8.5% 59,134 64,186 +8.5%
Total RWA 25,142 27,169 23,838 24,080 24,047 -0.1% -4.4% 25,142 24,047 -4.4%
TFA 80,265 82,022 82,310 84,849 85,785 +1.1% +6.9% 80,265 85,785 +6.9%
FTE (#) 6,891 6,806 6,637 6,754 6,701 -0.8% -2.8% 6,891 6,701 -2.8%

UniCredit Group - INTERNAL USE ONLY -
45
Poland – P&L and volumes
Operational excellence, coupled with low cost of risk deliver a resilient
profitability despite pressure on revenues related to lower interest rates
N.B. Variations at constant FX.
Euro (mln) 4Q13 1Q14 2Q14 3Q14 4Q14 ∆ % vs. ∆ % vs. FY13 FY14 ∆ % vs.
3Q14 4Q13 FY13
Total Revenues 456 429 447 448 437 -1.5% ▼ -3.6% ▼ 1,793 1,760 -2.1% ▼
Operating Costs -202 -206 -209 -208 -200 -3.0% ▼ -0.5% ▼ -825 -823 -0.5% ▼
Gross Operating Profit 254 223 238 239 237 -0.2% ▼ -6.1% ▼ 968 937 -3.5% ▼
LLP -42 -35 -34 -32 -32 -0.9% ▼ -24.3% ▼ -159 -134 -16.0% ▼
Profit Before Taxes 216 187 203 207 206 0.2% ▲ -4.4% ▼ 817 803 -2.1% ▼
Net Profit 88 77 84 84 83 0.2% ▲ -4.7% ▼ 331 327 -1.6% ▼
Cost / Income Ratio, % 44% 48% 47% 47% 46% -1pp ▼ +1pp ▲ 46% 47% +1pp ▲
Cost of Risk, bp 69bp 56bp 53bp 49bp 48bp -2bp ▼ -21bp ▼ 67bp 51bp -15bp ▼
RoAC 31.5% 27.0% 29.6% 29.9% 28.9% -1.1pp ▼ -2.6pp ▼ 30.4% 28.8% -1.6pp ▼
Customer Loans 25,033 25,539 26,381 26,445 26,896 +4.0% +10.5% 25,033 26,896 +10.5%
Direct Funding 29,538 27,496 28,388 29,718 30,218 +4.0% +5.2% 29,538 30,218 +5.2%
Total RWA 25,089 25,222 24,703 25,177 25,850 +5.0% +6.0% 25,089 25,850 +6.0%
FTE (#) 18,152 18,129 18,069 17,920 18,098 +1.0% -0.3% 18,152 18,098 -0.3%

UniCredit Group - INTERNAL USE ONLY -
46
CEE – P&L and volumes
Geographical diversification delivered positive earning generation and cost
efficiency across most of the countries despite higher cost of risk
N.B. Variations at constant FX.
Euro (mln) 4Q13 1Q14 2Q14 3Q14 4Q14 ∆ % vs. ∆ % vs. FY13 FY14 ∆ % vs.
3Q14 4Q13 FY13
Total Revenues 1,174 902 1,002 1,086 919 -10.8% ▼ -15.5% ▼ 4,478 3,909 -7.0% ▼
Operating Costs -461 -415 -393 -402 -413 +6.9% ▲ -4.2% ▼ -1,722 -1,623 -0.9% ▼
Gross Operating Profit 713 487 610 685 505 -20.9% ▼ -22.5% ▼ 2,757 2,287 -10.7% ▼
LLP -505 -148 -168 -156 -204 34.5% ▲ -57.3% ▼ -1,124 -677 -37.2% ▼
Profit Before Taxes 169 326 405 453 290 -28.1% ▼ +68.6% ▲ 1,533 1,474 +4.4% ▲
Net Profit 108 262 309 334 129 -65.5% ▼ -16.5% ▼ 1,264 1,034 -16.4% ▼
Cost / Income Ratio, % 39% 46% 39% 37% 45% +7pp ▲ +5pp ▲ 38% 42% +2pp ▲
Cost of Risk, bp 348bp 105bp 119bp 107bp 142bp +29bp ▲ -206bp ▼ 192bp 118bp -75bp ▼
RoAC 6.2% 14.4% 16.8% 19.0% 6.4% -12.6pp ▼ +0.2pp ▲ 16.6% 13.9% -2.7pp ▼
Customer Loans 57,163 55,822 57,781 58,384 57,009 +7.4% +13.2% 57,163 57,009 +13.2%
Direct Funding 49,473 47,304 48,361 50,036 51,469 +15.4% +20.2% 49,473 51,469 +20.2%
Total RWA 81,668 83,387 81,681 84,530 89,173 +14.9% +24.3% 81,668 89,173 +24.3%
FTE (#) 30,848 30,621 30,095 29,574 29,038 -1.8% -5.9% 30,848 29,038 -5.9%

UniCredit Group - INTERNAL USE ONLY -
47
Customer Loans and Customer Deposits exclude repos, Market and Institutional counterparts.
CIB – P&L and volumes
Net profit up q/q as client flows and synergies across product factories
mitigated the ever-low rates environment, tightening spreads and low volatility
Euro (mln) 4Q13 1Q14 2Q14 3Q14 4Q14 ∆ % vs. ∆ % vs. FY13 FY14 ∆ % vs.
3Q14 4Q13 FY13
Total Revenues 1,050 983 900 805 1,023 27.1% ▲ -2.6% ▼ 4,284 3,711 -13.4% ▼
Operating Costs -428 -451 -425 -429 -406 -5.4% ▼ -5.2% ▼ -1,707 -1,710 +0.2% ▲
Gross Operating Profit 622 532 475 376 618 64.3% ▲ -0.8% ▼ 2,577 2,001 -22.4% ▼
LLP -608 0 -101 67 -101 n.m. ▲ -83.3% ▼ -942 -135 -85.7% ▼
Profit Before Taxes -123 571 301 460 469 2.0% ▲ n.m. ▲ 1,448 1,802 +24.5% ▲
Net Profit -23 389 205 269 399 48.4% ▲ n.m. ▲ 1,036 1,263 +21.9% ▲
Cost / Income Ratio, % 41% 46% 47% 53% 40% -14pp ▼ -1pp ▼ 40% 46% +6pp ▲
Cost of Risk, bp 248bp 0bp 44bp -31bp 47bp +78bp ▲ -201bp ▼ 92bp 15bp -77bp ▼
RoAC n.m. 22.4% 11.7% 17.3% 21.1% +3.8pp ▲ n.m. ▲ 13.7% 18.2% +4.5pp ▲
Commercial Loans 50,723 49,722 49,139 47,208 50,074 +6.1% -1.3% 50,723 50,074 -1.3%
Commercial Deposits 27,420 28,043 28,766 29,833 30,677 +2.8% +11.9% 27,420 30,677 +11.9%
Total RWA 74,528 76,850 70,338 70,166 67,462 -3.9% -9.5% 74,528 67,462 -9.5%
FTE (#) 4,300 4,117 4,025 4,015 4,020 +0.1% -6.5% 4,300 4,020 -6.5%

UniCredit Group - INTERNAL USE ONLY -
48
Asset Gathering – P&L and volumes
Solid and sustainable results with a double digit growth q/q and y/y.
Revenue growing at a higher pace vs costs due to a strong operating leverage
Euro (mln) 4Q13 1Q14 2Q14 3Q14 4Q14 ∆ % vs. ∆ % vs. FY13 FY14 ∆ % vs.
3Q14 4Q13 FY13
Total Revenues 110 113 113 107 118 +9.6% ▲ +7.3% ▲ 429 451 +5.1% ▲
Operating Costs -47 -52 -55 -51 -54 +4.5% ▲ +14.0% ▲ -192 -212 +10.6% ▲
Gross Operating Profit 63 61 58 56 64 +14.3% ▲ +2.2% ▲ 237 239 +0.7% ▲
LLP -1 0 -1 -1 -1 +75.6% ▲ -8.7% ▼ -3 -3 -2.9% ▼
Profit Before Taxes 48 58 57 55 60 +10.4% ▲ +26.3% ▲ 216 230 +6.3% ▲
Net Profit 17 37 37 23 27 +14.1% ▲ +59.9% ▲ 121 124 +2.0% ▲
Cost / Income Ratio, % 43% 46% 49% 48% 46% -2pp ▼ +3pp ▲ 45% 47% +2pp ▲
Cost of Risk, bp 88bp 28bp 48bp 39bp 69bp +30bp ▲ -20bp ▼ 58bp 47bp -11bp ▼
RoAC 40.9% 85.8% 93.1% 89.8% 107.2% +17.4pp ▲ +66.3pp ▲ 72.5% 91.1% +18.6pp ▲
Customer Loans 641 669 696 700 696 -0.7% +8.5% 641 696 +8.5%
Direct Funding 13,246 13,969 14,344 14,097 14,254 +1.1% +7.6% 13,246 14,254 +7.6%
Total RWA 1,915 1,905 1,635 1,624 1,742 +7.2% -9.0% 1,915 1,742 -9.0%
TFA 43,607 45,607 47,196 48,181 49,341 +2.4% +13.2% 43,607 49,341 +13.2%
FTE (#) 934 935 944 953 974 +2.1% +4.3% 934 974 +4.3%

UniCredit Group - INTERNAL USE ONLY -
49
Asset Management – P&L and volumes
Net profit doubled in 2014 with revenues up with fees sustained by strong net
sales. Costs down by 6% in FY14
Euro (mln) 4Q13 1Q14 2Q14 3Q14 4Q14 ∆ % vs. ∆ % vs. FY13 FY14 ∆ % vs.
3Q14 4Q13 FY13
Total Revenues 199 185 191 199 217 9.1% ▲ +8.5% ▲ 731 791 +8.2% ▲
Operating Costs -168 -120 -123 -125 -129 3.6% ▲ -23.2% ▼ -528 -496 -6.0% ▼
Gross Operating Profit 31 66 68 74 87 18.3% ▲ +178.8% ▲ 203 295 +45.1% ▲
LLP 0 0 0 0 0 n.m. n.m. 0 0 n.m.
Profit Before Taxes 26 67 66 72 81 12.1% ▲ n.m. ▲ 192 286 +48.7% ▲
Net Profit -28 47 47 48 36 -24.3% ▼ n.m. ▲ 88 178 +102.3% ▲
Cost / Income Ratio, % 84% 65% 64% 63% 60% -3pp ▼ -25pp ▼ 72% 63% -9pp ▼
Cost of Risk, bp n.m. n.m. n.m. n.m. n.m. n.m. n.m. n.m. n.m. n.m.
RoAC n.m. 70.3% 70.3% 71.7% 54.3% -17.5pp ▼ n.m. ▲ 33.7% 66.7% +33.0pp ▲
Total RWA 2,046 2,097 1,619 1,520 1,693 +11.4% -17.3% 2,046 1,693 -17.3%
TFA 181,700 187,020 193,230 203,546 208,694 +2.5% +14.9% 181,700 208,694 +14.9%
o.w. AuM 173,925 179,463 185,522 195,713 201,030 +2.7% +15.6% 173,925 201,030 +15.6%
FTE (#) 1,995 2,007 2,021 2,044 2,021 -1.1% +1.3% 1,995 2,021 +1.3%

UniCredit Group - INTERNAL USE ONLY -
50
Non Core – P&L and volumes
Loss at 1.7bn in FY14 significantly down vs FY13.
Cost of risk at 425bp in 2014, threefold lower versus 2013
Euro (mln) 4Q13 1Q14 2Q14 3Q14 4Q14 ∆ % vs. ∆ % vs. FY13 FY14 ∆ % vs.
3Q14 4Q13 FY13
Total Revenues 139 99 89 77 65 -15.4% ▼ -53.3% ▼ 691 330 -52.2% ▼
Operating Costs -155 -174 -148 -143 -127 -11.4% ▼ -18.5% ▼ -604 -591 -2.2% ▼
Gross Operating Profit -16 -75 -58 -66 -62 n.m. ▲ n.m. ▼ 87 -261 n.m. ▼
LLP -7,262 -316 -399 -499 -943 +88.8% ▲ -87.0% ▼ -9,720 -2,157 -77.8% ▼
Profit Before Taxes -7,326 -411 -527 -569 -1,045 +83.6% ▼ -85.7% ▲ -9,707 -2,553 -73.7% ▲
Net Profit -4,778 -299 -365 -380 -697 +83.5% ▼ -85.4% ▲ -6,520 -1,741 -73.3% ▲
Cost / Income Ratio, % 112% 175% 165% 186% 195% +9pp ▲ +83pp ▲ 87% 179% +92pp ▲
Cost of Risk, bp 5034bp 239bp 310bp 398bp 778bp +380bp ▲ n.m. ▼ 1541bp 425bp n.m. ▼
RoAC n.m. n.m. n.m. n.m. n.m. n.m. n.m. n.m. n.m. n.m.
Customer Loans 53,373 52,241 50,811 49,485 47,417 -4.2% -11.2% 53,373 47,417 -11.2%
Direct Funding 2,478 2,330 2,361 2,335 2,334 +0.0% -5.8% 2,478 2,334 -5.8%
Total RWA 31,395 35,792 33,463 32,995 39,080 +18.4% +24.5% 31,395 39,080 +24.5%
FTE (#) 1,974 1,981 1,945 1,923 1,849 -3.9% -6.3% 1,974 1,849 -6.3%