unicredit - globalcapital · unicredit’s ratings reflect its good geographical and business...
TRANSCRIPT
UniCredit
292 EuroWeek Financing financial institutions
UniCredit
- 2005 2006 2007 2008 2009 2010
Covered bonds Subordinated debt Senior unsecured Securitisation
5,000 10,000 15,000 20,000 25,000 30,000 35,000
40,000 45,000
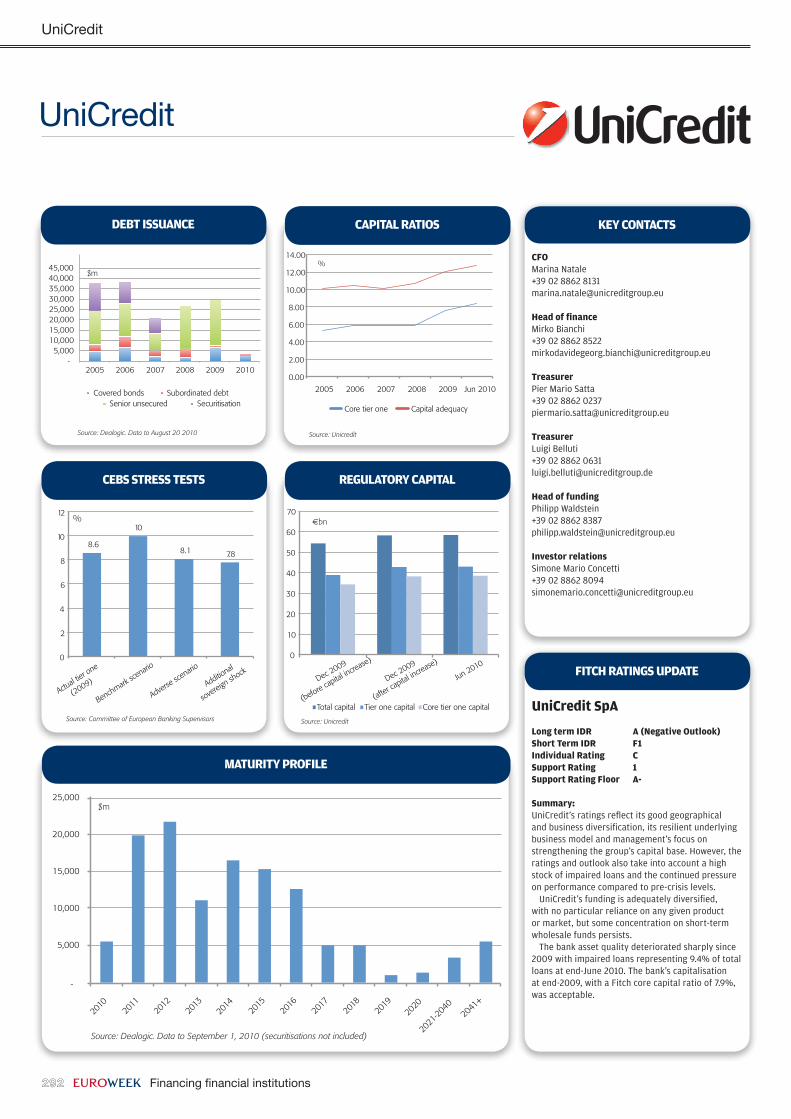
Debt issuance
$m
Source: Dealogic. Data to August 20 2010
Debt issuance
-
2010
2011
2012
2013
2014
2015
2016
2017
2018
2019
2020
2021
-204
0
2041
+
5,000
10,000
15,000
20,000
25,000
Source: Dealogic. Data to September 1, 2010 (securitisations not included)
$m
Maturity Profile
Source: Unicredit
%
0.00
2.00
4.00
6.00
8.00
10.00
12.00
14.00
2005 2006 2007 2008 2009 Jun 2010
Core tier one Capital adequacy
caPital ratios
Actual t
ier one
(2009)
Benchmark sc
enario
Adverse
scenario
Additional
sovereig
n shock
Source: Committee of European Banking Supervisors
%
8.6
10
8.1 7.8
0
2
4
6
8
10
12
cebs stress tests
cfoMarina Natale+39 02 8862 [email protected]
Head of financeMirko Bianchi+39 02 8862 [email protected]
treasurerPier Mario Satta+39 02 8862 [email protected]
treasurerLuigi Belluti+39 02 8862 [email protected]
Head of fundingPhilipp Waldstein+39 02 8862 [email protected]
investor relationsSimone Mario Concetti+39 02 8862 [email protected]
Key contacts
Source: Unicredit
�bn
0
10
20
30
40
50
60
70
Dec 2009
(before capital
increase
)
Dec 2009
(after ca
pital incre
ase)
Jun 2010
Total capital Tier one capital Core tier one capital
regulatory caPital
unicredit spa
long term iDr a (negative outlook)short term iDr f1individual rating csupport rating 1support rating floor a-
summary:UniCredit’s ratings reflect its good geographical and business diversification, its resilient underlying business model and management’s focus on strengthening the group’s capital base. However, the ratings and outlook also take into account a high stock of impaired loans and the continued pressure on performance compared to pre-crisis levels.
UniCredit’s funding is adequately diversified, with no particular reliance on any given product or market, but some concentration on short-term wholesale funds persists.
The bank asset quality deteriorated sharply since 2009 with impaired loans representing 9.4% of total loans at end-June 2010. The bank’s capitalisation at end-2009, with a Fitch core capital ratio of 7.9%, was acceptable.
fitcH ratings uPDate

UniCredit
Financing financial institutions EuroWeek 293
unicredit spa
issue type: TierI
Pricing date: July14,2010
Value: €500m
Maturity date: Perpetualnon-call10
coupon: 9.375%
bookrunners: CreditSuisse,JPMorgan,Hypovereinsbank
unicredit bank austria ag
issue type: Coveredbond
Pricing date: June8,2010
Value: €750m
Maturity date: June15,2015
coupon: 2.375%
bookrunners: BayernLB,DZBank,ErsteGroupBank,LBBW,UniCreditGroup
unicredit bank ag
issue type: Coveredbond
Pricing date: May20,2010
Value: €500m
Maturity date: May31,2017
coupon: 2.625%
bookrunners: BayernLB,GudmeRaaschouBank,NordLB,UniCreditGroup,WestLB
Source: Dealogic
rank lead Manager amount $m no of issues
% share
1 UniCredit Group 5,488 33 42.59
2 SG Corporate & Investment Banking
1,108 3 8.6
3 LBBW 671 6 5.2
4 HSBC 588 3 4.56
5 Natixis 552 4 4.28
6 BNP Paribas 494 4 3.83
7 Deutsche Bank 471 2 3.65
8 DZ Bank 467 3 3.63
9 ING 393 2 3.05
10 BayernLB 300 2 2.33
subtotal 10,530 42 81.73
total 12,884 48 100
Source: Dealogic (Sep 20, 2009 to Sep 19, 2010)
recent Deals
toP booKrunners
bp
Five year senior CDS prices. Source: Markit
24-Au
g-2009
24-Se
p-2009
24-O
ct-20
09
24-N
ov-20
09
24-D
ec-20
09
24-Ja
n-201
0
24-Fe
b-201
0
24-M
ar-20
10
24-Ap
r-201
0
24-M
ay-20
10
24-Ju
n-201
0
24-Ju
l-201
0
24-Au
g-201
0 0
50
100
150
200
250
UniCreditUBS
Intesa SanpaoloDeutsche Bank
Commerzbank
cDs Pricing
Source: Unicredit
%
50.0
52.0
54.0
56.0
58.0
60.0
62.0
64.0
2005 2006 2007 2008 2009 1H10
cost/incoMe ratio
Source: Unicredit
%
0.0
2.0
4.0
6.0
8.0
10.0
12.0
14.0
16.0
18.0
2005 2006 2007 2008 2009 1H10
return on equity
Source: Unicredit
�m
0
500
1000
1500
2000
2500
3000
3500
4000
4500
1Q09 2Q09 3Q09 4Q09 1Q10 2Q10
Operating profit Net profit attributable to the group
incoMe stateMent
Source: Unicredit
�bn
0
200
400
600
800
1000
1200
2005 2006 2007 2008 2009 Jun 2010
total assets