unexploited gains from international...
TRANSCRIPT

Unexploited Gains from International Diversification?
Tatiana Didier a Roberto Rigobon b,c
Sergio L. Schmukler a,*
December 17, 2008
Abstract
Using unique micro data on U.S. institutional investor portfolios, this paper studies how capital, meant to be invested globally, is actually diversified internationally. We show that although the mutual fund industry has moved toward funds that have more flexibility to invest across countries and regions (global funds), mutual funds invest in a finite, rather small number of firms, almost independently of the set of available instruments. The number of mutual fund holdings in stocks and countries from a given region declines as funds become more global. This restricted investment practice has a cost: there are unexploited gains from international diversification. Mutual funds could achieve better returns by broadening their investment scope to include stocks held by specialized funds within the same mutual fund family. This investment pattern is neither explained by the lack of available instruments or information, nor by a better ability of global funds to minimize losses. JEL Classification Codes: F30, F36, G11, G15, G23 Keywords: financial integration, globalization, mutual funds, risk diversification
a
World Bank, b
MIT, c NBER.
* For very helpful comments, we would like to thank Ricardo Caballero, Julian di Giovanni, Graciela Kaminsky, Michael Klein, Dani Rodrik, and participants at presentations held at the AEA Annual Meetings (Chicago), the European Central Bank, Harvard’s Kennedy School of Government, the IMF, the LACEA Annual Meetings (Mexico City), and the IMF Ninth Jacques Polak Annual Research Conference. We are grateful to Tiago Caruso, Francisco Ceballos, Jennifer J. Kim, Ricardo C. Leal, Mercedes Politi, Juliana Portella, and Mira Olson, who provided excellent research assistance at different stages of the project. The views expressed here do not necessarily represent those of the World Bank. E-mail addresses: [email protected], [email protected], and [email protected].

2
I. Introduction
Financial globalization has advanced substantially since the early 1990s. In fact, the
degree of financial globalization achieved in the last decade has been unprecedented.1
One of the key drivers of the increased globalization has been the potential gains from
international diversification. On the supply side of funds, investors can reduce risk for a
given level of expected returns (or increase returns for a given level of risk) by investing
internationally.2 On the demand side, governments and firms can reduce the cost of
capital by tapping international investors as well as decrease the exposure of their balance
sheet to macroeconomic shocks.3
Despite the potential benefits from globalization and the sharp increase in the
level of international financial integration, the evidence suggests that investors are still
not diversified enough.4 The literature has mostly concentrated on evidence based on
aggregate measures and has only recently begun to exploit asset-level data.5 Several
factors might explain the insufficient diversification: the role of non-tradable goods;6 the
existence of explicit barriers to international investment;7 and the existence of implicit
barriers, such as political or country risks, and informational asymmetries, including
“familiarity” effects.8
1 See, for example, Frankel (2000), Eichengreen (2001), Obstfeld and Taylor (2002), Stulz (2005), and Kose et al. (2006). 2 For example, Harvey (1995) provides evidence that the standard deviation of the global minimum variance portfolio could be reduced by 6% by including emerging markets assets in portfolios between 1986 and 1992. 3 See, for example, Rajan and Zingales (1998), Stulz (1999), Beck et al. (2000), Bekaert and Harvey (2000), and Mishkin (2007). 4 There is a large literature on home bias suggesting that investors are not nearly as internationally diversified as their consumption and income paths would imply. See Lewis (1999) and Karolyi and Stulz (2003) for comprehensive surveys of the literature. 5 For studies focusing on accumulated capital flows and valuation adjustments, see, for example, Cooper and Kaplanis (1994), Tesar and Werner (1995), Brennan and Cao (1997), Froot et al. (2001), Kaminsky et al. (2001), Borensztein and Gelos (2003), Warnock and Cleaver (2003), and Gelos and Wei (2005). For studies using firm-level data, see, for example, Kang and Stulz (1997), Dahlquist and Robertsson (2001), Ahearne et al. (2004), Chan et al. (2005), and Ammer et al. (2006). 6 See, for example, Baxter and Jermann (1997), Obstfeld and Rogoff (2001), Pesenti and van Wincoop (2002), and Engel and Matsumoto (2005). 7 Explicit barriers include foreign exchange control, withholding taxes, and other directly observable obstacles. See, for example, Black (1974), Stulz (1981), Eun and Janakiramanan (1986), Errunza and Losq (1985), Stulz and Wasserfallen (1995), and Henry (2000). 8 Some of the papers that mention the presence of implicit barriers are Merton (1987), French and Poterba (1991), Cooper and Kaplanis (1994), Tesar and Werner (1995), Coval and Moskowitz (1999), Huberman (2001), Bertaut and Kole (2004), Chan et al. (2005), and Portes and Rey (2005).

3
In this paper, we construct a unique micro dataset of actual asset-level portfolios
for a group of large institutional investors, namely, U.S. mutual funds. This unique
dataset allows us to shed light on interesting aspects of the extent of international
diversification. Importantly, we are able to analyze portfolios and the degree of
international diversification for different types of funds within the same mutual fund
family. That is, we study funds with different mandates to invest around the world. Some
funds are specialized in some countries or regions (specialized funds), while others are
meant to invest more globally (global funds). Naturally, the ones with a wider scope of
investment have a-priori access to a wider set of instruments (firms from more countries).
The within-family comparison is particularly important because knowing that a fund
within a mutual fund family holds some stocks is an indication that those stocks are
available for trading and are indeed desirable, at least by other fund managers within the
same family. Moreover, information about those stocks has already been collected at the
mutual fund firm level, and in principle, is available to all managers of the same mutual
fund company. Therefore, the relevance of asymmetric information and transaction costs
can be assessed by comparing portfolios across different funds within the same mutual
fund family.
Two reasons motivate our emphasis on the U.S. mutual fund industry. First, the
mutual fund industry in the U.S. is very large (in 2005 there were 8,044 mutual funds
with a market capitalization of 8 trillion U.S. dollars or 69% of U.S. GDP), it has a strong
international presence (U.S. mutual funds represent more than 70% of the assets held
worldwide by all mutual funds), it channels a significant share of retirement savings
(mutual funds captured 24% of retirement savings in the U.S. in 2004), and it is a
relatively mature and sophisticated industry.9 Second, we work with the universe of U.S.
mutual funds established to purchase assets around the world. Given the regular reporting
requirements for these types of investors, asset-level portfolios can be constructed and
traced over time since their inception period. This characteristic of the mutual fund
industry contrasts with other types of investors such as hedge funds, many pension funds,
and individual international investors, for which data are not publicly available.
9 These statistics are from IMF (2005).

4
We collect two types of data: holdings and returns. The data on holdings contain
asset-level annual portfolios between 1991 and 2005. We work with a total of 505 fund
families and 3,651 funds, covering most of the U.S. mutual fund industry. We
concentrate only on those funds that are already investing internationally. The total
number of fund-year observations is 8,547 and the total number of asset-level holdings
for all funds in all years is 1,359,750. The portfolio holdings have been matched in a way
that allows us to identify the country to which each stock belongs, and track them over
time. Regarding the returns data, we use returns at the fund level on a daily basis between
September 1989 and June 2006 for 36 fund families. We work with a total of 722,885
daily observations, composed of the returns for all funds within these families.
The analysis in the paper is divided into two parts. The first one documents some
stylized facts associated with the degree of international diversification of different types
of mutual funds. The second part of the paper focuses on the factors behind the level of
international diversification. It analyzes whether the availability of instruments
constraints the asset allocation of mutual funds. It also studies where the variation in the
number of stocks held by mutual funds comes from; in particular, to what extent it is
driven by information asymmetries and family effects. Lastly, we also investigate
whether there are potential gains from further international diversification.
In the first part of the paper we show that individual mutual funds hold a
relatively small number of assets in their portfolios. Importantly, the number of assets in
a mutual fund portfolio seems to be independent of the investment scope of the mutual
fund. In other words, the number of asset holdings in mutual fund portfolios does not
tend to increase for global funds compared to specialized funds within the same mutual
fund family, even though the number of investable assets increases significantly. For
example, global funds from Vanguard Group held on average 426 stocks in 2004,
whereas specialized funds within this family of funds held 576 stocks. These numbers are
small because there were over 39,000 stocks available worldwide in 2004.
Consistent with the observation that the number of holdings does not increase as
the investment scope broadens, we also show that global funds hold fewer assets in fewer
countries compared to specialized funds within each region of exposure, especially in
emerging countries. For example, if holdings in Latin America are considered, the
5
median specialized fund holds 41 stocks, whereas global funds hold 94% fewer stocks
than specialized funds within their mutual fund families. Furthermore, global funds also
invest 75% fewer countries in Latin America than their specialized counterparts,
respectively.
These patterns of investments are especially relevant given that the industry has
shifted towards global funds relative to specialized funds. Although the entire U.S.
mutual fund industry investing internationally has expanded sharply since the early
1990s, with significant increases in the number of both global and specialized funds,
global funds have become significantly larger than specialized funds in terms of assets
under management. For example, global funds had 38 billion U.S. dollars of assets under
management in 1992, being about 3 times as large as specialized funds. However, in
2004, global funds were 6 times as large as specialized funds with 532 billion versus 89
billion U.S. dollars of assets under management. In sum, global funds seem to be
investing an increasing amount of funds in a limited number of assets.
The paper then explores the possible reasons behind the apparent lack of
international diversification of mutual funds. First, the patterns we document regarding
mutual fund holdings do not seem to be driven by the inability of funds to hold more
companies across countries. For example, we show that, on average, mutual funds hold a
very small fraction of market capitalization: global fund and specialized fund investments
account (separately) for just 0.12% of firms’ market capitalization. Therefore, if funds
want to increase their exposure, they could probably do so without major difficulties.10
Second, we study the possible role of information asymmetries. If global and
specialized funds within mutual fund companies shared information and made similar
decisions, one should observe similar portfolios across them. However, we show that this
is not the case. Different types of mutual funds within families hold portfolios that are not
very similar. For example, global and specialized funds share only 16% of their holdings
(or, on average, 36% of net asset value of investments). In other words, we do not find
evidence that managers are using information already gathered by other managers within
10 We show that global funds are significantly larger than specialized funds. Moreover, Didier (2008) shows that global funds tend to invest in firms significantly larger than specialized funds. However, transaction costs should not be important if global funds were to invest amounts similar to those of the specialized funds in small firms. Still, transaction costs, especially price impact, could still be relevant for global funds investing large amounts in small firms.

6
the same mutual fund firm. Furthermore, we also find that measures that capture the
ability of funds to gather and process information explain only a small proportion of the
variance of the number of stocks held by each fund. In sum, informational asymmetries
alone do not seem to explain the apparent lack of international diversification.
Next, we show that the limited number of stocks in mutual fund portfolios is
explained by strong family effects. The number of holdings across mutual funds is largely
explained by the family to which the fund belongs. For example, funds in the Templeton
Group held on average 129 stocks in 2005, significantly smaller than the 517 stocks held
on average by funds in the Vanguard Group. In fact, family effects explain almost 50% of
the cross-section variation in the number of portfolio holdings.
Lastly, the apparent lack of international diversification is only relevant for
investors if the restricted number of holdings is actually translated into return losses or
excessive variance. In other words, does the fact that global funds do not tend to hold
more stocks than specialized funds imply a diversification loss? If assets within and
across countries are correlated, it might be possible for global funds to obtain the same
degree of diversification benefits as the specialized funds by simply holding fewer stocks,
possibly in fewer countries. In that case, return correlations would account for the
patterns observed in the data.
To address whether there are unexploited gains from diversification, we ask
whether a global fund can improve its performance simply by investing in specialized
funds within the same mutual fund family. In other words, we compare the performance
of global funds to that of a portfolio of specialized funds and the global fund itself. That
is, by definition, we conduct a very restrictive exercise. We are not asking a global fund
to invest in any possible stock available to a specialized fund; we are restricting global
funds to invest in a portfolio already held by another fund within the same company. This
guarantees that the stocks are available for investment (that we are considering a feasible
set), that they are at least attractive to another manager in the same firm, and that
information about the stocks was already collected and analyzed by someone close to the
global fund manager. If the gains were negligible, the additional stocks in the specialized
fund would not be necessarily useful for global funds, not at least in the proportions they

7
enter the specialized fund portfolios. Importantly, we do not allow short selling within the
same family, but only portfolios that imply buy and hold.
Our results suggest that there are potential gains from further diversification.
Global funds could obtain better returns for a given level of risk if they invested in
portfolios similar to those of specialized funds. In other words, by not increasing the
number of stocks as funds expand their investment scope, global funds forgo the benefits
that broader international diversification provides. The results are robust to many types of
estimation methods that take into account expected returns, variances, and several
benchmarks to which a fund is compared. For example, we find that the average return of
world funds can be increased by 4.6% per year (p.y.) if their strategies were to minimize
risks given a certain level of return. Alternatively, the average return can improve by
1.6% p.y. if they were to maximize expected returns given a specific level of riskiness for
their portfolios. To the extent that mutual funds hold portfolios similar to typical stock
market indexes, these results also imply that holding a portfolio of sub-indexes dominates
holding broader ones.
There is however a possible explanation for our results: the existence of an
insurance premium in the returns of global funds. Global funds have the ability to shift
their asset holdings across countries and regions, which is not an option to specialized
funds. Since this extra flexibility might yield gains during turbulent times, investors
might be willing to pay for this benefit. In other words, global funds might be better
suited than specialized funds to avoid large losses due to their ability to move away from
trouble spots. Our results indicate that this does not seem to be the case. For example, we
find that the skewness and kurtosis of global fund returns are similar to those of
specialized funds. These higher moments of the distribution of returns are important if
global funds were to minimize losses during bad times instead of following the standard
mean-variance approach. Moreover, conditional on large negative returns on either
specialized funds or the MSCI Emerging Market Index, we find that returns on our
constructed portfolios are broadly similar to those on the global funds.
Our findings have important implications to the literature. The fact that funds
meant to invest around the world are not diversified enough, even when there are
potential gains to do so, represents a significant puzzle. The experiment in this paper

8
shows that global funds would gain by investing in stocks that specialized funds within
the same mutual fund company already hold. Our results cast doubts on the idea that
asymmetric information drives the lack of international diversification, at least in the
dimensions highlighted here. Moreover, the fact that each individual fund is small
relative to the market size suggests that the lack of diversification is not driven by the
inability of global funds to purchase the securities that specialized funds hold; that is, the
results are not driven by transaction costs. Although global funds are larger than
specialized funds, at the minimum they could invest a fraction similar to that invested by
specialized funds in the securities that global funds do not hold. The finding that the
number of stocks held across mutual funds is significantly explained by family effects
and does not vary much across fund types within families suggests that the way the
financial industry is organized might be an important factor in determining the degree of
international diversification. Finally, to the extent that global funds continue growing
relative to specialized funds, the findings in this paper suggest that there will be foregone
diversification gains to investors. Also, several countries and firms will not benefit from
tapping international investors, with the associated reduction in the cost of financing.
The rest of the paper is organized as follows. Section 2 describes the dataset
analyzed. Section 3 studies the extent of international diversification of U.S. mutual
funds. Section 4 analyzes the factors behind the degree of international diversification.
Section 5 studies whether there are potential gains from further international
diversification. Section 6 concludes.
II. Data
We use data on U.S. equity mutual funds that are established to purchase assets around
the world.11 We use two types of data in our empirical analysis: mutual fund holdings
data and mutual fund price data.
Mutual fund holdings data are available from Morningstar International Equity
Mutual Funds, a private company that collects mutual fund data. We analyze monthly
Morningstar reports from March 1992 (when they became available) until June 2006.
11 Funds that focus on both debt and equity are excluded from the analysis, even though they do invest a significant share of their portfolios in foreign stocks.

9
However, mutual funds do not disclose their holdings as frequently. They do so, at most,
on a quarterly basis, and typically bi-annually (coinciding with SEC reporting). Given
this heterogeneity in the release of new information, we construct our database with the
last reported portfolio information for each fund on any given year. For example, our
sample of mutual fund holdings for 2005 contains portfolio data for the Fidelity
Worldwide Fund as of October 2005 and portfolio data for the Scudder Global Fund as of
December 2005. In sum, we collect end-of-year detailed information on portfolio
holdings between 1991 and 2005. Specifically, we collect stock names, amount invested
in each stock by each fund, and country of origin of these holdings.
A difficulty in constructing the holdings database is that mutual funds report their
asset allocation in separate reports over time. In other words, their holdings are not linked
across reports; we had to link them. This is not a simple task because stock identifiers are
rarely available and, if so, are not always unique. We match these holdings across mutual
funds over time based on the country of origin and the stock name for each security
holding. We can thus determine whether the same stocks appear in different mutual fund
portfolios, across and within fund families. Since information on the country of origin is
only available for the 1997-2005 period, we do not attempt any matching of holdings for
the pre-1997 period.
Table 1 describes our datasets. We collect data on 8,547 fund-year portfolio
holdings over the period 1991 to 2005, covering 505 different families (companies) of
mutual funds, and a total of 3,651 funds. Each mutual fund family has on average six
different mutual funds. Some families sell the same portfolio to investors under different
names depending on their fee structure and minimum investment requirements. In this
paper, we consider these different funds only once; i.e., we do not treat them as separate
funds as Morningstar does.12 The total number of asset-level observations in our dataset
is 1,359,750, counting each stock-level allocation across all funds over time.
The U.S. mutual fund industry is organized by splitting funds according to their
investment scope. In particular, funds are classified into five distinct categories: world
funds, foreign funds, emerging market funds, regional funds, and country funds. Regional
12 For example, Fidelity Advisors Funds contain the following Latin America funds with the same portfolio: Fidelity Advisors Latin America A, Fidelity Advisors Latin America B, and Fidelity Latin America T.

10
funds are divided into: Asia (and Pacific) funds, Europe funds, Latin America (and the
Caribbean) funds, and Middle East and Africa funds.13 World funds invest all over the
world including the U.S., while foreign funds invest around the world excluding assets in
the United States. Emerging market funds invest only in emerging market assets. 14
Regional and country funds invest only in a particular region or country, respectively. For
ease of exposition, we group funds into two categories: “global funds” and “specialized
funds.” Global funds encompass world funds and foreign funds. All other fund types are
called “specialized funds.” The latter invest in a subset of assets that can be held by
global funds. This organization of the mutual fund industry is displayed in Figure 1.
Naturally, funds with a wider (more global) investment scope can always invest in the
stocks held by more specialized funds.
We also collect data on the time series of return/price data on mutual funds
themselves. Since these are open-ended funds, the value of each fund each day reflects
the value of the underlying holdings or the net asset value (NAV). We thus use returns at
the fund level on a daily basis between September 1989 and June 2006, for 36 mutual
fund families, as reported in Table 1. We work with a total of 722,885 daily observations,
composed of all returns for all funds. We include all funds within a given family of funds.
On average, each family has ten different mutual funds.15 We work with a restricted
number of mutual fund families, focusing on the larger families. This dataset allows us to
assess issues related to the gains from international diversification by holding different
types of mutual funds.
III. How Diversified Are Mutual Fund Portfolios?
The U.S. mutual fund industry investing internationally has expanded sharply since the
early 1990s. For example, in 1991 there were less than 200 mutual funds established to
invest in international equity, while in 2005, there were almost 700 funds. This marked
increase is not restricted to a specific type of mutual fund. Figure 2 shows the number of
13 Asia funds can actually invest in countries located in both Asia and Pacific regions. Latin America funds can also invest in countries in the Caribbean. Some Europe funds also tend to invest in countries in Africa, such as South Africa. 14 Emerging markets are typically middle-income countries. However, these funds might invest a small proportion of their portfolios in low-income countries as well. 15 See Appendix Table 1 for a detailed description of the sample coverage of the price/returns data for each mutual fund family.

11
funds between 1991 and 2005; both the number of global and specialized funds increased
significantly. However, while the number of global funds has increased steadily until the
early 2000s, that of specialized funds increased until 1998 and then declined. This has
likely been driven by the Asian and Russian crises that might have generated a desire to
hold funds that can invest more freely around the world. At the end of 2005, there were
499 global funds and 191 specialized funds. In terms of assets under management, the
differences are even starker. Global (specialized) funds managed 29 (7) billion U.S.
dollars in 1991 and 787 (162) billion U.S. dollars in 2005. This pattern is broader than
global versus specialized funds.16 For instance, foreign funds are the ones with the most
noticeable increase: assets under management increased from 10.3 billion to 543 billion
U.S. dollars between 1991 and 2005. In sum, the data show a clear trend in the U.S.
mutual fund industry toward funds with a wider investment scope (global funds) over
funds that invest in specific regions or countries (specialized funds).
Given the increasing importance of global funds, a natural question is to what
extent their portfolio differs from the ones held by specialized funds and how much
diversification they provide. We thus explore to what degree mutual fund holdings vary
across different fund types within mutual fund families. In principle, as the investment
scope increases, funds should be able to hold more assets across more countries and
diversify risk better.
Table 2 presents the average, median, and the standard deviation in the number of
holdings across mutual fund types over the entire 1991-2005 period. Moreover, Figure 3
shows the median number of holdings for different mutual fund types from 1991 to 2005.
The top panel reports these medians for world funds (with and without U.S. holdings),
foreign funds, emerging market funds, and regional funds. The bottom panel displays the
number of stocks held by Asia funds, Europe funds, Latin America funds, and country
funds. The median number of holdings is surprisingly stable over the 15-year sample
period and similar across fund types.17 The median world fund holds on average 106
stocks and 76 when excluding the U.S., with no clear time trend. The median foreign
16 Appendix Figure 1 shows similar plots but disaggregated by world, foreign, emerging market, regional, and country funds. 17 Although not show, the average number of holdings is also stable over time and similar across fund types.

12
fund holds on average 105 stocks, while the median emerging market funds holds 121
stocks. Europe and Asia funds hold on average 70 and 64 stocks, respectively, while
Latin America and country funds hold 56 and 63 stocks, respectively. These median
values are lower for more specialized funds. However, across fund categories there is no
clear time pattern. The only apparent exceptions are foreign funds, which have increased
the number of holdings in the last few years. In sum, the evidence suggests that mutual
fund managers tend to invest in a finite number of stocks that does not increase
significantly as the scope of investment widens.
Given that the number of stocks held by global funds does not increase
significantly relative to specialized funds, and global funds have a broader scope of
investment, a natural question is whether global funds hold fewer assets than specialized
funds within each region of exposure. The evidence presented in Table 3 confirms that
this is indeed the case. If holdings in Latin America are considered, the median Latin
America fund holds 41 stocks. However, emerging market funds, i.e. funds with a greater
scope of investment, hold 34% less assets than the Latin America fund within its mutual
fund family. The drop in the number of holdings is even more striking for global funds, it
falls 94% for either world or foreign funds. Furthermore, world and foreign funds also
invest, respectively, in 71% and 75% fewer countries than their specialized counterparts.
For Asia, the numbers suggest a similar pattern. The median foreign and world funds
hold 35 and 19 assets, implying a drop of 42% and 69% relative to the Asian fund within
the same mutual fund company. If the number of countries is considered, a global fund
also holds assets in significantly fewer countries than the Asia fund in the same mutual
fund family. Lastly, a similar trend is observed if holdings in developed Europe are
considered: global funds hold fewer assets in fewer countries within Europe than
specialized funds do.
In sum, as their scope of investment becomes broader, mutual funds invest a
growing amount of funds in fewer stocks in fewer countries within each region of
exposure, especially in emerging countries. In principle, if assets are not redundant, this
behavior seems surprising.
However, several reasons could rationalize this pattern. First, the existence of
transaction costs. It is possible that global funds are relatively large, and thus, are unable

13
to buy and hold some of the smaller stocks in emerging markets without incurring in
large transaction costs. Second, information gathering and processing by fund managers
can be costly. However, if there is not any communication within mutual fund families,
informational costs cannot be an explanation. Lastly, it is also possible that there are
actually no benefits to further diversification; the assets are indeed redundant. This is the
theme of the following two sections.
IV. What Factors Might Explain the Investment Patterns?
In this section, we explore several reasons that might be behind the investment in a
limited number of stocks documented in the previous section. First, we study to what
extent the availability of instruments constraints the asset allocation of mutual funds.
Second, we analyze where the variation in the number of stocks held by mutual funds
comes from; in particular, to what degree it is driven by information asymmetry stories
and family effects.
A. Share of Total Assets A first step to understanding the extent of international diversification by mutual funds is
to analyze the universe of assets that can be held by the sample of mutual funds covered
in this paper. Table 4 reports the size of the universe of stocks in 1997 and 2004 in which
funds can invest in.18 It shows the total number of listed stocks across different regions
for both developed and emerging countries. These potential holdings are larger in
emerging countries than in developed countries; however, the difference has fallen over
time. The number of stocks has grown 40% during the period in developed countries, and
20% in emerging countries – mostly concentrated in developing Europe.
Of the universe of potential holdings, mutual funds only invest in a fraction of
these assets. Table 4 reports the actual number of mutual fund holdings and the fraction
of holdings relative to the number of listed companies. 19 It does so for all funds in our
18 Assets in the U.S. and Canada have been excluded from this table as we focus on the international holdings of mutual funds. Offshore centers have also been excluded from this table as firms usually only have offices in these centers, but their main operations are somewhere else. 19 This number is an underestimation of the true universe of assets that can be purchased by mutual funds. First, mutual funds occasionally hold assets that are not listed in stock exchanges and therefore would not show up in these aggregate numbers. And second, there are a number of firms, especially from developing countries, with headquarters and operations in one country but with stock exchange listings in another, usually in financial centers such as London, U.K, and Hong Kong. These companies have been “relocated” to the country in which main operations take place.

14
dataset and, separately, for global funds. In 1997, mutual funds invested in around 9,000
different firms. In developed countries, they held around 6,800 firms, an average of 50%
of the available assets. However, in emerging countries, these numbers are significantly
smaller: they held 2,271 firms, or 13% of the available stocks. An even more pronounced
pattern emerges when we focus on global funds only, the mutual fund type that has
become very large over the sample period. In 1997, they held 4,953 different firms in
developed countries, which constitute 38% of the number of potential stocks available. In
emerging economies, global funds held only 8% of the available shares.
In Table 4, we also show that, although the universe of listed companies has
increased between 1997 and 2004, there has been a considerable fall in the number of
mutual fund holdings during this period. In 2004, mutual funds held 5,204 in developed
countries and 1,085 different firms in emerging countries. This decline in holdings has
not been concentrated in any particular region, but has been more accentuated in
emerging countries where a fall of 52% is observed. In developed countries, the number
of holdings declined 24%. If only global funds are considered, a similar investment
pattern emerges. In 2004, their holdings have decreased to 4,799 firms in developed
countries, or 26% of the available assets. In developing countries, the number of holdings
fell approximately 46%, from 1,314 to 711 firms, or equivalently, from 8% to only 3% of
the number of available stocks. Notice that even though the “number” of firms might be
affected by mergers and acquisitions, the share of the total available firms is not.
Although the number of mutual fund holdings has been falling between 1997 and
2004, the amount invested in these stocks has grown significantly, in both developed and
emerging countries. Investments in developed countries have increased from 204 billion
U.S. dollars in 1997 to 446 billion U.S. dollars in 2004, a 119% increase. In emerging
countries, investments have also more than doubled, increasing from 30 billion U.S.
dollars in 1997 to 62 billion U.S. dollars in 2004. Thus, a growing amount of funds is
being invested in fewer firms, and more significantly so in emerging countries.
A concern about mutual fund investment across countries is that institutional
investors tend to be large; therefore, the amount they invest in different assets might be
determined by their ability to invest in them. For example, if specialized funds held a
large fraction of the available shares, global funds would find it difficult to invest in them

15
without adverse price effects. To investigate whether there are restrictions coming from
the supply side of instruments, Table 5 shows the size of individual mutual fund holdings
relative to firms’ market capitalization. The table shows that, on average, mutual funds
hold a very small fraction of market capitalization. For example, both global fund and
specialized fund investments each account for 0.12% of firms’ market capitalization.
Therefore, if funds wanted to increase their exposure, they could probably do so without
generating a major price impact. For example, if global funds invested all of their assets
under management in specialized funds, each fund would still capture a small fraction of
market capitalization, around 0.73%. Even if one aggregates all mutual fund holdings, the
fraction of market capitalization remains small. The sum of all global fund holdings
accounts on average for 2.8% of firms’ market capitalization and that of specialized funds
accounts for 1.3% of market capitalization. Therefore, the patterns we observe regarding
mutual fund holdings do not seem to be driven by the inability of funds to hold more
companies across countries.
To complement the evidence that mutual fund investments are concentrated in
few companies and not evenly distributed across regions, Figure 4 illustrates to what
extent mutual funds invest differently across countries. The figure plots the ratio of the
number of companies held in mutual fund portfolios to the total number of listed
companies. These ratios are computed on a yearly basis and reported according to their
averages over the 1997-2004 period.20 Countries are sorted by the extent of mutual fund
investment and divided in five equally-sized groups (quintiles). Reinforcing the previous
evidence, this figure shows that mutual fund holdings are not evenly spread across
countries. For around half of the countries in the sample, mutual funds invest in at most
20% of the listed companies. In no country do mutual funds exhaust the available stocks.
Moreover, only developed countries appear in the highest quintile. Among emerging
countries, Mexico is the one with the largest ratio (44%), whereas among developed
countries, Netherlands has the largest ratio (77%). In the bottom two percentiles, there are
24 developing countries but only four developed countries. In other words, mutual funds
20 The reported numbers are an upper bound of the true values. As mentioned before, firms that have operations in one country and listed in another are assigned to the country in which operations occur. Hence, the number of available assets for investment is reduced in the listing country.

16
tend to hold a larger fraction of listed firms from developed countries than from emerging
countries.
B. Informational Costs In the second part of this section, we analyze the degree to which information
asymmetries can explain the patterns of international investments by different types of
mutual funds. We focus on costly information gathering and processing. To the extent
that information is costly to obtain and process and the managers of specialized funds
have already decided on an asset allocation, global funds within the same mutual fund
company could benefit from this information and choose among the stocks selected by
the managers of specialized funds. In other words, if global and specialized funds within
mutual fund companies shared information and made similar decisions, one should
observe similar portfolios across them. We also analyze the extent to which the number
of managers and other measures related to the ability of funds to obtain and manage
information might explain the number of asset holdings in mutual fund portfolios.
To asses the portfolio similarity we ask: what is the likelihood that a stock held by
a specialized fund also belongs to the portfolio of global funds, within the same family of
funds? The within family comparison is important given a large heterogeneity in holdings
across mutual fund families and the hypothesis of interest, that is, whether fund managers
in the same company make share information. To answer this question, we compute
frequency counts in our sample. We consider two types of funds (global and specialized)
within a mutual fund family and count the number of observations for which a stock is
held by one of these two fund types, with each of the close to 400,000 observations being
a family-year-stock observation. Then we compute the fraction of the observations in
which a stock is held by a certain fund type but not held by the other, a stock is held by
both the fund types, and a stock is held by the global fund but there is no specialized fund
within the same family that could hold that stock.21 We make these comparisons on a
yearly basis; for example, we compare a stock held by a specialized fund at time t with
the stocks held by the corresponding global fund also at time t. By construction, no
observation falls into the case where there is no global fund that could not hold a stock
21 U.S. assets are excluded from the analysis here.

17
held by a specialized fund; that is, for every specialized fund there is always a global
fund within the mutual fund family. 22 Moreover, also by construction, there are no
observations for which a stock is held by neither the global fund nor the specialized fund.
We repeat this exercise just for holdings in emerging markets and by breaking global
funds into world funds and foreign funds.
The basic results are shown in Table 6 for total holdings and those in emerging
markets only (Appendix Table 2 shows the results splitting global funds into world and
foreign funds). Each cell represents the relative frequency of the observations, that is, the
joint probability that the global and specialized funds hold/do not hold a particular stock.
Conditional probabilities can be obtained by looking at a particular row or column. The
evidence from Table 6 suggests that global funds and specialized funds do not hold many
stocks in common. When considering all holdings, only 16% of actual holdings are
shared by both fund types; in emerging markets, that fraction is 13%. Moreover, only
23% of the global fund holdings are shared by specialized funds, and 32% of the stocks
are held by specialized funds alone but not by global funds.
The results from Table 6 also suggest that the vast majority of mutual fund
holdings in emerging countries are done through specialized funds and not through global
funds. For example, 76% of the stocks are held by specialized funds but not by global
funds. In other words, a mere 24% of emerging market stocks in our sample is held by
global funds. Furthermore, conditional on being held by a specialized fund, there is only
a 15% probability that an emerging market stock is held by a global fund. However, as
opposed to patterns observed if all holdings are considered, global funds tend to hold a
larger subset of what specialized funds hold in emerging countries. Around half of global
fund holdings are shared by their specialized counterparts in developing countries. This
evidence also implies that the results on all holdings are being driven mostly by holdings
in developed countries. In other words, global funds seem to be holding a different set of
firms in developed countries than specialized funds do.
Appendix Table 2 splits global funds into world funds and foreign funds and
compares them with specialized funds. The results suggest that there is no significant
22 We exclude all family-year-stock observations for which mutual fund families that do not have either one of the fund types considered in that given year.

18
difference in portfolio holdings across global funds: specialized funds invest in a wider
set of assets than both world funds and foreign funds (when specialized funds are
available). World funds and specialized funds share only 10% of their holdings. This
percentage increases to 15% if foreign funds are considered. In other words, the
intersection of portfolio holdings between specialized funds and foreign funds is larger
than between specialized funds and world funds. In sum, the results presented so far
suggest that global funds actually hold a different set of assets than specialized funds
hold, although the similarity in portfolios increases if holdings in developing countries
are considered.
The frequency counts shown in Table 6 and Appendix Table 2 measure to what
degree mutual funds with different investment scopes invest in the same stocks.
However, that evidence does not take into account the size of the mutual fund
investments in each stock. It might be possible that though the range of stocks in which
mutual funds invest differs, global and specialized mutual fund portfolios have a large
loading on stocks that are common to their portfolios. Therefore, mutual fund portfolios
could actually be more similar than they appear with the evidence presented above. The
reverse could also be true. To address this issue, we study entropy or similarity measures
that analyze how alike mutual fund investments actually are.
The entropy measure is constructed as follows:
,,,
,,,
,,,
,, ∑∑
∑∑+
+=
j
jtf
i
itf
js
jtfs
is
itfs
jitf NAVNAV
NAVNAVEntropy (1)
where jitfEntropy ,, is the entropy measure for a pair of fund types (i and j) within family f,
at time t. fund}. dspecialize fund, global{, ∈ji s are stocks common to the portfolio of
both funds i and j from family f at time t. Therefore, itfsNAV ,, ( j
tfsNAV ,, ) is the net asset
value of the investments by fund type i ( j), in family f, in common stock s at time t. i
tfNAV , ( jtfNAV , ) is the total net asset value of investments by fund type i (j), in family f
at time t. As above, global funds are then split into world funds and foreign funds. In
words, for a given pair of different fund types within the same mutual fund family, the
entropy measure is the ratio of the sum of the mutual fund dollar investment in stocks

19
common to the portfolio of these two fund types over the total net assets of the same
funds. It should be noted that this entropy measure overestimates the commonality
between any pair of individual funds as it aggregates funds according to their types. The
measure is calculated for every year. Moreover, this measure is constructed within
families, given our focus on information sharing within mutual fund companies.
The entropy measures indicate that mutual funds do indeed hold a more similar
portfolio than what frequency counts suggest, however, mutual funds still invest in quite
different portfolios. For example, when comparing global and specialized funds, the
entropy measure shows that, on average, 36% of the value of their holdings is in common
assets. In contrast, as mentioned for the case of Table 6, 16% of the number of their
holdings is in the same stocks. The entropy measure is slightly higher in the case of
emerging countries, reaching on average 42%, compared to the 13% obtained for the
frequency count of Table 6. As shown in Figure 5, the entropy measure is stable over the
sample period, and if anything it decreases since 2001 (and since 1999 for the case of
emerging countries), suggesting that there is no rise in commonality over time. Similar
patterns are obtained when splitting global funds. As Appendix Figure 2 shows, funds
have been investing a smaller share of their portfolios in assets that are common across
fund types. On average, the entropy measure is 26% when comparing the holdings of
world funds and specialized funds and 28% when comparing those of foreign funds and
specialized funds.
To the extent that funds tend to hold portfolios that are not very similar, we do not
find evidence of information sharing within mutual fund companies. Managers do not
seem to be using information already gathered by other managers within the same mutual
fund firm. We now analyze the degree to which the number of managers and other
measures related to the ability of funds to obtain and process information might influence
the number of stocks mutual funds hold. The results are shown in Table 7.23 Column 1
shows that the number of stocks is positively associated with the number of managers;
however, the marginal effect is low. For example, funds with one manager hold, on
average, 132 stocks, while funds with two managers hold 135 stocks, and funds with six
23 In Appendix Table 3, we report regressions with the percentage of net assets in the top 10 holdings as a dependent variable. The results are qualitatively similar to the ones presented here.

20
managers hold 197 stocks. In all other specifications, we consider the number of
managers as a single count variable in order to summarize its results. Columns 2 and 3
add manager tenure and fund age to the regressions. The effects of these variables are
also positive although statistically insignificant. The number of managers has a
significant positive effect on the number of fund holdings. Nevertheless, the proportion of
the total variance explained by these variables is small, between 3% and 5%. We repeat
these regressions in columns 4 and 5 but adding mutual fund expenses instead of the
variable for the number of managers. While the variable fund expenses is positively
associated with the number of holdings, the effect reverses when we control for fund size.
We also report one last specification including the variable for the number of managers
and the variables for fund expenses together. The results are similar to the ones obtained
with the other specifications. Additionally, less than 7% of the total variance is explained
by all these variables together. In summary, although the variables related to the ability of
funds to collect and manage information are positively associated with the number of
holdings, their explanatory power is small.
In this sub-section, we do not find evidence that managers are using information
already gathered by other managers within the same mutual fund firm. Furthermore, we
also find that measures that capture the ability of funds to gather and process information
explain only a small proportion of the variance of the number of stocks held by each
fund. In sum, informational asymmetries alone do not seem to explain the apparent lack
of international diversification.
C. Family versus Fund Effects Lastly, the third part of this section analyzes what can potentially drive the variation in
the number of stocks held by mutual funds. Figure 3 already shows that the number of
stocks held by mutual funds is relatively constant over time and does not vary
significantly by fund type. We now study these effects more formally and measure, in
particular, the relevance of family characteristics.
Figure 6 (top panel) shows the distribution of the number of holdings for all fund-
year observations. The median number of holdings is 95, while 95% of the observations
are below 450. Although there is some dispersion, with some funds holding many stocks
in some years, 74% of the observations imply holdings below 150 stocks and 88%,

21
holdings below 250 stocks. The bottom part of Figure 6 shows the median number of
stocks per family, sorted from the lowest to the highest number of holdings. This panel
suggests that the dispersion in the number of stocks found in the fund-year observations
is linked to the dispersion in the number of stocks held across mutual fund families.
Mutual fund families differ substantially in the number of stocks they hold. For example,
GAM Funds and Oppenheimer Funds, hold on average substantially less than 200 stocks,
while others (such as Dreyfus Founders and Vanguard Group) hold at least two times
more. The mean of the fist quintile of the distribution is 38 stocks, whereas the mean of
the fifth quintile is 329. While there are extreme cases, with the median fund in one
family holding 1,027 stocks, most families hold a limited number of stocks, with the
mean of the fourth quintile being 121 stocks.
We now compare how important family effects are versus time and fund type
effects to explain the number of holdings across mutual funds over time. The top panel of
Table 8 reports regressions of the number of holdings, as the dependent variable, on year,
fund type, and family dummies.24 The dummy coefficients are not reported, although
they are usually significant at 1% confidence level. Seven different specifications are
reported. In the first specification only year dummies are considered. In this case, less
than 1% of the variance in mutual fund holdings can be explained. Column 2 reports a
regression with fund type dummies alone. Again, a small percentage (only 2%) of the
variance of the dependent variable is explained by these dummies. The specification in
column 3 includes family dummies. In this case, 46% of the variance in the number of
holdings across funds over time is explained, a much greater percentage than what was
explained by fund type and year effects alone. The next three reported regressions include
a combination of these three types of dummies: family dummies, fund type dummies, and
year dummies. In all these cases, the R-squared is relatively high only when family
dummies are included. Lastly, we report a specification with all dummies together
(column 7). We observe only a slight increase in the R-squared in comparison to the other
regressions with family dummies. Therefore, family effects indeed seem to be the
important ones to explain mutual fund holdings.
24 In Appendix Table 4, we report regressions with the percentage of net assets in the top 10 holdings as our dependent variable. The results are qualitatively similar to the ones presented here.

22
Given the importance of family effects, we revisit the hypothesis that
informational asymmetries can explain the apparent lack of international diversification.
It might be that the relevant variables for the ability of funds to gather and process
information are family-level expenses, not fund-level ones. In this case, family expenses
(and family size) should explain a significantly higher proportion of the variance of the
number of stocks held by each mutual fund than the fund-level expenses included in the
regressions reported in Table 7.
The results are shown in the bottom panel of Table 8. In the first three columns,
the regressions do not include family dummies, but incorporate fund-level variables (the
count variable on the number of managers, manager’s tenure, and fund’s age) and family-
level ones (family expenses and family size). The results are similar to the ones reported
in Table 7. Expenses at the mutual fund family level are positively associated with the
number of holdings. Nevertheless, they explain only a small proportion of the variance of
the number of stocks held by mutual funds, between 1% and 7% versus 46% explained
by family dummies alone. In other words, family-level expenses do not seem to explain
what family dummies capture. Moreover, if we include family dummies in these
regressions (reported in columns 4 to 7 in the bottom of Table 8), both fund-level and
family-level variables become statistically insignificant.
In sum, the results presented in this section suggest that the apparent lack of
international diversification in mutual fund portfolios cannot be explained by the lack of
available instruments or by informational asymmetries alone. Family effects unrelated to
these two factors seem to be the relevant ones. Then, the next obvious reason to explore
is whether there are indeed potential gains from further diversification.
V. Measuring the Cost of Lack of Diversification
This section analyzes mutual fund returns to shed light on whether they explain the
reasons why global funds do not have a substantially larger number of holdings relative
to specialized funds. As reported in the previous section, global funds tend to hold a
lower number of stocks in fewer countries within regions of exposure if compared to
specialized funds. These investment patterns might be explained by the lack of
diversification gains and/or by the desire of investors to minimize risk.
23
To analyze these hypotheses, we first study if there are potential gains from
further international diversification by global funds. It is possible that global funds do not
need to hold many stocks because returns are correlated and, therefore, they achieve as
much diversification as specialized funds do. We also test whether benchmark effects can
justify the portfolio choice of global funds, since managers are generally evaluated on
their performance relative to benchmark indexes. Consequently, portfolio decisions
should incorporate these managerial incentives. Lastly, we investigate the existence of an
insurance premium in the returns of global funds. Global funds have the ability to shift
their asset holdings across countries and regions, which is not an option to specialized
funds. Since this extra flexibility might yield gains during turbulent times, investors
might be willing to pay for this benefit.
A. Standard Portfolio Model: Mean-Variance Analysis To evaluate the potential cost of the apparent lack of diversification by global funds, we
compare the return of global funds to that of a simulated portfolio that combines
specialized funds and the global fund itself within mutual fund families. In particular, we
allow global funds to invest in a portfolio that replicates specialized fund holdings within
the same mutual fund family. Namely, we are not asking global funds to design their own
strategies; we ask them to just follow the portfolio that specialized funds in the same
mutual fund company hold.
There is an important advantage in constructing these simulated portfolios at the
family level. If collecting and processing information about a particular stock or country
is costly, then the fact that a fund within the mutual fund family is already holding the
asset is an indication that the mutual fund company has already paid for those costs.
Moreover, the fact that at least one fund is investing in those stocks is a clear indication
that they are within the subset of investable assets. In other words, from the manager’s
perspective there are no restrictions to investing in those assets; transaction costs should
not be very high. Finally, we follow a conservative strategy to evaluate the gains from
international diversification. We are not using all stocks in the investment universe of a
fund to construct alternative portfolios, which might include assets that are hard to reach,
but could apparently yield substantially higher returns.

24
To construct these simulated portfolios we impose the following restrictions: (i)
portfolios are constructed for a specific global fund type using a combination of the fund
itself and specialized funds within the same mutual fund family; (ii) only buy and hold
strategies are considered; (iii) funds cannot be shorted; (iv) the performance evaluation is
always conducted out-of-sample; and (v) the portfolio is optimized on a daily basis.
Assume that there is a global fund whose return history G we observe. Assume
that this global fund is comprised of several specialized funds, whose returns are denoted
by iS . We can then construct a portfolio P, which puts non-negative weights on all
specialized funds and on the global fund itself. This portfolio P is the optimal portfolio
that minimizes its own variance but it is constrained at achieving at least the same
expected return as the global fund itself. In other words, we compare and evaluate funds
along two dimensions: returns and variances, once administrative fees and their
investment objective have been determined.
The optimization problem is described by (2) and (3).
( ) xxPMinx
Σ= ' var , (2)
( ) ( )
.**1
1 10
:such that
∑∑
∑
+⎟⎠
⎞⎜⎝
⎛ −=
≤≤≤≥
iii
ii
ii
i
SxGxP
xx
GEPE
(3)
where xi is the portfolio weight on the specialized fund i within a mutual fund family and
Σ is the covariance matrix of mutual fund returns. Since this portfolio is constructed and
evaluated out of sample, portfolio shares are computed at time t and held for the next
period. We call this simulation approach our active strategy as portfolio weights are re-
optimized every period.
In the previous exercise, we keep the return “constant” (i.e., with the same
objective) and try to find a better portfolio in terms of its volatility. As an alternative, we
keep the variance “constant” and maximize expected returns. This strategy is described as
follows:
( ),E PMaxx
(4)

25
( ) ( )
.**1
1 10
varvar :such that
∑∑
∑
+⎟⎠
⎞⎜⎝
⎛ −=
≤≤≤≤
iii
ii
ii
i
SxGxP
xx
GP
(5)
We perform these simulations for several types of global funds. We compare
specialized funds and: world funds, foreign funds, a portfolio of world funds, or a
portfolio of foreign funds. Portfolios of either world or foreign funds exist when more
than one fund in a mutual fund family is classified as a global fund. This might take place
because funds have different objectives such as value, growth, or blend strategies.
Therefore, these funds aim at different sets of assets than “plain” global funds do. In
contrast, specialized funds usually do not clearly state their investment strategies. We are
thus trying to make a fairer comparison by combining these global funds together.
An important benefit of these strategies is that we do not need to identify the
exact stocks held by different mutual funds within the same mutual fund family. In other
words, the only information we need in order to perform this exercise is mutual fund
returns and fund characteristics, i.e., the type of investments they are supposed to follow.
This allows us to extend the time horizon of the data to start in the late 1980s.
The summary statistics of these simulated portfolios with the respective
comparisons with global funds are shown in two tables. Table 9 reports the results for
simulations that yield the highest return differential between the simulated portfolio and
the global fund for each global fund, i.e. the “best” simulation. The “best” simulated
portfolio typically includes the largest possible number of specialized funds, but
generally do not have a very long time span due to data availability on mutual fund
returns. On the other hand, Table 10 reports the longest simulation for each global fund.
In this case, fewer specialized funds are typically available for comparison, but a longer
time span is covered. The tables present the following statistics: the average annualized
returns for the global fund and the constructed portfolio (called “active strategy”), the

26
annualized difference in accumulated daily returns between the constructed portfolio and
the global fund, daily standard deviation of returns, and the number of comparisons. 25
The top panel of these tables report the summary statistics of portfolios
constructed based on equations (2) and (3). The results based on the “best” simulations
show that our strategy yields an increase in average annualized return of 509 basis points
per year for the world funds, by 404 basis points for the foreign funds, and by 1,159 and
397 basis points for the portfolio of world and foreign funds, respectively. With these
increases in risk-adjusted expected returns, it would be difficult to argue that there are no
potential gains from further international diversification, even if investing only in stocks
that other funds within the same mutual fund family hold. Moreover, the daily standard
deviation of the constructed portfolio returns is also smaller than that of the global fund.
It falls by nine basis points for world funds, by six basis points for foreign funds, and by
eight and six basis points for the portfolio of world and foreign funds, respectively.
Although these numbers seem small, it is important to remember that they are reductions
in the daily standard deviation of returns.
If the simulations with the longest time span are considered, the results still hold.
For example, the average improvement in returns is around 289 basis points per year and
the improvement in the daily standard deviation of returns is seven basis points. The
results are more modest though than the ones reported on Table 9. The reason is that
fewer specialized funds are available when the longest simulations are considered. In
other words, there is less scope for improvement than in the previous case.
The bottom panels of Tables 9 and 10 report the summary statistics of portfolios
constructed based on equations (4) and (5), i.e., maximizing expected returns while
holding the variance constant. Considering the simulations with the greater number of
specialized funds, the improvements in annualized returns are around 161 basis points,
whereas the improvement in the daily standard deviation is almost negligible at less than
one basis point. If the longest simulations are considered, the improvement in returns is
around 80 basis points and the improvement in the daily standard deviation is on average
one basis point. 25 We computed these tables at the family level as well. The results are shown in Appendix Table 5A and 5B for the “best” simulations, and in Appendix Table 6A and 6B for the longest simulation for each global fund. As expected, there is heterogeneity across mutual fund families.

27
In sum, the results from these simulations allow us to reject the hypothesis that
there are no costs from further international diversification. To the contrary, although
there is some heterogeneity in the results depending on the strategy used, there are
potential gains from further diversification in terms of both return and volatility.26
B. Benchmarking The optimization strategies described above are perhaps somewhat unrestricted because
the objective of most mutual funds is not necessarily to minimize the variance given
some expected return, or to maximize returns given some variance. The performance of
mutual funds is actually evaluated in comparison to benchmark indexes. Moreover,
managers are usually compensated according to this relative performance. Thus, portfolio
decisions should incorporate these managerial incentives. We test whether these
benchmark effects would justify the portfolio choice of global funds. In other words, we
assess whether this extra constraint is sufficient to eliminate the gains from further
international diversification found in the previous exercise.
In the case of the first strategy, the variance minimization one, we modify the
objective function to take into consideration a benchmark index. The benchmark is the
appropriate MSCI index (B), specific for each global fund as described in the
Morningstar database or in the fund’s website. Instead of minimizing the variance of the
portfolio, we minimize the variance of the difference between the portfolio and the
benchmark index. Thus, equation (6) replaces equation (2) for this strategy. The
constraints of this optimization problem remain as stated in equation (3):
( ). var BPMinx
− (6)
For our second strategy, the maximization of expected returns, we impose an additional
restriction: the variance of the difference between the constructed portfolio and the
benchmark index has to be at most the same as the variance of the difference between the
global fund and the benchmark index. Equation (7) states this additional restriction:
( )BGBP −≤− var)var( (7)
The results of these new simulations are reported in Table 11 for the “best”
26 For robustness, we have also performed these simulations with a more restricted sample. We use rolling windows of 240 business days. The results are robust to this change. They are reported in Appendix Tables 7A and 7B.

28
simulations for each global fund, and in Table 12 for the longest simulations for each
global. For simulations that minimize the variance of the portfolio, the results are similar
to the ones reported in the previous section. For the “best” simulations reported on the top
panel of Table 11, typically the ones with the greatest number of specialized funds, there
is an improvement in annualized returns of 375 basis points for world funds, 397 basis
points for foreign funds, 735 basis points for portfolio of world funds, and 334 for
portfolios of foreign funds. Therefore, even for the strategy with benchmarking
considerations, the increase in expected returns is large, being thus hard to justify the lack
of diversification based on managerial incentives. Improvements in the standard
deviation are also observed. On average, the daily standard deviation falls four basis
points. If the longest simulations are considered, as reported in the top panel of Table 12,
the results are consistently robust. There is an increase in annualized expected returns of
262 basis points on average across the different simulations, and a decrease in daily
standard deviations of three basis points.
If the second strategy is considered, the results are even stronger than before. In
Table 11, we report an improvement in annualized returns of 251 basis points on average
across mutual fund families and an improvement in daily standard deviations of four
basis points. In Table 12, where fewer specialized funds are included in portfolio
simulations, the improvement in returns is 168 basis points, but reaches 544 basis points
for the portfolio of world funds. The improvement in daily standard deviations is also
considerable: ten basis points on average across mutual fund families.
Therefore, our results suggest that benchmark effects cannot explain the empirical
evidence described regarding investment patterns. We find that, even within the same
mutual fund family, more aggregate funds are not internationally diversified enough with
possible improvements in both risk and returns.
C. Insurance Premium in the Global Fund Returns
There is still another possible explanation for our results: the existence of an
insurance premium in the returns of global funds. Global funds have the ability to shift
their stock holdings across countries and regions, which is not an option to specialized
funds. Investors might be willing to pay for this benefit since this extra flexibility might
yield gains during turbulent times. In other words, global funds might be better suited

29
than specialized funds to avoid large losses due to their ability to move away from
trouble spots. Therefore, we evaluate whether global funds have indeed a better ability to
minimize losses if compared to specialized funds.
We first compare the skewness and kurtosis of the global fund returns to those of
returns on our constructed portfolio of specialized funds. Higher moments of the
distribution of returns are important if global funds were to minimize losses during bad
times instead of following the standard mean-variance approach. The results are reported
on Table 13 for our “best” simulations and Table 14 for our longest simulations. We find
that skewness and kurtosis measures are similar, and not statistically different, across
global fund returns and returns on our constructed portfolio of specialized funds. For
example, if the “best” (longest) simulations are considered, the skewness of global fund
returns is -0.71 (-0.43) on average, whereas that of the returns on our constructed
portfolio is -0.56 (-0.28) if based on simulations of variance minimization or -0.74 (-0.44)
if based on simulations of maximization of expected returns. If the kurtosis is analyzed,
the returns on global funds exhibit kurtosis of 11.40 and 35.76 for “best” and longest
samples, respectively. Similarly, the kurtosis on the returns on our constructed portfolio
is 24.39 (48.93) if based on simulations of variance minimization or 11.42 (35.71) if
based on simulations of maximization of expected returns for the “best” (longest)
simulations. Overall, the evidence suggests that, despite the differences in the mean and
the variances already reported, higher moments of the distribution of returns are not
considerably different across global fund returns and returns on our constructed portfolio
of specialized funds.
We now consider the ability of global funds to move away from crisis-hit
countries or regions, and thus actually avoid realized risks across countries and regions.
Given the limited information on portfolio holdings, we focus the analysis on the
incidence of negative returns during turbulent times. For instance, conditional on large
negative returns on the MSCI Emerging Market Index, our proxy for crises periods, we
compare the realized returns of both global funds and our constructed portfolios of
specialized funds. 27 The results reported in Table 15 show that their performances are not
27 The evidence reported here considers only weekly returns. The results are similar if monthly returns are analyzed. Results are available from the authors upon request.

30
statistically different. For example, the average global fund return is -3.51% per week
(p.w.) when the MSCI Emerging Market Index falls more than 10% in one week, while
the returns on our portfolios of specialized funds are on average -3.54% (-3.57%) p.w. if
the “best” simulations for variance minimization (maximization of expected return) are
considered. Therefore, to the extent that our turbulent periods do not simply reflect global
systemic risks that cannot be diversified, global funds do not seem better suited to avoid
large losses if compared to specialized funds.
Alternatively, we also analyze those return differentials conditional on periods in
which our constructed portfolios perform badly in Table 16. In these situations, global
funds obtain slightly higher weekly return, with differentials between 0.05% and 0.98%
p.w., although these return differentials are not always statistically different than zero.
However, in Table 17 we evaluate the realized returns on our constructed portfolios when
global funds do not perform well. In this case, our constructed portfolios of specialized
funds perform slightly better than global funds. For example, when the actual return on
global funds is less than 10% in one week, our portfolios of specialized funds yield on
average returns 1.95% p.w. higher than returns on global funds if the longest simulations
of variance minimization are considered. However, if the longest simulations for return
maximization are considered, the difference in returns falls to 0.22% p.w. on average,
being no longer significantly different than zero.
Therefore, the results in this section suggest that there are indeed gains from
further international diversification to be made in both dimensions – return and volatility,
although there is some heterogeneity in the results depending on the strategy used. We
provide some evidence that benchmark effects cannot explain the evidence presented
here. Furthermore, the existence of an insurance premium in the returns of global funds is
also not enough to explain this lack of international diversification, as global funds do not
seem to perform consistently better than specialized funds during turbulent times.
VI. Conclusion
This paper studied whether there are unexploited gains from international diversification
using a novel dataset of portfolio holdings of U.S. institutional investors. We take
advantage of the fact that mutual funds belong to families, with each mutual fund

31
company having several funds with different scopes for international investment. As the
investment scope broadens, one would expect that risk is better diversified internationally
and that funds would hold more securities, to the extent that assets are not perfectly
correlated.
We find that mutual funds are not well diversified and could benefit from more
international diversification. In particular, we find that mutual funds hold a rather small
number of stocks. Moreover, as their investment scope widens, mutual funds invest in
fewer stocks within each region of exposure and in fewer countries. Furthermore, there
are strong family effects behind these investment patterns. That is, the number of stocks
held across fund types is similar within mutual fund companies but different across them.
Importantly, holding few stocks represents a cost to the mutual fund. Even within the
same mutual fund company, global funds could substantially gain from further
international diversification by simply replicating portfolios that are already held by other
funds within the same company.28
Several conclusions can be drawn from our paper. First, the evidence we found
does not seem consistent with the idea that the lack of diversification is driven by
asymmetric information. Since we compare the potential diversification gains within
mutual fund companies, one can argue that the cost of gathering and processing
information has already been paid and that mutual fund managers could freely share that
information. Moreover, we also evaluate whether or not the number of managers working
in the fund, fund and family expenses, and fund or family size could explain these
differences – in line with theories based on limited capacity to acquire and process
information. We find that while more managers tend to increase the number of stocks
held by the fund, this effect is very small and not statistically significant once other
family effects are considered. Similar results are obtained for the other proxies for
theories of information asymmetry. Second, our comparison also allows us to conclude
that the lack of diversification is not driven by transaction costs, understood as barriers to
purchase securities. Specialized funds have already purchased those assets, so they are
available to global funds as well. Furthermore, each fund is not very large relative to
28 This departure from full diversification and from apparently optimal portfolios is consistent with evidence on pension funds. See for example Opazo, Raddatz, and Schmukler (2008) and Raddatz and Schmukler (2008).

32
market capitalization; therefore the pattern of investment in few firms does not seem to
be driven by the size of global funds. Lastly, our results indicate that global funds are not
better suited to avoid large losses than specialized funds due to their ability to shift their
stock holdings across countries and regions. Thus, the existence of an insurance premium
in the returns of global funds is also not enough to explain the existence of large gains
from further international diversification.
What remains for future research is why, given the potential gains, global funds
are not more internationally diversified. Perhaps the remuneration scheme gives no
incentives for the information gathered by specialized funds to be freely shared within
each mutual fund company, with each fund manager collecting her own information.
Given the differences in the performance of specialized funds relative to global funds, it
is important to also understand why investors do not arbitrage these differences and favor
specialized funds over global ones. These puzzles remain open in the literature, and what
this paper has done is to cast some doubts over the standard explanations offered in the
literature regarding them.

33
VII. References
Agaarwal, R., L. Klapper, and P. Wysocki, 2005. Portfolio Preferences of Foreign Institutional Investors, Journal of Banking and Finance 29 (12), 2919–2946.
Ahearne, A., W. Griever, and F. Warnock, 2004. Information Costs and Home Bias: An Analysis of U.S. Holding of Foreign Equities, Journal of International Economics 62 (2), 313–363.
Ammer, J., S. Holland, D. Smith, and F. Warnock, 2006. Look at Me Now: What Attracts U.S. Shareholders? NBER Working Paper No. 12500.
Baxter, M. and U. J. Jermann, 1997. The International Diversification Puzzle is Worse Than You Think, American Economic Review 87 (1), 170–180.
Beck, T., R. Levine, and N. Loayza, 2000. Finance and Sources of Growth. Journal of Financial Economics 58 (1-2), 261–300.
Bekaert, G. and C. R. Harvey, 2000. Foreign Speculators and Emerging Equity Markets. Journal of Finance 55 (2), 565–614.
Bertaut, C. and L. Kole, 2004. What Makes Investors Over or Underweight? Explaining International Appetites for Foreign Equities, Board of Governors of the Federal Reserve System International Finance Discussion Paper No. 819.
Black, F., 1974. International Capital Market Equilibrium with Investment Barriers, Journal of Financial Economics 1 (4), 337–352.
Borensztein, E. and R. G. Gelos, 2003. A Panic-Prone Pack? The Behavior of Emerging Market Mutual Funds. IMF Staff Papers 50 (1), 43–63.
Brennan, M. and H. Cao, 1997. International Portfolio Investment Flows, Journal of Finance 52 (5), 1851–1880.
Chan, K., V. Covrig, and L. Ng, 2005. What Determines the Domestic Bias and Foreign Bias? Evidence from Mutual Fund Equity Allocations Worldwide, Journal of Finance 60 (3), 1495–1534.
Cooper, I. and E. Kaplanis, 1994. Home Bias in Equity Portfolios, Inflation Hedging, and International Capital Market Equilibrium, Review of Financial Studies 7 (1), 45-60.
Coval, J. and T. Moskowitz, 1999. Home Bias at Home: Local Equity Preference in Domestic Portfolios, Journal of Finance 54 (6), 1–39.
Dahlquist, M. and G. Robertsson, 2001. Direct Foreign Ownership, Institutional Investors, and Firm Characteristics, Journal of Financial Economics 59 (3), 413–440.
Didier, T., 2008. Information Asymmetry and Institutional Investor Mandates: Evidence from U.S. Mutual Fund Foreign Holdings, MIT mimeo.
Eichengreen, B., 2001. Capital Account Liberalization: What Do Cross-Country Studies Tell Us? World Bank Economic Review, 16 (3), 341–365.
Engel, C. and A. Matsumoto, 2005. Portfolio Choice in a Monetary Open-Economy DSGE Model, IMF Working Paper No. 05/165.
Errunza, V. and E. Losq, 1985. International Asset Pricing under Mild Segmentation: Theory and Test, Journal of Finance 40 (1), 105–124.
Eun C. S. and S. Janakiramanan, 1986. A Model of International Asset Pricing with a Constraint on the Foreign Equity Ownership, Journal of Finance 41 (4), 897–914.
34
Falkenstein, E., 1996. Preferences for Stock Characteristics as Revealed by Mutual Fund Portfolio Holdings, Journal of Finance 51 (1), 111–135.
Frankel, J., 2000. Globalization of the Economy. NBER Working Paper No. 7858. French, K., and J. Poterba, 1991. International Diversification and International Equity
Markets, American Economic Review 81 (2), 222–226. Froot, K., P. O'Connell, and M. Seasholes, 2001. The Portfolio Flows of International
Investors, Journal of Financial Economics 59 (2), 151–193. Gelos R. G. and S.-J. Wei, 2005. Transparency and International Portfolio Holdings,
Journal of Finance 60 (6), 2987–3020. International Monetary Fund, 2005. Global Financial Stability Report, September. Harvey, C. R., 1995. Predictable Risk and Returns in Emerging Markets, Review of
Financial Studies 8 (3), 773–816. Henry, P. B., 2000. Stock Market Liberalization, Economic Reform, and Emerging
Market Equity Prices, Journal of Finance 55 (2), 529–564. Huberman, G., 2001. Familiarity Breeds Investment, Review of Financial Studies 14 (3),
659–680. Kaminsky, G., R. Lyons, and S. Schmukler, 2004. Managers, Investors, and Crises:
Mutual Fund Strategies in Emerging Markets, Journal of International Economics 64 (1), 113–134.
Kang, J. K. and R. Stulz, 1997. Why is There a Home Bias? An Analysis of Foreign Portfolio Equity Ownership in Japan, Journal of Financial Economics 46 (1), 3–28.
Karolyi, A. and R. Stulz, 2003. Are Financial Assets Priced Locally or Globally? in The Handbook of Economics and Finance, Constantinides, G. M., M. Harris, and R. Stulz (eds.), North Holland, New York, NY, 975–1020.
Kose, M. A., E. Prasad, K. Rogoff, and S. Wei. 2006. Financial Globalization: A Reappraisal, NBER Working Paper No. 12484.
Kose, M. A., E. Prasad, M. Terrones, 2007. How Does Financial Globalization Affect Risk Sharing? IZA Discussion Paper No. 2903.
Lewis, K., 1999. Trying to Explain Home Bias in Equities and Consumption, Journal of Economic Literature 37 (2), 571–608.
Merton, R. C., 1987. A Simple Model of Capital Market Equilibrium with Incomplete Information, Journal of Finance 42 (3), 483–510.
Mishkin, F., 2007. Is Financial Globalization Beneficial? Journal of Money, Credit and Banking 39 (2–3), 259–294.
Obstfeld, M. and K. Rogoff, 2001. The Six Major Puzzles in International Macroeconomics: Is There a Common Cause, in NBER Macroeconomics Annual 2000, Bernanke B. and K. Rogoff (eds.), The University of Chicago Press, Chicago, IL, 339–390.
Obstfeld, M. and A. Taylor, 2002. Globalization and Capital Markets, NBER Working Paper No. 8846.
Opazo, L., C. Raddatz, and S. Schmukler, 2008. How Long is Long Term in Emerging Economies? World Bank, mimeo.
Pesenti, P. and E. van Wincoop, 2002. Can Nontradables Generate Substantial Home Bias? Journal of Money, Credit and Banking 34 (1), 25–50.

35
Portes, R. and H. Rey, 2005. The Determinants of Cross-Border Equity Flows, Journal of International Economics 65 (2), 269–296.
Prasad, E., K. Rogoff, S. Wei, and M. A. Kose. 2003. Effects of Financial Globalization on Developing Countries; Some New Evidence, IMF Occasional Paper No. 220.
Raddatz, C. and S. Schmukler, 2008. Pension Funds and Capital Market Development: How Much Bang for the Buck? World Bank, mimeo.
Rajan, R. G. and L. Zingales, 1998. Financial Dependence and Growth, American Economic Review 88 (3), 559–586.
Stulz, R., 1981. On the Effects of Barriers to International Investment, Journal of Finance 36 (4), 923–934.
Stulz, R., 1999. Globalization of Equity Markets and the Cost of Capital, Dice Center Working Paper No. 99–1.
Stulz, R., 2005. The Limits of Financial Globalization. Journal of Finance 60 (4), 1595–1638.
Stulz, R. and W. Wasserfallen, 1995. Foreign Equity Investment Restrictions, Capital Flight Restrictions, and Shareholder Wealth: Theory and Evidence, Review of Financial Studies 8 (4), 1019–1057.
Tesar, L. and I. Werner, 1995. Home Bias and High Turnover, Journal of International Money and Finance 14 (4), 467–493.
Warnock, F. and C. Cleaver, 2003. Financial Centers and the Geography of Capital Flows, International Finance 6 (1), 27–59.

Glo
bal
Fund
s
Spec
ializ
edFu
nds
+ …
+ …
Figu
re 1
. Str
uctu
re o
f the
U.S
. Mut
ual F
unds
Indu
stry
This
figur
ech
arac
teriz
esth
eor
gani
zatio
nof
U.S
.mut
ualf
und
fam
ilies
that
inve
stin
fore
ign
asse
ts.S
eede
scrip
tion
inth
em
ain
text
ford
etai
ls.T
hefig
ure
also
clar
ifies
our
clas
sific
atio
nbe
twee
ngl
obal
and
spec
ializ
edfu
nds.
Glo
bal f
unds
incl
ude
both
wor
ld a
nd fo
reig
n fu
nds.
Spec
ializ
ed fu
nds i
nclu
de: e
mer
ging
mar
ket f
unds
, reg
iona
l fun
ds, a
nd c
ount
ry fu
nds.
Cou
ntry
3C
ount
r y 2
C
hinaR
egio
n 1
A
sia
Fore
ign
Fund
s
Reg
ion
2
Euro
pe
R
egio
n 6
M
iddl
e Ea
stR
egio
n 5
Em
ergi
ng A
sia
+ …
U.S
. Fun
ds
Wor
ld F
unds
Cou
ntry
1
Japa
n
Reg
ion
4
East
ern
Euro
pe
Reg
ion
3
Latin
Am
eric
a
Em
ergi
ng M
arke
t Fun
ds

Figure 2. Total Number of Funds and Total Assets under Management by Fund Type
This figure shows the total number of mutual funds in our holdings database and their total assets under management byfund type from 1991 to 2005. Global funds include both world and foreign funds. Specialized funds include: emergingmarket funds, regional funds, and country funds. For global funds, the value of assets under management that are investedin non-U.S. assets is also shown (data available after 1997 only). Data on assets under management are in US$ billions.The data source is Morningstar International Equity Mutual Funds.
Global Funds
0
100
200
300
400
500
600
1991
1992
1993
1994
1995
1996
1997
1998
1999
2000
2001
2002
2003
2004
2005
No.
of F
unds
0
100
200
300
400
500
600
700
800
900
US$
Bill
ions
Specialized Funds
0
100
200
300
400
500
600
1991
1992
1993
1994
1995
1996
1997
1998
1999
2000
2001
2002
2003
2004
2005
No.
of F
unds
0
100
200
300
400
500
600
700
800
900
US$
Bill
ions
No. of FundsAssets under ManagementAssets under Management - Ex-U.S. Assets
No. of FundsAssets under Management

Figure 3. Median Number of Holdings by Fund Type
This figure shows the median number of holdings by mutual fund type between 1991 and 2005. The followingmutual fund types are shown in the top panel of the figure: world, foreign, emerging market, and regional funds.The median number of foreign holdings of world funds is also shown. In the bottom panel, regional funds aredivided into three different categories, namely: Latin America, Europe, and Asia funds. The median number ofholdings for country funds is also reported in the bottom panel. The data source is Morningstar InternationalEquity Mutual Funds.
All Funds
0
20
40
60
80
100
120
140
160
1991
1992
1993
1994
1995
1996
1997
1998
1999
2000
2001
2002
2003
2004
2005
World Funds World Funds - Ex-U.S. HoldingsForeign Funds Emerging Market FundsRegional Funds
Specialized Funds
0
20
40
60
80
100
120
140
160
1991
1992
1993
1994
1995
1996
1997
1998
1999
2000
2001
2002
2003
2004
2005
Asia Funds Europe FundsLatin America Funds Country Funds

Figu
re 4
. Mut
ual F
und
Hol
ding
s as a
Pro
port
ion
of th
e T
otal
No.
of L
iste
d St
ocks
This
figur
esh
ows
the
num
bero
fmut
ualf
und
hold
ings
asa
perc
enta
geof
the
tota
lnum
bero
flis
ted
stoc
ksby
coun
try.C
ount
ries
are
sorte
dac
cord
ing
toth
eira
vera
gera
tioin
the
1997
-200
4pe
riod.
Cou
ntrie
sar
edi
vide
din
tofiv
eeq
ually
-siz
edgr
oups
(qui
ntile
s);t
heav
erag
ean
dm
axim
umva
lues
for
each
quin
tile
are
repo
rted.
The
Uni
ted
Stat
esan
dC
anad
aw
ere
excl
uded
from
figur
e.Th
eda
taso
urce
sar
eM
orni
ngst
arIn
tern
atio
nal E
quity
Mut
ual F
unds
and
Glo
bal F
inan
cial
Dat
abas
e. *
"A
ll C
hina
" in
clud
es th
e fo
llow
ing
coun
tries
: Mai
nlan
d C
hina
, Hon
g K
ong,
and
Tai
wan
.
0%10%
20%
30%
40%
50%
60%
70%
80%
90%
100%
NigeriaSaudi Arabia
RomaniaLithuania
LatviaSlovak Republic
BangladeshBulgariaTunisiaIceland
OmanJordanCyprus
PakistanEgyptIndia
CroatiaUruguaySloveniaEcuador
Sri LankaPeru
ColombiaKazakhstan
EstoniaZimbabwe
ChileCzech Republic
SpainIsrael
PanamaVenezuela
MoroccoKenya
BotswanaSouth Africa
LebanonBrazil
PolandPhilippines
RussiaAll China*
AustraliaIndonesiaMauritius
TurkeyThailandMalaysia
GreeceKorea
PortugalGhana
ArgentinaGermanyHungaryMexicoNorwayFrance
United KingdomAustria
SingaporeDenmarkBelgium
New ZealandFinland
SwitzerlandSweden
JapanItaly
IrelandNetherlands
Firs
t Qui
ntile
Ave
rage
: 1.1
%M
ax: 2
.4%
Seco
nd Q
uint
ile
Ave
rage
: 7.7
%M
ax: 1
3.8%
Thi
rd Q
uint
ile
Ave
rage
: 21.
1%M
ax: 2
8.2%
Four
th Q
uint
ile
Ave
rage
: 35.
2%M
ax: 4
3.6%
Fift
h Q
uint
ile
Ave
rage
: 57.
8%M
ax: 7
7.3%

Figure 5. Evolution of Entropy Measures
Total Holdings
Holdings in Emerging Countries Only
This figure shows the evolution of our entropy measure, in which stocks common to both global and specialized funds areconsidered, from 1997 to 2005. In the top panel, holdings in assets from all countries except the U.S. are considered,whereas in the bottom panel, only asset holdings in emerging countries are analyzed. The thick line represents the medianvalue across families in a given year. The figure also shows +/- one standard deviation from this median (dotted grey lines).Specialized funds include: emerging market, Latin America, Asia, Europe, and country funds.
0.00
0.10
0.20
0.30
0.40
0.50
0.60
0.70
0.80
0.90
1.00
1997 1998 1999 2000 2001 2002 2003 2004 2005
0.00
0.10
0.20
0.30
0.40
0.50
0.60
0.70
0.80
0.90
1.00
1997 1998 1999 2000 2001 2002 2003 2004 2005

Figure 6. No. of Holdings: Dispersion and Family Effects
This figure shows two characteristics of mutual fund holdings. The top panel, shows the distribution ofthe number of holdings in the 1991-2005 period. The bottom panel reports the median number ofholdings by mutual fund family. All funds in any given family are considered. Families are sortedaccording to their median number of holdings in the 1991-2005 period. Families are divided into fiveequally-sized groups (quintiles); the average and maximum values for each quintile are reported.
Histogram
0
100
200
300
400
500
600
70010 30 50 70 90 11
013
015
017
019
021
023
025
027
029
031
033
035
037
039
041
043
045
047
049
0
No. of Holdings
Freq
uenc
y
Family Effects: Median No. of Holdings
0
100
200
300
400
500
600
700
800
900
1,000
1,100
1,200
Families
No.
of H
oldi
ngs
FifthQuintile
Average: 329 Max: 1,027
FourthQuintile
Average: 121 Max: 153
ThirdQuintile
Average: 88Max: 101
SecondQuintile
Average: 66Max: 77
FirstQuintile
Average: 38Max: 55
Summary Statistics:
Average: 149 StocksMedian: 95 StocksStd. Dev.: 186 Stocks
74% of obs. are below 150 holdings88% of obs. are below 250 holdings92% of obs. are below 350 holdings

Sample 1991-2005Frequency AnnualNo. of Families 505Total Number of Funds 3,651
Sample September 1989 - June 2006Frequency DailyNo. of Families 36Total Number of Funds 371
This table describes the two datasets analyzed in this paper. Thesource of the data on mutual fund holdings is MorningstarInternational Equity Mutual Funds. The source of the mutual fundprice/return dataset is Bloomberg.
Table 1. Data Coverage
Holdings Data
Price Data

Average Median Std. Dev.Fund Type:Global Funds 155 96 196 World Funds 136 106 131 Excluding U.S. Assets 101 76 100 Foreign Funds 175 105 219
Specialized Funds 116 78 135 Emerging Market Funds 160 121 138 Asia Funds 88 64 109 Europe Funds 108 70 155 Latin America Funds 57 56 24 Country Funds 126 63 176
Total 149 95 186
Table 2. Mutual Fund Holdings
This table shows the average, the median, and the standard deviation ofthe number of holdings by mutual fund type over the period 1991-2005.The following mutual fund types are shown: global funds (world andforeign funds) and specialized funds (emerging market, regional, andcountry funds). The data source is Morningstar International EquityMutual Funds.

Fund Type Latin America Asia Developed Europe
Regional Funds Median No. of Holdings 41 60 62
Changes Relative to: Emerging Market Funds -34% -33% - Foreign Funds -94% -42% -5% World Funds -94% -69% -49%
Fund Type Latin America Asia Developed Europe
Regional Funds Median No. of Holdings 6 8 11
Changes Relative to: Emerging Market Funds -17% -10% - Foreign Funds -71% -31% 0% World Funds -75% -36% -14%
This table reports differences in asset holdings across fund types within regions of exposure. Thesedifferences are expressed as a percentage change relative to the holdings of the appropriate regional fund.Median values for regional funds are reported. The top panel shows the differences in the number of holdingsacross fund types. The bottom panel shows the differences in the number of countries receiving investmentsfrom different fund types. The first row in each panel reports the median number of holdings or countries in agiven region for the appropriate regional fund. The comparisons are made within mutual fund families.Families without the appropriate regional fund are excluded from the analysis. The sample period is from1997 to 2005. Global funds are comprised of both world and foreign funds. Regional funds include thefollowing fund types: Latin America funds, Asia funds, and Europe funds.
No. of Countries
Table 3. Differences in Holdings Within Regions across Fund Types
No. of Assets

Total 30,319 9,086 30% 6,267 21%
Developed Countries 12,987 6,815 52% 4,953 38% Asia 5,760 3,249 56% 2,246 39% Europe 6,392 3,459 54% 2,635 41% Middle East 802 87 11% 54 7%
Emerging Countries 17,332 2,271 13% 1,314 8% Asia 10,089 1,304 13% 693 7% Europe 2,697 319 12% 167 6% Latin America 2,196 399 18% 297 14% Middle East & Africa 2,350 249 11% 157 7%
Total 39,061 6,289 16% 5,510 14%
Developed Countries 18,282 5,204 28% 4,799 26% Asia 7,758 2,748 35% 2,429 31% Europe 9,817 2,392 24% 2,315 24% Middle East 686 45 7% 37 5%
Emerging Countries 20,779 1,085 5% 711 3% Asia 10,444 566 5% 394 4% Europe 6,279 184 3% 114 2% Latin America 1,525 195 13% 141 9% Middle East & Africa 2,531 140 6% 62 2%
Table 4. Mutual Fund Holdings
1997
2004
All Fund HoldingsNo. Listed Companies
No. of Holdings
As a Percentage of All Listed Stocks
Global Fund HoldingsNo. of
HoldingsAs a Percentage of All Listed Stocks
This table shows the number of stocks that can be potentially held by U.S. mutual funds in 1997 (top panel) and in 2004 (bottom panel).The first column shows the total number of listed stocks in the main stock exchange in each country within each region. The data is fromClaessens and Schmukler (2006) and from Global Financial Database. This is considered the universe of stocks that can be held bymutual funds. The second column shows the number of stocks actually held by all U.S. mutual funds in these regions, in absolute termsand as a percentage of the universe of stocks available. The third column reports the same numbers for global funds only. Developedcountries include high-income countries and emerging countries are non-high-income countries, according to the World Bankclassification of countries. The United States, Canada, and offshore centers are excluded from the analysis. The data source of mutualfund holdings data is Morningstar International Equity Mutual Funds.

Average Median Std. Dev.Fund Type:Global Funds 0.12% 0.01% 0.74% 894 World Funds 0.18% 0.01% 0.86% 1,315 Foreign Funds 0.11% 0.01% 0.72% 754
Specialized Funds 0.12% 0.02% 0.59% 272 Emerging Market Funds 0.15% 0.02% 0.70% 367 Asia Funds 0.12% 0.01% 0.53% 131 Europe Funds 0.08% 0.01% 0.35% 332 Latin America Funds 0.09% 0.02% 0.46% 146
This table shows the average, median, and standard deviation of mutual fund foreign holdings as apercentage of firms' market capitalization, by fund type. The average size of mutual funds is alsoreported. This data is in US$ millions. The sample period considered is from 1997 to 2005.
Holdings as a Percentage of Firms' Market Capitalization
Table 5. Size of Mutual Fund Holdings
Average Mutual Fund Size

Not Being Held Being HeldSpecialized FundsProbability of:
BeingHeld
Total 100%[399,281]
Not Being Held Being HeldSpecialized FundsProbability of:
BeingHeld
Total 100%[92,355]
Table 6. Probabilities of Being Held by a Mutual Fund
This table shows frequency tables for mutual fund holdings from 1997 to 2005. It reports the probability ofbeing held (or not) by certain types of mutual funds, given that a mutual fund family has both fund types.The top panel considers asset holdings in all countries except the U.S., whereas the bottom panel considersasset holdings in emerging countries only. Each observation is a family-year-stock observation. The totalnumber of observations is reported in brackets in the "Total" column of each table. The cell percentage isreported. If in a given family-year observation, a global fund holds an asset in a country not covered by thespecialized funds within that family in that year, then this observation is counted in the "No SpecializedFund" line.
Not Being Held
No Specialized Fund
Not Being Held
No Specialized Fund
TotalProbability of:
TotalProbability of:
27%0%
24%76%
32% 68%
25%0%
2%2%0%
76% 13%
32% 16%
27%
Total Holdings
Holdings in Emerging Countries Only
10%
89%
Global Funds
Global Funds
0% 10%
48%
25%

(1) (2) (3) (4) (5) (6)
Independent Variables:
No. of Managers 16.814*** 15.612*** 16.075***[4.507] [4.568] [4.797]
1 132.205***[10.665]
2 134.980***[8.602]
3 153.479***[19.083]
4 165.689***[19.957]
5 151.307***[16.569]
6 196.882***[31.305]
7 or More 216.827***[27.617]
Manager Tenure 2.32 2.78 -1.42 -2.26 1.11[2.462] [2.465] [2.673] [2.509] [2.226]
Fund Age 1.00 0.28 0.45 0.85 0.22[0.800] [0.777] [0.885] [0.912] [0.848]
Fund Expenses 0.655*** -2.175* -2.228*[0.116] [1.225] [1.267]
Fund Size 0.028** 0.026**[0.013] [0.013]
Year Dummies No No Yes No No YesFund Type Dummies No No Yes No No Yes
No. of Observations 6,419 6,170 6,170 5,733 5,732 5,726R-squared 0.02 0.03 0.05 0.01 0.02 0.07
Table 7. No of Holdings: Importance of No. of Managers and Fees
This table reports the regressions of the number of mutual fund holdings on the number of managers, manager's tenure, age offund in years, fund expenses, and fund size. Depending on the specification, year and/or fund type dummies are included inthese regressions. The sample period is from 1997 to 2005. Fund expenses and fund size are in US$ millions. R-squared andtotal number of observations are reported in the bottom of the table. Standard errors are clustered at the family level. Standarddeviation is shown in brackets. ***, **, and * indicate significance at one, five, or ten percent, respectively.

(1) (2) (3) (4) (5) (6) (7)
R-squared 0.01 0.02 0.46 0.02 0.47 0.48 0.48
Independent Variables:
Year Dummies Yes No No Yes Yes No YesFund Type Dummies No Yes No Yes No Yes YesFamily Dummies No No Yes No Yes Yes Yes
No. of Observations 8,543 8,543 8,543 8,543 8,543 8,543 8,543
(1) (2) (3) (4) (5) (6) (7)
Independent Variables:
No. of Managers 14.172*** 4.57 4.48[4.483] [3.667] [3.668]
Manager Tenure -0.60 -1.71 1.30 2.068* 1.47 1.48 2.055*[2.652] [2.441] [2.232] [1.209] [1.222] [1.224] [1.205]
Fund Age 0.82 1.23 0.38 -0.97 -0.91 -0.91 -0.96[0.885] [0.925] [0.845] [0.850] [0.853] [0.857] [0.850]
Family Expenses 0.095** -0.742*** -0.644** 0.05 -0.02 -0.02[0.047] [0.232] [0.251] [0.036] [0.157] [0.159]
Family Size 0.009*** 0.007*** 0.00 0.00[0.003] [0.003] [0.002] [0.002]
Year Dummies No No Yes Yes Yes Yes YesFund Type Dummies No No Yes Yes Yes Yes YesFamily Dummies No No No Yes Yes Yes Yes
No. of Observations 6,177 6,177 6,170 6,170 6,177 6,177 6,170R-squared 0.01 0.03 0.07 0.49 0.49 0.49 0.49
Table 8. No of Mutual Fund Holdings
The top table shows the R-squared of the regressions of the number of mutual fund holdings on year dummies, fund type dummies, andfamily dummies. Seven different specifications are shown. See the main text for a detailed description. The sample period is from 1991to 2005. The bottom table reports the regressions of the number of mutual fund holdings on the number of managers, manager's tenure,age of fund in years, mutual fund family expenses, and mutual fund family size. Depending on the specification, year, fund type, and/orfamily dummies are included in these regressions. The sample period is from 1997 to 2005. Family expenses and family size are in US$millions. R-squared and total number of observations are reported in the bottom of the table. Standard errors are clustered at the familylevel. Standard deviation is shown in brackets. ***, **, and * indicate significance at one, five, or ten percent, respectively.
Importance of Family Expenses and Family Size
Importance of Year, Fund Type, and Family Effects

Type of Global FundGlobal Fund
Port. Spec. Funds
Global Fund
Port. Spec. Funds
No. of Compar.
World Funds 6.05% 11.08% 5.09% 0.89% 0.80% 60Foreign Funds 6.40% 10.40% 4.04% 0.96% 0.90% 72Portfolio of World Funds 22.54% 36.41% 11.59% 0.79% 0.71% 3Portfolio of Foreign Funds 9.18% 13.22% 3.97% 0.89% 0.83% 21
Total 6.92% 11.49% 4.58% 0.92% 0.85% 156
Type of Global FundGlobal Fund
Port. Spec. Funds
Global Fund
Port. Spec. Funds
No. of Compar.
World Funds 6.05% 7.93% 1.91% 0.89% 0.89% 60Foreign Funds 6.40% 6.85% 0.46% 0.96% 0.96% 73Portfolio of World Funds 22.54% 34.83% 10.10% 0.79% 0.81% 3Portfolio of Foreign Funds 9.18% 12.65% 3.46% 0.89% 0.89% 20
Total 6.92% 8.51% 1.61% 0.92% 0.92% 156
Standard Deviation of Daily Returns
Maximizing Expected Return
Average Return (p.y.) Differences in Accumulated Daily Returns
Table 9. Simulations: "Best" Result for Each Fund
Minimizing the Variance
Average Return (p.y.)Standard Deviation of
Daily Returns
This table shows the results of the following simulations: minimization of the variance of returns subject to restrictions on theexpected returns (top panel) and maximization of expected returns subject a restriction on the variance of returns (bottompanel). The simulation yielding the highest realized average return ("best") for each main fund in each family is considered.The main funds are world funds, foreign funds, portfolios of world funds, and portfolios of foreign funds. Portfolios of worldfunds are composed by several world funds within the same family but with different scopes, e.g. world value funds and worldgrowth funds. Portfolios of foreign funds are similarly formed. The strategy considered is an active one, in which portfolioweights are updated every day. Realized returns of the simulated portfolio are calculated out-of-sample, as described in themain text.
Differences in Accumulated Daily Returns
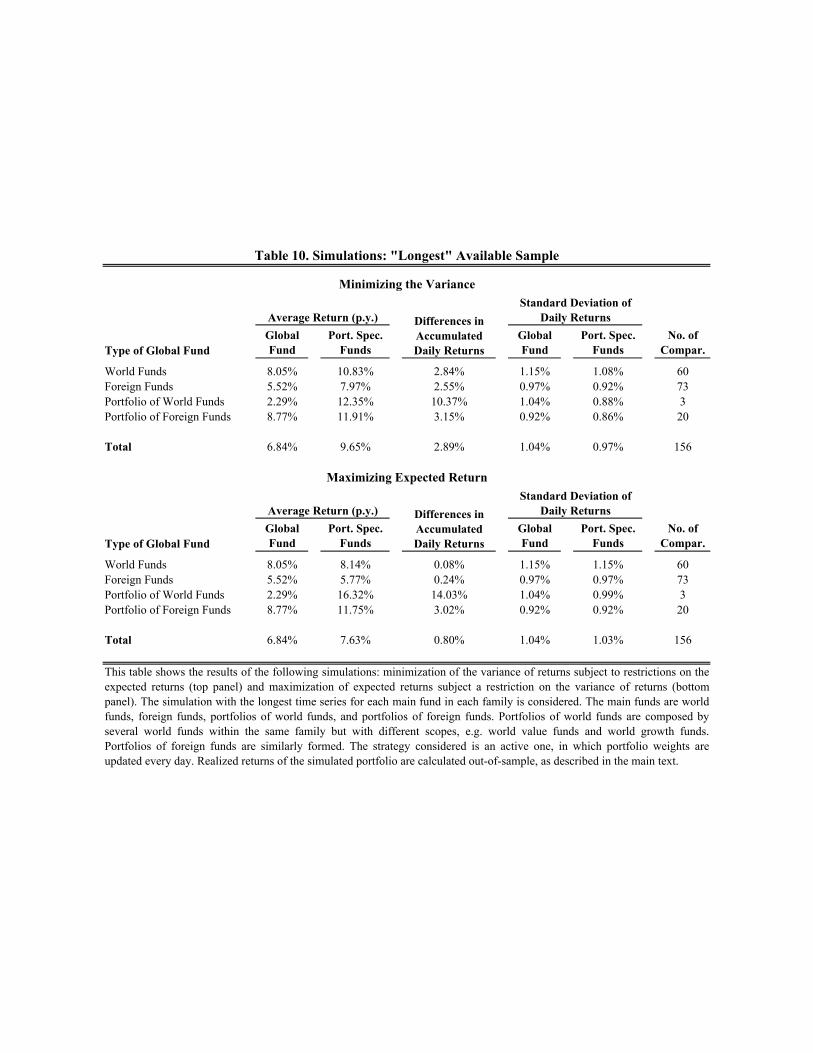
Type of Global FundGlobal Fund
Port. Spec. Funds
Global Fund
Port. Spec. Funds
No. of Compar.
World Funds 8.05% 10.83% 2.84% 1.15% 1.08% 60Foreign Funds 5.52% 7.97% 2.55% 0.97% 0.92% 73Portfolio of World Funds 2.29% 12.35% 10.37% 1.04% 0.88% 3Portfolio of Foreign Funds 8.77% 11.91% 3.15% 0.92% 0.86% 20
Total 6.84% 9.65% 2.89% 1.04% 0.97% 156
Type of Global FundGlobal Fund
Port. Spec. Funds
Global Fund
Port. Spec. Funds
No. of Compar.
World Funds 8.05% 8.14% 0.08% 1.15% 1.15% 60Foreign Funds 5.52% 5.77% 0.24% 0.97% 0.97% 73Portfolio of World Funds 2.29% 16.32% 14.03% 1.04% 0.99% 3Portfolio of Foreign Funds 8.77% 11.75% 3.02% 0.92% 0.92% 20
Total 6.84% 7.63% 0.80% 1.04% 1.03% 156
Table 10. Simulations: "Longest" Available Sample
Minimizing the Variance
Average Return (p.y.)Standard Deviation of
Daily Returns
Maximizing Expected Return
Differences in Accumulated Daily Returns
This table shows the results of the following simulations: minimization of the variance of returns subject to restrictions on theexpected returns (top panel) and maximization of expected returns subject a restriction on the variance of returns (bottompanel). The simulation with the longest time series for each main fund in each family is considered. The main funds are worldfunds, foreign funds, portfolios of world funds, and portfolios of foreign funds. Portfolios of world funds are composed byseveral world funds within the same family but with different scopes, e.g. world value funds and world growth funds.Portfolios of foreign funds are similarly formed. The strategy considered is an active one, in which portfolio weights areupdated every day. Realized returns of the simulated portfolio are calculated out-of-sample, as described in the main text.
Average Return (p.y.)Standard Deviation of
Daily ReturnsDifferences in Accumulated Daily Returns

Type of Global FundGlobal Fund
Port. Spec. Funds
Global Fund
Port. Spec. Funds
No. of Compar.
World Funds 8.45% 12.24% 3.75% 0.91% 0.86% 54Foreign Funds 6.35% 10.36% 3.97% 0.96% 0.94% 72Portfolio of World Funds 22.54% 31.39% 7.35% 0.79% 0.75% 3Portfolio of Foreign Funds 9.00% 12.34% 3.34% 0.90% 0.86% 20
Total 7.77% 11.69% 3.87% 0.93% 0.89% 149
Type of Global FundGlobal Fund
Port. Spec. Funds
Global Fund
Port. Spec. Funds
No. of Compar.
World Funds 8.45% 11.60% 3.18% 0.91% 0.85% 54Foreign Funds 6.35% 8.63% 2.28% 0.96% 0.94% 72Portfolio of World Funds 22.54% 24.44% 1.59% 0.79% 0.78% 3Portfolio of Foreign Funds 9.00% 10.74% 1.66% 0.90% 0.88% 20
Total 7.77% 10.29% 2.51% 0.93% 0.89% 149
This table shows the results of the following simulations: minimization of the variance of returns relative to a benchmark indexsubject to restrictions on expected returns (top panel) and maximization of expected returns subject a restriction on the varianceof returns relative to a benchmark index (bottom panel). The simulation yielding the highest realized average return ("best") foreach main fund in each family is considered. For each simulation, we consider the appropriate benchmark indexes for theglobal fund. The main funds are world funds, foreign funds, portfolios of world funds, and portfolios of foreign funds.Portfolios of world funds are composed by several world funds within the same family but with different scopes, e.g. worldvalue funds and world growth funds. Portfolios of foreign funds are similarly formed. The strategy considered is an active one,in which portfolio weights are updated every day. Realized returns of the simulated portfolio are calculated out-of-sample, asdescribed in the main text.
Average Return (p.y.)Standard Deviation of
Daily ReturnsDifferences in Accumulated Daily Returns
Average Return (p.y.)Standard Deviation of
Daily Returns
Maximizing Expected Return
Differences in Accumulated Daily Returns
Table 11. Benchmarking: "Best" Result for Each Fund
Minimizing the Variance

Type of Global FundGlobal Fund
Port. Spec. Funds
Global Fund
Port. Spec. Funds
No. of Compar.
World Funds 9.04% 11.63% 2.59% 1.15% 1.11% 60Foreign Funds 5.49% 7.70% 2.24% 0.97% 0.95% 73Portfolio of World Funds 2.29% 11.68% 9.51% 1.04% 0.93% 3Portfolio of Foreign Funds 8.53% 11.58% 3.08% 0.93% 0.89% 19
Total 7.16% 9.76% 2.62% 1.03% 1.00% 155
Type of Global FundGlobal Fund
Port. Spec. Funds
Global Fund
Port. Spec. Funds
No. of Compar.
World Funds 9.04% 10.08% 1.87% 1.15% 0.91% 60Foreign Funds 5.49% 6.98% 1.52% 0.97% 0.95% 73Portfolio of World Funds 2.29% 7.56% 5.44% 1.04% 0.96% 3Portfolio of Foreign Funds 8.53% 9.67% 1.11% 0.93% 0.91% 19
Total 7.16% 8.51% 1.68% 1.03% 0.93% 155
This table shows the results of the following simulations: minimization of the variance of returns relative to a benchmark indexsubject to restrictions on expected returns (top panel) and maximization of expected returns subject a restriction on the varianceof returns relative to a benchmark index (bottom panel). The simulation with the longest time series for each main fund in eachfamily is considered. For each simulation, we consider the appropriate benchmark indexes for the global fund. The main fundsare world funds, foreign funds, portfolios of world funds, and portfolios of foreign funds. Portfolios of world funds arecomposed by several world funds within the same family but with different scopes, e.g. world value funds and world growthfunds. Portfolios of foreign funds are similarly formed. The strategy considered is an active one, in which portfolio weights areupdated every day. Realized returns of the simulated portfolio are calculated out-of-sample, as described in the main text.
Average Return (p.y.)Standard Deviation of
Daily ReturnsDifferences in Accumulated Daily Returns
Average Return (p.y.)Standard Deviation of
Daily Returns
Maximizing Expected Return
Differences in Accumulated Daily Returns
Table 12. Benchmarking: Simulations with The Longest Available Sample
Minimizing the Variance

Skewness Kurtosis Skewness KurtosisType of Global FundWorld Stock -0.68 11.35 -0.64 8.10 60
[1.08] [15.54] [0.71] [9.50]
Foreign Stock -0.84 13.10 -0.41 42.67 72[1.22] [20.53] [5.01] [261.77]
Portfolio of World Stock Funds -0.02 4.99 -0.39 6.60 3[0.11] [1.93] [0.24] [3.35]
Portfolio of Foreign Stock Funds -0.45 6.64 -0.88 10.82 21[0.49] [6.00] [0.97] [12.82]
Total -0.71 11.40 -0.56 24.39 156[1.09] [17.17] [3.44] [178.14]
Skewness Kurtosis Skewness KurtosisType of Global FundWorld Stock -0.68 11.35 -0.70 11.33 60
[1.08] [15.54] [1.07] [15.65]
Foreign Stock -0.84 13.10 -0.79 11.74 72[1.22] [20.53] [1.07] [16.34]
Portfolio of World Stock Funds -0.02 4.99 -0.17 5.33 3[0.11] [1.93] [0.14] [2.74]
Portfolio of Foreign Stock Funds -0.45 6.64 -0.80 11.43 21[0.49] [6.00] [1.08] [14.08]
Total -0.71 11.40 -0.74 11.42 156[1.09] [17.17] [1.06] [15.56]
This table shows skewness and kurtosis for global funds and portfolio of specialized funds based on the following simulations:minimization of the variance of returns subject to restrictions on expected returns (top panel) and maximization of expectedreturns subject a restriction on the variance of returns (bottom panel). The simulation yielding the highest realized averagereturn ("best") for each main fund in each family is considered. The main funds are world funds, foreign funds, portfolios ofworld funds, and portfolios of foreign funds. Portfolios of world funds are composed by several world funds within the samefamily but with different scopes, e.g. world value funds and world growth funds. Portfolios of foreign funds are similarlyformed. The strategy considered is an active one, in which portfolio weights are updated every day. Realized returns of thesimulated portfolio are calculated out-of-sample, as described in the main text. Standard deviation of both skewness and kurtosis across comparisons are shown in brackets.
Table 13. Skewness and Kurtosis based on "Best" Simulations
Maximizing Expected Return
Returns on Global Funds
Minimizing the Variance
Returns on Global Funds No. of Compar.
No. of Compar.
Returns on Port. Spec. Funds
Returns on Port. Spec. Funds

Skewness Kurtosis Skewness KurtosisType of Global FundWorld Stock 0.19 72.81 0.21 69.95 60
[7.87] [458.13] [7.83] [458.41]
Foreign Stock -0.94 14.52 -0.50 43.74 73[1.26] [20.82] [5.00] [259.82]
Portfolio of World Stock Funds -0.23 7.21 -0.52 7.65 3[0.49] [3.52] [0.11] [2.07]
Portfolio of Foreign Stock Funds -0.44 6.44 -0.90 10.98 20[0.43] [4.72] [0.98] [13.15]
Total -0.43 35.76 -0.28 48.93 156[4.96] [284.55] [5.93] [334.32]
Skewness Kurtosis Skewness KurtosisType of Global FundWorld Stock 0.19 72.81 0.19 72.78 60
[7.87] [458.13] [7.87] [458.14]
Foreign Stock -0.94 14.52 -0.87 12.96 73[1.26] [20.82] [1.08] [16.58]
Portfolio of World Stock Funds -0.23 7.21 -0.08 7.72 3[0.49] [3.52] [0.43] [2.17]
Portfolio of Foreign Stock Funds -0.44 6.44 -0.83 11.72 20[0.43] [4.72] [1.11] [14.60]
Total -0.43 35.76 -0.44 35.71 156[4.96] [284.55] [4.95] [284.45]
Table 14. Skewness and Kurtosis based on Longest Simulations
Minimizing the Variance
Returns on Global Funds Returns on Port. Spec. Funds No. of Compar.
This table shows skewness and kurtosis for global funds and portfolio of specialized funds based on the following simulations:minimization of the variance of returns subject to restrictions on expected returns (top panel) and maximization of expectedreturns subject a restriction on the variance of returns (bottom panel). The simulation with the longest time series for each mainfund in each family is considered. The main funds are world funds, foreign funds, portfolios of world funds, and portfolios offoreign funds. Portfolios of world funds are composed by several world funds within the same family but with different scopes,e.g. world value funds and world growth funds. Portfolios of foreign funds are similarly formed. The strategy considered is anactive one, in which portfolio weights are updated every day. Realized returns of the simulated portfolio are calculated out-of-sample, as described in the main text. Standard deviation of both skewness and kurtosis across comparisons are shown inbrackets.
Maximizing Expected Return
Returns on Global Funds Returns on Port. Spec. Funds No. of Compar.

Return on MSCI Emerging Market Index: Global Fund Port. Spec. Funds
Minimization of Variance: "Best" SimulationBetween 0% and -1% -0.34% -0.23% 3.10 5,346Between -1% and -5% -1.52% -1.49% 1.44 10,763Between -5% and -10% -4.12% -4.47% -2.19 971Smaller than -10% -3.51% -3.54% -0.13 198
Longest SimulationBetween 0% and -1% -0.29% -0.22% 2.41 7,088Between -1% and -5% -1.49% -1.47% 1.05 13,839Between -5% and -10% -4.07% -4.33% -1.87 1,256Smaller than -10% -3.71% -3.81% -0.42 279
Maximization of Return: "Best" SimulationBetween 0% and -1% -0.34% -0.32% 0.40 5,346Between -1% and -5% -1.52% -1.53% -0.29 10,763Between -5% and -10% -4.12% -4.23% -0.65 971Smaller than -10% -3.51% -3.57% -0.23 198
Longest SimulationBetween 0% and -1% -0.29% -0.29% 0.26 7,088Between -1% and -5% -1.49% -1.50% -0.04 13,839Between -5% and -10% -4.07% -4.12% -0.34 1,256Smaller than -10% -3.71% -3.78% -0.31 279
Table 15. Average Returns Conditional on Returns on the MSCI Emerging Market Index
Average Return (per week) No. of Obs.
This table shows the average return for both global funds and our constructed portfolios of specialized funds conditionalon negative returns on the MSCI Emerging Market Index. Weekly data is considered. Results for the following simulations are shown: minimization of the variance of returns subject to restrictions on the expected returns (top panel) andmaximization of expected returns subject a restriction on the variance of returns (bottom panel). Both simulations yieldingthe highest realized average return ("best") and simulations with the longest time series for each main fund in each familyare considered. T-statistics for the test of equality of means are shown. A positive t-statistic means that the return on theconstructed portfolio is larger than that on the global fund. The number of observations is also shown.
ttest: Diff > 0

Return on Portfolios of Specialized Funds: Global Fund Port. Spec. Funds
Minimization of Variance: "Best" SimulationBetween 0% and -1% -0.52% -0.47% 4.63 6,872Between -1% and -5% -2.22% -2.17% 2.46 9,363Between -5% and -10% -6.11% -6.33% -2.18 638Smaller than -10% -11.98% -12.81% -1.68 112
Longest SimulationBetween 0% and -1% -0.49% -0.47% 3.03 9,091Between -1% and -5% -2.22% -2.19% 1.96 12,071Between -5% and -10% -6.28% -6.37% -1.05 867Smaller than -10% -11.73% -12.71% -2.43 156
Maximization of Return: "Best" SimulationBetween 0% and -1% -0.46% -0.47% -0.66 6,863Between -1% and -5% -2.21% -2.23% -1.85 9,684Between -5% and -10% -6.30% -6.37% -1.08 813Smaller than -10% -12.77% -13.31% -1.23 123
Longest SimulationBetween 0% and -1% -0.46% -0.47% -0.96 8,986Between -1% and -5% -2.21% -2.23% -1.47 12,356Between -5% and -10% -6.41% -6.46% -0.84 1,083Smaller than -10% -12.96% -13.27% -0.84 160
This table shows the average return for both global funds and our constructed portfolios of specialized funds conditional onnegative returns on the constructed portfolio itself. Weekly data is considered. Results for the following simulations areshown: minimization of the variance of returns subject to restrictions on the expected returns (top panel) and maximizationof expected returns subject a restiction on the variance of returns (bottom panel). Both simulations yielding the highestrealized average return ("best") and simulations with the longest time series for each main fund in each family areconsidered. T-statistics for the test of equality of means are shown. A positive t-statistic means that the return on theconstructed portfolio is larger than that on the global fund. The number of observations is also shown.
Table 16. Average Returns Conditional on Constructed Portfolio Returns
No. of Obs.
Average Return (per week) ttest: Diff > 0
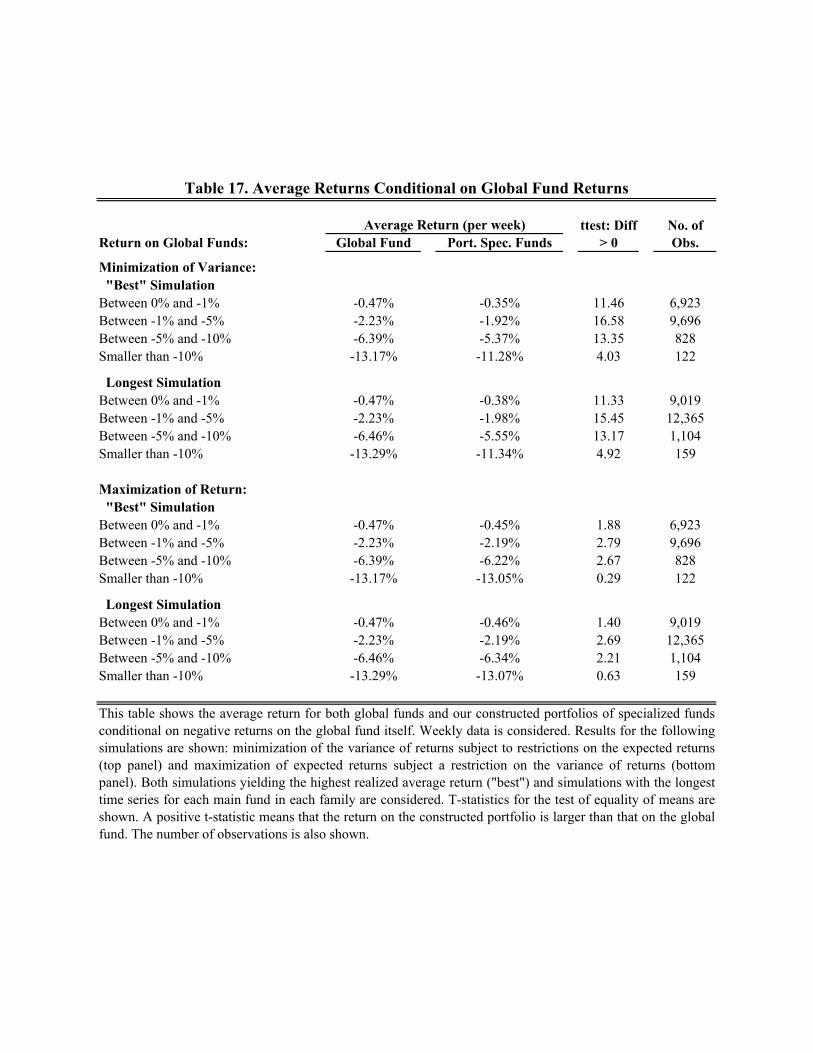
Return on Global Funds: Global Fund Port. Spec. Funds
Minimization of Variance: "Best" SimulationBetween 0% and -1% -0.47% -0.35% 11.46 6,923Between -1% and -5% -2.23% -1.92% 16.58 9,696Between -5% and -10% -6.39% -5.37% 13.35 828Smaller than -10% -13.17% -11.28% 4.03 122
Longest SimulationBetween 0% and -1% -0.47% -0.38% 11.33 9,019Between -1% and -5% -2.23% -1.98% 15.45 12,365Between -5% and -10% -6.46% -5.55% 13.17 1,104Smaller than -10% -13.29% -11.34% 4.92 159
Maximization of Return: "Best" SimulationBetween 0% and -1% -0.47% -0.45% 1.88 6,923Between -1% and -5% -2.23% -2.19% 2.79 9,696Between -5% and -10% -6.39% -6.22% 2.67 828Smaller than -10% -13.17% -13.05% 0.29 122
Longest SimulationBetween 0% and -1% -0.47% -0.46% 1.40 9,019Between -1% and -5% -2.23% -2.19% 2.69 12,365Between -5% and -10% -6.46% -6.34% 2.21 1,104Smaller than -10% -13.29% -13.07% 0.63 159
Table 17. Average Returns Conditional on Global Fund Returns
Average Return (per week) No. of Obs.
This table shows the average return for both global funds and our constructed portfolios of specialized fundsconditional on negative returns on the global fund itself. Weekly data is considered. Results for the followingsimulations are shown: minimization of the variance of returns subject to restrictions on the expected returns(top panel) and maximization of expected returns subject a restriction on the variance of returns (bottompanel). Both simulations yielding the highest realized average return ("best") and simulations with the longesttime series for each main fund in each family are considered. T-statistics for the test of equality of means areshown. A positive t-statistic means that the return on the constructed portfolio is larger than that on the globalfund. The number of observations is also shown.
ttest: Diff > 0

No. of Funds
Assets under Management
Assets under Management Ex-U.S. Assets
Appendix Figure 1. Total Number of Funds and Total Assets under Management by Fund Type
This figure shows the total number of mutual funds in our holdings database and their total assets under management byfund type from 1991 to 2005. World funds are allowed to invest anywhere in the world, foreign funds are also allowed toinvest in all countries except the U.S., emerging market funds can invest in emerging countries, regional funds invest inspecific regions, and country funds, in specific countries. For world funds, the value of assets under management for onlynon-U.S. assets is also shown (data available after 1997 only). Data on assets under management are in US$ billions. Thedata source is Morningstar International Equity Mutual Funds.
World Funds
0
50
100
150
200
250
300
350
400
450
1991
1992
1993
1994
1995
1996
1997
1998
1999
2000
2001
2002
2003
2004
2005
No.
of F
unds
0
100
200
300
400
500
600
US$
Bill
ions
Foreign Funds
050
100150200250300350400450
1991
1992
1993
1994
1995
1996
1997
1998
1999
2000
2001
2002
2003
2004
2005
No.
of F
unds
0
100
200
300
400
500
600
US$
Bill
ions
Emerging Market Funds
0
50
100
150
200
250
300
350
400
450
1991
1992
1993
1994
1995
1996
1997
1998
1999
2000
2001
2002
2003
2004
2005
No.
of F
unds
0
100
200
300
400
500
600U
S$ B
illio
nsRegional Funds
0
50
100150
200
250
300350
400
450
1991
1992
1993
1994
1995
1996
1997
1998
1999
2000
2001
2002
2003
2004
2005
No.
of F
unds
0
100
200
300
400
500
600
US$
Bill
ions
Country Funds
0
50
100
150
200
250
300
350
400
450
1991
1992
1993
1994
1995
1996
1997
1998
1999
2000
2001
2002
2003
2004
2005
No.
of F
unds
0
100
200
300
400
500
600
US$
Bill
ions

Hol
ding
s in
Em
ergi
ng C
ount
ries
Onl
ySt
ocks
Com
mon
to W
orld
and
Spe
cial
ized
Fun
dsSt
ocks
Com
mon
to F
orei
gn a
nd S
peci
aliz
ed F
unds
This
figur
esh
ows
the
evol
utio
nof
oure
ntro
pym
easu
res
from
1997
to20
05.T
wo
diff
eren
tmea
sure
sba
sed
ondi
ffer
entp
airs
ofm
utua
lfun
dty
pes
are
cons
ider
ed:s
tock
sco
mm
onto
both
wor
ldan
dsp
ecia
lized
fund
s(le
ftpa
nels
)an
dst
ocks
com
mon
tobo
thfo
reig
nan
dsp
ecia
lized
fund
s(r
ight
pane
ls).
Inth
eto
ppa
nel,
hold
ings
inas
sets
from
allc
ount
ries
exce
ptth
eU
.S.a
reco
nsid
ered
,whe
reas
inth
ebo
ttom
pane
l,on
lyas
set
hold
ings
inem
ergi
ngco
untri
esar
ean
alyz
ed.T
heth
ick
line
repr
esen
tsth
em
edia
nva
lue
acro
ssfa
mili
esin
agi
ven
year
.The
figur
eal
sosh
ows+
/-on
est
anda
rdde
viat
ion
from
this
med
ian
(dot
ted
grey
lines
).Sp
ecia
lized
fund
s inc
lude
: em
ergi
ng m
arke
t, La
tin A
mer
ica,
Asi
a, E
urop
e, a
nd c
ount
ry fu
nds.
App
endi
x Fi
gure
2. E
volu
tion
of E
ntro
py M
easu
res
Tot
al H
oldi
ngs
Stoc
ks C
omm
on to
Wor
ld a
nd S
peci
aliz
ed F
unds
Stoc
ks C
omm
on to
For
eign
and
Spe
cial
ized
Fun
ds
0.00
0.10
0.20
0.30
0.40
0.50
0.60
0.70
0.80
0.90
1.00
1997
1998
1999
2000
2001
2002
2003
2004
2005
0.00
0.10
0.20
0.30
0.40
0.50
0.60
0.70
0.80
0.90
1.00
1997
1998
1999
2000
2001
2002
2003
2004
2005
0.00
0.10
0.20
0.30
0.40
0.50
0.60
0.70
0.80
0.90
1.00
1997
1998
1999
2000
2001
2002
2003
2004
2005
0.00
0.10
0.20
0.30
0.40
0.50
0.60
0.70
0.80
0.90
1.00
1997
1998
1999
2000
2001
2002
2003
2004
2005
0.00
0.10
0.20
0.30
0.40
0.50
0.60
0.70
0.80
0.90
1.00
1997
1998
1999
2000
2001
2002
2003
2004
2005
0.00
0.10
0.20
0.30
0.40
0.50
0.60
0.70
0.80
0.90
1.00
1997
1998
1999
2000
2001
2002
2003
2004
2005
0.00
0.10
0.20
0.30
0.40
0.50
0.60
0.70
0.80
0.90
1.00
1997
1998
1999
2000
2001
2002
2003
2004
2005
0.00
0.10
0.20
0.30
0.40
0.50
0.60
0.70
0.80
0.90
1.00
1997
1998
1999
2000
2001
2002
2003
2004
2005

Family No. Funds Beginning End
1 AIM Family of Funds 17 Apr-92 Jul-052 Alliance Bernstein 10 Dec-99 Jun-063 Allianz Funds 4 Dec-04 Jul-054 American Funds Group 7 Mar-02 Jun-065 Columbia Funds 8 Oct-00 Jun-066 Credit Suisse 8 Dec-01 Jun-067 DFA Investment Dimensions Group 9 Mar-93 Jul-058 Dreyfus Founders 11 Jul-96 Jun-069 Eaton Vance Group 7 Sep-99 Jul-0510 Evergreen Funds 5 Sep-94 Jun-0611 Excelsior Funds 4 Sep-93 Jul-0512 Fidelity Advisors Funds 14 Dec-00 Jun-0613 Fidelity Group 18 Sep-89 Jul-0514 GAM Funds 7 Jan-90 Jul-0515 Gartmore 5 Jul-04 Jun-0616 GMO LLC 17 Jan-99 Jul-0517 Goldman Sachs Asset Management Group 11 Oct-98 Jul-0518 Hartford Mutual Funds 10 May-01 Jun-0619 ING Funds Trust 12 Nov-94 Jul-0520 Ivy Mackenzie Management 9 May-99 Jul-0521 J.P. Morgan Funds 10 Jul-02 Jun-0622 Janus 12 Oct-98 Jun-0623 Merrill Lynch Group 15 Nov-94 Jul-0524 MFS Family of Funds 11 Jun-96 Jun-0625 Morgan Stanley Funds 26 Oct-94 Jul-0526 Oppenheimer Funds 9 Sep-04 Jun-0627 Putnam Funds 6 Nov-91 Jul-0528 RiverSource (former AXP) 9 Jul-90 Jul-0529 Scudder Funds 18 Jun-98 Jul-0530 Seligman Group 4 Jun-03 Jun-0631 Smith Barney Group 6 Mar-98 Jun-0632 T. Rowe Price Funds 14 Jun-92 Jul-0533 Templeton Group 20 Nov-92 Jul-0534 UBS Funds 6 Mar-01 Jun-0635 Vanguard Group 11 Jul-00 Jun-0636 Wells Fargo Advantage 5 Oct-97 Jul-05
This table describes mutual fund price data by fund families. It shows the number of funds in each familyanalyzed. It also shows the beginning and the end of our sample. The data source is Bloomberg.
Sample
Appendix Table 1. Price Data on Mutual Funds

Not
Bei
ng H
eld
Bei
ng H
eld
Not
Bei
ng H
eld
Bei
ng H
eld
Spec
ializ
ed F
unds
Spec
ializ
ed F
unds
Prob
abili
ty o
f:Pr
obab
ility
of:
Bei
ngB
eing
Hel
dH
eld
Tota
l10
0%To
tal
100%
[181
,292
][3
82,5
91]
Not
Bei
ng H
eld
Bei
ng H
eld
Not
Bei
ng H
eld
Bei
ng H
eld
Spec
ializ
ed F
unds
Spec
ializ
ed F
unds
Prob
abili
ty o
f:Pr
obab
ility
of:
Bei
ngB
eing
Hel
dH
eld
Tota
l10
0%To
tal
100%
[45,
617]
[89,
260]
Wor
ld F
unds
Fore
ign
Fund
s
Tot
al H
oldi
ngs
Hol
ding
s in
Em
ergi
ng C
ount
ries
Onl
y
33%
67%
26%
11%
15%
0%0%
12%
10%
52%
12%
62%
63%
37%
2%34%
28%
49%
23%
Tota
lPr
obab
ility
of:
Not
Bei
ng
Hel
d
No
Spec
ializ
ed F
und
Not
Bei
ng
Hel
d
No
Spec
ializ
ed F
und
Tota
lPr
obab
ility
of:
23%
15%
26%
Not
Bei
ng
Hel
d
No
Spec
ializ
ed F
und
1%1%9%
83%
Prob
abili
ty o
f:Pr
obab
ility
of:
Tota
lTo
tal
20%
80%
0%6%
6%0%
Not
Bei
ng
Hel
d
No
Spec
ializ
ed F
und
3%92%
1%2%
8%8%
This
tabl
esh
ows
freq
uenc
yta
bles
form
utua
lfun
dho
ldin
gsfr
om19
97to
2005
.Itr
epor
tsth
epr
obab
ility
ofbe
ing
held
(orn
ot)b
yce
rtain
type
sof
mut
ualf
unds
,giv
enth
ata
mut
ualf
und
fam
ilyha
sbo
thfu
ndty
pes.
The
top
pane
lcon
side
rsas
seth
oldi
ngs
inal
lcou
ntrie
sex
cept
the
U.S
.,w
here
asth
ebo
ttom
pane
lcon
side
rsas
seth
oldi
ngs
inem
ergi
ngco
untri
eson
ly.E
ach
obse
rvat
ion
isa
fam
ily-y
ear-
stoc
kob
serv
atio
n.Th
eto
taln
umbe
rofo
bser
vatio
nsis
repo
rted
inbr
acke
tsin
the
"Tot
al"
colu
mn
ofea
chta
ble.
The
cell
perc
enta
geis
repo
rted.
Ifin
agi
ven
fam
ily-y
ear
obse
rvat
ion,
agl
obal
fund
hold
san
asse
tin
aco
untry
notc
over
edby
the
spec
ializ
edfu
nds
with
inth
atfa
mily
inth
atye
ar,t
hen
this
obse
rvat
ion
isco
unte
din
the
"No
Spec
ializ
ed F
und"
line
.
App
endi
x T
able
2. P
roba
bilit
ies o
f Bei
ng H
eld
by a
Mut
ual F
und
Wor
ld F
unds
Fore
ign
Fund
s
15%
85%
91%
12%
79%
0%

(1) (2) (3) (4) (5) (6)
Independent Variables:
No. of Managers -0.577*** -0.460** -0.578***[0.202] [0.193] [0.161]
1 29.303***[0.592]
2 27.585***[0.660]
3 25.545***[0.992]
4 24.685***[2.274]
5 24.370***[1.112]
6 22.751***[2.323]
7 or More 27.794***[1.366]
Manager Tenure -0.02 -0.04 0.15 0.15 0.00[0.122] [0.119] [0.114] [0.114] [0.122]
Fund Age -0.186*** -0.141*** -0.141** -0.139** -0.108**[0.063] [0.054] [0.056] [0.056] [0.048]
Fund Expenses -0.052*** -0.07 -0.04[0.009] [0.043] [0.050]
Fund Size 0.00 0.00[0.000] [0.000]
Year Dummies No No Yes No No YesFund Type Dummies No No Yes No No Yes
No. of Observations 6,405 6,156 6,156 5,719 5,719 5,713R-squared 0.02 0.01 0.13 0.02 0.02 0.16
This table reports the regressions of the percentage of net assets in the top 10 holdings on the number of managers, manager's tenure, age offund in years, fund expenses, and fund size. Depending on the specification, year and/or fund type dummies are included in these regressions.The sample period is from 1997 to 2005. Fund expenses and fund size are in US$ millions. R-squared and total number of observations arereported in the bottom of the table. Standard errors are clustered at the family level. Standard deviation is shown in brackets. ***, **, and *indicate significance at one, five, or ten percent, respectively.
Appendix Table 3. Percentage of Net Assets in Top 10 Holdings: Importance of No. of Managers and Fees

(1) (2) (3) (4) (5) (6) (7)
R-squared 0.06 0.11 0.39 0.16 0.42 0.44 0.48
Independent Variables:
Year Dummies Yes No No Yes Yes No YesFund Type Dummies No Yes No Yes No Yes YesFamily Dummies No No Yes No Yes Yes Yes
No. of Observations 8,522 8,522 8,522 8,522 8,522 8,522 8,522
(1) (2) (3) (4) (5) (6) (7)
Independent Variables:
No. of Managers -0.18 -0.436** -0.18[0.184] [0.196] [0.183]
Manager Tenure -0.13 0.09 0.11 -0.01 -0.10 -0.10 -0.12[0.083] [0.112] [0.111] [0.116] [0.081] [0.081] [0.084]
Fund Age -0.125*** -0.164*** -0.170*** -0.117** -0.128*** -0.128*** -0.126***[0.048] [0.060] [0.060] [0.052] [0.048] [0.048] [0.048]
Family Expenses -0.007** 0.01 0.00 -0.005** -0.01 -0.01[0.003] [0.010] [0.011] [0.002] [0.009] [0.009]
Family Size 0.00 0.00 0.00 0.00[0.000] [0.000] [0.000] [0.000]
Year Dummies Yes No No Yes Yes Yes YesFund Type Dummies Yes No No Yes Yes Yes YesFamily Dummies Yes No No No Yes Yes Yes
No. of Observations 6,156 6,163 6,163 6,156 6,163 6,163 6,156R-squared 0.47 0.01 0.01 0.14 0.47 0.47 0.47
Appendix Table 4. Percentage of Net Assets in Top 10 Holdings
The top table shows the R-squared of the regressions of the percentage of net assets in the top 10 holdings on year dummies, fund typedummies, and family dummies. Seven different specifications are shown. See the main text for a detailed description. The sample period isfrom 1991 to 2005. The bottom table reports the regressions of the percentage of net assets in the top 10 holdings on the number ofmanagers, manager's tenure, age of fund in years, mutual fund family expenses, and mutual fund family size. Depending on thespecification, year, fund type, and/or family dummies are included in these regressions. The sample period is from 1997 to 2005. Familyexpenses and family size are in US$ millions. R-squared and total number of observations are reported in the bottom of the table. Standarderrors are clustered at the family level. Standard deviation is shown in brackets. ***, **, and * indicate significance at one, five, or tenpercent, respectively.
Importance of Year, Fund Type, and Family Effects
Importance of Family Expenses and Family Size

FamilyGlobal Fund
Port. Spec. Funds
Global Fund
Port. Spec. Funds
1 Allianz Funds 0.95% -3.05% -3.91% 0.66% 0.65% 22 Alliance Bernstein 10.89% 14.76% 3.59% 0.90% 0.86% 93 American Funds Group 10.57% 13.93% 3.33% 0.87% 0.74% 44 AIM Family of Funds 8.37% 20.92% 12.08% 0.95% 0.82% 105 Columbia Funds 17.52% 21.06% 3.32% 0.85% 0.77% 36 Credit Suisse 8.46% 12.15% 3.63% 0.95% 0.85% 27 DFA Investment Dimensions Group 3.15% 1.22% -1.70% 0.91% 0.84% 48 Dreyfus Founders 4.75% 11.96% 7.33% 0.95% 0.83% 69 Evergreen Funds 5.76% 5.56% -0.21% 1.07% 1.08% 210 Eaton Vance Group -0.75% 15.22% 16.91% 1.08% 0.79% 211 Excelsior Funds 3.95% 7.15% 3.13% 0.89% 0.87% 212 Fidelity Group 5.97% 9.42% 3.59% 1.02% 0.91% 713 Fidelity Advisors Funds 7.76% 11.86% 4.09% 0.87% 0.77% 614 GAM Funds -1.42% 3.04% 3.67% 1.04% 1.43% 215 Gartmore 22.30% 18.99% -2.62% 0.81% 0.78% 316 GMO LLC 6.65% 8.05% 1.36% 0.76% 0.77% 817 Goldman Sachs Asset Management Group 1.63% 6.80% 5.42% 1.04% 0.94% 318 Hartford Mutual Funds 14.82% 18.72% 3.50% 0.91% 0.86% 219 ING Funds Trust -4.77% 0.10% 5.71% 1.11% 1.01% 620 Ivy Mackenzie Management -0.56% 4.80% 5.73% 0.94% 0.81% 321 Janus -7.01% 0.08% 7.60% 0.67% 0.70% 522 J.P. Morgan Funds 22.11% 24.06% 1.68% 0.90% 0.87% 423 MFS Family of Funds 20.70% 39.09% 15.93% 0.88% 0.81% 324 Merrill Lynch Group 10.35% 13.01% 2.64% 0.99% 0.93% 925 Morgan Stanley Funds 1.87% 6.83% 5.28% 0.98% 0.84% 926 Oppenheimer Funds 10.45% 9.72% -0.69% 0.82% 0.84% 327 Putnam Funds 4.86% 5.53% 0.74% 1.08% 1.05% 528 RiverSource (former AXP) 13.45% 22.06% 7.87% 0.84% 0.73% 229 Scudder Funds 6.31% 13.19% 6.75% 1.00% 0.90% 630 Smith Barney Group 2.03% 2.35% 0.30% 0.94% 0.94% 131 Seligman Group 14.45% 15.89% 1.26% 0.82% 0.82% 232 Templeton Group 1.13% 2.46% 1.55% 0.83% 0.73% 833 T. Rowe Price Funds 19.58% 32.17% 10.71% 0.85% 0.82% 634 UBS Funds 4.41% 7.30% 2.88% 0.89% 0.84% 135 Vanguard Group 7.77% 10.39% 2.54% 0.96% 0.92% 436 Wells Fargo Advantage 5.22% 11.69% 6.65% 0.98% 0.78% 2
Total 6.92% 11.49% 4.58% 0.92% 0.85% 156
This table shows the results of the following simulation: minimization of the variance of returns subject to restrictions on the expected returns. The results areshown per family. The simulation yielding the highest realized average return ("best") for each main fund in each family is considered. The main funds are worldfunds, foreign funds, portfolios of world funds, and portfolios of foreign funds. Portfolios of world funds are composed by several world funds within the samefamily but with different scopes, e.g. world value funds and world growth funds. Portfolios of foreign funds are similarly formed. The strategy considered is anactive one, in which portfolio weights are updated every day. Realized returns of the simulated portfolio are calculated out-of-sample, as described in the maintext.
Appendix Table 5A. Simulations: "Best" Result for Each Fund
Minimizing the Variance
Differences in Accumulated Daily
Returns
Standard Deviation of Daily Returns
No. of Compar.
Average Return (p.y.)

FamilyGlobal Fund
Port. Spec. Funds
Global Fund
Port. Spec. Funds
No. of Compar.
1 Allianz Funds 0.95% 0.95% 0.00% 0.66% 0.66% 22 Alliance Bernstein 10.89% 10.90% -0.01% 0.90% 0.90% 93 American Funds Group 10.57% 10.78% 0.18% 0.87% 0.87% 44 AIM Family of Funds 8.37% 12.94% 4.47% 0.95% 0.95% 105 Columbia Funds 17.52% 16.06% -1.21% 0.85% 0.84% 36 Credit Suisse 8.46% 8.39% -0.06% 0.95% 0.95% 27 DFA Investment Dimensions Group 3.15% 3.85% 0.73% 0.91% 0.88% 48 Dreyfus Founders 4.75% 6.27% 1.56% 0.95% 0.93% 69 Evergreen Funds 5.76% 5.76% 0.00% 1.07% 1.07% 210 Eaton Vance Group -0.75% 0.69% 1.50% 1.08% 1.06% 211 Excelsior Funds 3.95% 3.95% 0.01% 0.89% 0.89% 212 Fidelity Group 5.97% 6.10% 0.11% 1.02% 1.03% 713 Fidelity Advisors Funds 7.76% 7.45% -0.27% 0.87% 0.87% 614 GAM Funds -1.42% -2.18% -0.72% 1.04% 1.03% 215 Gartmore 22.30% 22.30% 0.00% 0.81% 0.81% 316 GMO LLC 6.65% 7.50% 0.74% 0.76% 0.79% 817 Goldman Sachs Asset Management Group 1.63% 1.55% -0.08% 1.04% 1.04% 318 Hartford Mutual Funds 14.82% 14.82% 0.00% 0.91% 0.91% 219 ING Funds Trust -4.77% 4.83% 10.82% 1.11% 1.08% 620 Ivy Mackenzie Management -0.56% 3.70% 4.57% 0.94% 0.84% 321 Janus -7.01% 11.09% 19.43% 0.67% 0.74% 522 J.P. Morgan Funds 22.11% 21.52% -0.48% 0.90% 0.90% 423 MFS Family of Funds 20.70% 20.40% -0.25% 0.88% 0.88% 324 Merrill Lynch Group 10.35% 11.17% 0.68% 0.99% 1.03% 925 Morgan Stanley Funds 1.87% 2.19% 0.31% 0.98% 0.98% 926 Oppenheimer Funds 10.45% 9.70% -0.68% 0.82% 0.82% 327 Putnam Funds 4.86% 4.96% 0.11% 1.08% 1.08% 528 RiverSource (former AXP) 13.45% 13.45% 0.00% 0.84% 0.84% 229 Scudder Funds 6.31% 7.83% 1.45% 1.00% 1.01% 630 Smith Barney Group 2.03% 2.41% 0.37% 0.94% 0.94% 131 Seligman Group 14.45% 14.44% 0.00% 0.82% 0.81% 232 Templeton Group 1.13% 1.06% -0.08% 0.83% 0.83% 833 T. Rowe Price Funds 19.58% 19.77% 0.16% 0.85% 0.85% 634 UBS Funds 4.41% 4.41% 0.00% 0.89% 0.89% 135 Vanguard Group 7.77% 7.50% -0.24% 0.96% 0.96% 436 Wells Fargo Advantage 5.22% 6.03% 0.87% 0.98% 0.95% 2
Total 6.92% 8.51% 1.61% 0.92% 0.92% 156
Appendix Table 5B. Simulations: "Best" Result for Each Fund
Maximizing Expected Return
Average Return (p.y.)
This table shows the results of the following simulation: maximization of expected returns subject a restriction on the variance of returns. The results are shownper family. The simulation yielding the highest realized average return ("best") for each main fund in each family is considered. The main funds are world funds,foreign funds, portfolios of world funds, and portfolios of foreign funds. Portfolios of world funds are composed by several world funds within the same familybut with different scopes, e.g. world value funds and world growth funds. Portfolios of foreign funds are similarly formed. The strategy considered is an activeone, in which portfolio weights are updated every day. Realized returns of the simulated portfolio are calculated out-of-sample, as described in the main text.
Differences in Accumulated Daily
Returns
Standard Deviation of Daily Returns

FamilyGlobal Fund
Port. Spec. Funds
Global Fund
Port. Spec. Funds
No. of Compar.
1 Allianz Funds 0.95% -3.05% -3.91% 0.66% 0.65% 22 Alliance Bernstein 9.49% 13.26% 3.54% 0.90% 0.87% 93 American Funds Group 10.57% 13.93% 3.33% 0.87% 0.74% 44 AIM Family of Funds 9.43% 20.69% 10.86% 0.99% 0.85% 105 Columbia Funds 14.11% 17.02% 3.03% 0.92% 0.77% 36 Credit Suisse 8.46% 12.15% 3.63% 0.95% 0.85% 27 DFA Investment Dimensions Group 3.15% 1.22% -1.70% 0.91% 0.84% 48 Dreyfus Founders 4.71% 7.83% 3.33% 1.02% 0.92% 69 Evergreen Funds 5.76% 5.56% -0.21% 1.07% 1.08% 210 Eaton Vance Group -4.98% 8.94% 15.46% 1.13% 0.87% 211 Excelsior Funds 1.58% 1.67% 0.10% 0.99% 0.99% 212 Fidelity Group 6.89% 8.09% 1.36% 0.95% 0.86% 713 Fidelity Advisors Funds 7.40% 10.14% 2.85% 0.93% 0.82% 614 GAM Funds 41.57% 45.05% 1.43% 8.19% 8.66% 215 Gartmore 22.30% 18.99% -2.62% 0.81% 0.78% 316 GMO LLC 6.65% 8.05% 1.36% 0.76% 0.77% 817 Goldman Sachs Asset Management Group 1.63% 6.80% 5.42% 1.04% 0.94% 318 Hartford Mutual Funds 6.10% 8.06% 2.17% 1.04% 0.91% 219 ING Funds Trust 0.66% 4.26% 4.09% 1.05% 0.94% 620 Ivy Mackenzie Management 0.89% 5.81% 5.25% 0.99% 0.86% 321 Janus 4.97% 7.82% 2.75% 0.88% 0.87% 522 J.P. Morgan Funds 22.11% 24.06% 1.68% 0.90% 0.87% 423 MFS Family of Funds 12.47% 16.07% 3.19% 0.80% 0.82% 324 Merrill Lynch Group 5.09% 6.49% 1.57% 1.03% 0.96% 925 Morgan Stanley Funds 2.58% 5.83% 3.49% 0.98% 0.88% 926 Oppenheimer Funds 12.61% 11.27% -1.22% 0.79% 0.81% 327 Putnam Funds 4.86% 5.53% 0.74% 1.08% 1.05% 528 RiverSource (former AXP) 3.46% 3.15% -0.28% 1.14% 1.13% 229 Scudder Funds 3.78% 8.29% 4.55% 1.01% 0.94% 630 Smith Barney Group 2.03% 2.35% 0.30% 0.94% 0.94% 131 Seligman Group 14.45% 15.89% 1.26% 0.82% 0.82% 232 Templeton Group 4.07% 4.14% 0.21% 0.78% 0.71% 833 T. Rowe Price Funds 5.04% 10.10% 5.07% 0.98% 0.92% 634 UBS Funds 4.41% 7.30% 2.88% 0.89% 0.84% 135 Vanguard Group 5.40% 7.05% 1.68% 0.99% 0.95% 436 Wells Fargo Advantage 6.44% 8.39% 2.18% 1.01% 0.88% 2
Total 6.84% 9.65% 2.89% 1.04% 0.97% 156
Appendix Table 6A. Simulations: Longest Available Sample
Minimizing the Variance
Average Return (p.y.)
This table shows the results of the following simulation: minimization of the variance of returns subject to restrictions on the expected returns. The results areshown per family. The simulation with the longest time series for each main fund in each family is considered. The main funds are world funds, foreign funds,portfolios of world funds, and portfolios of foreign funds. Portfolios of world funds are composed by several world funds within the same family but with differentscopes, e.g. world value funds and world growth funds. Portfolios of foreign funds are similarly formed. The strategy considered is an active one, in whichportfolio weights are updated every day. Realized returns of the simulated portfolio are calculated out-of-sample, as described in the main text.
Differences in Accumulated Daily
Returns
Standard Deviation of Daily Returns

FamilyGlobal Fund
Port. Spec. Funds
Global Fund
Port. Spec. Funds
No. of Compar.
1 Allianz Funds 0.95% 0.95% 0.00% 0.66% 0.66% 22 Alliance Bernstein 9.49% 9.48% -0.01% 0.90% 0.91% 93 American Funds Group 10.57% 10.78% 0.18% 0.87% 0.87% 44 AIM Family of Funds 9.43% 15.72% 6.07% 0.99% 0.98% 105 Columbia Funds 14.11% 12.69% -1.21% 0.92% 0.91% 36 Credit Suisse 8.46% 8.39% -0.06% 0.95% 0.95% 27 DFA Investment Dimensions Group 3.15% 3.85% 0.73% 0.91% 0.88% 48 Dreyfus Founders 4.71% 4.84% 0.13% 1.02% 1.02% 69 Evergreen Funds 5.76% 5.76% 0.00% 1.07% 1.07% 210 Eaton Vance Group -4.98% -4.41% 0.59% 1.13% 1.13% 211 Excelsior Funds 1.58% 1.54% -0.05% 0.99% 0.99% 212 Fidelity Group 6.89% 6.85% -0.04% 0.95% 0.95% 713 Fidelity Advisors Funds 7.40% 6.81% -0.54% 0.93% 0.93% 614 GAM Funds 41.57% 40.49% -0.72% 8.19% 8.17% 215 Gartmore 22.30% 22.30% 0.00% 0.81% 0.81% 316 GMO LLC 6.65% 7.50% 0.74% 0.76% 0.79% 817 Goldman Sachs Asset Management Group 1.63% 1.55% -0.08% 1.04% 1.04% 318 Hartford Mutual Funds 6.10% 6.10% 0.00% 1.04% 1.04% 219 ING Funds Trust 0.66% 5.36% 5.32% 1.05% 1.03% 620 Ivy Mackenzie Management 0.89% 5.14% 4.53% 0.99% 0.88% 321 Janus 4.97% 4.94% -0.05% 0.88% 0.88% 522 J.P. Morgan Funds 22.11% 21.52% -0.48% 0.90% 0.90% 423 MFS Family of Funds 12.47% 12.18% -0.26% 0.80% 0.80% 324 Merrill Lynch Group 5.09% 6.11% 0.98% 1.03% 1.04% 925 Morgan Stanley Funds 2.58% 3.33% 0.70% 0.98% 1.00% 926 Oppenheimer Funds 12.61% 11.85% -0.67% 0.79% 0.80% 327 Putnam Funds 4.86% 4.96% 0.11% 1.08% 1.08% 528 RiverSource (former AXP) 3.46% 3.46% 0.00% 1.14% 1.14% 229 Scudder Funds 3.78% 4.88% 1.03% 1.01% 1.02% 630 Smith Barney Group 2.03% 2.41% 0.37% 0.94% 0.94% 131 Seligman Group 14.45% 14.44% 0.00% 0.82% 0.81% 232 Templeton Group 4.07% 4.08% 0.00% 0.78% 0.78% 833 T. Rowe Price Funds 5.04% 5.20% 0.15% 0.98% 0.98% 634 UBS Funds 4.41% 4.41% 0.00% 0.89% 0.89% 135 Vanguard Group 5.40% 5.13% -0.24% 0.99% 0.99% 436 Wells Fargo Advantage 6.44% 6.11% -0.27% 1.01% 1.00% 2
Total 6.84% 7.63% 0.80% 1.04% 1.03% 156
Average Return (p.y.)
This table shows the results of the following simulation: maximization of expected returns subject a restriction on the variance of returns. The results are shown perfamily. The simulation with the longest time series for each main fund in each family is considered. The main funds are world funds, foreign funds, portfolios ofworld funds, and portfolios of foreign funds. Portfolios of world funds are composed by several world funds within the same family but with different scopes, e.g.world value funds and world growth funds. Portfolios of foreign funds are similarly formed. The strategy considered is an active one, in which portfolio weightsare updated every day. Realized returns of the simulated portfolio are calculated out-of-sample, as described in the main text.
Differences in Accumulated Daily
Returns
Standard Deviation of Daily Returns
Appendix Table 6B. Simulations: Longest Available Sample
Maximizing Expected Return

Type of Global FundGlobal Fund
Port. Spec. Funds
Global Fund
Port. Spec. Funds
No. of Compar.
World Stock 8.86% 14.08% 5.12% 0.88% 0.78% 53Foreign Stock 6.53% 10.37% 3.96% 0.96% 0.89% 70Portfolio of World Stock Funds 14.77% 20.74% 4.09% 0.71% 0.65% 3Portfolio of Foreign Stock Funds 12.19% 13.70% 1.37% 0.85% 0.78% 18
Total 8.25% 12.35% 4.06% 0.91% 0.83% 144
Type of Global FundGlobal Fund
Port. Spec. Funds
Global Fund
Port. Spec. Funds
No. of Compar.
World Stock 8.86% 9.81% 0.79% 0.88% 0.88% 53Foreign Stock 6.53% 7.40% 0.91% 0.96% 0.97% 70Portfolio of World Stock Funds 14.77% 21.87% 6.76% 0.71% 0.76% 3Portfolio of Foreign Stock Funds 12.19% 12.08% -0.30% 0.85% 0.86% 18
Total 8.25% 9.15% 0.84% 0.91% 0.92% 144
Standard Deviation of Daily Returns
Maximizing Expected Return (Rolling Windows: 240 Business Days)
Average Return (p.y.) Differences in Accumulated Daily Returns
Appendix Table 7A. Simulations: "Best" Result for Each Fund
Minimizing the Variance (Rolling Windows: 240 Business Days)
Average Return (p.y.)Standard Deviation of
Daily Returns
This table shows the results of the following simulations: minimization of the variance of returns subject to restrictions on theexpected returns (top panel) and maximization of expected returns subject a restriction on the variance of returns (bottom panel). Thesimulation yielding the highest realized average return ("best") for each main fund in each family is considered. The main funds areworld funds, foreign funds, portfolios of world funds, and portfolios of foreign funds. Portfolios of world funds are composed byseveral world funds within the same family but with different scopes, e.g. world value funds and world growth funds. Portfolios offoreign funds are similarly formed. The strategy considered is an active one, in which portfolio weights are updated every day.Realized returns of the simulated portfolio are calculated out-of-sample, as described in the main text. Simulations use informationbased on the previous 240 business days only at each point in time.
Differences in Accumulated Daily Returns

Type of Global FundGlobal Fund
Port. Spec. Funds
Global Fund
Port. Spec. Funds
No. of Compar.
World Stock 8.24% 10.82% 2.65% 0.90% 0.81% 59Foreign Stock 5.79% 8.44% 2.78% 0.97% 0.91% 71Portfolio of World Stock Funds 6.91% 17.38% 10.51% 1.04% 0.83% 3Portfolio of Foreign Stock Fund 11.92% 13.34% 1.25% 0.87% 0.80% 18
Total 7.48% 10.11% 2.70% 0.93% 0.86% 151
Type of Global FundGlobal Fund
Port. Spec. Funds
Global Fund
Port. Spec. Funds
No. of Compar.
World Stock 8.24% 8.45% 0.14% 0.90% 0.90% 59Foreign Stock 5.79% 6.06% 0.28% 0.97% 0.98% 71Portfolio of World Stock Funds 6.91% 15.83% 8.87% 1.04% 0.96% 3Portfolio of Foreign Stock Fund 11.92% 11.89% -0.29% 0.87% 0.88% 18
Total 7.48% 7.86% 0.33% 0.93% 0.93% 151
Average Return (p.y.)Standard Deviation of
Daily Returns
This table shows the results of the following simulations: minimization of the variance of returns subject to restrictions on theexpected returns (top panel) and maximization of expected returns subject a restriction on the variance of returns (bottom panel).The simulation with the longest time series for each main fund in each family is considered. The main funds are world funds,foreign funds, portfolios of world funds, and portfolios of foreign funds. Portfolios of world funds are composed by several worldfunds within the same family but with different scopes, e.g. world value funds and world growth funds. Portfolios of foreignfunds are similarly formed. The strategy considered is an active one, in which portfolio weights are updated every day. Realizedreturns of the simulated portfolio are calculated out-of-sample, as described in the main text. Simulations use information basedon the previous 240 business days only at each point in time.
Differences in Accumulated Daily
Returns
Appendix Table 7B. Simulations: Longest Available Sample
Minimizing the Variance (Rolling Windows: 240 Business Days)Standard Deviation of
Daily Returns
Maximizing Expected Return (Rolling Windows: 240 Business Days)
Average Return (p.y.) Differences in Accumulated Daily
Returns