understanding the program and - national association of
TRANSCRIPT

Understanding the program and why it matters to
counties

Medicaid is a federal program, administered by states (often with county assistance), that provides health insurance to low-income families and individuals

Counties have always played a pivotal role in caring for America’s low-income residents, often serving as a safety-net for those who are unable to afford medical care
Over the past 50 years, the Medicaid program has been crucial in helping counties fulfill this obligation
Many states mandate counties to provide some level of health care for low-income, uninsured, or underinsured residents

Counties often are not reimbursed for the health care provided to low-income individuals; the Urban Institute estimates that states and localities spent $20 billion on uncompensated care in 2013
In Harris County, Texas, for example, residents pay more than $500 million per year in property taxes to cover the cost of uncompensated care in the county’s public hospitals
$20 billion $500 million
Spent by states and localities on uncompensated care in 2013
Spent annually by Harris County, Texas taxpayers on uncompensated care
Source: Urban Institute
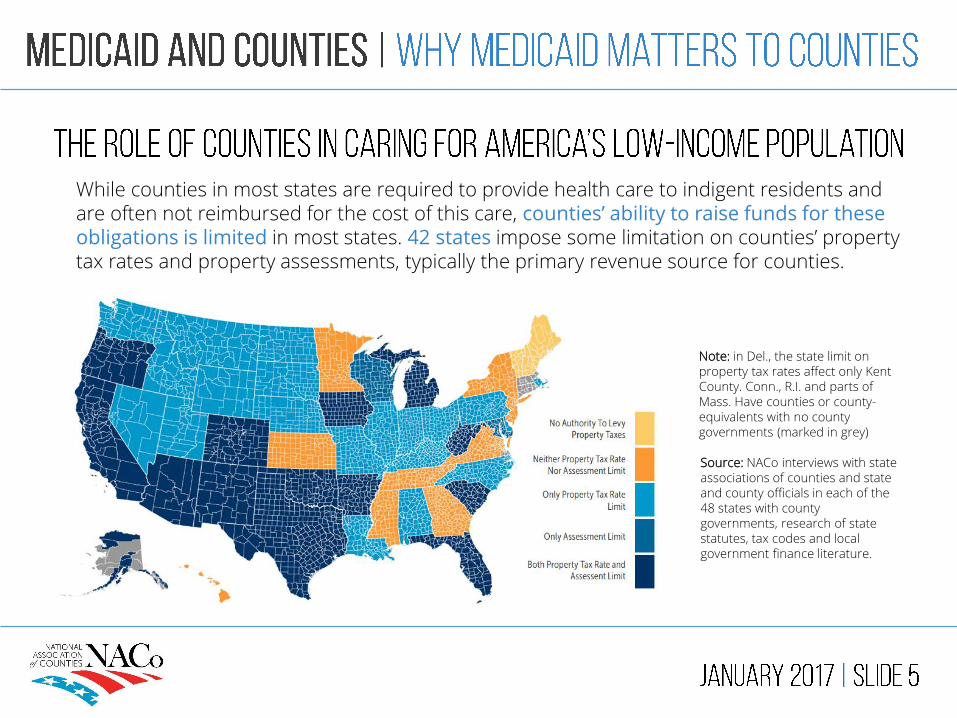
While counties in most states are required to provide health care to indigent residents and are often not reimbursed for the cost of this care, counties’ ability to raise funds for these obligations is limited in most states. 42 states impose some limitation on counties’ property tax rates and property assessments, typically the primary revenue source for counties.
Note: in Del., the state limit on property tax rates affect only Kent County. Conn., R.I. and parts of Mass. Have counties or county-equivalents with no county governments (marked in grey)
Source: NACo interviews with state associations of counties and state and county officials in each of the 48 states with county governments, research of state statutes, tax codes and local government finance literature.

$83 billion is invested by counties annually in community health and hospitals
$28 billion is contributed by local governments to non-federal share of Medicaid
10 million additional individuals enrolled in Medicaid during the Great Recession
21 percent increase in local governments’ Medicaid contributions during Recession
Despite limitations on our ability to raise funds through taxation, counties invest heavily in the health and well-being of local residents, and these investments increase during economic downturns

Creates increased access to health care services for low-income residents, which in turn improves residents’ health, productivity and quality of life
Provides patient revenue that helps communities retain doctors and other health professionals, especially in rural and underserved areas
Reduces the frequency of uncompensated care provided by local hospitals and health centers to low-income residents, lessening the strain on county budgets

Over 70 percent of America’s counties have populations of less than 50,000, and Medicaid covers 21 percent of rural residents, compared to only 16 percent of those who reside in urban areas
Rural health clinics receive enhanced Medicaid reimbursements, and Medicaid payments account for more than 14 percent of ruralhospitals’ gross revenues
Nearly one-third of rural physicians receive at least 25 percent of patient revenues through Medicaid reimbursements


Medicaid is a federal entitlement program, established in 1965, that provides health and long-term care insurance to low-income families and individuals
Medicaid is a federal-state-local partnership; states administer the program, often with assistance from counties, and the federal government has oversight
Medicaid is also jointly financed by federal, state and local governments, including counties in many states
Medicaid is the largest source of health coverage in the U.S., covering more than seventy million individuals, or one-fifth of the population

Government-sponsored programs designed to help cover individuals’ health care costs
Established by Congress in 1965 and paid for by taxpayers
Administered by states, with federal oversight
Administered solely by the federal government
Jointly financed by federal/state/local governments
Financed solely by the federal government
Serves low-income individuals and families, including the disabled and elderly
Serves seniors and disabled individuals
Has income requirements Does not have income requirements

The federal government sets broad guidelines for Medicaid, including minimum eligibility and benefit requirements
States have flexibility within these guidelines and can seekwaivers from the federal government to expand eligibility or available benefits
Some states subcontract Medicaid coverage to private insurers, while others pay health care providers directly
States also utilize different delivery systems: traditional fee-for-service systems reimburse providers for each service provided, while managed care systems involve set monthly payments

Traditionally, Medicaid has served three categories of low-income people:
Families, children and pregnant women
The elderly The disabled

Under the Affordable Care Act (2010), states were given the option to expand Medicaid coverage to low-income adults without children
+

Children, 48%
Children, 21%
Adults, 27%
Adults, 15%
Elderly, 9%
Elderly, 21%
Disabled, 15%
Disabled, 42%
Source: the Henry J. Kaiser Family Foundation Based on FY 2011 data, the last available year
24%
63%
Enrollees Expenditures In 2011, nearly two-thirds of Medicaid expenditures benefited disabled and elderly individuals, even though they made up less than one-fourth of the program’s enrollees

States must provide these benefits to Medicaid enrollees
Inpatient hospital services Family planning services
Outpatient hospital services Nurse midwife services
Nursing facility services Transportation to medical care
Home health services Laboratory and x-ray services
Physician services Rural health clinic services
Certified pediatric and family nurse practitionerservices
Freestanding birth center services (when licensed/recognized by state)
Federally qualified health center servicesEPSDT: early and periodic screening, diagnostic
and treatment services
Tobacco cessation counseling for pregnant women

States can choose to provide these benefits to Medicaid enrollees
Prescription drugs Dental services Hospice
Clinic services Dentures Case management
Physical therapy Prosthetics Tuberculosis services
Occupational therapy Eyeglasses Respiratory care services
Speech, hearing and language services
Chiropractic services Podiatry services
Optometry services Other practitioner services Private duty nursing services
Personal careInpatient psychiatric services for
individuals under age 21Services for individuals 65+ in an
institution for mental disease
Services in intermediate care facility for mental health
Other diagnostic, screening, preventive and rehabilitative services
Services related to sections 1915 and 1945 of Social Security Act

Federal share
57%
Non-federal share
43%
Based on FY 2012 data, the last available year
Source: the Henry J. Kaiser Family Foundation
Medicaid is jointly funded by federal, state and local governments, including counties in many states
The federal contribution rate for each state varies based on the Federal Medical Assistance Percentage (FMAP) rate
The maximum amount contributed by each state is 50%; poorer states contribute as little as 26%; in sum, the federal share of Medicaid in FY 2012 was 57%
States have various options for financing the non-federal share; counties may contribute up to 60% of the non-federal share in each state


State Funds
69%
Local Funds
16%
Health Care
Provider Funds
10.40%
Other Funds
4.60%
In FY 2012, counties financed the majority of $28 billion in local government contributions to the overall non-federal share of Medicaid
Roughly two-thirds of these contributions ($18.1b) flowed directly to states through Intergovernmental Transfers (IGTS)
Certified Public Expenditures (CPEs), in which a local government certifies its Medicaid expenditures to the state, and the state claims the federal Medicaid matching funds, accounted for the remainder of contributions ($9.7b)
Source: the Henry J. Kaiser Family Foundation
Based on FY 2012 data, the last available year

Counties contribute to Medicaid in 26 states. Of these, 18 mandate counties to contribute to the non-federal share of Medicaid costs and/or administrative, program, physical health and behavioral health costs
Mandated county contributions are the highest in New York, by far; counties in New York send nearly $7 billion per year – or $140 million per week – to the state for Medicaid costs
Source: NACo Research
No contribution Contribution, not state-mandated
State-mandated contributions
County data is unavailable if county is grey

961 883 750 1,943
county-supported hospitals
county-owned and supported long-term care facilities
county behavioral health authorities
county public health departments

Medicaid covers in-patient and out-patient hospital services
Medicaid beneficiaries are served through 961 county-supported hospitals throughout the country
Disproportionate Share Hospital (DSH) payments compensate hospitals, including most county hospitals, that care for a disproportionate number of Medicaid beneficiaries and uninsured patients. DSH payments are jointly funded by the federal government and states at the same rate as other Medicaid spending, and states have great flexibility in designing DSH programs. In FY 2015, the federal share of DSH payments was $12 billion

In 2011, the hospitals located in our nation’s 3,069 counties received $234 billion in total Medicaid revenue
Source: NACo analysis of American Hospital Directory County data is unavailable if county is grey
Visit NACo’s county explorer tool at explorer.naco.org to see your county’s Medicaid hospital revenue
Medicaid hospital revenue by county(2011)

Medicaid covers nursing home services for all eligible individuals who are 21 or older. In FY 2012, Medicaid accounted for 61 percent of overall national spending on long-term services and supports
Counties deliver long-term care services to residents through 883 county-owned and supported nursing homes, which represents 75 percent of all publicly owned nursing homes in the U.S.
Medicaid also covers home and community-based services for people who would otherwise need to be in a nursing home, through area aging agencies, nearly 30% of which are county-based

Medicaid is the largest source of funding for mental health services in the U.S. and is playing an increasingly large role in reimbursement of substance use disorder services
Counties deliver mental health services to residents through 750 county behavioral health authorities across the country
Medicaid also covers preventative services like immunizations for children and family planning services
1,943 county health departments throughout the U.S. provide a variety of Medicaid-eligible services to prevent the spread of disease and keep communities safe and healthy

Through a waiver attained by California to test new programs that could improve Medicaid delivery, the County of Los Angeles participates in the “delivery system reform incentive program” (DSRIP), a pay-for performance model that provides funding to hospitals that meet pre-set milestones related to the delivery of health services
In this five-year program that launched in 2011, the county aims to improve delivery through various measures, such as the reorganization of all primary care services intomore than 200 patient-centered medical homes (PCMHs), a model of care that aims to ensure that patients have access to a personal physician who provides comprehensive care at all stages of life
Other performance targets set by the DSRIP have enabled the county to increase the rate of appropriate mammography screening by 23 percent, while sepsis mortality rates have significantly decreased as a result of increased sepsis quality care compliance

Thirteen rural counties in Minnesota (Beltrami, Big Stone, Clearwater, Douglas, Grant, Hubbard, McLeod, Meeker, Pipestone, Pope, Renville, Stevens, and Traverse) haveformed Prime West Health, a program that manages and funds the health care, wellness and social services of over 36,000 rural residents
The program uses surplus revenue from operations for innovative community reinvestment and development strategies. Since 2006, they have awarded over $12 million in grants to providers and community organizations, including almost $4 million to behavioral health providers
Almost 60 percent of members participate in the “Accountable Rural Community Health” (ACRH) program, which utilizes technology, patient centered medical homes, proven wellness engagement approaches and alternative provider payment models to deliver high quality health care and achieve optimal outcomes. At one ARCH site, inpatient hospital stays have decreased by 11 percent and emergency room visits by 6 percent in one year

In 2013, Cook County, Illinois launched its CountyCare Health Plan through a Medicaid waiver attained by Illinois. Currently, 183,000 individuals living in Cook County are enrolled in the program, which provides access to more than 130 primary care access sites and 38 hospitals
In the CountyCare program, enrollees select a patient-centered medical home from a list of participating providers that includes hospitals and community health centers. For optimum delivery of services, Cook County is reconfiguring its emergency, outpatient and inpatient services to ensure that the care of patients is coordinated with their “medical home” and that their care is provided at that location whenever possible
Cook County is also changing the way it works with other providers caring for similar populations to assure adequate primary care capacity, geographic accessibility and connections to services that countycare does not itself provide

Hennepin County, Minnesota used federal and state Medicaid dollars to launch its Hennepin Health program in 2012. The program, which serves low-income adults, children and families, takes an innovative approach to health care by considering a patient’s medical, behavioral health and social services needs
Hennepin Health members receive care from a multidisciplinary care coordination team that consists of doctors, nurses, pharmacists, social workers and community health workers. Some frequent users of county health and social services are placed in “supportive housing” facilities that have been shown to decrease their dependency on government services
In the first two years of the program’s existence, emergency room visits and inpatient admissions decreased for members, by 9 percent and 3 percent, respectively; for those placed in supportive housing, emergency room visits were cut in half, while inpatient admissions decreased by nearly 30 percent


In recent years, as lawmakers have looked for ways to decrease the federal budget deficit, Medicaid has repeatedly been targeted for deep funding cuts
Last year, the House Republican Task Force on Health Care Reform issued a proposal that would require states to accept a per capita cap or block grant, both of which would shrink federal funding for state Medicaid programs over time
Under a per capita cap, states would receive a fixed amount of federal funding per beneficiary category. Under a block grant, states would receive a fixed amount of federal funding each year, regardless of changes in program enrollment and mandates
If such proposals are enacted, states will have to increase Medicaid spending to make up for federal cuts or reduce access to care for beneficiaries. Both options would shift costs to local taxpayers and reduce counties’ capacity to provide for the health and well-being of our residents

Federal spending on health care programs(as percentage of Gross Domestic Product (GDP))
Actual Projected
Medicaid, CHIP* andACA Exchange Subsidies
Medicare
Federal spending on health care programs is projected to continue its steady rise, due to the aging of the population, rising health care costs and an increase in ACA subsidies
Cuts to Medicaid, which is perceived to be less politically popular than Medicare, are often proposed to address these rising costs
*Children’s Health Insurance Program, a much smaller joint federal-state program that provides health insurance coverage for children in families whose income, while modest, is too high to qualify for Medicaid
Source: Congressional Budget Office

ChairmanOrrin Hatch
(R-Utah)
Ranking MemberRon Wyden
(D-Ore.)
ChairmanGreg Walden
(R-Ore.)
Ranking MemberFrank Pallone
(D-N..J.)
ChairmanMichael C. Burgess
(R-Texas)
Ranking MemberGene Green
(D- Texas)
Ranking MemberDebbie Stabenow
(D-Mich.)
ChairmanPatrick Toomey
(R-Pa.)


• Counties must provide for the health and well-being of our residents, and we invest in health care and Medicaid, even during economic downturns
• Counties deliver Medicaid-eligible services through hospitals, long-term care facilities, behavioral health authorities and public health departments
• Medicaid enhances local economies, especially in rural areas, and reduces the frequency of uncompensated care provided by local hospitals
• Proposals to institute per capita caps or block-grant Medicaid would reduce access to health insurance for low-income individuals while shifting costs to states and counties
• In most states, counties are constitutionally prohibited from raising additional tax revenues. Therefore, shifting additional Medicaid costs to the local level would compromise the stability of the local health care safety-net

Support the federal-state-local partnership structure for financing and delivering Medicaid services
Oppose measures that would further shift federal and state Medicaid costs to counties
Support measures that provide flexibility and incentivize program efficiency and innovation

Matt Chase Executive Director | [email protected]
Deborah Cox Legislative Director | [email protected] | 202.942.4286
Brian Bowden Associate Legislative Director | [email protected] | 202.942.4275
www.naco.org
facebook.com/nacodc @nacotweets youtube.com/nacovideo