understanding the indian on-road transport...
TRANSCRIPT
Understanding the Indian on-road transport customer
A study of the supply and demand side when purchasing on-road transport service
Department of Technology Management and Economics
Division of Industrial Marketing
CHALMERS UNIVERSITY OF TECHNOLOGY
Göteborg, Sweden, 2012
Report No. E2012:013
CHRISTIAN ANDERSSON
NIKHIL PURANIK

i

ii
ACKNOWLEDGEMENT It all began with a question from Scania seeking to investigate the requirements, needs and challenges
of purchasing on-road logistical services in India. With this interesting question began our quest of
exploring the Indian transportation setup. Nothing could get more exciting than this!
Although we were welcomed to stay in Södertälje, site of the headquarters for Scania, we conducted the
study based in Gothenburg. In Gothenburg, we were close to both a large part of the Swedish industry
as well as the academic environment of Chalmers University.
We would like to take this opportunity to give a big thanks to Erik Bergvall, our supervisor at Scania for
his active guidance and support prior and during the thesis. We would also like to thank Anne-Maria
Holma, our supervisor at Chalmers University for her support and brilliant insights during the course of
our thesis. We would like thank all those who helped us establish contacts and secure appointments in
India and making it possible to plan and schedule our trip. We would also like thank the people of India
for their hospitality during our four week tour travelling all over India, introducing us to the rich culture
and warm hospitality of Mother India!
Finally, we would like to thank all our esteemed interviewees in Sweden and in India. This broad study
into the Indian transport industry would not have been possible without the active involvement of all
our interviewees!
Södertälje, May 2012
Christian Andersson Nikhil Puranik
iii
Thesis in the Master’s Program Supply Chain Management
UNDERSTANDING THE INDIAN ON-ROAD TRANSPORT CUSTOMER
A study of the supply and demand side when purchasing on-road transport services
Christian Andersson
Nikhil Puranik
© CHRISTIAN ANDERSSON, 2012
© NIKHIL PURANIK, 2012
Technical report no: E2012:013
Department of Technology Management and Economics
Division of Industrial Marketing
Chalmers University of Technology
SE-412 96 Göteborg
Sweden
Telephone + 46 (0)31-772 1000
Cover:
The Gateway to India, Mumbai
iv
ABSTRACT The global business network and the actors which build them are the very foundation on which every
major company relies. Business in today’s society has a natural connection to knowledge transfer
between parties and building strong networks, both for supplying actors with the necessary tools for
production as well as for strong long term customer commitments. With this thought as a background,
the thesis investigates the long distance on-road transport setup in India and the network around which
different companies have based themselves in different regions of India.
India is a country that has been involved in global trade for millennia and in these modern times, India is
reemerging as a strong player. Transportation networks are considered as the veins of an economy
especially in a huge country like India. The Indian business network is fragmented and the supply chains
can sometimes consist of many intermediaries. But in certain segments, the Indian business network is
as capable as any other supply chain from a more dominating developed market.
This study is aimed at providing an understanding about the Indian road logistics setup especially from
the point of view of purchasing on-road logistical services. This has been done by identifying certain
macro level parameters, network level parameters and local actor level parameters and investigating
them over a large geographical area covering all the major industrial hubs in India. These hubs include
Delhi in the north, Mumbai/Pune in the west and Chennai/Bangalore in the south.
This study provides information based on the above mentioned parameters in the mentioned order and
on the basis of extensive interviews carried out in Sweden and most importantly in India wherein the
interviewees cover the whole spectrum of the transportation industry including the manufacturing
companies and the logistical service providers.
KEY WORDS India, Logistical industry, On-road transportation, Transport demand/supply, Business network,
Internationalization, Actor network

v
TERMS AND ABBREVIATIONS This is a list of commonly used terms in the report and an explanation to them. The definitions have had
inspiration from many different sources, i.e. Jonsson and Mattson (2009), Mattson (2004) and Ehsanifar
et Al. (2010), but in some cases definitions originated from the data collected during the empirical study.
Also some commonly used abbreviations are spelled out.
Categories of actors Agent
An actor with the capability of providing a wide array of transport services; the basic transport
requirement can be provided along with more sophisticated administrative services i.e. customs
clearance and freight forwarding. The agent may act as a 3PL but generally for a lower volume segment.
Broker
An actor acting as a go-between demand and supply side of purchasing transport services; this actor
provides the additional capacity required in the market to cater to the demand in various segments. A
broker can own trucks but also have contact with other transporters that offer their services through the
individual broker.
Manufacturing company
An Actor who produces manufactured goods and has a requirement to transport these goods thereby
initiating the demand for transport services; in some cases the manufacturing company also owns
trucks.
Transporter
An actor whose primary responsibility is to provide transportation services for his customers i.e. the
manufacturing companies.
3PL
Company which has the capability of providing highly sophisticated logistics solutions to the customer,
and also be responsible either partly or wholly for the logistical activities of the company.
Transport terms Mode of transport
Term used to classify different transport options available. As an example, Road transport and sea
transport are two different modes of transportation.
Intermodal transport
Transport which involves the use of more than one possible mode of transports simultaneously; an
example being that the goods are transported through the road-sea-road combination.
Transport parameters Price
The amount of money paid for a product or service, i.e. a transport service. The price is a set value
determined through negotiations between the parties involved in the transaction.

vi
Trust
Refers to the confidence or the ability to engage constructively between the parties involved in
transport services in terms of delivering on the terms offered by the corresponding parties to each
other.
Lead Time
The time it takes the provider of transport services to deliver the consignments from point A to point B.
Delivery Precision
Refers to the accuracy of a provider of transport services to keep up with the lead time promised to the
customer.
Environmental Considerations
These refers to the considerations regarding the environment while choosing a particular transport
service by the customer and also the willingness of the transport provider to offer more environmental
friendly solutions to the customers.
Qualitative analytical terms Open question
A question stated in such a way that the respondent can elaborate in answering the question and can
answer however he or she wants. The answer need to be sifted and coded in order for the data to be
analyzed quantitatively.
Closed questions
A question set so that the respondent has a limited choice of possible answers. This method means a
higher degree of validity as the interviewer variability is decreased and an easier handling of data.
Population
The set of entities or values from which a statistical inference is to be drawn often based on a random
sample drawn from the population.
Quantitative analysis
Analysis based on quantity or a number of samples which are then used to draw conclusions mainly
through statistical methods. This method involves having a number of samples or objects of interest that
receive validity in part through having enough samples for the analysis. This model would generally try
to get as many samples as possible.
Qualitative analysis
Analysis based on quality of interviews where the difference to quantitative means would be to focus
more on getting as much relevant information as possible from each sample in an open manner. This
method increases the need for focusing on the validity of the study and as always to minimize the
means of error. Tools used to analyze qualitative data would be more complex and there would also be
more sources of error in a qualitative study than in a quantitative one.
vii
Qualitative interview
Interview which forms a part of a qualitative study. This interview is generally conducted a semi-
structured manner and also in an unstructured way which have been defined later.
Questionnaire
A set of questions that are formulated to be put forward to the interviewees and the answers to which
would give an insight into the target of the study. The questionnaire can be either very flexible or fixed
in its composition depending on the chosen methodology i.e. a structured or semi-structured approach.
Sample
It is the part of the population that is selected for investigation. It is a subset of the population. The
method of selection may be based on a probability or a non-probability approach.
Sample error
It gives the potential difference in the statistical inference between a sample and the population from
which it is selected, even though a random sample has been selected.
Semi-structured interview
Conducting interviews according to a set questionnaire in an adaptable way where the interviewers can
change the order in which the questions are asked if there is a need while remaining open to a range of
open discussions that could form a part of the interview process. This would be done in order to get as
complete a picture as possible.
Structured interview
Refers to conducting interviews according to a set questionnaire and in a set order of questions. This
setting means that the respondents receive the same stimulus which increases the validity in terms of
providing a similar setting for interviewees when responding to the questions.
Stimulus
The external factors that can influence the interviewee.
General terms Emerging markets
These are the new developing markets that are growing rapidly as compared to the developed
economies.
Mature market
A market consisting of customers where there is a high degree of knowledge and use of best practices in
regards to purchasing services and the demands that could be put forward.
Immature market
A market consisting of customers without proper or adequate education or capability in regards to
accessing or implementing the best practices in the industry.
viii
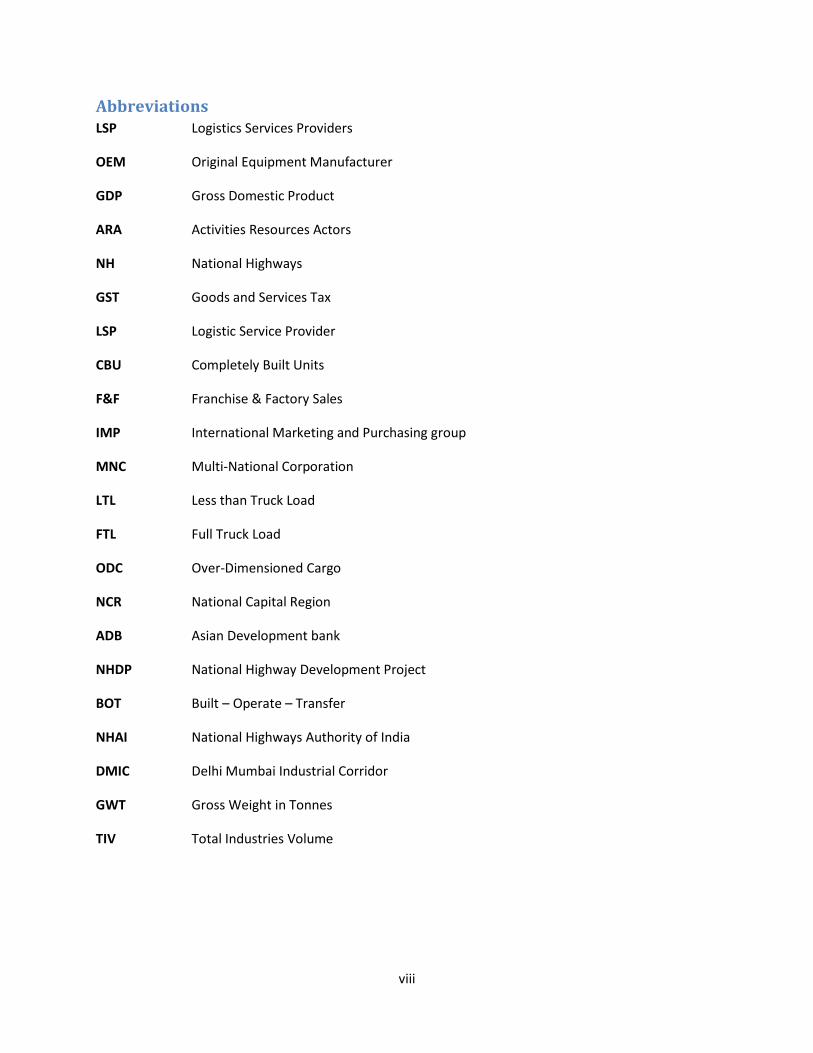
Abbreviations LSP Logistics Services Providers
OEM Original Equipment Manufacturer
GDP Gross Domestic Product
ARA Activities Resources Actors
NH National Highways
GST Goods and Services Tax
LSP Logistic Service Provider
CBU Completely Built Units
F&F Franchise & Factory Sales
IMP International Marketing and Purchasing group
MNC Multi-National Corporation
LTL Less than Truck Load
FTL Full Truck Load
ODC Over-Dimensioned Cargo
NCR National Capital Region
ADB Asian Development bank
NHDP National Highway Development Project
BOT Built – Operate – Transfer
NHAI National Highways Authority of India
DMIC Delhi Mumbai Industrial Corridor
GWT Gross Weight in Tonnes
TIV Total Industries Volume

ix

x
TABLE OF CONTENT 1 Introduction .......................................................................................................................................... 1
1.1 Background ................................................................................................................................... 1
1.2 Problem formulation ..................................................................................................................... 2
1.2.1 Problem presentation ........................................................................................................... 2
1.2.2 Purpose ................................................................................................................................. 3
1.2.3 Research questions ............................................................................................................... 5
1.3 Delimitations ................................................................................................................................. 5
1.4 Expected outcome ........................................................................................................................ 6
1.5 Disposition .................................................................................................................................... 7
1.6 Reading directives ......................................................................................................................... 8
2 Scania Commercial Vehicles.................................................................................................................. 9
2.1 Management of Scania ............................................................................................................... 10
2.2 Franchise and Factory Sales ........................................................................................................ 11
2.3 Scania in India ............................................................................................................................. 12
3 Methodology ....................................................................................................................................... 14
3.1 Research process ........................................................................................................................ 14
3.2 Research strategy ........................................................................................................................ 15
3.2.1 Basic terminology of research strategy .............................................................................. 16
3.2.2 Theory of qualitative analysis ............................................................................................. 18
3.2.3 Chosen strategies for thesis ................................................................................................ 20
3.3 Research design .......................................................................................................................... 21
3.3.1 Data collection .................................................................................................................... 21
3.3.2 How to structure the empirical study ................................................................................. 21
3.3.3 Creating the questionnaire ................................................................................................. 23
3.4 Quality of the empirical study ..................................................................................................... 24
3.4.1 Risks and error factors in connection to the empirical study ............................................. 25
4 Theoretical framework ....................................................................................................................... 27
4.1 Theory of internationalization .................................................................................................... 27
4.2 Industrial Network Approach ...................................................................................................... 31
4.2.1 Business relationship .......................................................................................................... 31
4.2.2 Intermediation and actors .................................................................................................. 33

xi
4.2.3 Positioning of actors ........................................................................................................... 33
4.2.4 Network model ................................................................................................................... 34
4.3 Logistics theory ........................................................................................................................... 35
4.3.1 Parameters for evaluating logistic service performance .................................................... 36
4.3.2 Mature and immature markets .......................................................................................... 36
4.3.3 Localization ......................................................................................................................... 37
5 Empirical study of the Indian on-road transport network .................................................................. 39
5.1 Empirical setting.......................................................................................................................... 39
5.1.1 Segmentation of the interviewees ...................................................................................... 40
5.2 Macro perspective of India ......................................................................................................... 44
5.2.1 Indian Infrastructure ........................................................................................................... 44
5.2.2 Organization of transport industry ..................................................................................... 46
5.2.3 Rules and regulations .......................................................................................................... 47
5.3 On-road transport network ........................................................................................................ 49
5.3.1 Manufacturing companies .................................................................................................. 49
5.3.2 3PL ....................................................................................................................................... 51
5.3.3 Transporting Companies ..................................................................................................... 52
5.4 Actor perspectives ...................................................................................................................... 54
5.4.1 Important parameters when purchasing on-road transport .............................................. 54
5.4.2 The general results of the questionnaire part 1 ................................................................. 55
5.4.3 The segmented results of the questionnaire part 1 ........................................................... 56
5.4.4 Cost structure of Indian transport industry ........................................................................ 58
5.5 Trends and future possibilities .................................................................................................... 59
6 Analysis of the Indian on-road transport network ............................................................................. 61
6.1 Macro perspective of Indian logistics setup ............................................................................... 61
6.1.1 Infrastructure ...................................................................................................................... 61
6.1.2 Organization of transport industry ..................................................................................... 61
6.1.3 Rules and regulations .......................................................................................................... 62
6.2 Indian on-road transport network .............................................................................................. 62
6.2.1 Internationalization and the Indian logistics service business network ............................. 62
6.2.2 Business network ................................................................................................................ 64
6.3 Indian actor perspectives ............................................................................................................ 68

xii
6.3.1 Importance of parameters in connection to purchasing transport services ...................... 68
6.3.2 Satisfaction of current logistics service set up in connection to parameters ..................... 69
6.3.3 Segmented answers from actor groups .............................................................................. 69
6.3.4 Analysis of the Indian LSP actors ......................................................................................... 71
6.3.5 Cost structure ...................................................................................................................... 73
7 Discussion of the Indian on-road transport network .......................................................................... 74
8 Conclusions of the current Indian market for transport services ....................................................... 76
8.1 Macro perspectives ..................................................................................................................... 76
8.2 The India business network perspectives ................................................................................... 76
8.3 The actor perspectives ................................................................................................................ 78
9 Future research ................................................................................................................................... 80
10 References .......................................................................................................................................... 81
11 Appendices .......................................................................................................................................... 84
11.1 Pre-study ..................................................................................................................................... 84
11.1.1 Introduction to India ........................................................................................................... 84
11.1.2 Introduction to India’s infrastructure setup ....................................................................... 86
11.1.3 Role of road transportation in India ................................................................................... 90
11.1.4 Regulatory framework ........................................................................................................ 91
11.1.5 Classification of India’s road network and future investments .......................................... 92
11.1.6 Major goods flows on-road in India and major hubs .......................................................... 95
11.2 Table of Interviewees in Sweden ................................................................................................ 97
11.3 Table of interviewees in India ..................................................................................................... 98
11.4 Empirical Study 2: Questionnaire Part 1 ................................................................................... 100
11.5 Empirical Study 2: Questionnaire Part 2 ................................................................................... 101
xiii
TABLE OF FIGURES Figure 1: Structure of the thesis - Introduction ............................................................................................ 1
Figure 2: Indian truck ownership .................................................................................................................. 2
Figure 3: The three perspectives of the thesis .............................................................................................. 5
Figure 4: Disposition of the thesis ................................................................................................................. 7
Figure 5: Structure of the thesis - Scania ...................................................................................................... 9
Figure 6: Scania Executive Board ................................................................................................................ 10
Figure 7: Scania executive board and group management ........................................................................ 11
Figure 8: The Scania business model .......................................................................................................... 13
Figure 9: Structure of the thesis - Methodology ......................................................................................... 14
Figure 10: Process of deductive theory ...................................................................................................... 16
Figure 11: Process of inductive theory ....................................................................................................... 16
Figure 12: Process of abductive theory ...................................................................................................... 17
Figure 13: Outline of the main steps of qualitative research ..................................................................... 20
Figure 14: The chosen empiric research structure ..................................................................................... 21
Figure 15: Interviewee best possible merits/description ........................................................................... 23
Figure 16: Structure of the early questionnaire for the empirical study part 1, the Swedish interviews .. 24
Figure 17: The four sources of error in survey research ............................................................................. 25
Figure 18: Specific sources of error in survey research .............................................................................. 26
Figure 19: Structure of the thesis – Theoretical framework ....................................................................... 27
Figure 20: The Uppsala model - State and change aspects ........................................................................ 28
Figure 21: The updated Uppsala model - The business network internationalization process.................. 29
Figure 22: The Uppsala globalization process model ................................................................................. 30
Figure 23: The ARA-model .......................................................................................................................... 32
Figure 24: The three dimensional model of industrial networks................................................................ 34
Figure 25: Structure of the thesis – Empirical study ................................................................................... 39
Figure 26: Empirical study work process .................................................................................................... 39
Figure 27: Regions in India considered for interviews ................................................................................ 41
Figure 28: Segmentation of interviewees into actor groups ...................................................................... 43
Figure 29: Segmentation of interviewees into geographical areas ............................................................ 44
Figure 30: NH 4 and NH 9 passing through the center of the city of Pune, Maharashtra .......................... 45
Figure 31: Sales tax effect ........................................................................................................................... 48
Figure 32: Sandvik actor network for products .......................................................................................... 50
Figure 33: Sandvik actor network for heavy equipment ............................................................................ 50
Figure 34: Network of actors for TCI ........................................................................................................... 51
Figure 35: Network of actors for K+N ......................................................................................................... 52
Figure 36: Network structure for Speed Roadways .................................................................................... 52
Figure 37: Network structure for DGFC ...................................................................................................... 53
Figure 38: Network structure for ACL ......................................................................................................... 53
Figure 39: Network structure for BLR Logistics ........................................................................................... 54
Figure 40: Components of costs for long haulage activities in Europe ....................................................... 58
xiv
Figure 41: Component of costs for long haulage activities in India ............................................................ 59
Figure 42: Structure of the thesis - Analysis ............................................................................................... 61
Figure 43: Model of Indian LSP network nomenclature ............................................................................. 65
Figure 44: Network structure and types of relationship............................................................................. 66
Figure 45: Level of Importance for parameters .......................................................................................... 70
Figure 46: Level of Satisfaction for parameters .......................................................................................... 70
Figure 47: Actor Analysis Model ................................................................................................................. 71
Figure 48: Actor Analysis Model with the defined Indian actors ................................................................ 72
Figure 49: Structure of the thesis - Discussion ........................................................................................... 74
Figure 50: Structure of the thesis - Conclusions ......................................................................................... 76
Figure 51: Map of India and borders .......................................................................................................... 84
Figure 52: The Hindi belt of India including some regional languages ....................................................... 85
Figure 53: Map of the 28 states of India ..................................................................................................... 86
Figure 54: Major planned highways in India ............................................................................................... 87
Figure 55: Proposed Freight Corridors for Railways ................................................................................... 89
Figure 56: Revenue distribution .................................................................................................................. 90
Figure 57: Role of road transportation in India .......................................................................................... 91
Figure 58: Taxes subsumed under GST ....................................................................................................... 92
Figure 59: Delhi-Mumbai industrial corridor map ...................................................................................... 95
Figure 60: Estimate of traffic volumes in India 2007 .................................................................................. 96
xv
LIST OF TABLES Table 1: Scania key figures 2010 ................................................................................................................... 9
Table 2: Features of qualitative and quantitative research ........................................................................ 18
Table 3: Modes of qualitative and quantitative research ........................................................................... 19
Table 4: The stages of the work process for thesis ..................................................................................... 22
Table 5: The four stages of internationalization – The establishment chain .............................................. 27
Table 6: Interviewees during the different stages of the study .................................................................. 40
Table 7: Cities and stated visits during empirical study part 2 ................................................................... 40
Table 8: Interviewed manufacturing companies ........................................................................................ 42
Table 9: Interviewed 3PLs ........................................................................................................................... 42
Table 10: Interviewed agents ...................................................................................................................... 42
Table 11: Interviewed transport companies ............................................................................................... 43
Table 12: Interviewees classified as actor group other .............................................................................. 43
Table 13: General response of questionnaire part 1 - Importance of parameters .................................... 55
Table 14: General response of questionnaire part 1 - Satisfaction of current service ............................... 56
Table 15: Segmented response of questionnaire part 1 - Importance of parameters ............................... 57
Table 16: Segmented response of questionnaire part 1 - Satisfaction of current service ......................... 57
Table 17: Structure of interviewed companies into actor groups .............................................................. 64
Table 18: Country comparison of road network, the top 12 largest networks in the world ...................... 88
Table 19: Ports and Terminals in India ........................................................................................................ 90
Table 20: Classification of roads in India..................................................................................................... 92
Table 21: NHDP ........................................................................................................................................... 93
Table 22: NHDP, phase 1 & phase 2 ............................................................................................................ 94
Table 23: NHDP, phase 3 ............................................................................................................................. 94

1
1 INTRODUCTION The structure of the thesis can be seen in Figure 1 where this first chapter provides a background to the
subject and the problem formulation. Thereafter the purpose and research questions are stated
followed by delimitations, expected outcome, disposition and reading directives. The introduction is
meant to provide the reader with the fundamentals of the subject, before presenting data related to the
subject and the analysis.
Figure 1: Structure of the thesis - Introduction
1.1 Background The commercial vehicle industry is changing rapidly and will continue to change in the future as the
demand from the markets increase. In order to achieve new growth targets, companies are increasingly
establishing themselves and focusing on emerging markets. This has led to a shift in focus from the
traditional markets of Europe and America to the developing and growing markets for global automotive
manufacturers.
India is an important market for the commercial vehicles industry and has been witnessing a high
growth rate over the last few years. According to Batra (2010), as the country’s per capita of the total
Gross Domestic Product (GDP) increases beyond USD 1 000, there will be an explosion in mobility and
sales of automobiles.
There is a huge requirement for efficient and organized transport solutions, but the requirements for
India are different from those in the developed parts of the world. Road transport is the dominant
transport mode in India and accounted for approximately 57% of total freight transport in India in 2007.
The freight traffic is expected to grow over 2.5 times in the next 10 years or at around 7.5% per year.
This expected 2.5-fold growth in freight traffic will further increase the pressure on India’s infrastructure
(Gupta et al., 2010a).
If India fails to develop its infrastructure, waste caused by poor logistics infrastructure will increase from
the current USD 45 billion equivalent to 4.3% of today’s GDP, to USD 140 billion or more than 5% of the
GDP in 2020. If tackled in an integrated and coordinated manner, this can be reduced by half and India’s
transport fuel requirement can thereby be reduced by 15% - 20% of the total fuel requirement. Logistics
infrastructure spend has tripled from around USD 10 billion in 2003 to a planned amount of around USD
30 billion in 2010 by the Indian government. In order to boost the economic development of India and
to encourage the overhaul of the old fashioned transporting vehicles in India, the government embarked
on a massive National Highways Development Project (NHDP) in the country (Gupta et al., 2010a).

2
This NHDP project has generated tremendous potential for enhancing the usage of heavy trucks in India,
by providing a better road network between major cities in India, thereby attracting local as well as
foreign truck manufacturers.
Scania entered the Indian market in 2007 by launching tippers in partnership with Larsen & Toubro
(L&T), an Indian multinational conglomerate. Tippers are the trucks used mainly at construction sites for
transporting material on site. The cabin and chassis are currently imported as Completely Built Units
(CBUs) and tippers are being added locally. Scania has sold over 500 tippers in India until 2010 and is
now looking at the possibility of introducing on-road vehicles and setting up an assembly facility in India
both for its truck and bus projects (Natarajan, 2010, p. 65).
1.2 Problem formulation This chapter introduces the problem formulation and the purpose of the thesis with basis in the
previously presented background to the subject. Thereafter the research questions are formulated
connected to the purpose which will make the aim of the report clearly presented. These research
questions will then be the basis for the further analysis in the report.
1.2.1 Problem presentation
Scania’s presence in India is limited to the off-road segment through collaboration with L&T, an Indian
multinational conglomerate as its local partner in India. Scania delivers trucks to be used in the mining
and construction applications. Since Scania has other major business areas including the on-road trucks
as well, Scania bears an interest in understanding the Indian on-road transport segment where, as
identified in the background, there is a potential for these trucks to be sold in the future (Bergvall,
2011).
In India, 74% of the truck owners own a fleet size of up to 5 vehicles, 15% of the truck owners own
between 6 to 20 vehicles, and the remaining 11% own more than 20 vehicles (KPMG, 2010b).
Figure 2: Indian truck ownership
Small Fleet Operator (1-5 trucks); 74
Medium fleet operator(6-20
trucks); 15
Large Fleet Operator (more than 20
trucks); 11
3
In only 2-3% of the cases do the customers have direct access to truck owners and book their own
goods. There are many intermediaries including booking agents and brokers. While broker is a person
(or a group of persons) who takes commission from the truck owners and ensures supply of trucks to
the transport contractor, booking agent is a person engaged in the business of collecting, forwarding or
distributing goods carried by trucks. In addition, some of these agencies also provide finance and
warehousing/Storage facility. Despite having a legal provision for their registration, the intermediaries
are unregulated (K.L.Thukral, 2010).
The large number of small operators has resulted in an unorganized profile of the trucking industry in
terms of supply. The reasons for the development of this situation are lower capital requirements, ease
of obtaining truck driving licenses and permits, low mental skills as compared to physical abilities and
easy availability of freight. The organized component of the industry consists of fleet operators in small
numbers and has a fleet of varying payload. The fleet is primarily used for transporting general goods
with operators working on a basis of a hub and spoke distribution model. The unique ownership profile
in the industry has created middlemen who act as liaison agents for small trucking operators who do not
have the geographical reach to tap business on a continuous basis and hence are forced to rely on these
middlemen. With transportation companies (big fleet owners) gradually moving from an asset based to
a non-asset based model, it is widely recognized that dependence of small fleet operators and small
operators on brokers is expected to continue to have an impact on the physical as well as financial
performance of these operators (Sriraman, 2006).
Considering the above situation, there is a need to understand the role of various parties and defining
transporters, brokers, agents and the buyers of transportation services within the transportation
network. In many cases, these roles could be combined and served by a single actor. As an example, a
3PL company can include the services of an agent and the transporter in its service portfolio. The roles
of these actors in terms of the activities they carry out, the resources that they own and effects of their
mutual interaction and relationship is relatively unknown. This may vary from industry to industry and
region to region. It is more logical to look into this situation from a network perspective rather than
following a single supply chain within an industry or a region. It would be interesting to investigate how
this network structure operates in the heavy trucks segment and whether this structure will remain
relevant in the future especially in the heavy trucks segment.
Apart from gaining an understanding about the network, there is also a need to understand the logistical
issues and challenges faced by different actors in the network. The issues could be at an individual or at
an institutional level dealing with the demands from the buyers of road transportations services to the
limitations put by the Indian road infrastructural and bureaucratic setup.
1.2.2 Purpose
The purpose of this thesis is to analyze the requirements of providers and purchasers of on-road logistic
services in India and the environment in which they operate.
India is a country with high expectations for the future and is related to terms like Emerging Market and
is one of the BRIC (Brazil, Russia, India and China) countries, which are gaining size in the world economy
4
increasingly. According to Vries et Al. (2012) the BRIC countries have grown from 15% share of the world
in 1980 economy to 27% in 2008 and India having grown from about 3% of the world economy in 1980
to 7% in 2008.
Entering a market like India, with many regional variations and customers that have different
requirements from customers from other parts of the world, can be expensive and lead to major losses
if not studied in a proper way. This thesis will analyze and try to understand the important factors for
logistics customers purchasing on-road transport services in India. The problem formulation subchapter
has presented the problem in brief to the reader and this chapter will present the purpose of the thesis
and analyze the problem, in order to investigate and help answer the questions raised in the problem
formulation.
Three perspectives are identified which will help to answer the purpose and devise the research
questions in a step wise manner. In order to understand the Indian on-road transport customer and
answer the purpose of the thesis mentioned above, there is a need to study the macro level situation in
India especially its infrastructure. The infrastructure in India is developing and changing drastically.
There are major road projects both ongoing and planned in the near future. These developments will
have an impact on the way goods are being transported in India and it will be important to help the
reader to note some of the important developments taking place in India’s road infrastructure.
Secondly, after gaining a brief understanding of India’s infrastructure, the next step would be to study
the network of actors operating in India’s road logistics setup. The Indian road logistics setup is
fragmented and unorganized and includes different actors who assume different roles in the network.
This has led to a complex chain of actors within the logistics network. There is a need to identify the
actors present in the network and explain their role within the network and the way they are related to
other actors within the network.
Thirdly and finally after identifying different actors and their network it’s necessary to understand the
requirements, challenges and needs of these actors at an individual level, in order to gain necessary
understanding of the logistical requirements and challenges within the logistical setup when purchasing
on-road logistical services. Investigating those perspectives will lead to answering of the purpose and in
the end the objective of the thesis. This structure creates a step wise model for connecting macro and
network perspective in order to gain understanding of the actor and also for the full chain of
perspectives as seen in Figure 3.

5
Figure 3: The three perspectives of the thesis
1.2.3 Research questions
The three perspective brought forward in the purpose will now be linked to two research questions
which will be the main focus for the thesis. The first perspective will be addressed in the form of a pre-
study and will lay out the background for the next two perspectives. The pre-study will identify
investments made and planned within India’s road infrastructure. The freight flows and major hubs for
transporting goods are two perspectives that will be investigated.
The second perspective is developed as the first research question and will entail a study of the network
structure in Indian road logistics. The perspective will be to better understand the network of actors that
constitute the transportation network and to study the complexity involved in the network over
different companies.
Thirdly and lastly the second research question will be connected to understanding the specific factors
that affect purchasers of on-road transportation services. The limitation will be on transportation
services in general but with a specific focus of on-road transports.
Following are the research questions to be investigated in the thesis:
1. How is the network of actors set up in India for delivering on-road transportation services?
2. What are the important considerations when purchasing logistical services in India?
1.3 Delimitations Although many companies have been interviewed for this thesis, the focus remains on understanding
the setup for long haulage and heavy transportation in India.
India is a huge country with growing importance in the world economy (Vries et al., 2012). When it
comes to logistics and on-road transportation, there are many perspectives involving different modes of
Macro
Network
Actor

6
transport that could be taken into consideration, but we will limit this thesis on on-road transport and
not focus on other modes of transport.
Interviewees have been chosen from different regions of India to get a national perspective. An effort
has been made to have as high a sample of interviewees as possible in order to increase the validity of
the data mentioned. However, the data mentioned in the thesis when referred to certain interviewees
remains purely subjective.
1.4 Expected outcome This thesis is expected to meet the purpose, “…to analyze the requirements of providers and purchasers
of on-road logistic services in India and the environment in which they operate”, through the research
questions. Investigating the environment will give an understanding of the market and the market
maturity, what parameters are taken into consideration as basis for purchase and how the transport
sector is structured.
There will be an analysis of network and actors from both demand and supply side when purchasing on-
road logistics services intending to explain the environment and the actor perspective on macro factors
such as infrastructure, organization and regulatory issues.
Finally the perspectives from network and individual actors will give a good understanding of the current
situation in India when purchasing on-road transport services. This information will give the individual
actors in the market a better overall understanding of on-road transportation in India. The thesis has the
purpose of investigating the general parameters connected to the market and the overall market
development and maturity.
This thesis will provide a better understanding of the transport market in India in relation to macro,
network and actor perspectives. It will give an understanding of the situation in India as on June 2011
and some perspective on the current and possible development of the business sector. This will give
actors operating on-road transport services a better understanding of their market and business
network.
7
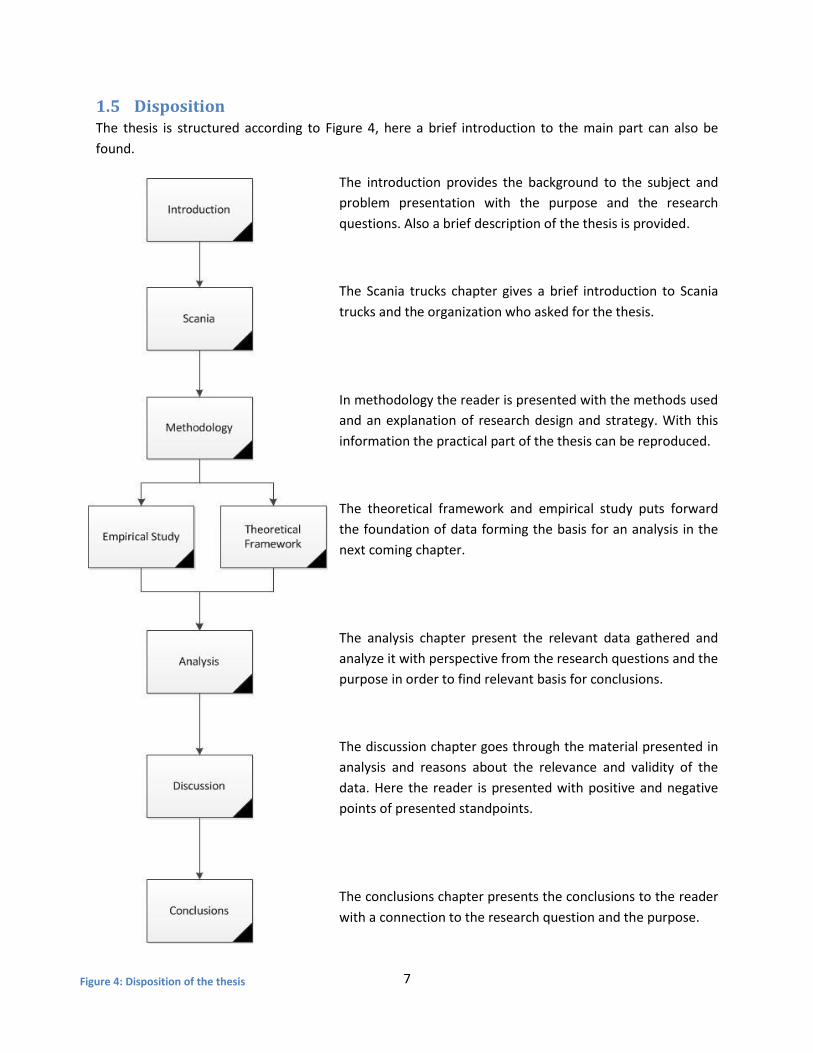
1.5 Disposition The thesis is structured according to Figure 4, here a brief introduction to the main part can also be
found.
The introduction provides the background to the subject and
problem presentation with the purpose and the research
questions. Also a brief description of the thesis is provided.
The Scania trucks chapter gives a brief introduction to Scania
trucks and the organization who asked for the thesis.
In methodology the reader is presented with the methods used
and an explanation of research design and strategy. With this
information the practical part of the thesis can be reproduced.
The theoretical framework and empirical study puts forward
the foundation of data forming the basis for an analysis in the
next coming chapter.
The analysis chapter present the relevant data gathered and
analyze it with perspective from the research questions and the
purpose in order to find relevant basis for conclusions.
The discussion chapter goes through the material presented in
analysis and reasons about the relevance and validity of the
data. Here the reader is presented with positive and negative
points of presented standpoints.
The conclusions chapter presents the conclusions to the reader
with a connection to the research question and the purpose.
Figure 4: Disposition of the thesis
8
1.6 Reading directives This thesis is primarily written for two main groups of readers; persons connected to the transport
industry interested in India or academics within industrial engineering and transportation. This thesis is
structured as a general technical report and consists by; introduction to the purpose, Scania and the
methods, then the theories and the actual findings finally ending with an analysis, discussion and the
conclusions as seen in Figure 4 above.
For readers from the industry, the authors recommend reading following parts of the thesis:
1.1, 1.2, 5, 8, 10.1
For readers from academia, the authors would recommend following parts of the thesis:
1, 3, 4, 6, 7
But the authors would very much like to recommend reading the whole thesis, a disposition of the thesis
can be viewed in Figure 4 presenting the structure of the thesis and what’s to expect from the various
parts.
Hope you will enjoy the continued reading!
9
2 SCANIA COMMERCIAL VEHICLES This chapter aims at giving the reader a company presentation of Scania Commercial Vehicles (Scania),
both in terms of numbers and key indicators as well as an organizational presentation with a company
structure focus. As can be seen in Figure 5, this stage of the thesis aims at giving the reader the basic
information so that the theories and the coming empirical data can be put in its correct context. This
chapter will present Scania both from top management level and then also present the department for
non-captive markets at Franchise and Factory Sales (F&F) and its areas of responsibility.
Figure 5: Structure of the thesis - Scania
Scania was founded in 1891 and has since then it has built and delivered more than 1 400 000 trucks and
buses for heavy transport work all over the world.
The Scania Corporate statement reads as follows:
“Scania’s objective is to deliver optimized heavy trucks and buses, engines and services, provide the best
life-cycle profit for our customers, and thereby be the leading company in our industry. The foundation is
our core values, our focus on methods and the dedicated people of Scania.“ (Scania, 2008).
Today Scania is one of the world’s leading manufacturers of heavy trucks and buses and have
systematically concentrated its resources in the heavy transport segment (Scania, 2008). The company is
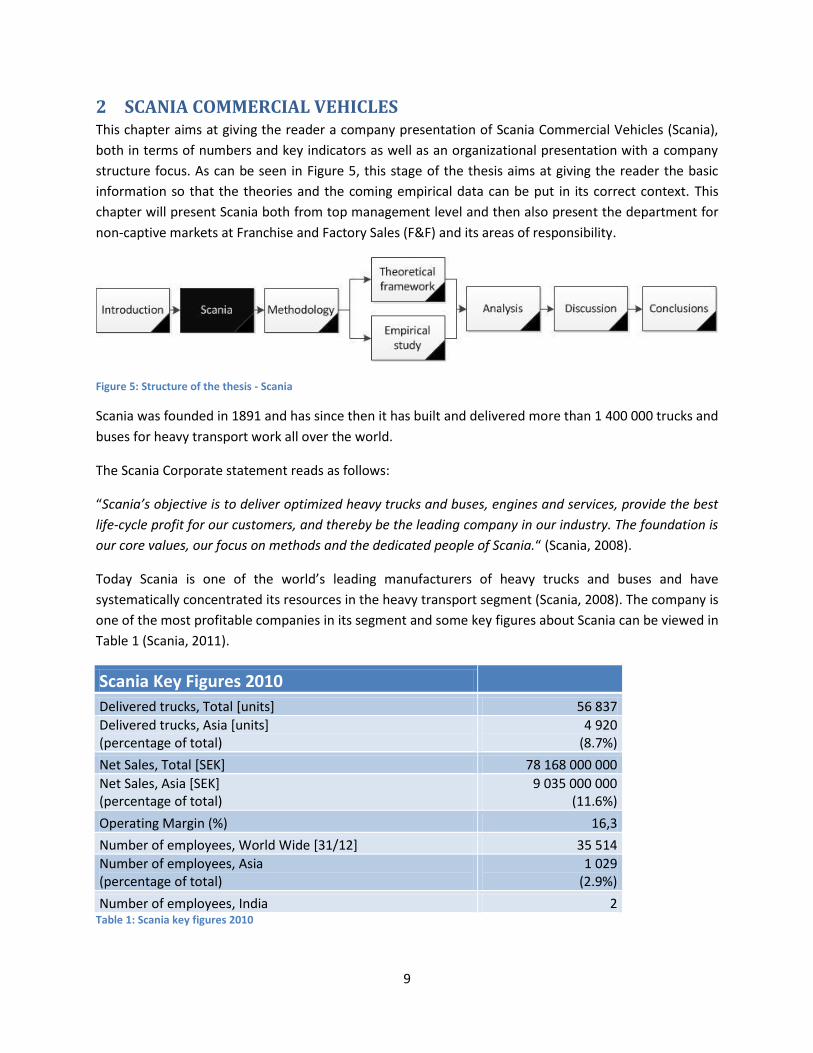
one of the most profitable companies in its segment and some key figures about Scania can be viewed in
Table 1 (Scania, 2011).
Scania Key Figures 2010 Delivered trucks, Total [units] 56 837
Delivered trucks, Asia [units] (percentage of total)
4 920 (8.7%)
Net Sales, Total [SEK] 78 168 000 000
Net Sales, Asia [SEK] (percentage of total)
9 035 000 000 (11.6%)
Operating Margin (%) 16,3
Number of employees, World Wide [31/12] 35 514
Number of employees, Asia (percentage of total)
1 029 (2.9%)
Number of employees, India 2 Table 1: Scania key figures 2010
10
Scania operates in about 100 countries and has more than 35 000 employees. Of these, over 2 900 work
with research and development in cooperation with production units, mainly in Sweden. The company’s
production facilities are found in Sweden, France, Netherlands, Poland, Brazil and Argentina. Scania is
cooperating with approximately 100 national distributors all over the world in order to gain presence
where Scania don’t have its own facilities. There are more than 1 500 Scania service points around the
world that serve the Scania’s customers with more than 500 placed outside Europe (Scania, 2011).
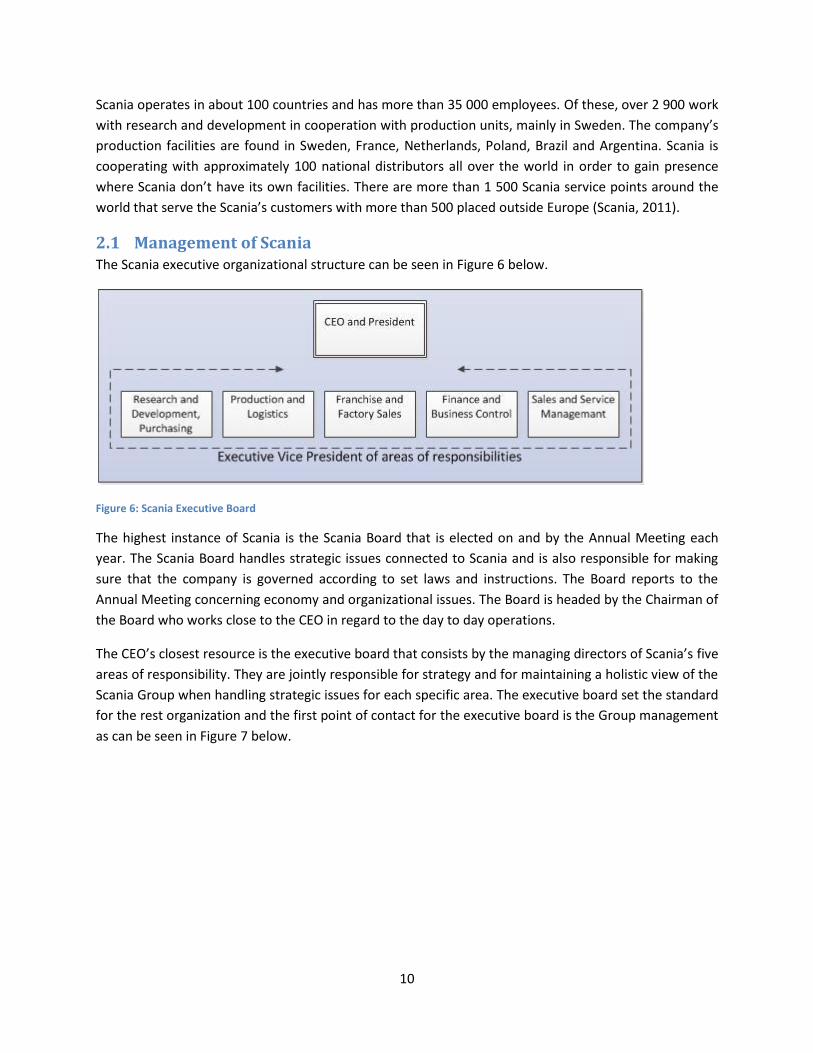
2.1 Management of Scania The Scania executive organizational structure can be seen in Figure 6 below.
Figure 6: Scania Executive Board
The highest instance of Scania is the Scania Board that is elected on and by the Annual Meeting each
year. The Scania Board handles strategic issues connected to Scania and is also responsible for making
sure that the company is governed according to set laws and instructions. The Board reports to the
Annual Meeting concerning economy and organizational issues. The Board is headed by the Chairman of
the Board who works close to the CEO in regard to the day to day operations.
The CEO’s closest resource is the executive board that consists by the managing directors of Scania’s five
areas of responsibility. They are jointly responsible for strategy and for maintaining a holistic view of the
Scania Group when handling strategic issues for each specific area. The executive board set the standard
for the rest organization and the first point of contact for the executive board is the Group management
as can be seen in Figure 7 below.
11
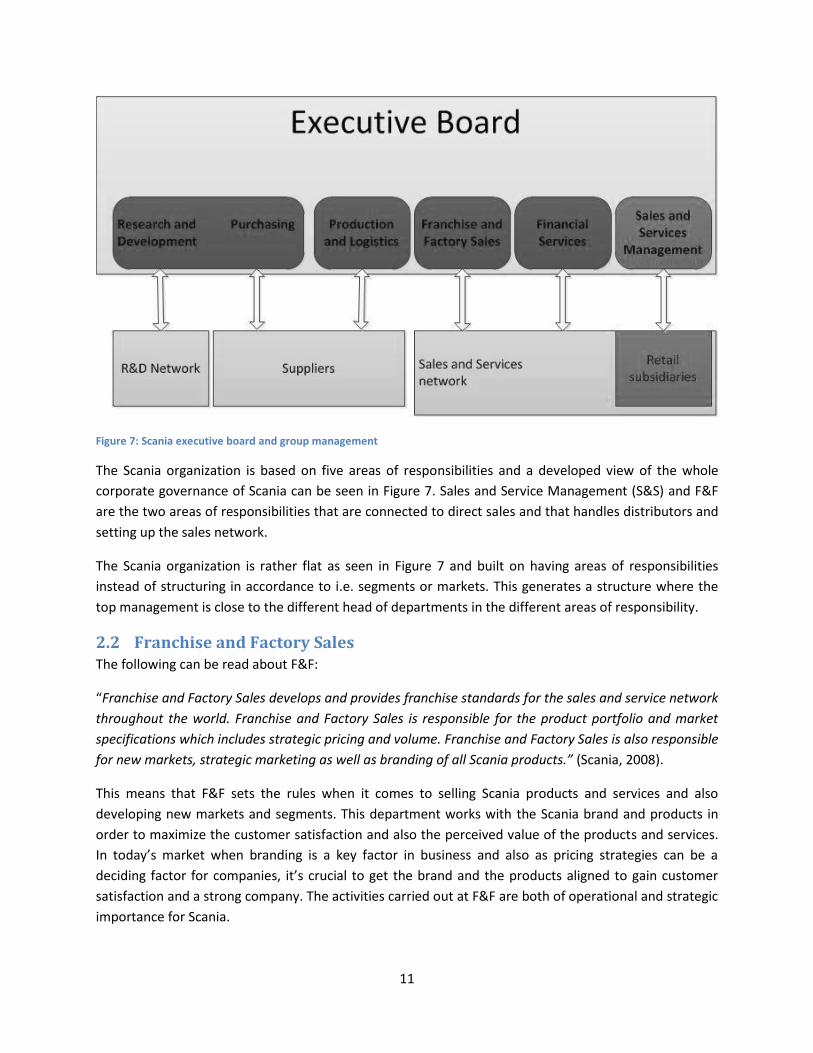
Figure 7: Scania executive board and group management
The Scania organization is based on five areas of responsibilities and a developed view of the whole
corporate governance of Scania can be seen in Figure 7. Sales and Service Management (S&S) and F&F
are the two areas of responsibilities that are connected to direct sales and that handles distributors and
setting up the sales network.
The Scania organization is rather flat as seen in Figure 7 and built on having areas of responsibilities
instead of structuring in accordance to i.e. segments or markets. This generates a structure where the
top management is close to the different head of departments in the different areas of responsibility.
2.2 Franchise and Factory Sales The following can be read about F&F:
“Franchise and Factory Sales develops and provides franchise standards for the sales and service network
throughout the world. Franchise and Factory Sales is responsible for the product portfolio and market
specifications which includes strategic pricing and volume. Franchise and Factory Sales is also responsible
for new markets, strategic marketing as well as branding of all Scania products.” (Scania, 2008).
This means that F&F sets the rules when it comes to selling Scania products and services and also
developing new markets and segments. This department works with the Scania brand and products in
order to maximize the customer satisfaction and also the perceived value of the products and services.
In today’s market when branding is a key factor in business and also as pricing strategies can be a
deciding factor for companies, it’s crucial to get the brand and the products aligned to gain customer
satisfaction and a strong company. The activities carried out at F&F are both of operational and strategic
importance for Scania.

12
Markets with subsidiaries handling distribution of Scania products are called captive markets and
markets without subsidiaries are called non-captive markets. The actual difference between a captive
and a non-captive market is about the distributor set up. A captive market would have a Scania fully
owned distributor and also a developed service point network, a non-captive market would have neither
and generally an external distributor is used. India is referred to as a non-captive market and is a typical
example of a market with many new entrance points for Scania. There are several markets, non-captive
markets, where the possibilities are great and the expectations even higher. The western markets are
not going to be the engine for future growth and the rise and growth of economies in the developing
part of the globe can’t be overseen. All future actors on the global arena need to have a presence in Asia
and other developing countries which makes F&F operations very important. Interesting to see in Table
1 about Asia and the total economy, in 2010 about 12% of the revenue originated from Asia but only
about 2% of the number of employees were placed in the same region, this will probably change in the
close future.
2.3 Scania in India Scania has a presence in over 100 countries and is one of the biggest truck manufacturers in the heavy
truck segment. Scania is perceived as a premium truck brand on established markets, connecting Scania
to good operation economy and status. But in the new markets like India, the Scania brand can be
unknown. This is the case in India where a much better known European common truck brand is Volvo,
though even Volvo hasn’t been hugely successful in truck sales but rather in selling busses. A Volvo bus
is a concept in India and Volvo provides the very highest bus-service and commonly you would state that
you’d either “go by bus or by Volvo”.
Scania operates on the off-road segment with L&T as a distributor since 2008. L&T is a technology,
engineering, construction and manufacturing company (Toubro, 2011). The Scania trucks sold are used
for construction purposes and mainly in mining areas, for removal of debris in coal mines or moving ore.
This is a good segment where there are demands for premium trucks operational in continuous heavy
duty situations, and the Scania trucks have been successful.
Core competence for Scania is truck manufacturing and long haulage heavy trucking is one of the largest
segments. In India, Scania seeks to enter the long haulage segment in the next coming years. In May
2011 Scania established a fully owned subsidiary in India and is now focusing on developing the Indian
market into the on-road segment and developing the service station set-up in India. There is an existing
service station network for off-road applications but now the focus is also on developing for the on-road
transport as well.
One of the most important references in Scania’s development and expansion in markets as India is the
Scania business model, seen in Figure 8, and developing or engaging local resources that understand the
product and its applications (Dahlberg, 2011).

13
Figure 8: The Scania business model
The general strategy when entering into new markets is to step up involvement and thereby gain
incremental understanding of the market. Most western trucking brands have a local partner through
which existing networks can be leveraged.
Scania is now active in the off-road transportation segment through its local partner in India and is
looking to expand into the long hauling segment. Scania is a premium brand in the on-road heavy
transport segment in the world but is relatively unknown in the Indian market. Also, Scania doesn’t want
to establish itself on a market that is not suited for its products or without understanding the customer
demands linked to the Scania products.

14
3 METHODOLOGY The reader is now presented with the basic information about the thesis and also about Scania. As can
be viewed in Figure 9, the next step is to introduce the methods and theories used in order to meet the
purpose of the thesis, “…to analyze the requirements of providers and purchasers of on-road logistic
services in India and the environment in which they operate”. This chapter presents the methods used
for the thesis. It will give a theoretical basis for general research theory and also a presentation of the
theories and methods used.
Figure 9: Structure of the thesis - Methodology
3.1 Research process The research process started with a general question from Scania regarding purchasing logistics services
in India, more specific about the market connected to purchasing long haulage heavy on-road transport.
Scania is a new actor in the Indian market and has a requirement to understand not only the market but
also the business environment connected to on-road transport services operations.
The empirical study consists of three parts:
Initial interviews: Interviews with academia and Scania staff.
Empirical study part 1: Interviews in Sweden with multinational companies having presence and
transport operations in both Sweden and India.
Empirical study part 2: Interviews in India with companies connected to on-road transportation
services in India.
With on-road heavy transport and India as the focus, the authors started by engaging some
academicians in the Industrial Marketing as well as Logistics and Transportation division at Chalmers
University of Technology. This was followed by interviewing Scania employees working with
transportation services and in the F&F division. The interviews gave perspectives on new markets, on
India as a market and some practical tips when conducting an interview series.
The interviews were analyzed and the purpose with research questions was formulated mainly based on
findings from the interviews at Scania. The research questions had a rather wide target area and were
connected to macro perspectives, network perspective and actor level for purchasing transport services
in India, in connection to Figure 3.
At this stage, the foundation and the direction of the thesis were set and the next stage was to
investigate theories and conduct interviews in Sweden. In order to find relevant academic theories, a
literature study was conducted. It targeted theories that would be of use when managing issues
15
connected to new markets, macro perspectives, network and individual actors. Also theories were
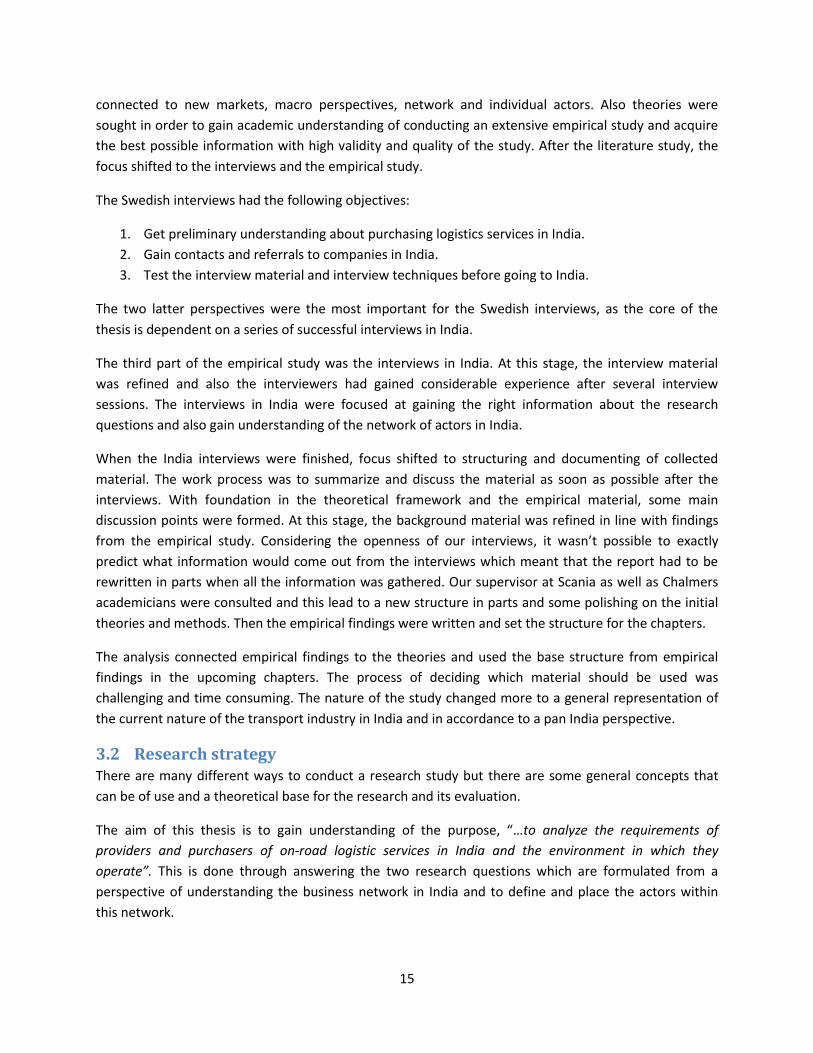
sought in order to gain academic understanding of conducting an extensive empirical study and acquire
the best possible information with high validity and quality of the study. After the literature study, the
focus shifted to the interviews and the empirical study.
The Swedish interviews had the following objectives:
1. Get preliminary understanding about purchasing logistics services in India.
2. Gain contacts and referrals to companies in India.
3. Test the interview material and interview techniques before going to India.
The two latter perspectives were the most important for the Swedish interviews, as the core of the
thesis is dependent on a series of successful interviews in India.
The third part of the empirical study was the interviews in India. At this stage, the interview material
was refined and also the interviewers had gained considerable experience after several interview
sessions. The interviews in India were focused at gaining the right information about the research
questions and also gain understanding of the network of actors in India.
When the India interviews were finished, focus shifted to structuring and documenting of collected
material. The work process was to summarize and discuss the material as soon as possible after the
interviews. With foundation in the theoretical framework and the empirical material, some main
discussion points were formed. At this stage, the background material was refined in line with findings
from the empirical study. Considering the openness of our interviews, it wasn’t possible to exactly
predict what information would come out from the interviews which meant that the report had to be
rewritten in parts when all the information was gathered. Our supervisor at Scania as well as Chalmers
academicians were consulted and this lead to a new structure in parts and some polishing on the initial
theories and methods. Then the empirical findings were written and set the structure for the chapters.
The analysis connected empirical findings to the theories and used the base structure from empirical
findings in the upcoming chapters. The process of deciding which material should be used was
challenging and time consuming. The nature of the study changed more to a general representation of
the current nature of the transport industry in India and in accordance to a pan India perspective.
3.2 Research strategy There are many different ways to conduct a research study but there are some general concepts that
can be of use and a theoretical base for the research and its evaluation.
The aim of this thesis is to gain understanding of the purpose, “…to analyze the requirements of
providers and purchasers of on-road logistic services in India and the environment in which they
operate”. This is done through answering the two research questions which are formulated from a
perspective of understanding the business network in India and to define and place the actors within
this network.
16
3.2.1 Basic terminology of research strategy
According to Bryman and Bell (2011) “A theory is an explanation of observed regularities to explain a
phenomenon.”. They further state about empiricism “A general approach to the study of reality that
suggests that only knowledge gained through experience and the senses is acceptable”. This project uses
two main concepts, literature study and empirical study, where the literature study consists of the
authors reading literature and empirical study is an approach to study reality through gaining knowledge
via interviews.
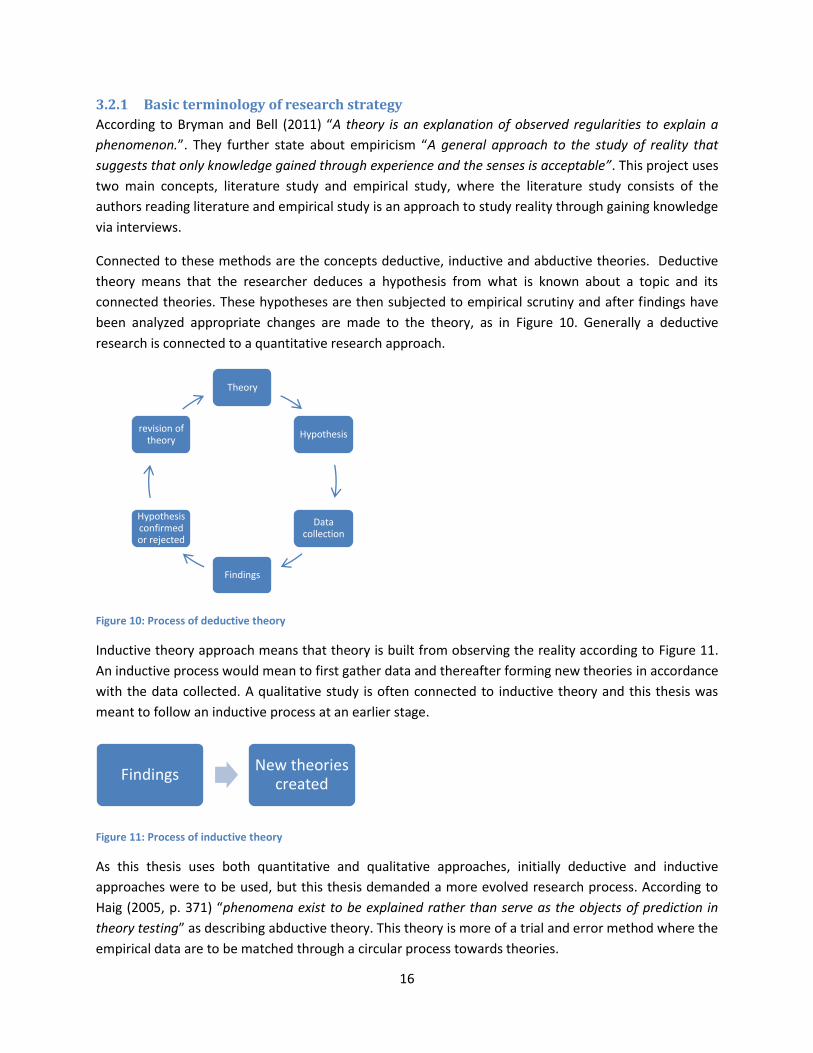
Connected to these methods are the concepts deductive, inductive and abductive theories. Deductive
theory means that the researcher deduces a hypothesis from what is known about a topic and its
connected theories. These hypotheses are then subjected to empirical scrutiny and after findings have
been analyzed appropriate changes are made to the theory, as in Figure 10. Generally a deductive
research is connected to a quantitative research approach.
Figure 10: Process of deductive theory
Inductive theory approach means that theory is built from observing the reality according to Figure 11.
An inductive process would mean to first gather data and thereafter forming new theories in accordance
with the data collected. A qualitative study is often connected to inductive theory and this thesis was
meant to follow an inductive process at an earlier stage.
Figure 11: Process of inductive theory
As this thesis uses both quantitative and qualitative approaches, initially deductive and inductive
approaches were to be used, but this thesis demanded a more evolved research process. According to
Haig (2005, p. 371) “phenomena exist to be explained rather than serve as the objects of prediction in
theory testing” as describing abductive theory. This theory is more of a trial and error method where the
empirical data are to be matched through a circular process towards theories.
Theory
Hypothesis
Data collection
Findings
Hypothesis confirmed or rejected
revision of theory
Findings New theories
created

17
The data found in this thesis was scrutinized and explained through theories rather than being
compared against pre-determined hypothesis or initially determined theories. When the data was
collected it was compared towards possible theories. Further Haig (2005, p. 378) states “…existential
abductions enable us, as researchers, to hypothesize the existence of entities previously unknown to us.”
about abductive theory. A visualization of the abductive theory process can be viewed in Figure 12
below.
Figure 12: Process of abductive theory
With the theories of the research process, the focus shifts to determining the research strategy. There
are several different ways of conducting interviews and gather data, but in order to better understand
the process, some basics are to be set.
Bryman and Bell (2011) writes about two major research strategies, quantitative and qualitative
research. Generally a quantitative study is based on measurements and statistics while a qualitative
study is based on reasoning and understanding. These concepts are central for the structure of the
empirical study connected to this thesis and also for validating the results in the end. Table 2 below
shows the main characteristics of the two research processes (Neill, 2007).
Findings
Theory Matching

18
Qualitative Quantitative
“All research ultimately has a qualitative grounding" -Donald Campbell
"There is no such thing as qualitative data. Everything is either 1 or 0" - Fred Kerlinger
The aim is a complete, detailed description.
The aim is to classify features, count them, and construct statistical models in an attempt to explain what is observed.
Researcher may only know roughly in advance what he/she is looking for
Researcher knows clearly in advance what he/she is looking for.
Recommended during earlier phases of research projects
Recommended during latter phases of research projects.
The design emerges as the study unfolds. All aspects of the study are carefully designed before data is collected.
Researcher is the data gathering instrument. Researcher uses tools, such as questionnaires or equipment to collect numerical data.
Data is in the form of words, pictures or objects. Data is in the form of numbers and statistics.
Subjective - individuals interpretations of events is important, e.g. Uses participant observation, in-depth interviews etc.
Objective seeks precise measurement and analysis of target concepts, e.g. Uses surveys, questionnaires etc.
Qualitative data is more "rich", time consuming, and less able to be generalized.
Quantitative data is more efficient, able to test hypotheses, but may miss contextual detail.
Researcher tends to become subjectively immersed in the subject matter.
Researcher tends to remain objectively separated from the subject matter.
Table 2: Features of qualitative and quantitative research
3.2.2 Theory of qualitative analysis
Quantitative research is based on statistically deducting conclusions and finding validity to conclusions
through a large sample space. In qualitative research on the other hand, the research is based on
making sure that all relevant information is gathered from each interviewee. The situation for utilizing
qualitative research is when the conclusions aren’t clear but the setting is. It is a good model when the
sample space is limited but the target very specific.
The way to approach a qualitative study can be challenging with many aspects to consider, in Table 3 the
main concerns are listed (Neill, 2007). The table provides the reader with an understanding of the
difference of how assumptions are made, the differences in purpose of the mode, the process and the
role of the participants in qualitative and quantitative modes. As stated earlier in the report, the
business network will be an important factor in identifying important parameters when purchasing
logistics services in India. This type of situation is ideal for using a qualitative research approach in trying
to understand the network and the individual actors, as the material can be tweaked during the process
as new information is normally gained during the process.

19
Quantitative Mode Qualitative Mode Assumptions Assumptions
Social facts have an objective reality Reality is socially constructed
Primacy of method Primacy of subject matter
Variables can be identified and relationships measured
Variables are complex, interwoven and difficult to measure
Etics (outside's point of view) Emics (insider's point of view)
Purpose Purpose
Generalibility Contextualization
Prediction Interpretation
Casual explanations Understanding actors' perspectives
Approach Approach
Begins with hypotheses and theories Ends with hypotheses and grounded theory
Manipulation and control Emergence and portrayal
Uses fomal instruments Researcher as instrument
Experimentation Naturalistic
Deductive Inductive
Component analysis Searches for patterns
Seeks consensus, the norm Seeks pluralism, complexity
Reduces data to numerical indices Makes minor use of numerical indices
Abstract language in write-up Descriptive write-up
Researcher Role Researcher Role
Detachment and impartiality Personal involvement and partiality
Objective portrayal Empathic understanding Table 3: Modes of qualitative and quantitative research
Bryman and Bell (2011) suggest a possible framework for a qualitative study which can be viewed in
Figure 13. It is very structured, but as stated earlier the qualitative study is based on being clear about
the goal but not very conscious of the specific conclusions. The method to be used is repetitive and
maintaining the possibility of refining and changing means for solution in the research, which can be
seen in Figure 13: (Stage 5a to 5b).

20
Figure 13: Outline of the main steps of qualitative research
3.2.3 Chosen strategies for thesis
This thesis is set to understand the demand and supply side when purchasing on-road transport services
in India. This is something that can be achieved through interviewing professionals that are in direct
connection to the actual purchases and sales of on-road transportation services. The approach in the
thesis is modeled on the abductive theory. Based on this approach, the parts including the theory and
the findings are worked on simultaneously thus following an iterative approach as depicted in Figure 13.
The empirical information is analyzed in connection to the theories rather than being compared against
hypothesis as explained previously or by creating new theories. This is as defined in the abductive
approach, the theory evolves as new information emerges during the interview sessions.
Most studies similar to this study and in this area of research select the qualitative approach in order to
freely express and analyze ideas arisen from the empirical findings. This facilitates a learning process for
the interviews as there is some leeway in not confining the study from the beginning but being able to
follow each interview to where the best and most valid information might lead. Also there are some
rather specific questions that relate to commonly used parameters when purchasing logistics services
which will be utilizing quantitative methods as part of the qualitative study. The final research process
and the structure of how the empirical research will be carried out can be viewed in Figure 14.
6. Writing up findings/conclusions
5. Conceptual and theoretical work
4. Interpretation of data
3. Collection of relevant data
2. Selecting relevant site(s) and subjects
1. General research questions
5a. Tighter specification of the research question(s)
5b. Collection of further data

21
Figure 14: The chosen empiric research structure
3.3 Research design The first steps of choosing the appropriate methods for this thesis was described in the previous
subchapter and now the focus is to design the research structure as to how the research process be
constructed so that the right information can be gathered in a valid process in each of the individual
cases.
3.3.1 Data collection
The main body of data is the material from empirical study part 2 in India. It is important to make sure
to have the highest possible quality of data and to be able to track the sources of the gathered data.
Other pools of data are from the empiric study part 1, the Swedish interviews and from the initial
interviews when forming a general direction of the thesis. Those perspectives can be used even in the
latter part of the project as the theories are abductively built. These perspectives are important to be
able to follow and that the subjects are clearly presented. The competence of the subjects is of big
importance, but the demands of those pools of data are not as important as the Indian interviews.
3.3.2 How to structure the empirical study
The empirical study is meant to investigate the two research questions through interviewing purchasers
of transport in general and on-road transport in particular, regarding driving factors when purchasing
transport services in India.
The general outline of the report can be viewed in Table 4. Every individual part of the outline is in part
based on the completion of the previous part which emphasizes the need for a rather strict work
process. Previously it has been discussed that the process of the work is circular in its progression and
Abductive process
Qualitative strategy
Qualitative and Quantitative
methods
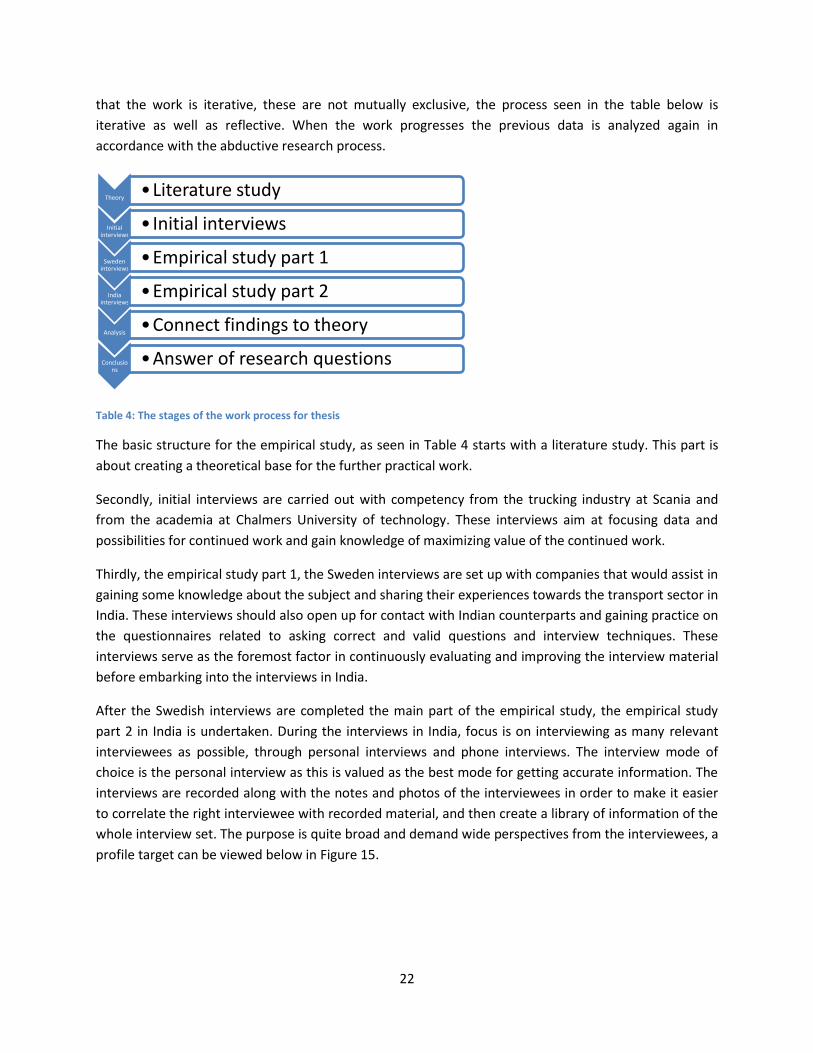
22
that the work is iterative, these are not mutually exclusive, the process seen in the table below is
iterative as well as reflective. When the work progresses the previous data is analyzed again in
accordance with the abductive research process.
Table 4: The stages of the work process for thesis
The basic structure for the empirical study, as seen in Table 4 starts with a literature study. This part is
about creating a theoretical base for the further practical work.
Secondly, initial interviews are carried out with competency from the trucking industry at Scania and
from the academia at Chalmers University of technology. These interviews aim at focusing data and
possibilities for continued work and gain knowledge of maximizing value of the continued work.
Thirdly, the empirical study part 1, the Sweden interviews are set up with companies that would assist in
gaining some knowledge about the subject and sharing their experiences towards the transport sector in
India. These interviews should also open up for contact with Indian counterparts and gaining practice on
the questionnaires related to asking correct and valid questions and interview techniques. These
interviews serve as the foremost factor in continuously evaluating and improving the interview material
before embarking into the interviews in India.
After the Swedish interviews are completed the main part of the empirical study, the empirical study
part 2 in India is undertaken. During the interviews in India, focus is on interviewing as many relevant
interviewees as possible, through personal interviews and phone interviews. The interview mode of
choice is the personal interview as this is valued as the best mode for getting accurate information. The
interviews are recorded along with the notes and photos of the interviewees in order to make it easier
to correlate the right interviewee with recorded material, and then create a library of information of the
whole interview set. The purpose is quite broad and demand wide perspectives from the interviewees, a
profile target can be viewed below in Figure 15.
Theory •Literature study
Initial interviews
• Initial interviews
Sweden interviews
•Empirical study part 1
India interviews
•Empirical study part 2
Analysis •Connect findings to theory
Conclusions
•Answer of research questions
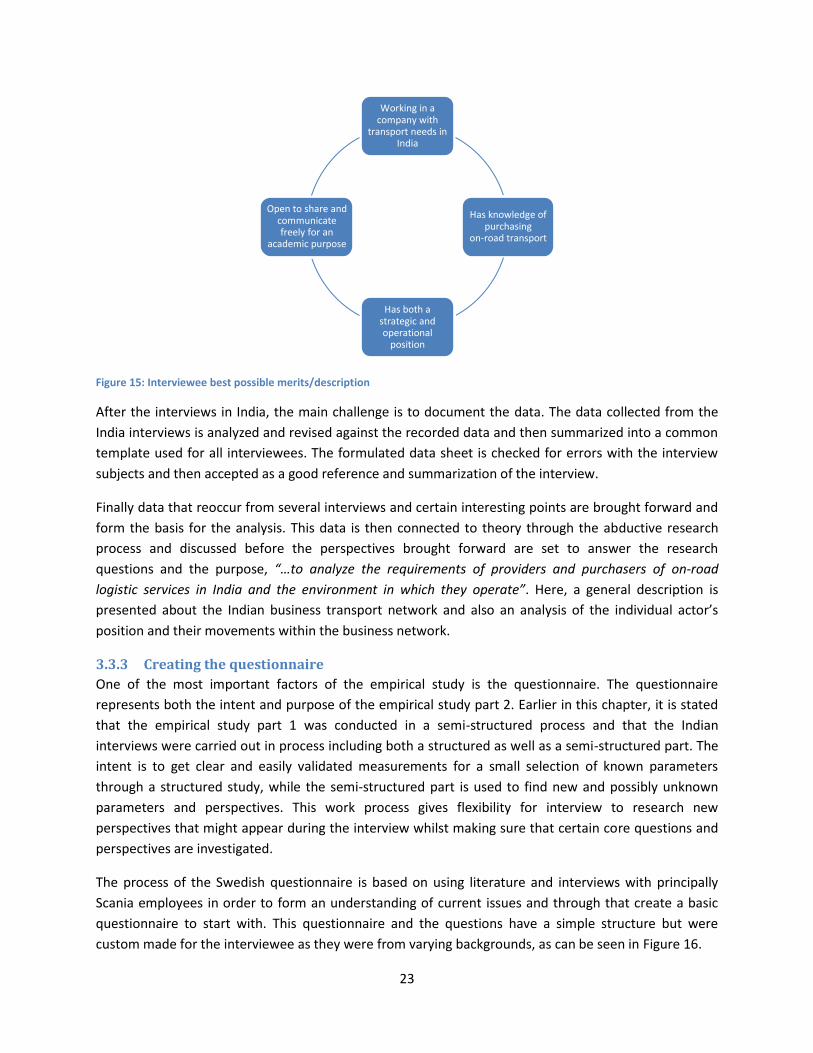
23
Figure 15: Interviewee best possible merits/description
After the interviews in India, the main challenge is to document the data. The data collected from the
India interviews is analyzed and revised against the recorded data and then summarized into a common
template used for all interviewees. The formulated data sheet is checked for errors with the interview
subjects and then accepted as a good reference and summarization of the interview.
Finally data that reoccur from several interviews and certain interesting points are brought forward and
form the basis for the analysis. This data is then connected to theory through the abductive research
process and discussed before the perspectives brought forward are set to answer the research
questions and the purpose, “…to analyze the requirements of providers and purchasers of on-road
logistic services in India and the environment in which they operate”. Here, a general description is
presented about the Indian business transport network and also an analysis of the individual actor’s
position and their movements within the business network.
3.3.3 Creating the questionnaire
One of the most important factors of the empirical study is the questionnaire. The questionnaire
represents both the intent and purpose of the empirical study part 2. Earlier in this chapter, it is stated
that the empirical study part 1 was conducted in a semi-structured process and that the Indian
interviews were carried out in process including both a structured as well as a semi-structured part. The
intent is to get clear and easily validated measurements for a small selection of known parameters
through a structured study, while the semi-structured part is used to find new and possibly unknown
parameters and perspectives. This work process gives flexibility for interview to research new
perspectives that might appear during the interview whilst making sure that certain core questions and
perspectives are investigated.
The process of the Swedish questionnaire is based on using literature and interviews with principally
Scania employees in order to form an understanding of current issues and through that create a basic
questionnaire to start with. This questionnaire and the questions have a simple structure but were
custom made for the interviewee as they were from varying backgrounds, as can be seen in Figure 16.
Working in a company with
transport needs in India
Has knowledge of purchasing
on-road transport
Has both a strategic and operational
position
Open to share and communicate freely for an
academic purpose

24
Figure 16: Structure of the early questionnaire for the empirical study part 1, the Swedish interviews
The empirical study part 1 was different in many perspectives. It was conducted over a longer period of
time and had a major focus of gaining willing participants in India for the next set of interviews. It was
also the testing grounds for the questionnaire and the further study. These perspectives are important
in order to test the interview material before empirical study part 2 and make sure that the
questionnaire used in the India interviews was of highest validity.
3.4 Quality of the empirical study The data collection from the empirical studies is based on a large number of personal interviews. The
interviewers become increasingly competent with every passing interview, and finally at the empirical
study part 2 there had been held a number of interviews already that trained the interviewers in
interview technique according to intent.
The Swedish interviews have been explained previously and the structure of those interviews were
initially to gain understanding of the purpose, “…to analyze the requirements of providers and
purchasers of on-road logistic services in India and the environment in which they operate.”, and then to
both gain contacts and perspectives about the Indian logistics market as well as to gain practice in
conducting interviews and then also in some sense to test out versions of questionnaires. The sessions
were recorded by the interviewers through notes taking during the session and also follow up
questioning through phone or email contact.
The interviews in India were the main focus for the study. The interviewees were contacted and most
interview meetings in India were booked from Sweden prior to the visit. Many other interviews in India
were booked after getting references from some of the interviewees in India. The questionnaires were
set and had the same structure for all interviews. The interviews were recorded through notes taking by
the interviewers and by audio recording of the interview. Some follow up questioning were conducted
through phone contact or mail correspondence.
Providing interviewee information about the thesis
Questions about interviewee
•Personal history
•Work history
Questioning about main field of work and responsibility
Questions about Sweden and India
•Getting the setting in Sweden and India and comparatively issues
Specific questions about the respondents main field of knowledge
Investigating possible contacts in India
Final questions and eventual follow up questions
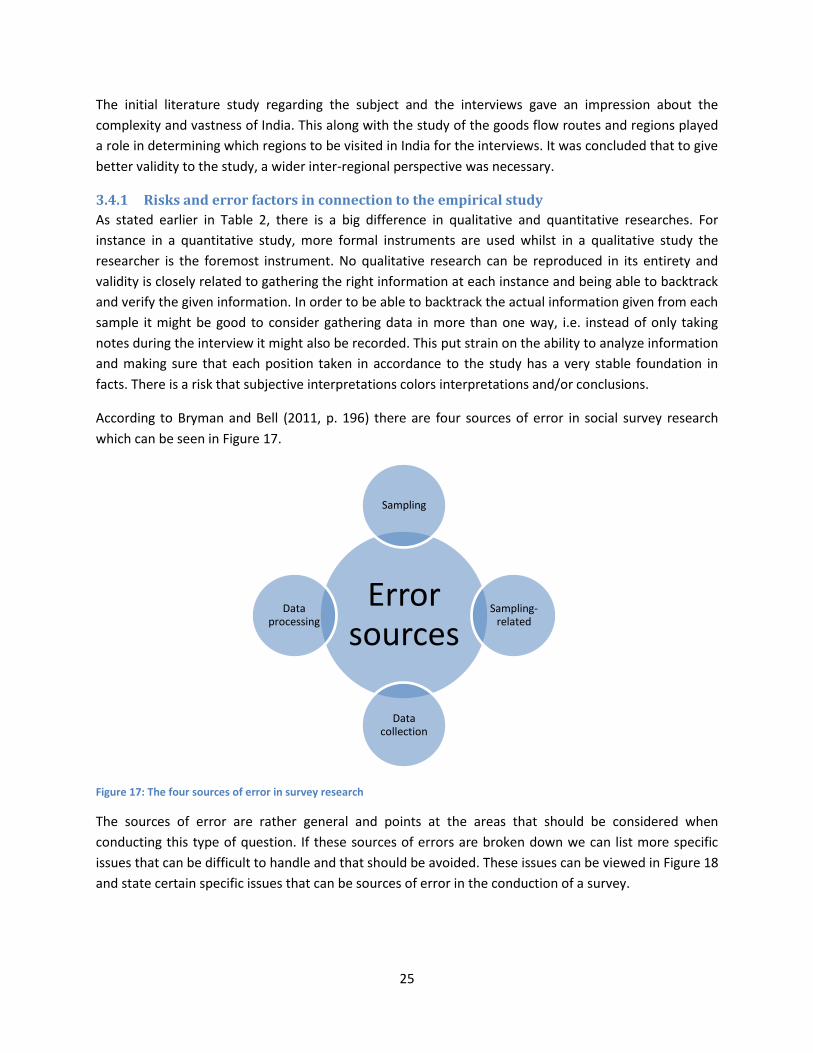
25
The initial literature study regarding the subject and the interviews gave an impression about the
complexity and vastness of India. This along with the study of the goods flow routes and regions played
a role in determining which regions to be visited in India for the interviews. It was concluded that to give
better validity to the study, a wider inter-regional perspective was necessary.
3.4.1 Risks and error factors in connection to the empirical study
As stated earlier in Table 2, there is a big difference in qualitative and quantitative researches. For
instance in a quantitative study, more formal instruments are used whilst in a qualitative study the
researcher is the foremost instrument. No qualitative research can be reproduced in its entirety and
validity is closely related to gathering the right information at each instance and being able to backtrack
and verify the given information. In order to be able to backtrack the actual information given from each
sample it might be good to consider gathering data in more than one way, i.e. instead of only taking
notes during the interview it might also be recorded. This put strain on the ability to analyze information
and making sure that each position taken in accordance to the study has a very stable foundation in
facts. There is a risk that subjective interpretations colors interpretations and/or conclusions.
According to Bryman and Bell (2011, p. 196) there are four sources of error in social survey research
which can be seen in Figure 17.
Figure 17: The four sources of error in survey research
The sources of error are rather general and points at the areas that should be considered when
conducting this type of question. If these sources of errors are broken down we can list more specific
issues that can be difficult to handle and that should be avoided. These issues can be viewed in Figure 18
and state certain specific issues that can be sources of error in the conduction of a survey.
Error sources
Sampling
Sampling-related
Data collection
Data processing
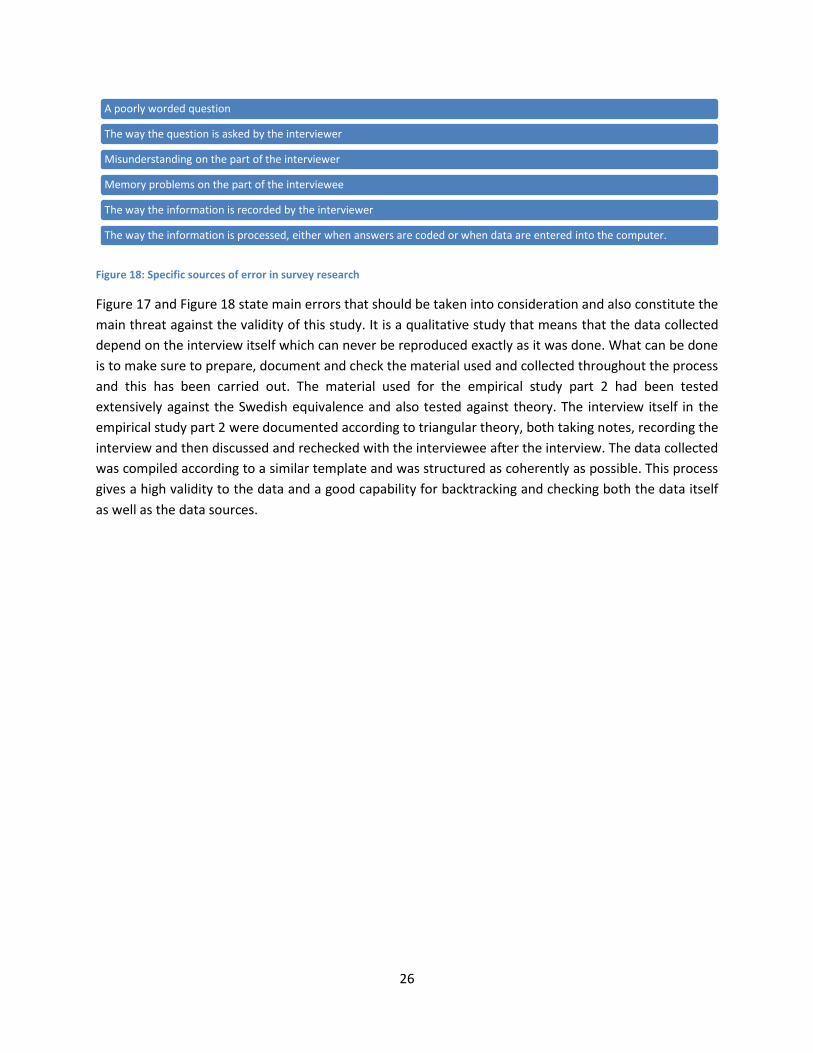
26
Figure 18: Specific sources of error in survey research
Figure 17 and Figure 18 state main errors that should be taken into consideration and also constitute the
main threat against the validity of this study. It is a qualitative study that means that the data collected
depend on the interview itself which can never be reproduced exactly as it was done. What can be done
is to make sure to prepare, document and check the material used and collected throughout the process
and this has been carried out. The material used for the empirical study part 2 had been tested
extensively against the Swedish equivalence and also tested against theory. The interview itself in the
empirical study part 2 were documented according to triangular theory, both taking notes, recording the
interview and then discussed and rechecked with the interviewee after the interview. The data collected
was compiled according to a similar template and was structured as coherently as possible. This process
gives a high validity to the data and a good capability for backtracking and checking both the data itself
as well as the data sources.
A poorly worded question
The way the question is asked by the interviewer
Misunderstanding on the part of the interviewer
Memory problems on the part of the interviewee
The way the information is recorded by the interviewer
The way the information is processed, either when answers are coded or when data are entered into the computer.

27
4 THEORETICAL FRAMEWORK In the theoretical framework, the theoretical basis for further analysis of the purpose “…to analyze the
requirements of providers and purchasers of on-road logistic services in India and the environment in
which they operate” will be presented. This includes theories and facts that are of importance for having
an academic substance for clearly investigating the research questions. This chapter introduces the
reader to the theory of internationalization and the Uppsala Model, which concern how international
companies venture into new markets. Further business network theory will be presented and how
business networks can be analyzed, set-up and structured. Finally the reader will be introduced to
logistics theory, definitions of logistics actors and parameters.
Figure 19: Structure of the thesis – Theoretical framework
4.1 Theory of internationalization Today’s business environment is global in its nature where globalization and internationalization are key
concepts. How to expand business and venture into new markets are key issues for companies and the
theory of internationalization try to explain this process.
Johanson et Al. (1975) provides a study of Swedish companies and their internationalization process.
The study concerns how a couple of large Swedish companies have established themselves on foreign
markets and if there can be any conclusions drawn towards how this process is carried through. The
authors provide a base for a process in four steps which can be seen in Table 5.
Table 5: The four stages of internationalization – The establishment chain
In a later article by Johanson et Al. (1977), a model is presented on how companies handle
internationalization and how this development can be analyzed. They state that companies tend to
gradually internationalize themselves in order to lower risk and also gain market knowledge. Johanson
et Al. (1977, p 2) state “Typically, firms start exporting to a country via an agent, later establish a sales
1 • No regular export activity
2 • Export via independent representative (agent)
3 • Sales subsidiary
4 • Production/manufacturing

28
subsidiary, and eventually, in some cases, begin production in the host country.” in good correlation with
their first article. A basic figure of their model, the basic mechanism of internationalization - State and
change aspects, can be viewed in Figure 20 below.
Figure 20: The Uppsala model - State and change aspects
The model is based on the state and change aspects of internationalization variables. It is a circular
model explaining both the present and coming steps of the company’s internationalization process. The
different states are resource commitment to foreign markets (market commitment) and knowledge of
foreign markets and operations. Change aspects are the decisions to commit resources and the
performance of current business activities (Johanson and Vahlne, 1977).
The internationalization process of firms is a well discussed subject in both theory and. The emerging
markets are growing at a very fast pace and in the future these economies will continue to grow, both in
size and importance, which make them an interesting case for all companies (Natarajan, 2010). The
developing countries will gain in economic and political importance in the future and hold a
considerable part of the world economy. Johanson et Al. (1977) provides the Uppsala model for further
understanding of why and at what stage companies should look for a bigger presence internationally.
Also the model discusses the internationalization process in gaining incremental presence on a market
through several steps. It was found that most companies established themselves on foreign markets
after gaining knowledge of the markets through partners, sales personnel or intermediaries before
setting up their own production unit in the market. The model had a deterministic view and not focusing
too much on relationships and those factors externally from the company, but on the individual actor
and its own development disconnected from others.
The phenomena of how and why companies chose to expand of foreign markets were referred to the
term psychic distance. Psychic distance being defined as “…the sum of factors preventing the flow of
information from and to the market. Examples are differences in language, education, business
practices, culture and industrial development.” (Johanson and Vahlne, 1977, p. 24). Companies are more
inclined to expand into markets where the psychic distance is small, this meaning that if the market can
be understood the chance for a successful expansion into that market increases. The psychic distance
can be, but mustn’t be, connected to actual or physical distance, but generally is more connected to if
there are connections to that market, through intermediaries or business collaborators in the past. An
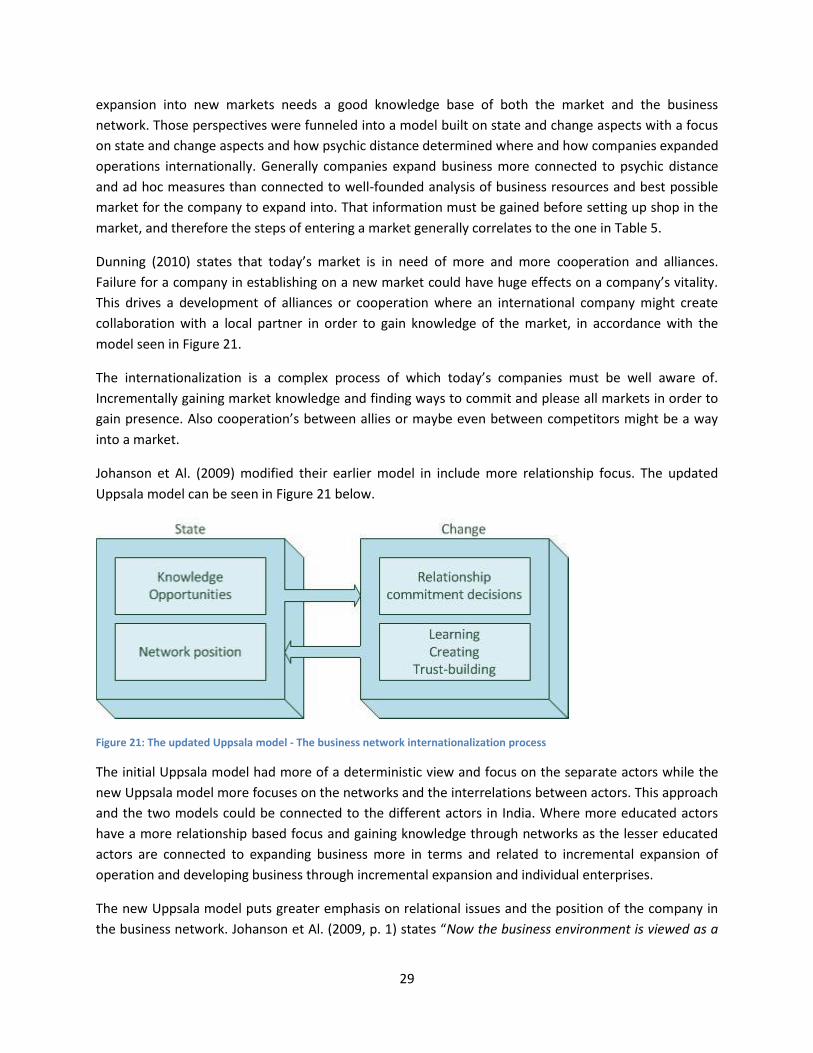
29
expansion into new markets needs a good knowledge base of both the market and the business
network. Those perspectives were funneled into a model built on state and change aspects with a focus
on state and change aspects and how psychic distance determined where and how companies expanded
operations internationally. Generally companies expand business more connected to psychic distance
and ad hoc measures than connected to well-founded analysis of business resources and best possible
market for the company to expand into. That information must be gained before setting up shop in the
market, and therefore the steps of entering a market generally correlates to the one in Table 5.
Dunning (2010) states that today’s market is in need of more and more cooperation and alliances.
Failure for a company in establishing on a new market could have huge effects on a company’s vitality.
This drives a development of alliances or cooperation where an international company might create
collaboration with a local partner in order to gain knowledge of the market, in accordance with the
model seen in Figure 21.
The internationalization is a complex process of which today’s companies must be well aware of.
Incrementally gaining market knowledge and finding ways to commit and please all markets in order to
gain presence. Also cooperation’s between allies or maybe even between competitors might be a way
into a market.
Johanson et Al. (2009) modified their earlier model in include more relationship focus. The updated
Uppsala model can be seen in Figure 21 below.
Figure 21: The updated Uppsala model - The business network internationalization process
The initial Uppsala model had more of a deterministic view and focus on the separate actors while the
new Uppsala model more focuses on the networks and the interrelations between actors. This approach
and the two models could be connected to the different actors in India. Where more educated actors
have a more relationship based focus and gaining knowledge through networks as the lesser educated
actors are connected to expanding business more in terms and related to incremental expansion of
operation and developing business through incremental expansion and individual enterprises.
The new Uppsala model puts greater emphasis on relational issues and the position of the company in
the business network. Johanson et Al. (2009, p. 1) states “Now the business environment is viewed as a

30
web of relationships, a network…” the big difference from the initial model is the importance of
relationships and actor placement. In the original model focus was on the individual actors and their
independent actions. The way companies acted when emerging into the global environment were
analyzed and focus were also very much on larger companies. In the new Uppsala model the network
and relationships between actors are in more focus and also the model can be utilized for both small
and large companies as all companies are part of the network.
In 2011 Johanson et Al. brought forward a study of the Uppsala model in connection to Volvo Trucks and
it’s development into new markets (Johanson et al., 2011), The Uppsala globalization process model
seen in Figure 22 below.
Figure 22: The Uppsala globalization process model
The Uppsala globalization process model is very similar to the updated Uppsala model except for the
box in the upper right corner where the relationship commitment decisions have been altered to
decisions to reconfigure and redesign coordination systems. The basis for the new model is the
broadening of the internationalization process into a process both dependent on internationalization
but also of globalization. Johanson et Al. (2011, p. 2) state “Internationalization is usually seen as having
two dimensions: geography and mode of operation.” and “…globalization has two other dimensions:
configuration and coordination.”. Johanson et Al. (2011, p. 2) further state “Just as the
‘‘internationalization process’’ is a process of transition from national, to international, to multinational
company, the ‘‘globalization process’’ may be the transition from a multinational company to a global
one, optimizing globally regardless of what sort of strategy that implies.”
The Uppsala globalization process model puts emphasis on the relationship dynamics and how the
business network plays into the internationalization and globalization process of a company. It’s about
the way internal and external resources are used and how coordination resources are utilized in order to
successfully grow and prosper as a company.
The development of the Uppsala model can be connected to the development in the market, in an
earlier age of internationalization the initial Uppsala model was valid but the business network and the
importance of relationships has increased and so companies today must be more aware of that
development as well. In the new Uppsala model not only the performance of the company itself is
considered but the performance of the whole network. In today’s market, companies utilize their

31
network in order to gain knowledge and might not only focus on their own performance and build an
own organization for expansion purposes. Instead the company gain knowledge through partnerships
and collaboration in a more developed way and network position also becomes an important issue. The
development and the view of the development of the new Uppsala model can be related to the
development of the new markets. Still in new markets there are some of the perspectives from the
initial Uppsala model, but the general tendency of the market is more in accordance with the new
Uppsala model. The revised Uppsala globalization process model takes into account both
internationalization perspectives as well as globalization perspectives. With the revised Uppsala model
Johanson et Al. has broadened from the initial internationalization process to a more holistic process
involving configuration and coordination issues.
4.2 Industrial Network Approach One of the research questions in the thesis is to understand the setup of the network of actors in
logistics in India focusing on-road transport. While writing the background for the thesis and during our
interaction with companies in Sweden and in India, it felt that a network perspective was more relevant
rather than having a focus only on individual industry chains and actors. The theory in the Industrial
Network approach is a good way to identify the situation of the networks in India and their relevance in
the Indian logistics industry. During the research, we focus on the finding suitable theories linking to the
relations between actors, their relative positions and a theoretical network model.
The Network Approach is a model developed by the International Marketing and Purchasing (IMP)
group. The model was developed under the stream of research carried out by IMP over the past 20
years (Brito, 2001).
Turnbull (1996) has traced the theory and development of the IMP group where the early research was
mainly based on dyadic relationships and which later evolved into more of a network study due to the
understanding developed that the study of dyadic relationships could never be understood in isolation
from the other relationships between parties and from the effects of relationship that surrounded them
in a wider network.
4.2.1 Business relationship
Before the network model is understood, it is important to understand what constitutes a business
relationship. The point of departure for the network model is that business relationships are outcomes
of interaction processes where two sides try to influence one another. These interactions develop over
time in a stepwise manner and include technical, financial and social elements. Products, operations,
and other technical attributes are successively adapted in these processes. The people involved develop
relationships in which the presence or absence of trust is of crucial importance to the nature and
development of relationship. Finally the parties constantly strive to develop joint working methods and
operations that improve economic efficiency (Håkansson and Gadde, 2001).
A relationship between two companies has a profile in terms of activity links, resource ties and actor
bonds. These three terms can be defined as the three layers of substance in a relationship. These three
layers of substance can be taken as three different effect parameters that are determinants of the

32
values involved in a relationship and thus of its outcome. They add up to a relationship. A relationship
between two companies can be characterized by the relative importance of the three layers. This ARA-
model is depicted in Figure 23 below (Håkansson and Snehota, 1995).
Figure 23: The ARA-model
In the activity layer, a relationship is built up of activities that connect, more or less closely, various
internal activities of the two parties. The activity links affect the outcomes of the relationship for the
parties. As a relationship develops, certain activities including technical, administrative, commercial and
other activities become related to each other and many activities are undertaken by either of the
companies. These activities link up a number of other activities in the companies and overtime the
activity structures of the two companies are needed to be adapted and the interaction activities are
needed to be modified and adjusted. Thus, as the activities get linked, there is a need for coordination
as this has consequences for both costs and effectiveness of the activities. A business relationship is thus
a link in what might be conceived as an activity chain in which activities of several companies in a
sequence are linked to each other. These links are affected by the development of new relationships,
activity linkages changes and by changes in the activity pattern elsewhere in the chain.
Secondly, there is a resource layer. As a relationship develops, it can connect various resource elements
needed and controlled by two companies. A relationship can tie together resources leading to various
degrees of resource ties. As a relationship makes various resource elements such as technological,
material, knowledge resources and other intangibles accessible for the parties it also constitutes a
resource that can be used and exploited. A resource tie result from how the relationship has developed
and represents in itself a resource for a company.
Thirdly, there is an actor layer. As a business relationship develops, actors become connected. Bonds
between actors are established which affect how the actors perceive, evaluate and treat each other. The
relationship accounts for three different functions, the first being the effect on the dyad that originates
at the conjunction of the two actors. The second is the effect on the individual actors, their internal
elements and other relationships and the third is the effect of other relationships in the wider network
on the dyadic relationship and vice versa. These three functions are tightly woven into one another
(Håkansson and Snehota, 1995).
Actors
Resources Activities
Network
33
It is the intermediary actors within an industry who link the producers of goods to their consumers. Even
within the transportation industry, it is the logistics actor who connects the manufacturing company to
the customers. The actor is central to the role of intermediation. The role of intermediation and the
actors along with the industrial network model is studied next.
4.2.2 Intermediation and actors
An Intermediary can be defined as an actor between other firms. There can be two types of
intermediaries. The intermediaries referred to as merchant middlemen or merchant wholesalers are the
ones who buy from the producers, take the title of the goods and then resell it. There are intermediaries
referred to agents or broker middlemen who do not take title of the goods. The intermediaries have
four major functions namely, reduction of business ties, scale advantages, task and skill specialization
and risk distribution. The reduction in business ties can be achieved by reducing the number of business
transactions and the costs associated with them. Scale advantages occur when the available capacity is
much larger for a single firm to operate and an intermediary engages this capacity thereby by gaining
improved efficiency and distributing the benefits in the system. Transportation facilities, reloading
centers are examples where scale advantages can be gained. Tasks and skill specialization can be in
terms of certain tasks like finance or warehousing operations. Specialization can also mean that an
intermediary focuses on specific products, services or customers different from those the manufacturer
is concerned with. The final function is that of risk sharing, where the intermediary owns a part of the
risk, hedges or eliminates the risk through control of the operating situation (Sundquist, 2011).
One of the issues related to intermediation is the positioning of individual actors in relation to their
activities and resources. This is discussed in the next paragraph.
4.2.3 Positioning of actors
“A position is determined in terms of what activities to conduct within the firm and what resources to
control through ownership” (Sundquist, 2011, p. 40). The firms today are becoming more specialized by
focusing on a limited number of activities. This specialization of activities provides a need for integration
somewhere else. The internal organizing of a firm may have to adjust in relation to what is located in the
other side of the firm boundary. Specialization leads to outsourcing and outsourcing leads to loss in
control over some resources. This leads to dependence on other companies and may result in ownership
issues. Inter dependence between actors may resolve many ownership issues. According to Sundquist
(2011), by analyzing the intermediation of activities, resources and actors, important issues are revealed
that cannot be originated from the ownership borders. An intermediary not only connects the
manufacturer to the customer but also about activities and resources that become intermediated.
At a specific point in time, any actor has a certain position in terms of the activities undertaken within
the firm and the resources controlled through ownership. This position is formed through the
interaction with important counterparts. However, any actor is constantly involved in efforts to improve
this position, thus enhancing favorable aspects and reducing unfavorable conditions (Håkansson and
Gadde, 2001).

34
4.2.4 Network model
As written earlier, firms do not act alone in the market and they have to interact with various other
actors and organizations such as government departments, associations and regulatory commissions
which may lead to development of relations overtime. One network model was developed by Brito
(2001) based on a research project on the wine industry.
Brito (2001) describes the interactive behavior as a cumulative process where relationships are created
and developed to guarantee firms’ control over resources, selling of their output and the pursuit of their
objectives.
Brito (2001) writes that traditionally, the network approach has been considered as a flat two
dimensional model. The first dimension is the vertical relationships, i.e. the relationships between the
suppliers, customers and customers’ customers (Ford et al., 1998). The second dimension is the
horizontal relationships, i.e. the relationships between the competitors (Araujo and Mouzas, 1997).
These two dimensions form the economic network as shown in Figure 24 (Brito, 2001).
Figure 24: The three dimensional model of industrial networks
As parties try to compete with each other for acquiring resources and gaining control within the
network, organizations may also develop an activity for gaining collective benefits by acquiring
resources from the contributions of their members and in the process forming a ‘Collective Actor’. From
an inter organizational point of view, a collective actor is a net of relationships created in order to cope
with a collectively perceived and shared issue (Brito, 2001).
35
The impact of the collective actors on individual actors and their strategies, the structure of
relationships and the balance of power within industrial networks will depend on how effectively the
members are able to associate, align and move in the same direction a number of different elements
and how they can intervene, stabilize or change the linkages and associations that constitute the
network’s structures. The strength of a collective actor depends on its capacity to collectively interpret
issues, to align interests, and to intervene or, quite often, to interrupt others’ interventions, Brito (2001)
calls this a ‘collective action perspective’.
The existence of the collective actors and the relationships surrounding them introduces a new
relational dimension to the traditional network approach model: ‘the institutional relationship’ as shown
in the figure. Thus the network model is now extended to a three dimensional model. The network
model considered in this study is based on this three dimensional network model developed by Brito
(2001).
According to this network model, there are three components which can induce changes within the
network resulting in a series of equilibriums and disequilibria within the network. The components are
listed below:
The distribution of power between individual actors
The distribution of power between their respective representative bodies
The interaction process involving both individual and collective actors
Thus, the interaction which involves individual relationships in the economic network as shown in the
figure above, the institutional relationships i.e. the relationships within, across the collective actors and
individual actors along with a multiplicity of issues affects the overall industrial network.
Institutional relationships must be regarded both as network structuring tolls and sources of change.
They are network structuring tools in as much as they affect the processes and structure of industrial
networks. They are sources of change because they are likely to give rise to imbalances that, being the
outcome of a process of equilibriums and disequilibria, tend to permanently create the conditions for
alteration, transformation and movement (Brito, 2001).
4.3 Logistics theory Logistics is a collective term for the activities aiming at positioning material and products at the right
place at the right time and in the correct quantity. It can involve planning, organizing and controlling
flows of materials aiming at delivering a good service considering cost and other implicating factors
connected to creating time- and place-benefits for goods (Mattsson, 2004).
Supply Chain Management originates from the challenges connected to logistics, or the movement of
goods and materials from point to point. For a long time supply chain was generally seen as means of
logistics management and only in recent decades has the area of supply chain management grown and
come to include more services than the basic transportation of goods and materials (Ellram and Carr,
1994). Today, logistics is perceived as a part of supply chain management and remains one of the most
important activities.

36
Conducting transport of materials and goods from one point to another can be evaluated in many
different ways and there are many parameters that can be used for evaluating transport services, but
the main parameters commonly used will here be described a little more in details.
4.3.1 Parameters for evaluating logistic service performance
A transport is conducted by moving goods or materials between point A to point B, the time taken to
conduct this transport is called lead time. The lead time is one of the most important parameters for
evaluating a transport service as it pinpoints to the transport time capability of the transport provider.
The capability of being able to conduct a transport of goods or materials according to pre-set conditions
according to time is referred to as delivery precision (Mattsson, 2004). Transporters that can perform a
transport according to pre-set time terms will have a good delivery precision and that parameter can be
used by transport service purchasers in order to rank transport service providers. There is a big
difference between being able to offer short lead times and being able to attain a good delivery
precision and in different scenarios the latter can be more desirable.
Environmental consideration is a topic of growing importance and the impact of purchasing decisions on
the environment is increasingly affecting the consumer behavior. This trend has not been a major factor
affecting transport providers in any larger scale today, but as the topic becomes more relevant, for
many parts of the global economy, the environmental impact of transport service decisions will also
reach the transport industry in the near future. The transport industry in Sweden stands for 31% of total
CO2 emissions and in India this figure is probably much higher (Naturvårdsverket, 2012). Environmental
consideration is a holistic parameter that signifies in what extent the conducted transport has an impact
on the environment. This parameter might be very difficult to target and clearly rate, but the purpose of
the parameter is to find out whether environmental considerations are taken when purchasing and
providing transport services.
As stated in the beginning of this subchapter, there are many ways of evaluating a transport service, but
the aspects brought forward earlier show the general parameters that are typically used in the context
of evaluating logistics services. The price of a certain service is vital while doing business, but there can
be a big difference to the actual cost configured and that should be taken into consideration. The way a
transport service is conducted must be evaluated in relation to time and place, usually connected to
delivery precision and also lead time of transport. A short lead time mean that the transporter has the
capability of delivering quickly, but that doesn’t have to mean that the precision is good and in sync with
the operation. Environmental aspects are connected to the impact that transportation has on the
environment, not only to local, regional but also to the global aspects. These aspects can be difficult to
clearly understand but this is an area that is growing in importance and this where companies could
deliver extra value to the client.
4.3.2 Mature and immature markets
According to the Oxford English Dictionary, a market is defined as “A place at which trade is conducted.”
(Dictionary, 2012). The market is the place where actors, resources and activities are interacting and
trade is conducted (Håkansson and Snehota, 1995). This set-up has been analyzed previously with a
37
focus on the business network and now it will be classified in a simplified manner. In order to compare
markets within this study, some simplifications are made. In this case, the market is defined on the basis
of the defined actor capabilities active in that specific market. In a market, the buyer generally has a
strong position and the service providers try to meet the demands of the buyer in order to gain sales.
This means that a market is as good as the buyers acting on said market.
In a market where the customer is well educated about logistics operations and cost structures and
supply chain, the market will demand more advanced logistic services and the quality of the services
provided in the market will get incrementally better. The customer has a good understanding of cost
structure and will therefore understand that a transport service with lower price might lead to a lower
quality of the logistical services which could lead to increased costs in other parts of the supply chain.
There is a relation between cost of a service and the value it brings to the organization (Hines et al.,
2004) and that relation is used here as price of a service and the cost it brings to the whole organization.
In a market where the customer isn’t well educated in cost structures and doesn’t have a clear
understanding of cost and price relation connected to logistics services, the market will lack demand for
advanced logistical services. This might lead to focus on very specific parameters in order for the market
to classify service providers in the market, i.e. demand for low price of service, short lead time etc.
Demanding a better service from providers is natural but a less educated buyer might put a lot of focus
on individual parameters and lack the understanding of weighing different situations against different
parameters. If a high value product is to be transported then it might be better to demand a high quality
transport solution in order to counter possible damages to the product and then a higher price of
service might be defensible. In a situation where a low value product is to be transported on the other
hand the cheapest transport provider might be the right one.
A market consisting of well-educated and informed logistics service purchasers would here be defined as
a mature market. The market in mature enough to understand the difference between cost and price
and would consist by all varieties of logistic service providers, from the best and most expensive to the
average and more cheap logistics service providers. In the case of a market consisting of low educated
logistics service purchasers on the other hand would operate in the opposite circumstances and would
be defined as an immature market.
4.3.3 Localization
Different markets have different capabilities and tools available for ARA interrelations. Different markets
have different challenges and possibilities. Comparing a market such as the Indian market to the
Swedish market brings out a lot of differences. The term localization describes the situation when
business in a certain market is dependent on first-hand information of local circumstances. This
information could be gathered directly through direct placement in the certain area of interest or by
local partners in that said area.
A localized market lacks in enabling efficient trading processes as local partners, having best quality of
information, would be premiered in correlation to other actors being discriminated by the distance.
Koopmans (1957) describe a market with perfect competition where price of service is set through

38
perfect competition between actors, but in a localized market this trend would not be possible. This is
because the price isn’t only set on the grounds of who has the best product but also on other
uncommon factors affecting the market.
A market with a localization tendency is a market where the actors have to be present physically or
through partners in order to be able to compete for business in that market. This leads to inequalities on
the market that leads to uneven competition between actors on basis of placement on the market.
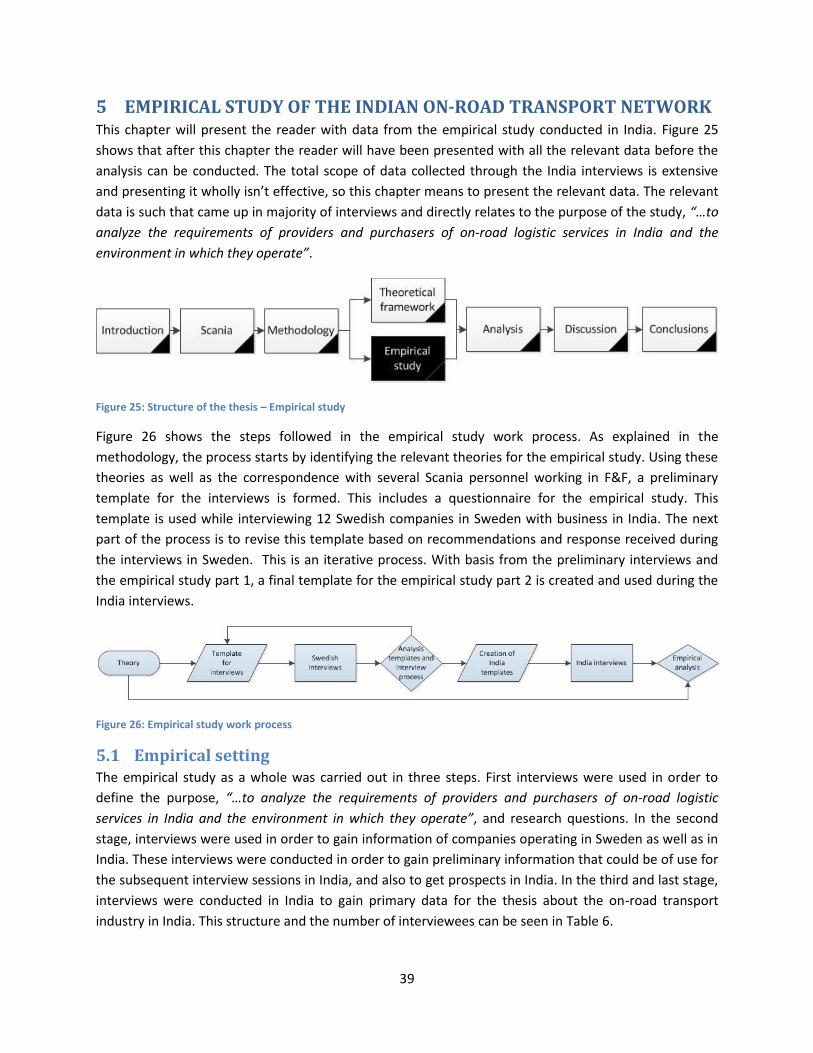
39
5 EMPIRICAL STUDY OF THE INDIAN ON-ROAD TRANSPORT NETWORK This chapter will present the reader with data from the empirical study conducted in India. Figure 25
shows that after this chapter the reader will have been presented with all the relevant data before the
analysis can be conducted. The total scope of data collected through the India interviews is extensive
and presenting it wholly isn’t effective, so this chapter means to present the relevant data. The relevant
data is such that came up in majority of interviews and directly relates to the purpose of the study, “…to
analyze the requirements of providers and purchasers of on-road logistic services in India and the
environment in which they operate”.
Figure 25: Structure of the thesis – Empirical study
Figure 26 shows the steps followed in the empirical study work process. As explained in the
methodology, the process starts by identifying the relevant theories for the empirical study. Using these
theories as well as the correspondence with several Scania personnel working in F&F, a preliminary
template for the interviews is formed. This includes a questionnaire for the empirical study. This
template is used while interviewing 12 Swedish companies in Sweden with business in India. The next
part of the process is to revise this template based on recommendations and response received during
the interviews in Sweden. This is an iterative process. With basis from the preliminary interviews and
the empirical study part 1, a final template for the empirical study part 2 is created and used during the
India interviews.
Figure 26: Empirical study work process
5.1 Empirical setting The empirical study as a whole was carried out in three steps. First interviews were used in order to
define the purpose, “…to analyze the requirements of providers and purchasers of on-road logistic
services in India and the environment in which they operate”, and research questions. In the second
stage, interviews were used in order to gain information of companies operating in Sweden as well as in
India. These interviews were conducted in order to gain preliminary information that could be of use for
the subsequent interview sessions in India, and also to get prospects in India. In the third and last stage,
interviews were conducted in India to gain primary data for the thesis about the on-road transport
industry in India. This structure and the number of interviewees can be seen in Table 6.
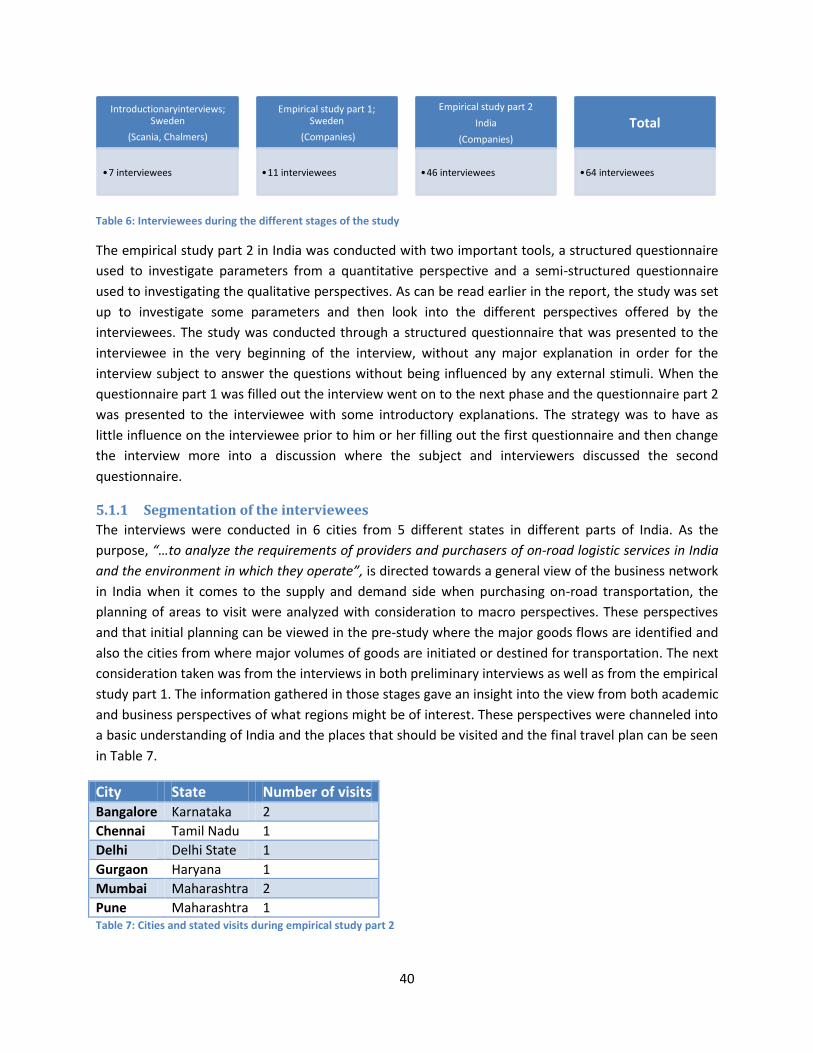
40
Table 6: Interviewees during the different stages of the study
The empirical study part 2 in India was conducted with two important tools, a structured questionnaire
used to investigate parameters from a quantitative perspective and a semi-structured questionnaire
used to investigating the qualitative perspectives. As can be read earlier in the report, the study was set
up to investigate some parameters and then look into the different perspectives offered by the
interviewees. The study was conducted through a structured questionnaire that was presented to the
interviewee in the very beginning of the interview, without any major explanation in order for the
interview subject to answer the questions without being influenced by any external stimuli. When the
questionnaire part 1 was filled out the interview went on to the next phase and the questionnaire part 2
was presented to the interviewee with some introductory explanations. The strategy was to have as
little influence on the interviewee prior to him or her filling out the first questionnaire and then change
the interview more into a discussion where the subject and interviewers discussed the second
questionnaire.
5.1.1 Segmentation of the interviewees
The interviews were conducted in 6 cities from 5 different states in different parts of India. As the
purpose, “…to analyze the requirements of providers and purchasers of on-road logistic services in India
and the environment in which they operate”, is directed towards a general view of the business network
in India when it comes to the supply and demand side when purchasing on-road transportation, the
planning of areas to visit were analyzed with consideration to macro perspectives. These perspectives
and that initial planning can be viewed in the pre-study where the major goods flows are identified and
also the cities from where major volumes of goods are initiated or destined for transportation. The next
consideration taken was from the interviews in both preliminary interviews as well as from the empirical
study part 1. The information gathered in those stages gave an insight into the view from both academic
and business perspectives of what regions might be of interest. These perspectives were channeled into
a basic understanding of India and the places that should be visited and the final travel plan can be seen
in Table 7.
City State Number of visits Bangalore Karnataka 2
Chennai Tamil Nadu 1
Delhi Delhi State 1
Gurgaon Haryana 1
Mumbai Maharashtra 2
Pune Maharashtra 1 Table 7: Cities and stated visits during empirical study part 2
Introductionaryinterviews; Sweden
(Scania, Chalmers)
•7 interviewees
Empirical study part 1; Sweden
(Companies)
•11 interviewees
Empirical study part 2
India
(Companies)
•46 interviewees
Total
•64 interviewees

41
The interviews took place in three major industrial areas of India being North (Delhi/Gurgaon), West
(Mumbai/Pune) and South (Chennai/Bangalore). These regions are the major manufacturing hubs in
India with most of the manufacturing activity in the country. As the major part of goods in India is
produced here and also as there are many big cities in the vicinity, these regions contain both major
production and consumption forces. In order to get a better understanding of the geography and where
the regions are situated, the visited areas from Table 7 is marked as stars in Figure 27 below.
Figure 27: Regions in India considered for interviews
The interviewees were from five major actor groups defined by the authors as:
Manufacturing company
3PL
Agent
Transport company
Other
The definitions of the different actor group have been mentioned in earlier chapters but the actor
groups used for this study have been defined by the authors and they can be found in Terms and
abbreviations.
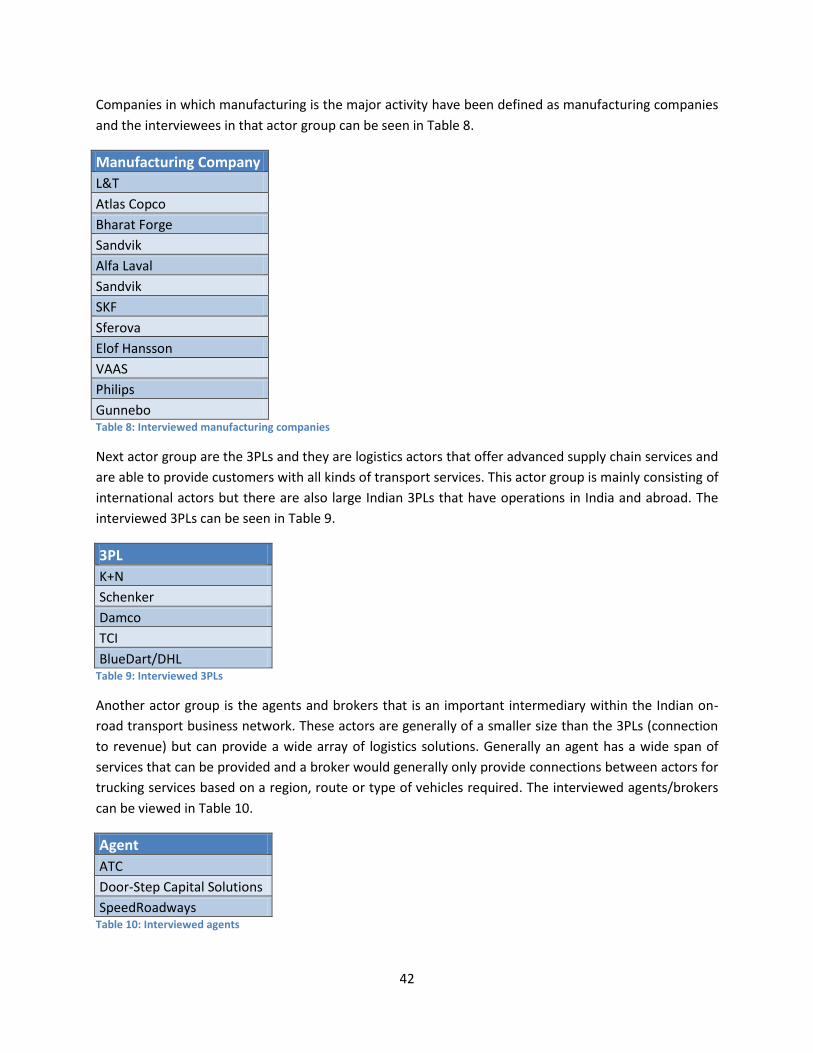
42
Companies in which manufacturing is the major activity have been defined as manufacturing companies
and the interviewees in that actor group can be seen in Table 8.
Manufacturing Company
L&T
Atlas Copco
Bharat Forge
Sandvik
Alfa Laval
Sandvik
SKF
Sferova
Elof Hansson
VAAS
Philips
Gunnebo Table 8: Interviewed manufacturing companies
Next actor group are the 3PLs and they are logistics actors that offer advanced supply chain services and
are able to provide customers with all kinds of transport services. This actor group is mainly consisting of
international actors but there are also large Indian 3PLs that have operations in India and abroad. The
interviewed 3PLs can be seen in Table 9.
3PL
K+N
Schenker
Damco
TCI
BlueDart/DHL Table 9: Interviewed 3PLs
Another actor group is the agents and brokers that is an important intermediary within the Indian on-
road transport business network. These actors are generally of a smaller size than the 3PLs (connection
to revenue) but can provide a wide array of logistics solutions. Generally an agent has a wide span of
services that can be provided and a broker would generally only provide connections between actors for
trucking services based on a region, route or type of vehicles required. The interviewed agents/brokers
can be viewed in Table 10.
Agent
ATC
Door-Step Capital Solutions
SpeedRoadways Table 10: Interviewed agents
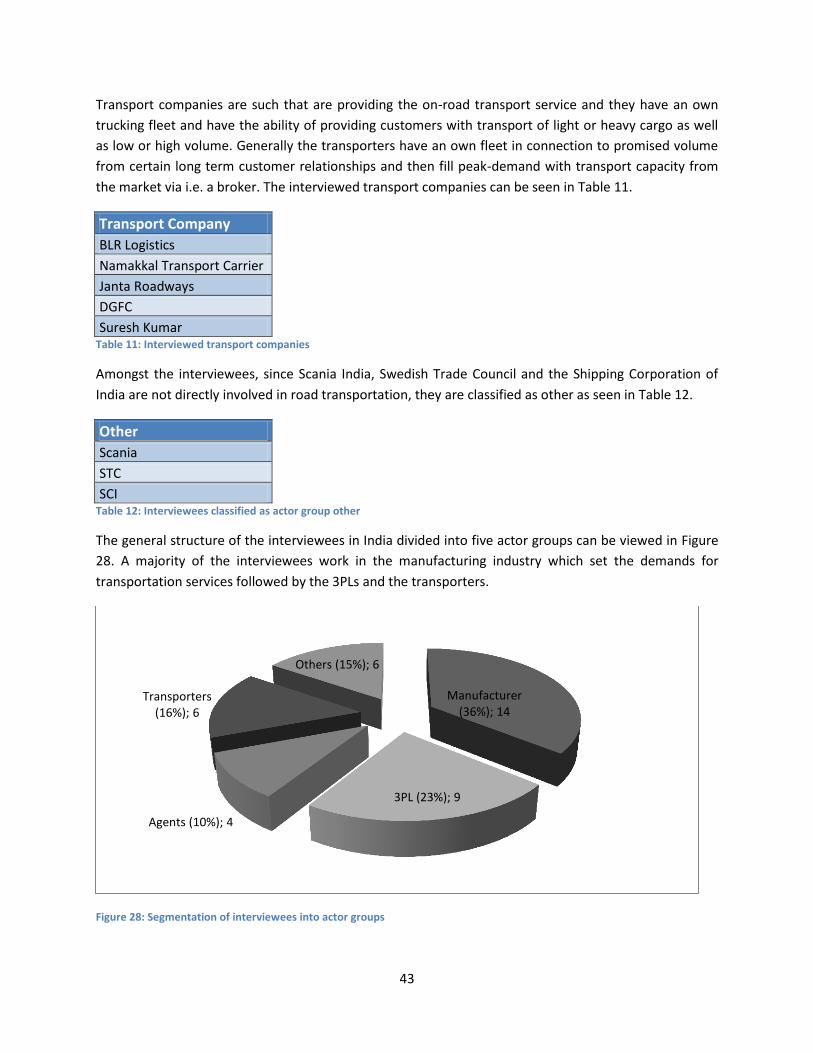
43
Transport companies are such that are providing the on-road transport service and they have an own
trucking fleet and have the ability of providing customers with transport of light or heavy cargo as well
as low or high volume. Generally the transporters have an own fleet in connection to promised volume
from certain long term customer relationships and then fill peak-demand with transport capacity from
the market via i.e. a broker. The interviewed transport companies can be seen in Table 11.
Transport Company
BLR Logistics
Namakkal Transport Carrier
Janta Roadways
DGFC
Suresh Kumar Table 11: Interviewed transport companies
Amongst the interviewees, since Scania India, Swedish Trade Council and the Shipping Corporation of
India are not directly involved in road transportation, they are classified as other as seen in Table 12.
Other
Scania
STC
SCI Table 12: Interviewees classified as actor group other
The general structure of the interviewees in India divided into five actor groups can be viewed in Figure
28. A majority of the interviewees work in the manufacturing industry which set the demands for
transportation services followed by the 3PLs and the transporters.
Figure 28: Segmentation of interviewees into actor groups
Manufacturer (36%); 14
3PL (23%); 9
Agents (10%); 4
Transporters (16%); 6
Others (15%); 6
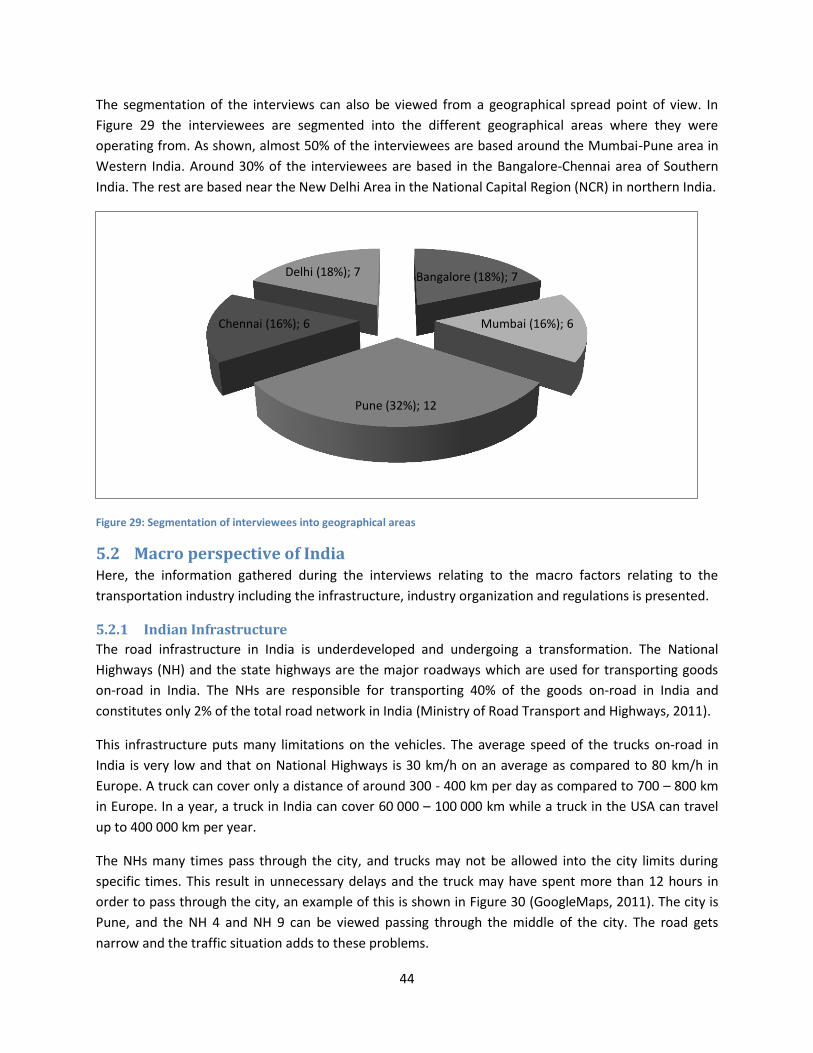
44
The segmentation of the interviews can also be viewed from a geographical spread point of view. In
Figure 29 the interviewees are segmented into the different geographical areas where they were
operating from. As shown, almost 50% of the interviewees are based around the Mumbai-Pune area in
Western India. Around 30% of the interviewees are based in the Bangalore-Chennai area of Southern
India. The rest are based near the New Delhi Area in the National Capital Region (NCR) in northern India.
Figure 29: Segmentation of interviewees into geographical areas
5.2 Macro perspective of India Here, the information gathered during the interviews relating to the macro factors relating to the
transportation industry including the infrastructure, industry organization and regulations is presented.
5.2.1 Indian Infrastructure
The road infrastructure in India is underdeveloped and undergoing a transformation. The National
Highways (NH) and the state highways are the major roadways which are used for transporting goods
on-road in India. The NHs are responsible for transporting 40% of the goods on-road in India and
constitutes only 2% of the total road network in India (Ministry of Road Transport and Highways, 2011).
This infrastructure puts many limitations on the vehicles. The average speed of the trucks on-road in
India is very low and that on National Highways is 30 km/h on an average as compared to 80 km/h in
Europe. A truck can cover only a distance of around 300 - 400 km per day as compared to 700 – 800 km
in Europe. In a year, a truck in India can cover 60 000 – 100 000 km while a truck in the USA can travel
up to 400 000 km per year.
The NHs many times pass through the city, and trucks may not be allowed into the city limits during
specific times. This result in unnecessary delays and the truck may have spent more than 12 hours in
order to pass through the city, an example of this is shown in Figure 30 (GoogleMaps, 2011). The city is
Pune, and the NH 4 and NH 9 can be viewed passing through the middle of the city. The road gets
narrow and the traffic situation adds to these problems.
Bangalore (18%); 7
Mumbai (16%); 6
Pune (32%); 12
Chennai (16%); 6
Delhi (18%); 7
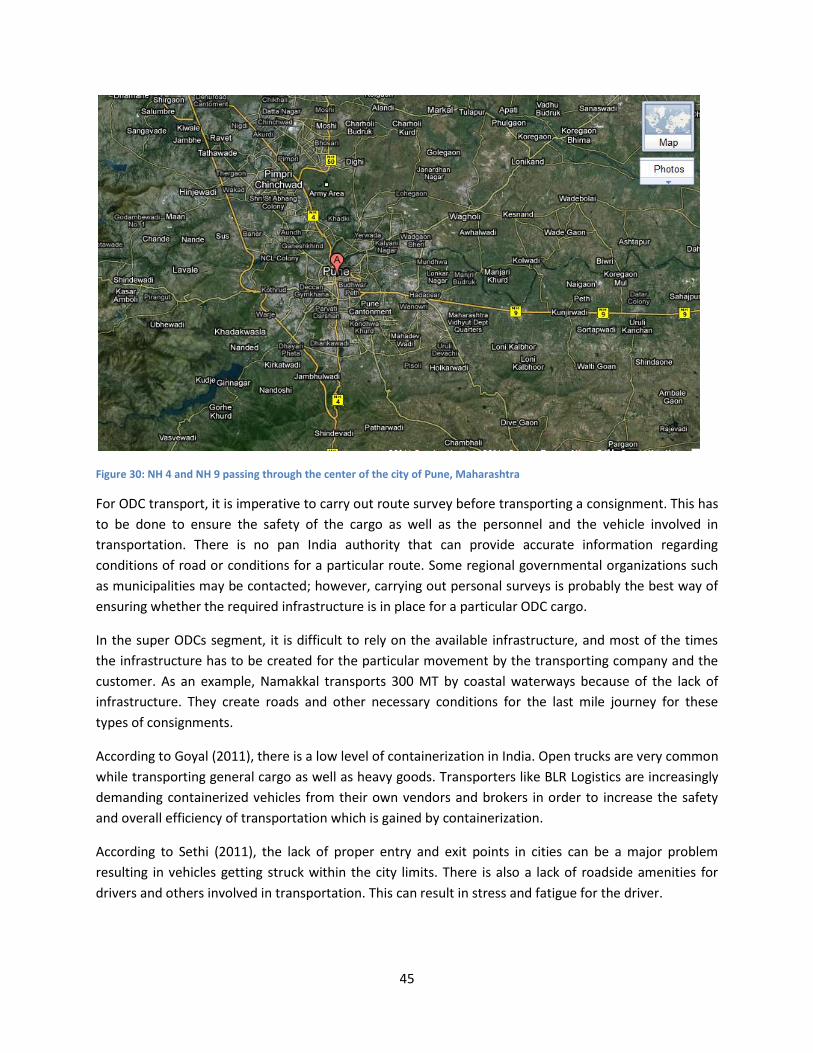
45
Figure 30: NH 4 and NH 9 passing through the center of the city of Pune, Maharashtra
For ODC transport, it is imperative to carry out route survey before transporting a consignment. This has
to be done to ensure the safety of the cargo as well as the personnel and the vehicle involved in
transportation. There is no pan India authority that can provide accurate information regarding
conditions of road or conditions for a particular route. Some regional governmental organizations such
as municipalities may be contacted; however, carrying out personal surveys is probably the best way of
ensuring whether the required infrastructure is in place for a particular ODC cargo.
In the super ODCs segment, it is difficult to rely on the available infrastructure, and most of the times
the infrastructure has to be created for the particular movement by the transporting company and the
customer. As an example, Namakkal transports 300 MT by coastal waterways because of the lack of
infrastructure. They create roads and other necessary conditions for the last mile journey for these
types of consignments.
According to Goyal (2011), there is a low level of containerization in India. Open trucks are very common
while transporting general cargo as well as heavy goods. Transporters like BLR Logistics are increasingly
demanding containerized vehicles from their own vendors and brokers in order to increase the safety
and overall efficiency of transportation which is gained by containerization.
According to Sethi (2011), the lack of proper entry and exit points in cities can be a major problem
resulting in vehicles getting struck within the city limits. There is also a lack of roadside amenities for
drivers and others involved in transportation. This can result in stress and fatigue for the driver.
46
5.2.2 Organization of transport industry
Almost all interviewees in the study as well as many of the theoretical journals on Indian road
transportation talk about the Indian transportation industry being unorganized and fragmented and the
resulting challenges because of this situation.
According to Gangadharan (2011), the transportation sector in India follows the British legacy of
infrastructure development in India and was never given a priority by the successive governments of
independent India. The lack in investments, lack of coordination between the government authorities
and lack of control over the industry resulted in localization of the industry. Today, the industry remains
unorganized; however there has been a development in small pockets in India of companies offering a
professional setup for transportation.
As mentioned in the problem formulation previously, there are very few owners of large fleet of
vehicles. As an example, TCI, one of the largest fleet owners in the country, owns around 1400 vehicles,
but may have a requirement of around 8 000 vehicles per day. There are a very few examples of fleet
owners having direct business with major manufacturing companies and satisfying their requirement
from their own fleet of vehicles. Janta Roadways is an example of a fleet owner using only their own
fleet for transportation and having contacts with major customers. However, Janta Roadways is limited
to a specific transportation application of transporting cars across India. Namakkal uses its own fleet and
a limited number of dedicated fleet to serve its customers in the ODC segment. However, its branches
across India will rely on brokers and local truck operators for supply of trucks for carrying general goods.
The transporters have to rely on either a dedicated fleet of vehicles or on market vehicles supplied by
the brokers and truck operators for movement of goods other than a specific application offered by
them. To summarize, in order to provide multiple transport services to the customer and also for some
specific services, transporters rely on a fleet other than the one owned by them.
One of the main reasons mentioned by the interviewees for the development of this situation is ease of
entering the transport business. There are low entry barriers to enter the transportation business. An
individual can enter a business when he gets some volumes from his potential customers. He can
subcontract market vehicles and earn a margin from customers thus establishing in the market. Most of
these individuals thrive on local networks and reputation and there is little knowledge about their
service potential or capabilities. Low service expectations will also result in the individual buying a truck
because of the low capital requirements in the market, obtain easy license permits and compete with
major transport companies mainly on the basis of price. This hinders the development of a professional
setup with guaranteed services in terms of quality and time.
The fragmentation of the industry results in a competition between the large fleet owners and small
fleet owners. The low entry barriers ensure that the small players are able to quote a lower price in the
market while disregarding the service requirements of the customers. The customers on the other hand,
being interested in getting the lowest price buy these services from small players and this results in
lowering of the overall quality of trucking services in the industry.

47
The lack of good trained drivers is one of the major challenges facing the industry and is corroborated by
almost all the transport companies interviewed in the thesis. The traditional concept of having a helper
and a driver in a truck persists. The trucks have single drivers in most of the cases. The driver salaries are
low. The working conditions are extremely uncomfortable and an average driver faces a number of
hassles en route including lack of resting facilities and harassment from authorities. The drivers have no
organizational security and there is a general lack of respect in the society for the driver’s profession.
Warehousing sector is not organized. Traditionally, farmlands in the interior have been used as
makeshift warehouses. There is a lack in infrastructure in terms of good road connectivity, space
allocation, lighting etc.
Getting spare parts and maintenance for trucks can be a major challenge for non-Tata Motors/Ashok
Leyland vehicles. The customers expect a good service network which presently, only the Indian truck
manufacturing companies have been successful in providing.
5.2.3 Rules and regulations
The regulatory structure in India has long been an obstacle in increasing the quality of trucking services
in India.
The tax regulations in India influence the logistical network of many companies including the
warehousing and transportation. Let us consider that the sales tax for sales within the same state is 4%.
For Sales within the same state where the product is manufactured, this sales tax which is 4% can be set
off or rebated back. Referring to point 1 in Figure 31, if the goods are transported from Mumbai to
Nagpur, i.e. within the western state of Maharashtra, then the sales tax can be deducted (India, 2011).

48
Figure 31: Sales tax effect
Referring to Point 2 in Figure 31 above, for sales in a state other than the state where the product is
manufactured; let us consider that there is a sales tax of 2% which has to be paid to the home state. If
the goods are being delivered from Mumbai, Maharashtra to Chennai, Tamil Nadu, then the seller has to
pay a sales tax of 2% to the state of Maharashtra. This tax can be avoided by having a warehouse in the
state of Tamil Nadu where the customer is located. However, there are various restrictions here as well.
When a product is designed to be sold to a particular customer in another state, it cannot simply pass
through a warehouse in order to escape from paying the sales tax. This is called a predetermined sale
which is not allowed without paying for the sales tax. This results in warehouses mushrooming in every
state where major customers are located. This is true also in case of SKF India, where distribution
centers (DC) have been established in major states to avoid taxation.
There are a lot of restrictions in terms of documentation and certificates during transit for transport
vehicles. As mentioned in the above example, sales tax is a complex issue while transporting goods
between different states. Apart from this, there is a lot of documentation checking by various
authorities en route including drivers’ licenses, vehicle insurance, fitness certificate, road permits etc.
These documents are mainly checked by the state authorities. This has led to mushrooming of several
check posts along the way, each responsible for a different set of regulations. According to a study
carried out in SKF India, there are presently 25 toll centers, and 3-4 check posts along the highway
2
1
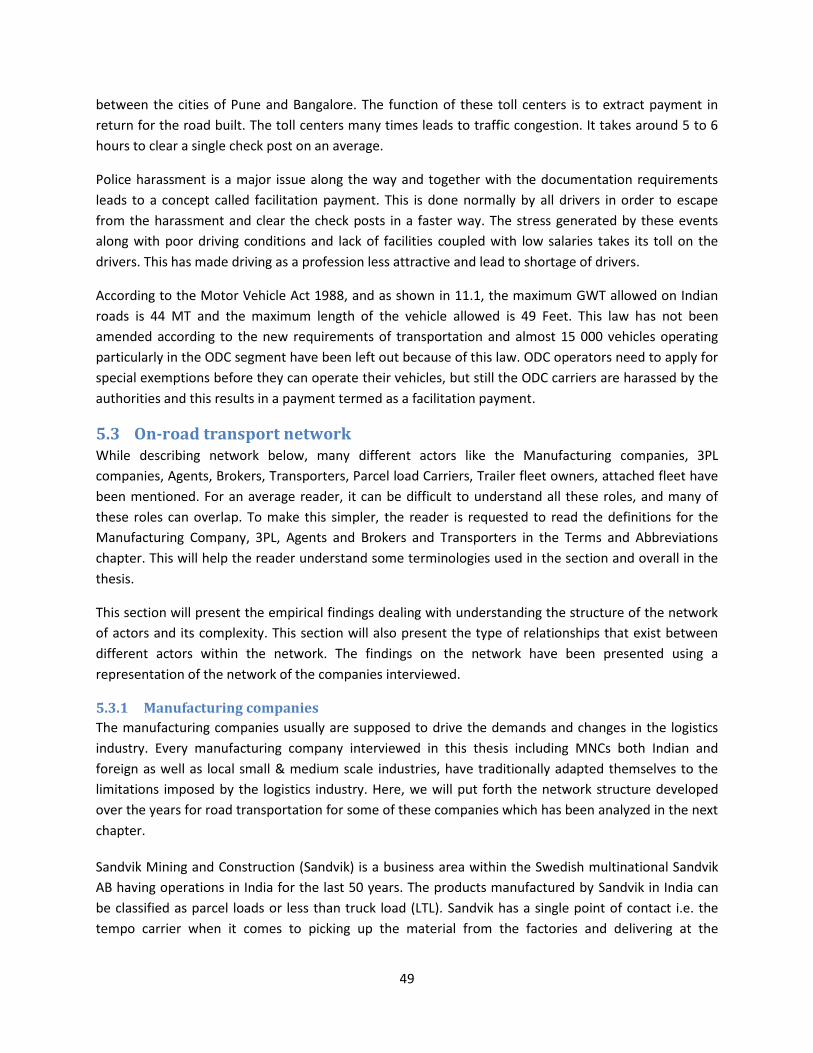
49
between the cities of Pune and Bangalore. The function of these toll centers is to extract payment in
return for the road built. The toll centers many times leads to traffic congestion. It takes around 5 to 6
hours to clear a single check post on an average.
Police harassment is a major issue along the way and together with the documentation requirements
leads to a concept called facilitation payment. This is done normally by all drivers in order to escape
from the harassment and clear the check posts in a faster way. The stress generated by these events
along with poor driving conditions and lack of facilities coupled with low salaries takes its toll on the
drivers. This has made driving as a profession less attractive and lead to shortage of drivers.
According to the Motor Vehicle Act 1988, and as shown in 11.1, the maximum GWT allowed on Indian
roads is 44 MT and the maximum length of the vehicle allowed is 49 Feet. This law has not been
amended according to the new requirements of transportation and almost 15 000 vehicles operating
particularly in the ODC segment have been left out because of this law. ODC operators need to apply for
special exemptions before they can operate their vehicles, but still the ODC carriers are harassed by the
authorities and this results in a payment termed as a facilitation payment.
5.3 On-road transport network While describing network below, many different actors like the Manufacturing companies, 3PL
companies, Agents, Brokers, Transporters, Parcel load Carriers, Trailer fleet owners, attached fleet have
been mentioned. For an average reader, it can be difficult to understand all these roles, and many of
these roles can overlap. To make this simpler, the reader is requested to read the definitions for the
Manufacturing Company, 3PL, Agents and Brokers and Transporters in the Terms and Abbreviations
chapter. This will help the reader understand some terminologies used in the section and overall in the
thesis.
This section will present the empirical findings dealing with understanding the structure of the network
of actors and its complexity. This section will also present the type of relationships that exist between
different actors within the network. The findings on the network have been presented using a
representation of the network of the companies interviewed.
5.3.1 Manufacturing companies
The manufacturing companies usually are supposed to drive the demands and changes in the logistics
industry. Every manufacturing company interviewed in this thesis including MNCs both Indian and
foreign as well as local small & medium scale industries, have traditionally adapted themselves to the
limitations imposed by the logistics industry. Here, we will put forth the network structure developed
over the years for road transportation for some of these companies which has been analyzed in the next
chapter.
Sandvik Mining and Construction (Sandvik) is a business area within the Swedish multinational Sandvik
AB having operations in India for the last 50 years. The products manufactured by Sandvik in India can
be classified as parcel loads or less than truck load (LTL). Sandvik has a single point of contact i.e. the
tempo carrier when it comes to picking up the material from the factories and delivering at the

50
collection center of parcel load carriers. A tempo is a small sized goods carrier vehicle. Sandvik has a
long term association with this tempo carrier, but prices are fixed on a spot basis. Sandvik uses different
parcel load and express load carriers for transportation of its products. The network is shown as in
Figure 32.
SandvikTempo Carrier
Parcel/Express Carriers
Long term association/Spot
Pricing
Load Transfer
Long term contract
Figure 32: Sandvik actor network for products
SandvikOrganised
fleet owners
Brokers
Long term Contracts
Small fleet ownersEnsured trailer
Supply
Need based supply
Figure 33: Sandvik actor network for heavy equipment
However, Sandvik also has a requirement of transporting its heavy equipment for which the network
structure is different and is shown above in Figure 33. Sandvik has long term contracts with a few
transporters with an organized fleet. These transporters can have a fleet of trailers attached to them
from small fleet owners, or they have their own network with brokers to ensure the supply of right
vehicles at the right time. This structure is very similar to that of L&T which uses 5 to 6 fleet owners as
primary contacts for on-road transportation of its heavy products. However, being a project based
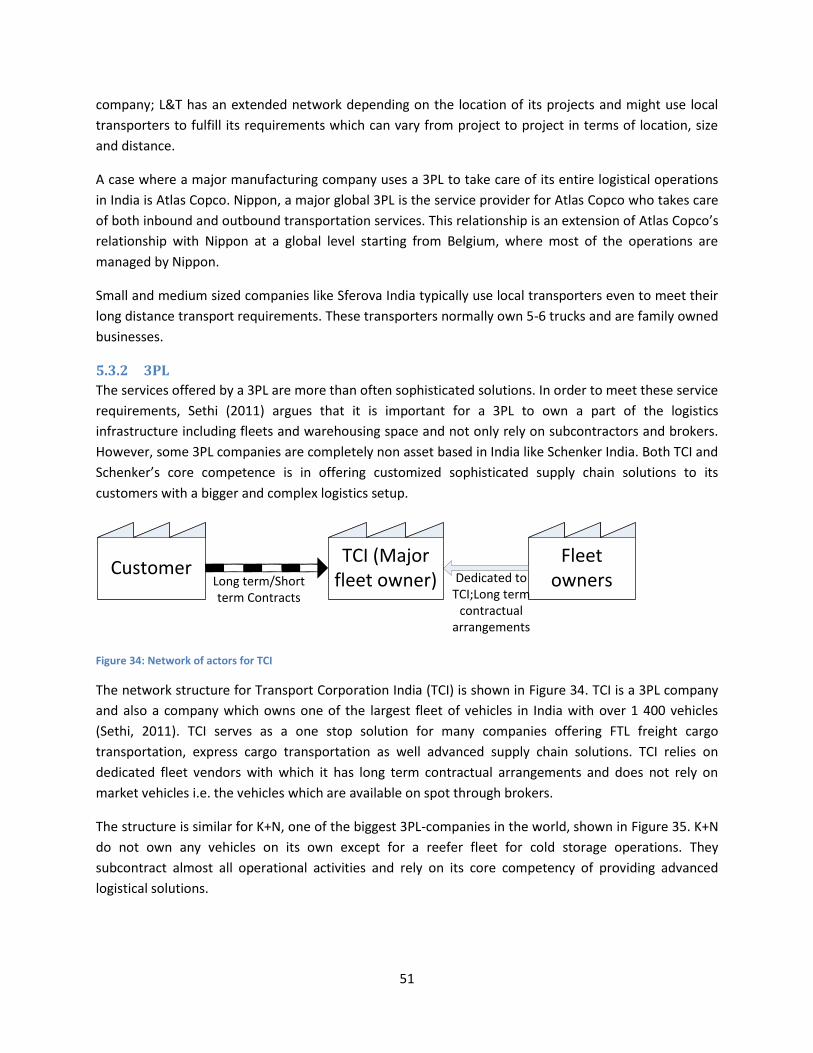
51
company; L&T has an extended network depending on the location of its projects and might use local
transporters to fulfill its requirements which can vary from project to project in terms of location, size
and distance.
A case where a major manufacturing company uses a 3PL to take care of its entire logistical operations
in India is Atlas Copco. Nippon, a major global 3PL is the service provider for Atlas Copco who takes care
of both inbound and outbound transportation services. This relationship is an extension of Atlas Copco’s
relationship with Nippon at a global level starting from Belgium, where most of the operations are
managed by Nippon.
Small and medium sized companies like Sferova India typically use local transporters even to meet their
long distance transport requirements. These transporters normally own 5-6 trucks and are family owned
businesses.
5.3.2 3PL
The services offered by a 3PL are more than often sophisticated solutions. In order to meet these service
requirements, Sethi (2011) argues that it is important for a 3PL to own a part of the logistics
infrastructure including fleets and warehousing space and not only rely on subcontractors and brokers.
However, some 3PL companies are completely non asset based in India like Schenker India. Both TCI and
Schenker’s core competence is in offering customized sophisticated supply chain solutions to its
customers with a bigger and complex logistics setup.
CustomerTCI (Major
fleet owner)Long term/Short term Contracts
Fleet ownersDedicated to
TCI;Long term contractual
arrangements
Figure 34: Network of actors for TCI
The network structure for Transport Corporation India (TCI) is shown in Figure 34. TCI is a 3PL company
and also a company which owns one of the largest fleet of vehicles in India with over 1 400 vehicles
(Sethi, 2011). TCI serves as a one stop solution for many companies offering FTL freight cargo
transportation, express cargo transportation as well advanced supply chain solutions. TCI relies on
dedicated fleet vendors with which it has long term contractual arrangements and does not rely on
market vehicles i.e. the vehicles which are available on spot through brokers.
The structure is similar for K+N, one of the biggest 3PL-companies in the world, shown in Figure 35. K+N
do not own any vehicles on its own except for a reefer fleet for cold storage operations. They
subcontract almost all operational activities and rely on its core competency of providing advanced
logistical solutions.

52
Customer K+NLong term/Short term Contracts
Asset based ProvidersSupply of
logistical assets
Figure 35: Network of actors for K+N
5.3.3 Transporting Companies
The transporters in India have traditionally been family owned businesses. A transporter can have a fleet
from less than 5 trucks to a fleet of more than 100 trucks. Some similar actors who do not own any fleet
can still be characterized as transporters since they serve directly to major manufacturing companies. An
example of such an actor is Speed Roadways in Bangalore. The network is as shown as in Figure 36.
Speed Roadways leverages its own network with brokers to do business with some of the major
manufacturing companies without owning assets. They also have a network of associate offices across
India due to which they are able to offer logistical services on a pan India basis for their customers.
CustomerSpeed
Roadways
Associate offices
Long term/Short term Contracts
BrokersSpot Pricing/
long term partnership
Long term association
Figure 36: Network structure for Speed Roadways
Delhi Gujarat Fleet Carriers (DGFC) and BLR Logistics are one of the major transporters in India. Like
most of the transporters, they have had similar beginnings with both being family owned businesses
with very few assets and then grown over a period of time to become owners of large fleet of vehicles.
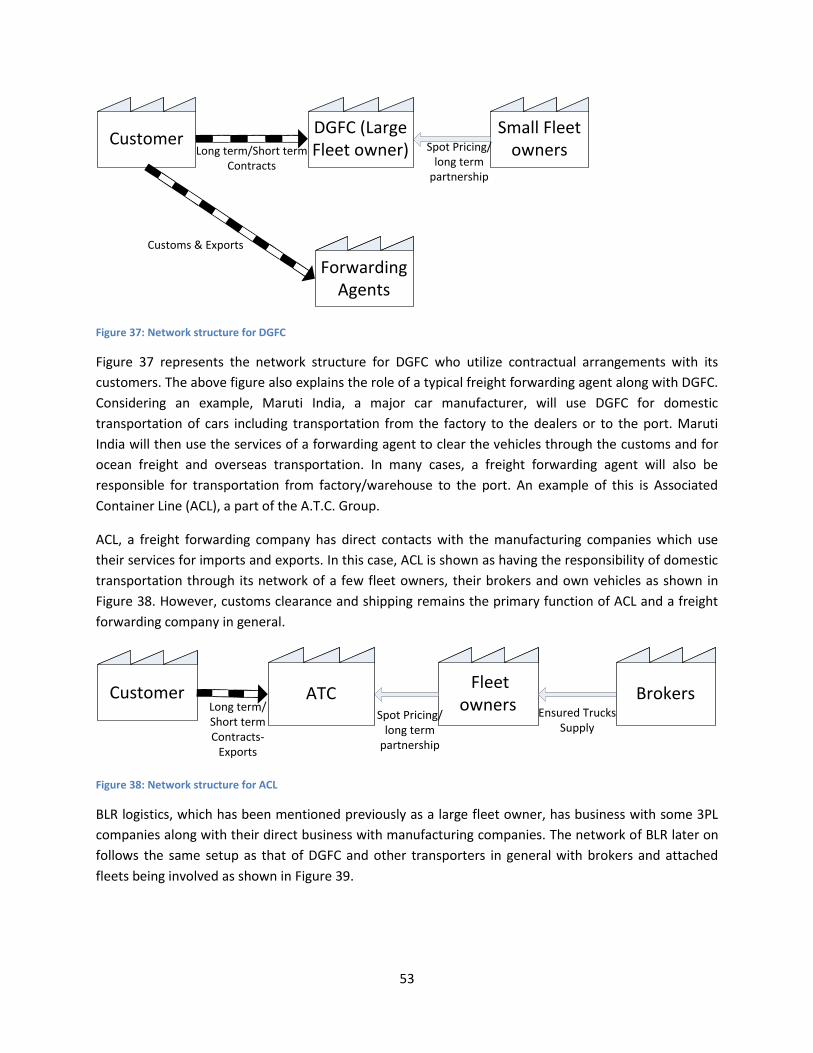
53
CustomerDGFC (Large Fleet owner)
Forwarding Agents
Long term/Short term Contracts
Small Fleet ownersSpot Pricing/
long term partnership
Customs & Exports
Figure 37: Network structure for DGFC
Figure 37 represents the network structure for DGFC who utilize contractual arrangements with its
customers. The above figure also explains the role of a typical freight forwarding agent along with DGFC.
Considering an example, Maruti India, a major car manufacturer, will use DGFC for domestic
transportation of cars including transportation from the factory to the dealers or to the port. Maruti
India will then use the services of a forwarding agent to clear the vehicles through the customs and for
ocean freight and overseas transportation. In many cases, a freight forwarding agent will also be
responsible for transportation from factory/warehouse to the port. An example of this is Associated
Container Line (ACL), a part of the A.T.C. Group.
ACL, a freight forwarding company has direct contacts with the manufacturing companies which use
their services for imports and exports. In this case, ACL is shown as having the responsibility of domestic
transportation through its network of a few fleet owners, their brokers and own vehicles as shown in
Figure 38. However, customs clearance and shipping remains the primary function of ACL and a freight
forwarding company in general.
Customer ATCLong term/Short term Contracts-
Exports
Fleet owners
Spot Pricing/long term
partnership
BrokersEnsured Trucks
Supply
Figure 38: Network structure for ACL
BLR logistics, which has been mentioned previously as a large fleet owner, has business with some 3PL
companies along with their direct business with manufacturing companies. The network of BLR later on
follows the same setup as that of DGFC and other transporters in general with brokers and attached
fleets being involved as shown in Figure 39.

54
Customer
BLR
Long term/Short term Contracts
3PL
Long term/Short term Contracts
Long term/Short term Contracts
Brokers
Small Fleet Owners
Spot Pricing/long term
partnership
Ensured Trucks Supply
Figure 39: Network structure for BLR Logistics
5.4 Actor perspectives The previous perspectives have formed a base for understanding the individual actor and in this
subchapter, the focus is on presenting the actor within the network and how the macro factors affect
and shape the actor environment. The scope is wide and aims both at trying to understand general
considerations connected to actor perspectives on a pan-India level as well as local factors in certain
areas within India.
5.4.1 Important parameters when purchasing on-road transport
The empirical study of certain common parameters connected to purchasing transport services in India
were conducted through the structured questionnaire part 1, see Appendix in 11.4. The structured
questionnaire consists of questions in relation to five parameters that are of importance when
purchasing transport services:
Price
Lead-time
Delivery precision
Trust in the transport provider
Environmental considerations
Price corresponds to the amount paid for a transport service. Lead-time is the time taken for
transporting the goods from point A to B. Delivery precision is the precision at which the goods are
55
delivered within a certain time frame as promised by the customer. Trust can be defined in terms of the
importance of personal relations and the resulting belief in assuring a certain quality in services for
transportation. The environmental considerations can be defined regarding the concerns for the
negative effect on the environment because of transportation and concern for the need to have
environment friendly transportation.
These parameters were then to be rated by each interviewee in relation to importance for the
interviewees’ own operations in the first part of the questionnaire, and to satisfaction of current
logistics provider in relation to the parameters in the second part of the questionnaire. As it was a
structured questionnaire, the interviewees could only rate them on a scale and were not able to
elaborate their answer. The interviewees were handed over the questionnaire in the beginning without
instructions as these were self-explanatory. This was done in order to avoid influence on opinion
according to Bryman and Bell (2011).
5.4.2 The general results of the questionnaire part 1
Following are the general results of the structured part of the interviews in relation to the five
parameters seen in Table 13.
Importance of five parameters for own operations Mean value (1 - 9)
Price 7.8
Lead-time 7.3
Delivery precision 8.0
Trust in transport provider 8.0
Environmental considerations 5.4
Table 13: General response of questionnaire part 1 - Importance of parameters
The parameters could be judged on a scale from 1 – 9, where 1 would be the least important and 9 the
most important.
The responses were well over the mean i.e. 4.5 and generally tending to the upper side of the scale. The
mean rating of a parameter for the level of importance over the whole population was 7.3, with 8 being
the highest ranking and 5.4 being the lowest ranking as can be viewed in Table 13.
In total, the response for the importance of the parameters is as shown below:
1. Trust in the transport provider
1. Delivery precision
2. Price
3. Lead-time
4. Environmental consideration
The interviewees were very concerned when it came to reliability issues and the possible expertise of
their chosen transport provider. Price is always an issue in a market like India but has been rated third in
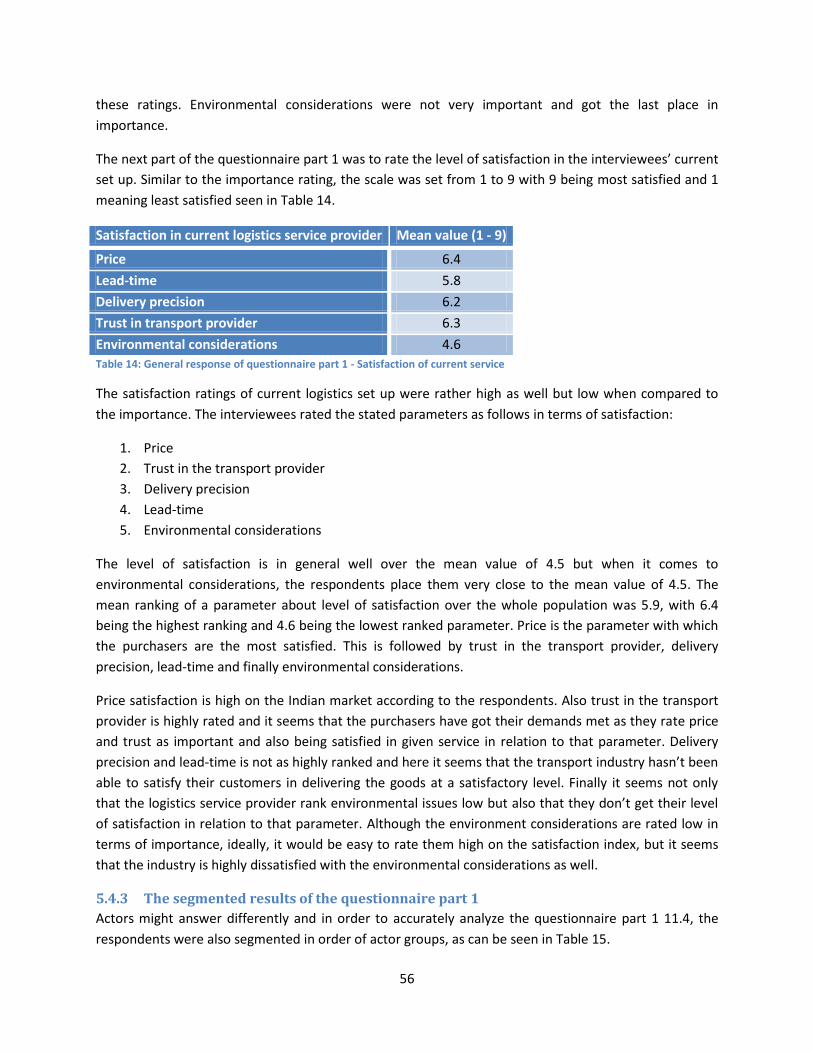
56
these ratings. Environmental considerations were not very important and got the last place in
importance.
The next part of the questionnaire part 1 was to rate the level of satisfaction in the interviewees’ current
set up. Similar to the importance rating, the scale was set from 1 to 9 with 9 being most satisfied and 1
meaning least satisfied seen in Table 14.
Satisfaction in current logistics service provider Mean value (1 - 9)
Price 6.4
Lead-time 5.8
Delivery precision 6.2
Trust in transport provider 6.3
Environmental considerations 4.6
Table 14: General response of questionnaire part 1 - Satisfaction of current service
The satisfaction ratings of current logistics set up were rather high as well but low when compared to
the importance. The interviewees rated the stated parameters as follows in terms of satisfaction:
1. Price
2. Trust in the transport provider
3. Delivery precision
4. Lead-time
5. Environmental considerations
The level of satisfaction is in general well over the mean value of 4.5 but when it comes to
environmental considerations, the respondents place them very close to the mean value of 4.5. The
mean ranking of a parameter about level of satisfaction over the whole population was 5.9, with 6.4
being the highest ranking and 4.6 being the lowest ranked parameter. Price is the parameter with which
the purchasers are the most satisfied. This is followed by trust in the transport provider, delivery
precision, lead-time and finally environmental considerations.
Price satisfaction is high on the Indian market according to the respondents. Also trust in the transport
provider is highly rated and it seems that the purchasers have got their demands met as they rate price
and trust as important and also being satisfied in given service in relation to that parameter. Delivery
precision and lead-time is not as highly ranked and here it seems that the transport industry hasn’t been
able to satisfy their customers in delivering the goods at a satisfactory level. Finally it seems not only
that the logistics service provider rank environmental issues low but also that they don’t get their level
of satisfaction in relation to that parameter. Although the environment considerations are rated low in
terms of importance, ideally, it would be easy to rate them high on the satisfaction index, but it seems
that the industry is highly dissatisfied with the environmental considerations as well.
5.4.3 The segmented results of the questionnaire part 1
Actors might answer differently and in order to accurately analyze the questionnaire part 1 11.4, the
respondents were also segmented in order of actor groups, as can be seen in Table 15.
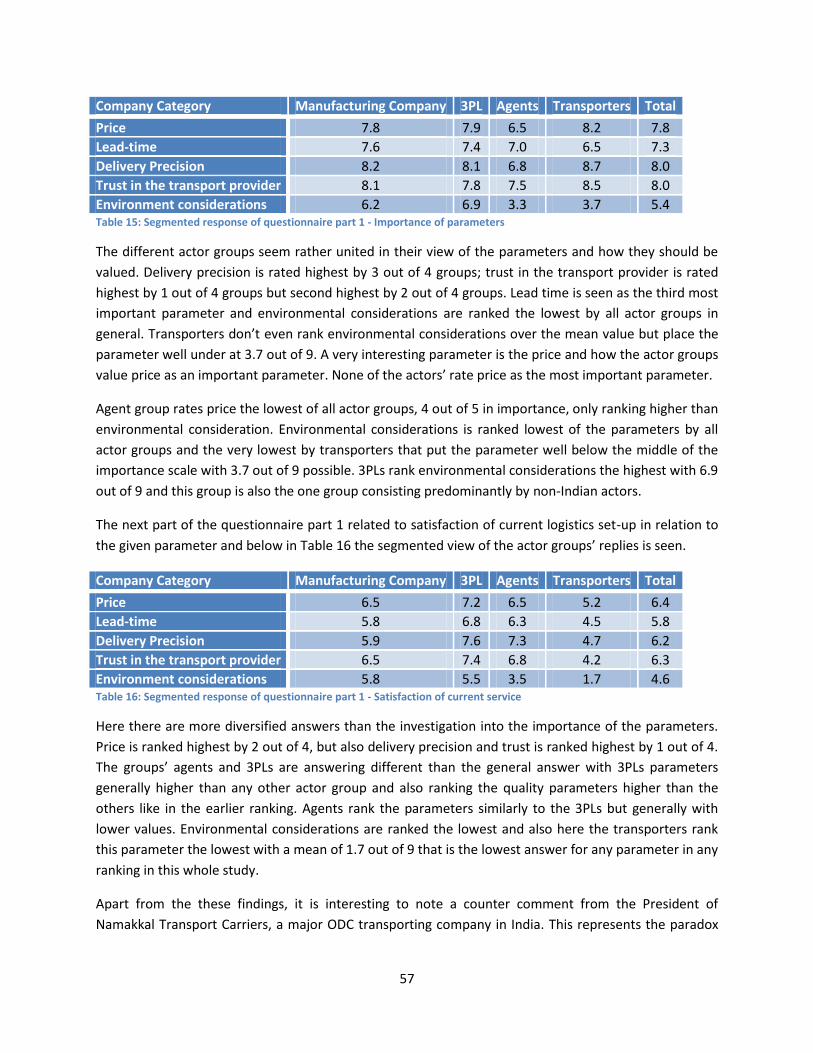
57
Company Category Manufacturing Company 3PL Agents Transporters Total
Price 7.8 7.9 6.5 8.2 7.8
Lead-time 7.6 7.4 7.0 6.5 7.3
Delivery Precision 8.2 8.1 6.8 8.7 8.0
Trust in the transport provider 8.1 7.8 7.5 8.5 8.0
Environment considerations 6.2 6.9 3.3 3.7 5.4 Table 15: Segmented response of questionnaire part 1 - Importance of parameters
The different actor groups seem rather united in their view of the parameters and how they should be
valued. Delivery precision is rated highest by 3 out of 4 groups; trust in the transport provider is rated
highest by 1 out of 4 groups but second highest by 2 out of 4 groups. Lead time is seen as the third most
important parameter and environmental considerations are ranked the lowest by all actor groups in
general. Transporters don’t even rank environmental considerations over the mean value but place the
parameter well under at 3.7 out of 9. A very interesting parameter is the price and how the actor groups
value price as an important parameter. None of the actors’ rate price as the most important parameter.
Agent group rates price the lowest of all actor groups, 4 out of 5 in importance, only ranking higher than
environmental consideration. Environmental considerations is ranked lowest of the parameters by all
actor groups and the very lowest by transporters that put the parameter well below the middle of the
importance scale with 3.7 out of 9 possible. 3PLs rank environmental considerations the highest with 6.9
out of 9 and this group is also the one group consisting predominantly by non-Indian actors.
The next part of the questionnaire part 1 related to satisfaction of current logistics set-up in relation to
the given parameter and below in Table 16 the segmented view of the actor groups’ replies is seen.
Company Category Manufacturing Company 3PL Agents Transporters Total
Price 6.5 7.2 6.5 5.2 6.4
Lead-time 5.8 6.8 6.3 4.5 5.8
Delivery Precision 5.9 7.6 7.3 4.7 6.2
Trust in the transport provider 6.5 7.4 6.8 4.2 6.3
Environment considerations 5.8 5.5 3.5 1.7 4.6 Table 16: Segmented response of questionnaire part 1 - Satisfaction of current service
Here there are more diversified answers than the investigation into the importance of the parameters.
Price is ranked highest by 2 out of 4, but also delivery precision and trust is ranked highest by 1 out of 4.
The groups’ agents and 3PLs are answering different than the general answer with 3PLs parameters
generally higher than any other actor group and also ranking the quality parameters higher than the
others like in the earlier ranking. Agents rank the parameters similarly to the 3PLs but generally with
lower values. Environmental considerations are ranked the lowest and also here the transporters rank
this parameter the lowest with a mean of 1.7 out of 9 that is the lowest answer for any parameter in any
ranking in this whole study.
Apart from the these findings, it is interesting to note a counter comment from the President of
Namakkal Transport Carriers, a major ODC transporting company in India. This represents the paradox
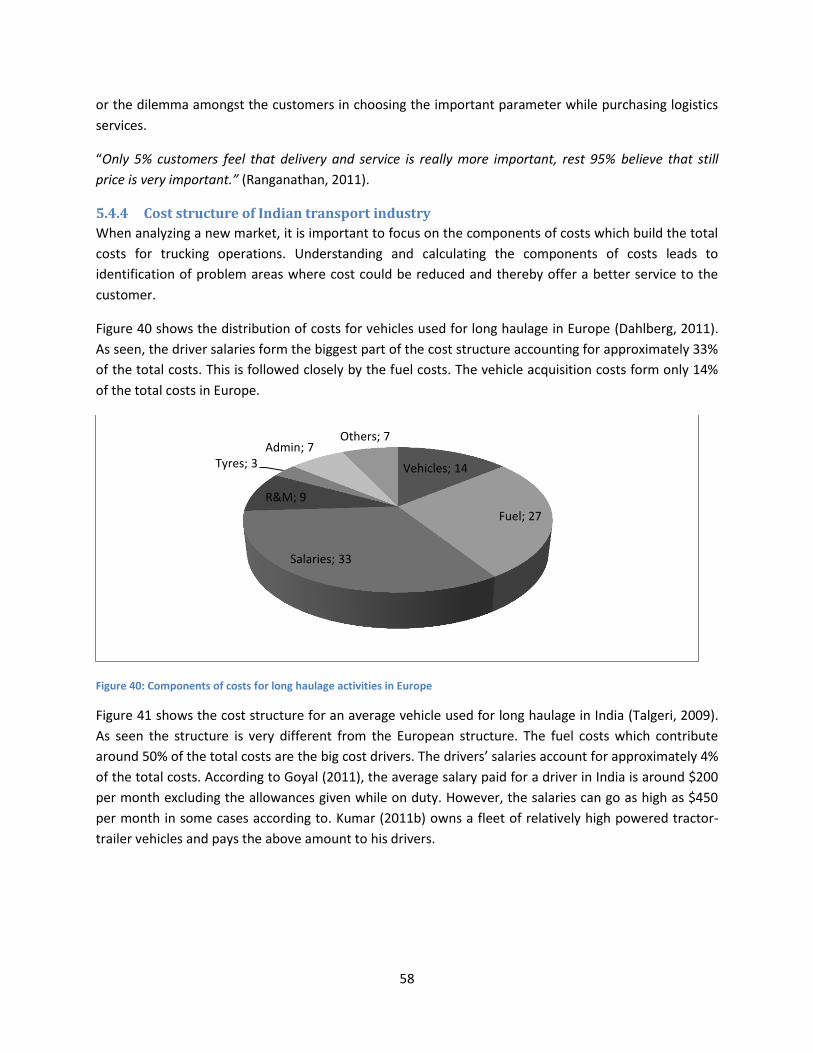
58
or the dilemma amongst the customers in choosing the important parameter while purchasing logistics
services.
“Only 5% customers feel that delivery and service is really more important, rest 95% believe that still
price is very important.” (Ranganathan, 2011).
5.4.4 Cost structure of Indian transport industry
When analyzing a new market, it is important to focus on the components of costs which build the total
costs for trucking operations. Understanding and calculating the components of costs leads to
identification of problem areas where cost could be reduced and thereby offer a better service to the
customer.
Figure 40 shows the distribution of costs for vehicles used for long haulage in Europe (Dahlberg, 2011).
As seen, the driver salaries form the biggest part of the cost structure accounting for approximately 33%
of the total costs. This is followed closely by the fuel costs. The vehicle acquisition costs form only 14%
of the total costs in Europe.
Figure 40: Components of costs for long haulage activities in Europe
Figure 41 shows the cost structure for an average vehicle used for long haulage in India (Talgeri, 2009).
As seen the structure is very different from the European structure. The fuel costs which contribute
around 50% of the total costs are the big cost drivers. The drivers’ salaries account for approximately 4%
of the total costs. According to Goyal (2011), the average salary paid for a driver in India is around $200
per month excluding the allowances given while on duty. However, the salaries can go as high as $450
per month in some cases according to. Kumar (2011b) owns a fleet of relatively high powered tractor-
trailer vehicles and pays the above amount to his drivers.
Vehicles; 14
Fuel; 27
Salaries; 33
R&M; 9
Tyres; 3 Admin; 7
Others; 7

59
Figure 41: Component of costs for long haulage activities in India
BLR Logistics, a major transport company puts the fuel costs around 55% and SKF, a major MNC put the
fuel costs in road transportation in a range of 50% – 60%. According to our empirical study is fuel the
most important and significant cost driver. There might be a slight variation in the values for other
components; however, most of the interviewees in India place their cost structure in a similar way as
shown in Figure 41.
5.5 Trends and future possibilities The vehicles seen on-road in India today can be related to the fragmented setup of the industry. Most of
the vehicles in India are either 2 axle or 3 axle vehicles. This is quite expected since consolidation of
flows is not very common in India and even a 9 tonnes payload vehicle is used over long distances. As
the Infrastructure develops, there will be a demand for heavy capacity vehicles and tractors. According
to Ranganathan (2011), there is already a need for high powered tractors in the ODC segment and is
likely to increase as the power and construction sector grows rapidly.
In the future, major manufacturing companies will move towards a one stop solution and expect better
service levels for road transportation. Consolidation of flows will increase and the role of major logistics
service providers will increase. There is a trend of 3PL companies investing in assets including vehicles in
order to reduce dependence on market vehicles and ensure the quality and availability of trucks which
will improve the overall service standards of trucking services. The erstwhile transport companies like
BLR Logistics and Namakkal transport carriers are also moving from being a transporter towards offering
more sophisticated logistical services including customs clearance and supply chain solutions.
The Carrier Act of 2007, which is being implemented since June 2011, is expected to improve the service
quality in trucking services. This law will place conditions on the service providers in terms of quality
levels and service standards and will give more rights to the purchasers of logistical services.
The tax reform in the form of Goods Service Tax (GST) will be implemented in 2012. This is expected to
bring a radical change in the way transportation takes place presently in India. Although, the terms of
Vehicles; 25
Fuel; 50
Salaries; 4 R&M; 10
Tyres; 6
Admin; 2 Others; 3
60
this tax reform are not clear, it is expected to reduce the documentation and the complexity of the sales
tax structure prevalent in different states. The transit time in transportation is expected to go down
reducing the delays involved in road transportation. A possible scenario that may evolve as explained by
Goyal (2011) is that after the GST gets implemented, rail may replace road for long haulage and road will
remain for short haul within 500 km. This may happen in the next 5-7 years and can happen faster when
rail is partially privatized.
Fuel prices will keep on rising in the future. There would be an opportunity for providing higher fuel
efficiency solutions since fuel already is a major component of costs for the service providers. The
quality of fuel available in India will remain an issue and the manufacturers of trucks and tractors will
have to adapt to the standard of fuel being used in India in order to provide the same results as
promised by the manufacturers of transport vehicles to their customers.
Ranganathan (2011) says that the market for moving goods weighing more than 49 MT will shift to
hydraulic axles in the future whereas the market for 30-49 tonnes MT will shift to tractor trailer
combination vehicular transportation. In the state of Andhra Pradesh, hydraulic axles have been made
compulsory for vehicle weighing more than 49 GWT. A trend showing the movement of the market from
16 tonnes payload to a heavier payload can be explained by the following data. The Total Industries
Volume (TIV) for 16MT has come down from 90 000 to 60 000 units, for tractor-trailer, TIVs has gone up
from 25 000 to 40 000 units (Ranganathan, 2011).
However, according to Goyal (2011), the requirement in the market for non ODC movement remains
high for 16 GWT vehicles. Goyal (2011) further explains that the 9 tonnes GWT which were previously
being used are being phased out and market is moving towards 16 GWT vehicles.
61
6 ANALYSIS OF THE INDIAN ON-ROAD TRANSPORT NETWORK The analysis chapter will connect the theoretical framework to the empirical findings. This will form the
basis for the discussion and conclusions in the following chapters. This chapter targets to gain an
understanding of the findings from the empirical study part 2 and connecting these to theory in order to
increase comprehensibility for the findings and the environment in which they are identified.
Figure 42: Structure of the thesis - Analysis
6.1 Macro perspective of Indian logistics setup This subchapter will present the macro perspectives and analysis in connection to infrastructure,
organization of the transport industry in India as well as analysis in connection to rules and regulations.
6.1.1 Infrastructure
According to a Purchasing Power Parity adjusted analysis in Gupta (2010b), there are inefficiencies in
India’s logistics infrastructure. Road transport is 30% more expensive in India than in the USA according
to the report. This refers to the total cost of ownership perspective since the direct transportation costs
in India remain lower than the USA. This study has highlighted major challenges in India related to its
infrastructure as shown in the findings. However, the pre-study shows the improvements being done in
the form of investments at both a public, as well as private level in India. The NHDP Project initiated by
India’s central government along with development of dedicated corridors such as the Delhi Mumbai
Industrial Corridor (DMIC) is one way of addressing the infrastructural challenges.
According to a news report in one of India’s largest English daily, the Times of India (2011), there is a
huge shortage of drivers in the country and at least 15% of the trucks in India, which numbers around
800 000 trucks, remain idle because of the paucity of drivers. This is complemented by this study and
the reasons for this can be found in the empirical study chapter.
6.1.2 Organization of transport industry
The transport industry in India is unorganized with a huge diversity in professionalism and knowledge
within the business network. Some Indian logistics companies offer high quality professional services
spread across India while some own and operate one truck very locally. Historical apathy towards the
industry from the government and the ease to enter the business are some of the important factors
highlighted in the empirical study.
According to Sethi (2011), all sizes of vehicles in India commute for all distances. Traditional definitions
of business in India are attributed in relation to the size of the individual company; small scale, medium
scale and large scale businesses. All companies, including the small scale businesses may have a
transportation requirement over long distances. Small scale units normally have a requirement of

62
transporting LTL goods and because of various limitations imposed by the road infrastructure and the
nature of the industry, they end up converting LTL batches into an FTL by using a small sized vehicle for
long distance transport.
The main reasons for this are the lack of coordinated transport for LTL at a pan-India level and at the
desired service level. During transshipment, the goods are handled multiple times before they are
delivered to the final destination. This can result in damage, misplacing and loss of goods. Many times it
is not time efficient to opt for parcel load transport or even express transport, offered by large transport
companies, leading to transport with small sized vehicles for LTL transport. Earlier, this was done by a
9MT truck however, according to Goyal (2011), these vehicles are being phased out for 16 MT vehicles.
6.1.3 Rules and regulations
In the empirical analysis, it was shown that India and its market cannot yet be considered as a single
market since the rules and regulations vary from state to state. These rules give rise to unnecessary
bureaucracy and a source for corruption and harassment of drivers in India. The study has shown that
bureaucracy has an impact on the manufacturing company’s distribution strategy and results in various
inefficiencies for the manufacturing companies as well as for logistics companies.
The restrictions on the vehicle size and other matters related to the vehicles were also discussed in the
empirical study and how this impacts the transportation industry especially in the ODC segment.
The pending amendments in the Motor Vehicle Act as well as the planned GST reform will have a radical
impact on all the above issues, at both an operational as well as on a strategic level.
6.2 Indian on-road transport network The Indian business network is an intricate system with actors from far ranging background and with
totally different mindsets. It contains the very highest and the very lowest sophistication, meeting
customer needs and meeting market requirement. The development of these actors and the networks
they participate in is a core process in the market development.
6.2.1 Internationalization and the Indian logistics service business network
Companies expanding operations into India seeking a new market utilize their networks in order to gain
market knowledge and in some sense they are operating and expanding in connection to the four stages
presented by Johanson et al. (1975). Trying to start small and then expand and in that sense gain market
knowledge and good reputation connected to a hopefully well-deserved track record that increase the
chances of forming new relationships founded on trust. The trust indicators are very important, it seems
for the actors in India, and the best way of gaining trust within the networks are long term relationship
and continuous business relations. Companies value long term relationships highly in order to save
energy and resources, as many actors go bankrupt related to the dynamics of the Indian market and the
education level of the actors themselves. A way of quickly evaluating potential co-operators is through
recommendations and long term established actors within certain segments. This can be related to the
new Uppsala model (Johanson and Vahlne, 2009).

63
The modern company seeking a presence in India will be utilizing the business network as much as
possible and use the network resources to its full capacity. In order to bridge the psychic distance the
actors seek collaborations in order to lower risk and create high development as stated by Dunning
(2000). This development is connected to successful utilization of the resources at hand and possible
advantages which can be connected to the business network internationalization process model in
Figure 21.
In order to evaluate the current situation the actors identify their own position in the business network
and identify knowledge within the organization and then on a lower abstraction level is able to identify
opportunities on the market for the company. This analysis will be the base for reasoning for the actor
and the company will then look at the change aspects and how the identified opportunities can be
targeted. The business network is one of the main pools of resources for gaining indirect access to
market resources, both tangible and intangible. With an understanding of where the own company
could be places within the business network the possible collaborators are more easy to identify. In
order to make successful collaborations the actor then turn to the Learning, Creating and Trust-building
aspects to gain necessary relations to improve their own network. Jan-Erik Vahlne state “The market
isn’t faceless, the involved parties and the people involved in the transaction is important.” (Vahlne,
2012).
Companies in India operating in the Logistics Service business network are from very different
backgrounds and with totally different targets and means of operations. Some are on the very top when
it comes to logistics services and customer relations and some are on the very bottom. The development
of the actors though is very impressive. The market consists by many “self-made men” who without
higher education start their own company and iteratively build a larger and larger operation finally being
able to meet the very highest of standards. But also some actors are from an international scene and
aren’t providing the Indian market with all of the services that can be provided.
Mr. Singh at Janta Roadways (2011) started as a driver some +20 years ago and has successfully built a
major actor providing some of the most demanding customers with car transport services. Speed
Roadways (2011) stated its operations some +10 years ago and has successfully increased operations
from a local office and transport services to providing far ranging broker services to the Indian Market
primarily in the Chennai region but through partnerships being able to provide transport services pan-
India. These actors are connected to the initial Uppsala model being more connected to own operations
and working to improve own operations through incremental growth and development of potential.
At Schenker India (2011) all possible services can be provided the market as the company being the
world’s largest transport company and has operations all over the world, the knowledge of those
services are there. But the market hasn’t been demanding the more sophisticated transport services,
but generally cargo transport is enough. The development has been in Import/Export activities and that
is what traditionally has driven the market. As distribution hasn’t been high on the list Schenker hasn’t
bought any own trucks but totally relies on external actors providing transport services. It does not lie in
the strategy forward to own those resources in the close future either.

64
K+N is another large international transport company present in India. Like Schenker, K+N (2011) have
been focused on import/export activities and haven’t held direct ownership of the transport resources
either. Also the number of offices in India has been at a rather low level with a main presence around
the major ports that dominate the transport flows in India. K+N also rely on external transport service
providers when it comes to the actual on-road transport of goods, except for certain very specific
segments. These actors are examples of how an educated actor would lean on the business network to
reach certain segments on the market and the development of those actors can be viewed through the
revised Uppsala model (Johanson and Vahlne, 2009).
6.2.2 Business network
The most important actors have been defined in the beginning of the thesis. The terms such as LSPs,
transport companies and other related terms have been extensively used in literature and during
interviews. However, there doesn’t seem to be an exact definition available for these terms.
In the Empirical study the interviewed companies were sorted in accordance with Table 17.
Manufacturing Company 3PL Agent Transport Company Other
L&T K+N ATC BLR Scania
Atlas Copco Schenker Door-Step Capital Solutions Namakkal STC
Bharat Forge Damco Speed Roadways Janta Roadways SCI
Sandvik TCI
DGFC
Alfa Laval BlueDart/DHL
Suresh Kumar
Sandvik
SKF
Sferova India
Elof Hansson
VAAS
Philips
Gunnebo Table 17: Structure of interviewed companies into actor groups
As shown in Figure 43, the transport companies are defined as actors whose main responsibility is to
transport goods from one location to another and also ensure supply of vehicles for transportation, i.e.
large transporters, small truck operators and brokers.

65
Figure 43: Model of Indian LSP network nomenclature
The LSPs will provide logistical services with transportation being one of the important logistical
services. Here, all the transport companies can be classified under LSPs since they provide the
transportation service. The LSPs will also include agents who provide services such as customs clearance,
forwarding, distribution and warehousing in certain cases. These services can also be classified as
logistical services. The 3PLs offer sophisticated supply chain solutions along with operational logistics
services and they are included within the LSPs terminology. Thus LSPs are the actors who provide every
kind of logistics services and manufacturing companies are the actors in need of these logistical services
In the findings, the network structure was explained taking relative examples of all the major actors as
defined in the Indian road logistics setup. The findings illustrate the nature of the network and its
complexity in reference to manufacturing companies, 3PLs and transport companies.

66
Figure 44: Network structure and types of relationship
The transport network in India can be represented by Figure 44 above. This network is analyzed in
reference to Figure 24 based on the industrial network theory. This network model is a 2D model similar
to the 3D model described by Brito (2001). The first dimension which is the vertical chain as described
by Ford et Al. (1998), consists of the chain beginning from the demand side and ending towards the
supply side. This chain varies a lot in India and its complexity is further explained further in the chapter
in the form of different relationships at different levels. The second dimension is the horizontal supply
chain as described by Araujo et Al. (1997). As explained in the theory, this dimension deals with relations
among competitors. The competitors in this context are the 3PL companies, the transport companies
competing with each other for the same business. This competition is expected to intensify when the
industry begins to consolidate especially close towards the demand side. The manufacturing companies
in the future will expect a single window for logistics as in the present case it is inefficient to deal with
many actors simultaneously.
Speed Roadways, a transporting company based in Bangalore has associate offices across India. These
offices serve Speed Roadways when its own network is incapable of meeting the requirements of its
customers. This is a collective tie-up between similar actors to take advantage of their resources
collectively. Thus, Speed roadways play the role of a transporting company without having to own any
vehicles, but relying on its network for the supply of vehicles. This could be termed as a ‘Collective
Actors’ phenomenon as defined in Brito (2001). In this study, Speed Roadways is the only example

67
where a collective actor phenomenon was seen. This phenomenon may have a possibility of occurring
among brokers more than any other actors. In other cases, it was observed from the respondents’
answers that the actor which has the most volumes plays a dominating role over others in considering
all the important parameters necessary while purchasing the transport service. The network shown in
Figure 44 above is driven by a demand side which begins on the left side of the network starting with
the manufacturing company and increasingly becomes the supply side culminating at the transporter.
The transporter shown in the above figure includes the big fleet owners who have direct contacts with
major manufacturing companies. This actor also includes small truck operators who are dependent on
their personal association with brokers for business and some also attach their whole fleet or part of
their fleet to a big fleet transporter. The physical resources are concentrated at the supply side of the
network whereas the monetary resources are concentrated at the demand side of the network. In many
cases, the network becomes shorter as the physical resources owned by the 3PLs and the agents
increase. As an example, a 3PL or an agent owning his own fleet of transport vehicles serves his
customers directly without relying on the remaining part of the network. Thus, the network can be
classified into the following types in relation to Figure 44.
1. Manufacturer – 3PL – Broker – transporter
2. Manufacturer – 3PL – transporter
3. Manufacturer – Agent – Broker – Transporter
4. Manufacturer - Agent –Transporter
5. Manufacturer – Transporter
The network relationships within the above networks can be divided into primary, secondary and
tertiary based on their relevance to the manufacturer.
Primary Relationships:
1. Manufacturer – 3PL
2. Manufacturer – Agent
3. Manufacturer – Transporter
These relationships are normally long term although spot negotiations might happen regarding many
parameters as shown in the case for Sandvik.
Secondary Relationships:
1. 3PL – Transporter
2. Agent – Transporter
These are normally transactional relationships. The actors involved may be doing business together for
many years; however the activities remain transactional in nature. Resources such as trucks owned by
the transporters can be attached in order to provide dedicated services to these intermediaries. As
mentioned in Sundquist (2011), these intermediaries including the below mentioned brokers help in
reducing the number of contacts for the manufacturer by providing services under a single umbrella.
They also aggregate the demand and ensure a stable supply of trucks from the transporters thereby
reducing the costs of scale. Intermediaries such as 3PLs and agents may offer specialized services and
68
customized solutions for transportation and cover for risk by assuring quality of services for the
manufacturer.
Tertiary Relationships:
1. 3PL – Broker
2. Agent – Broker
3. Broker – Transporter
The transactional nature of relationships increases while moving from primary to tertiary relations.
However, even at the tertiary stage, it is important to have a recognized broker as a partner since this
relationship can be a part of a more strategic relationship. As an example, a company may outsource a
transport contract to a 3PL; the 3PL might outsource a part of the activities to the broker who in turn
might use a transporter for fulfilling his requirement. In order to provide the best level of satisfaction for
the customer, all these actors should be able to attain their individual level of efficiency in the services.
Thus, trust remains an important parameter in these relations which might appear transactional in
nature.
Unlike many other countries, the penetration of the 3PLs in the Indian logistics business is not very high
and most of the flows are handled by the agents and the transporters with brokers acting as middlemen
most of the times. It is expected that the customers in the future will demand more advanced solutions
and 3PLs in reality will have a higher say in the market. At the same time, the transporters interviewed
in the thesis are planning to climb up the ladder in providing more advanced services along with their
core transportation function.
6.3 Indian actor perspectives The macro and network level of the empirical study has now been analyzed and the focus turns to the
third and final level – the actor perspective. This has been investigated both from a quantitative and a
qualitative view, where the structured questionnaire presented a quantitative ranking of certain
parameters and the semi structured presented the qualitative perspective.
6.3.1 Importance of parameters in connection to purchasing transport services
The tables presenting the ranking of parameters in chapter 5.4 present both the general view and a
segmented view of the actors ranking of the five investigated parameters. In general the parameters
were ranked high and thought of as very important for the population in the study which support the
choice of parameters.
Placing trust in the transport provider and delivery precision as the most important parameters point at
a tendency for promoting quality of service from purchaser side when purchasing transport services. It
must be stated though that the interviewers think that price was a self-evident parameter which no
actor could disregard. Even if price were not always ranked as one of the most important parameters,
the reader should be aware about this perspective. But it was also perceived that the purchasers of
transport are becoming more and more interested in connecting with educated counterparts, that are
able to handle larger operations, and that they’d rather have a few larger but more stable logistic
69
providers instead of relying on day-to-day negotiations with potential transport providers. Lead time
was placed behind delivery precision, not very surprisingly, as most purchasers aren’t overly interested
in getting the fastest transport but the most reliable transport. As the macro factors are very uncertain
and is a big obstacle for flexible and efficient transports in India, most logistics service purchasers are
well aware of that the transport lead-time is generally a small part of the total lead –time, where
bureaucratic issues is a far greater obstacle.
6.3.2 Satisfaction of current logistics service set up in connection to parameters
Different from the ranking of importance of the transport parameters the level of satisfaction was
ranked a lot lower. The transport purchasers were the most satisfied with price followed by trust,
delivery precision, lead-time and the most dissatisfied with the consideration taken to environmental
consideration. It’s interesting that they were quite satisfied with price as the recent development when
it comes to pricing has been increasing during the last couple of years. Only the fuel prices had increased
substantially and many other cost drivers as well. It seems though that the purchasers have an
understanding for that development and find the current level quite pleasing. Then comes the quality of
service issues and it seems that purchasers don’t think that their demands are met when it comes to
quality of service and the least satisfied they are about the lead-time. Maybe delivery precision would
have been though to lead to more dissatisfaction, but it doesn’t, customers want their goods faster than
currently being serviced. Once again environmental considerations are at the lowest level but here it is a
bit strange that the one parameter ranked at being the least important also is the parameter that
logistics service purchasers are the most dissatisfied with. It might either be that even though the level is
set low, the customers still don’t get expected service, or it could be a bit of a misunderstanding that
they would like to have that parameter being more important. During the interview it was clear that
most subjects were aware of the environmental discussion currently being held in the global arena, but
also didn’t feel that it was a matter that could be handled by its own sector.
6.3.3 Segmented answers from actor groups
The Indian transport customer has historically looked at the transportation price as the most important
parameter while making a decision for purchasing a particular type of transport service (Bergvall, 2011).
In relative terms, the level of importance for parameters goes down for the intermediaries especially the
agents and rises for the manufacturing companies which initiate the demand and the transporters which
provide the actual resources for transportation.
3PLs, who are one of the most likely actors to use premium trucks in order to be able to provide high
quality transport services, give the highest importance to delivery precision closely followed by price and
trust. The lead time comes fourth. Sundquist state “The rationale for using a middleman would reside in
the value that the intermediary provides as long as it exceeds the costs of using it” (Sundquist, 2011,
p.2). Based on this quote, the intermediary like a 3PL cannot compromise on the quality of trucking
services offered and the value gained by the customer over the price paid. The reason for the lead time
not being given a higher level of importance than the above mentioned parameters is the limitation
posed by the Indian roads and related transport infrastructure as has been discussed in the findings as
well as the background of the thesis.

70
Figure 45: Level of Importance for parameters
When asked regarding the current level of satisfaction in the transport services, many of the
respondents pointed as shown in Figure 45 that they are relatively more satisfied in the prices being
offered than the parameters such as delivery precision and lead time. It is interesting to observe that the
intermediaries are more satisfied as compared to the manufacturing companies and the transporters.
Figure 46: Level of Satisfaction for parameters
The delivery precision for the manufacturer and the transporter lags in terms of satisfaction; however it
is the highest for the intermediaries. However, it has to be noted that these values are very close to
each other in the actual results as shown in Figure 46.
Overall, it can be observed that there is a noticeable difference between the current levels of
satisfaction and the relative level of importance assigned to the parameters by the respondents. Thus, it
0,0
1,0
2,0
3,0
4,0
5,0
6,0
7,0
8,0
9,0
10,0
Manufacturer 3PL Agent Transporter Total
Price
Lead time
Delivery Precision
Trust
Environment
0,0
1,0
2,0
3,0
4,0
5,0
6,0
7,0
8,0
Manufacturer 3PL Agent Transporter Total
Price
Lead time
Delivery Precision
Trust
Environment

71
can be said that there is a requirement of more efficient services in order to bridge the gap between the
current levels of satisfaction as compared to the level of importance of these parameters. The
respondents have rated all the parameters very high, well over the mean of 4.5, but the most important
parameters were suggested to be Delivery Precision and Trust in the transport provider.
Environmental considerations seem to be the parameter where the logistics service providers are the
least successful in fulfilling the market demands.
6.3.4 Analysis of the Indian LSP actors
According to Håkansson et Al. (2001), any actor is constantly involved in efforts to improve his position,
thus enhancing favorable aspects and reducing unfavorable conditions. This phenomenon can be related
to the LSPs in India. The logistical service providers in India can be put in these four categories as shown
in the Actor Analysis Model in Figure 47. The x-axis represents the relative investments done by the
actors in commercial vehicles, and the y-axis represents the sophistication of services that the actor can
provide the market.
Figure 47: Actor Analysis Model
The 3PLs offer advanced logistical solutions and have very low investments in trucks, thus they can be
put under the flexible actor category. Agents provide relatively high degree of sophisticated services and
are defined as either weak or flexible actors, generally they don’t own any trucks and provide semi
sophisticated services. The transporters have high relative investments, but are not in a position to offer
high end logistical solutions. Thus according to Figure 47, they are termed as specialized actors. The

72
brokers are intermediaries who might not own any vehicle assets and they do not offer advanced
logistical solutions and in this model defined as weak actors. Some actors might have high level of
investments in trucks and at the same time offer specialized services, they are defined as strong actors.
TCI is an example of a 3PL having relatively high investment in vehicles and offering specialized services.
However, this falls short of requirement in terms of size and capability in a country like India.
A firms position, as discussed by Håkansson (2001), can never be static. The logistical companies in India
are also evolving. From this study it can be analyzed that many of the transporters, according to Figure
48, termed as weak actors, are increasing the portfolio of the services offered by them and are in a
process of moving increasingly towards the specialized actors segment. This is resulting in a decrease in
the relative investments for these transporters and increase in the services portfolio in terms of quantity
and quality. Interestingly, many specialized actors are in a process of investing in transportation
capabilities. This will increase their relative investments in commercial vehicles at the same time
continuing to offer the same advanced services. In other words, they will be in a process of shifting their
position from a specialized actor segment to a strong actor segment.
Figure 48: Actor Analysis Model with the defined Indian actors
In Figure 48 the defined actors and their position in the Actor Analysis Model can be seen. The actors are
placed in the model in accordance with the general positioning of the different actors but of course
there are actors that are more or less invested and also that provide more or less sophisticated services
than might appear from Figure 48.
73
6.3.5 Cost structure
This part of the analysis mainly relates to three figures. Figure 40 shows the components of costs over
long haulage for transport companies in Europe. Figure 41 shows the components of costs over long
haulage for transport companies in India. Figure 8 shows the business model for Scania.
As explained in the findings, Europe and India have very different numbers for their components in cost.
Driver salaries for the bulk of the costs in Europe and combined with the fuel costs, form around 60% of
the total costs in Europe. Fuel costs alone account for more than 50% of the total costs in India. This is
followed by the capital costs in purchasing a vehicle. Repair and maintenance, although significant, from
a service perspective are low compared to the other major costs in India.
Considering the cost structure in India, many opportunities for development can be observed. It will be a
significant achievement for the industry if trucks can reduce the costs associated with fuel and
maintenance. On the other hand, companies will have to have an eye on the capital costs as well as its
service capabilities in India. The performance of trucks will be influenced by a plethora of local issues
including the quality of the fuel, road standards, last mile deliveries close to major cities and insurance
risk. Driver training and service commitment will go a long way in developing trust with potential
customers. As explained by Sethi (2011), companies offering premium vehicles with a focus on total cost
of ownership will have to prove the gains on paper to those on the road.
74
7 DISCUSSION OF THE INDIAN ON-ROAD TRANSPORT NETWORK This chapter will elaborate the analysis of the data from the empirical study and the theoretical
framework. As seen in Figure 49, this is the last chapter before the final presentation of the conclusions.
Here the analysis will be target of scrutiny and thereby the reader will be given a better understanding
of the findings and the relevance to the topic.
Figure 49: Structure of the thesis - Discussion
The thesis has been following a structure beginning with the macro perspectives. These perspectives
were evaluated both from the literature available and from the interviews in India. Infrastructure,
organization of the industry and regulations were the main points covered in this chapter. The golden
quadrilateral along with the north-south and west-east corridors remain the important roadways for
heavy and long haul transport activities and together with the national highway setup in India constitute
the infrastructure that can support heavy transportation over long haul. The National Highways continue
to have some problems but with the NHDP Phase 3 as mentioned in the pre-study, they will be further
developed to allow unhindered passage for heavy trucks in the future at least from the infrastructure
perspective.
The regulatory setup in India has been creating hurdles for long haulage activities in India. Because of
various state laws, the trucks keep on spending unnecessary time at the borders of the states and this
creates inefficiencies in the whole transportation setup and affects the lead time negatively. The present
laws make it difficult for heavy trucks to operate on-road especially for ODC transportation. The heavy
trucks normally exceed the permissible dimensions and require special permission to operate. To obtain
this permission is difficult, takes long time and cost money, and the transport service providers find it
unsustainable not to run the trucks. This rule is then bypassed by facilitation payment or in simple terms
by bribing concerned authorities.
The network of actors remains complex in India and one of the objectives of this study was to analyze
and understand the setup of the actors, their relative positions and important relationships. The actors
were identified as manufacturing companies, 3PLs, agents, brokers and transporters including small
truck operators.
As described in the thesis, trust between the customer and the service provider is very important. Trust
and personal relations are a guarantee in the quality of services as promised by the provider. Many
actors have been associated with each other for more than 5 years and continue having business
relations even without formal agreements. This is especially the case when the volumes are low and
within the broker networks. In many cases, this phenomenon is also true for many major manufacturing
75
companies and their direct network with some transport companies bypassing the intermediaries such
as 3PLs, agents or brokers.
The components of costs and the difference in this aspect between Europe and India has been a major
point to note. Driver salaries and fuel are the most important driving costs in Europe and in that order.
In India, the fuel cost component contributes about 50% of the total costs (Somnath Bhattacharjee) and
this is followed by the financial cost or vehicle acquisition costs which include the cost of capital and the
interests paid over it while purchasing a truck. Thus, while focusing on India and the cost structure, it is
very important to consider the fuel efficiency aspects as well as how effectively can financial services be
offered to the customers of trucks.

76
8 CONCLUSIONS OF THE CURRENT INDIAN MARKET FOR TRANSPORT
SERVICES This chapter will provide conclusions in connection to the three tier model; macro, network and actor
that has been used throughout the thesis. This will be the last part of the thesis as can be seen in Figure
50 below.
Figure 50: Structure of the thesis - Conclusions
8.1 Macro perspectives The below points are the conclusions of the problems associated with the macro factors affecting
transportation business in India:
The National Highways still don’t give the transport companies unhindered passage through
many cities
India has various submarkets rather than a single market due to lack in tax reforms leading to
many complex problems like state border stoppages, police harassment, corruption and red
tape
Lack of coordination at a Pan India level for LTL goods
Restriction on the size of vehicles especially for ODC transport
Non-availability of drivers in the industry
With the above issues identified in the study, there are many changes that have a possibility to influence
these issues in the future. The National Highways, the golden quadrilateral, and the NS-EW Corridor will
remain important for long distance transportation. Infrastructure projects as discussed in the thesis and
reforms like the Goods and Services Tax (GST) along with amendments in the Motor Vehicles Act and the
new Carrier Act will help in better organization of the industry in the future. However, the Indian
transport industry remains fragmented and unorganized except for a few players who have pan India
presence.
8.2 The India business network perspectives Most of the transport companies in India have grown from a family business of owning a single or small
fleet of trucks to tend to the transportation needs over a particular area. Local players have an
advantage over other players as it’s very important to be locally present and access to primary
information of the daily situation at the local level. Information about local routes, local conditions or
personal relations with local governance can be a decisive factor in being able to operate in a certain
area. Thus the industry sometime neglects a professional approach towards providing transport services
leading to a poor quality of service.

77
Many of these businesses are now establishing a professional setup. This began when the owners
started getting formal education and an exposure to the best practices around the world. This
professionalization of the industry will continue along with the entry of global logistics companies and
the rise of few Indian companies at a national stage. India still remains an immature market in terms of:
Lack of adoption of best transportation practices
Lack of understanding the difference between price and cost
The Indian business network is very dynamic and doesn’t have one common set-up. With the reasoning
in the previous paragraph the network also relies on local knowledge and not having that knowledge
would make business far less effective. As there are central issues regarding fragmentation, structure of
the market and bureaucracy the local networks can gain much from utilizing local knowledge and
personal relationships to make business run smooth. In some instances, it is also hard to gain
information about specific issues and that information would therefore have to be collected on site. The
networks are localized to a high degree.
There is a division between high and low volume networks which affect quality of the whole supply
chain. High volume networks that handle high volumes and heavy transport have an advantage in
overall operations. The high volume network has high margin, possibility to use other modes than road
and is very short in terms of how many actors involved in the network. Low volume network are in LTL
cargo and light transports, and is exposed to all disadvantages on the market. The margins are generally
low, the supply chains are hard to oversee as there are many actors involved and the education level of
the people in these networks is generally low which can lead to difficulty with Quality of Services.
The network of actors is complex and takes a different form in relation to the type of load and level of
sophistication. The actors can be classified in the following actor groups:
Manufacturer
3PL
Agent
Broker
Transporter
And the Indian network can be viewed in Figure 44 which can also be seen below:
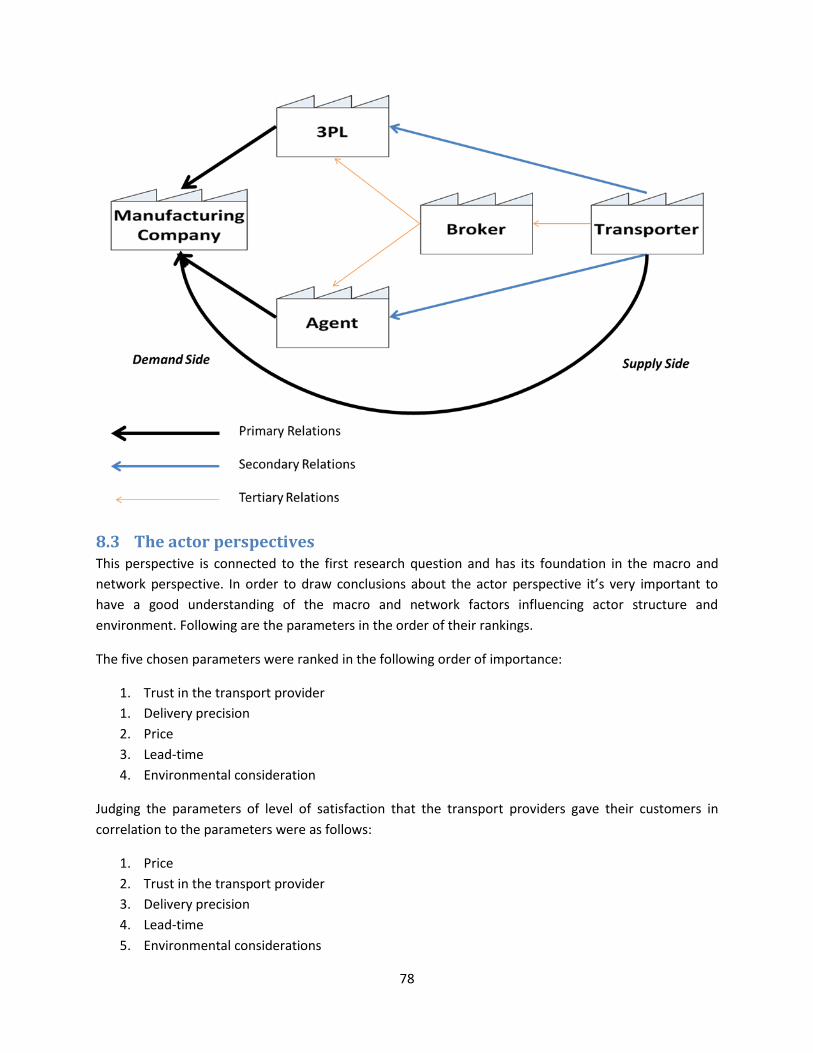
78
8.3 The actor perspectives This perspective is connected to the first research question and has its foundation in the macro and
network perspective. In order to draw conclusions about the actor perspective it’s very important to
have a good understanding of the macro and network factors influencing actor structure and
environment. Following are the parameters in the order of their rankings.
The five chosen parameters were ranked in the following order of importance:
1. Trust in the transport provider
1. Delivery precision
2. Price
3. Lead-time
4. Environmental consideration
Judging the parameters of level of satisfaction that the transport providers gave their customers in
correlation to the parameters were as follows:
1. Price
2. Trust in the transport provider
3. Delivery precision
4. Lead-time
5. Environmental considerations

79
Price remains the single most important factor when purchasing transport services but the market is
now looking for other parameters as well. The actors in the market seek trustworthy partners with full
transport capability but always with a focus on price. Trust, interpersonal relations and ability to meet
commitments on promised time have become very important. Expectation of higher lead time still
remains at the mercy of the state of the infrastructure.
The average Indian customer purchases a truck based on a long term commitment and also with limited
financial resources. There is a need to convince the buyer that the profitability gained by a truck offering
a total cost of ownership perspective over an extended time frame will exceed the capitalization costs to
be paid every month and at the same time reduce the costs for fuel and maintenance which are two of
the most important cost drivers. The network consists of many types of actors and is very active and
dynamic where actors move in, out and within the network.

80
9 FUTURE RESEARCH This study has focused on the market for trading on-road transport services within India and with a
special focus on long haulage heavy transports. The results are connected to broad macro perspectives
and boiled down, via common perceptions of Indian transport professionals, into actor perspectives and
a picture of the current Indian transport business network. This is a general study and the authors
struggled during parts of the process with not focusing too much on local matters but too keep the
broad perspectives. Also there are certain segments within the Indian transport business market that
provide both the best practice and worse practice.
There are many areas connected to the perspective of this thesis that would be very interesting and
worthy of their own studies:
An analysis of specific segments of transportation within India, i.e. reefer transport
A mapping of pan-India companies, the advantages and challenges in building that type of
organization
The actor movements within the Indian business network and how actors reinvent and grow in
the market
Correlation price of service and cost of supply chain in a low value product chain and a high
value product chain
These are some specific topics that the authors very much would like to read more about and could
bring valuable information to the industry, but of course there are many more. One thing is certain and
that is that the Indian transport business network will grow and be a major factor in the coming
development of India!
81
10 REFERENCES AGARWAL. 2011. RE: Speed Roadways. Type to ANDERSSON, C. & PURANIK, N. ARAUJO, L. & MOUZAS, S. 1997. Competition and cooperation in vertical marketing systems. Gemunden. BATRA, R. 2010. India Road Transportation Awards. The Economic Times Mumbai, 1. BERGVALL, E. 2011-01-27 2011. RE: Scania. Type to ANDERSSON, C. & PURANIK, N. BRITO, C. M. 2001. Towards an institutional theory of the dynamics of industrial networks. Journal of
Business & Industrial Marketing, 16, 16. BRYMAN, A. & BELL, E. 2011. Business research methods, Oxford Oxford University Press. CERVIN, A. 2011-05-02 2011. RE: Owner STL, businessman. Type to ANDERSSON, C. & PURANIK, N. CIA. 2012. The World Factbook [Online]. Available: https://www.cia.gov/library/publications/the-world-
factbook/ [Accessed 2012-04-20. DAHLBERG, K. 2011-07-15 2011. RE: Vice President Non-Captive Markets, Scania. Type to ANDERSSON,
C. & PURANIK, N. DASH, D. K. 2011. Short of drivers, 15% of Indian trucks lie idle. The Times of India. DFCCI. 2011. Dedicated Freight Corridor Corporation of India [Online]. Available:
http://dfccil.org/wps/portal/DFCCPortal. DICTIONARY, O. E. 2012. "market, n.", Oxford University Press. DMIC. 2011. Delhi Mumbai Industrial Corridor [Online]. Available:
http://delhimumbaiindustrialcorridor.com/. DUNNING, J. H. 2000. The eclectic paradigm as an envelope for economic and business theories of MNE
activity. International Business Review, 9, 27. ELLRAM, L. M. & CARR, A. 1994. Strategic purchasing: A history and review of the literature. Journal of
Supply Chain Management, 30, 10-10. F. EHSANIFAR; S.V. HOSSEINI; V. NORDH, E. T. N. Y. Y. Y. 2010. Transport consequences of strategic
purchasing decisions. Gothenburg: Anna Dubois. FORD, D., GADDE, L.-E., HÅKANSSON, H., LUNDGREN, A., SNEHOTA, I., TURNBULL, P. & WILSON, D. 1998.
Managing Business Relationships, Chichester, John Wiley & Sons. GANGADHARAN, V. 2011. RE: Shipping Corporation of India. Type to ANDERSSON, C. & PURANIK, N. GOOGLEMAPS. 2011. Overview Pune [Online]. Available: http://maps.google.co.in. GOYAL, A. 2011. RE: Managing Director, BLR Logistics. Type to ANDERSSON, C. & PURANIK, N. GUPTA, R., JAMBUNATHAN, S. & NETZER, T. 2010a. Building India: Transforming the nation's logistics
infrastructure. Mckinsey & Company. GUPTA, R., JAMBUNATHAN, S. & NETZER, T. 2010b. Building India: Transforming the nation's logistics
infrastructure. Infrastructure Practice. McKinsey & Company. HAIG, B. D. 2005. An Abductive Theory of Scientific Method. Psychological Methods, 10, 17. HINES, P., HOLWEG, M. & RICH, N. 2004. Learning to evolve: A review of contemporary lean thinking.
International Journal of Operations & Production Management, 24, 17. HÅKANSSON, H. & GADDE, L.-E. 2001. Supply Network Strategies, Chichester, John Wiley & Sons Ltd. HÅKANSSON, H. & SNEHOTA, I. 1995. Developing Relationships in Business Networks, London,
Routledge. INDIA, M. O. 2011. JOHANSON, J. & VAHLNE, J.-E. 1977. The internationalization process of the firm-a model of knowledge
development and increasing foreign market commitments. Journal of International Business Studies, 10.
JOHANSON, J. & VAHLNE, J.-E. 2009. The Uppsala internationalization process model revisited: From liability of foreignness to liability of outsidership. Journal of International Business Studies, 40, 21.

82
JOHANSON, J., VAHLNE, J.-E. & IVARSSON, I. 2011. The tortuous road to globalization for Volvo’s heavy truck business:
Extending the scope of the Uppsala model. International Business Review, 20, 14. JOHANSON, J. & WIEDERSHEIM-PAUL, F. 1975. The internationalization of the firm - four Swedish cases.
Journal of Management Studies, 12, 18. JOHANSON;, J. & VAHLNE, J.-E. 2009. The Uppsala internationalization process model revisited: From
liability of foreignness to liability of outsidership. Journal of International Business Studies (2009) 40, 1411–1431, 40, 21.
JONSSON, P. & MATTSSON, S.-A. 2009. Manufacturing, Planning and Control, London, McGraw-Hill Education.
K.L.THUKRAL. 2010. Transport Infrastructure Development for Poverty Reduction: Priorities, Constraints, and Strategies - ADB.org:. Asia Development Bank [Online]. Available: http://www.adb.org/Documents/Reports/Consultant/TAR-IND-4066/Transport/thukral.pdf.
KANAKIA, P., RAMASWAMY, N. & SRINIVAS, R. 2009. Competitiveness through efficient logistics. KPMG International & CII.
KOOPMANS, T. C. 1957. Three essays on the state of economic science, New York, McGraw-Hill. KPMG 2010a. Logistics in India Part 1. KPMG International. KPMG 2010b. Logistics in India Part 2. KPMG International. KUMAR, K. N. 2011a. Prized road projects on Delhi-Mumbai route. IBN Live, October 7. KUMAR, S. 2011b. RE: Trailer Fleet Owner. Type to ANDERSSON, C. & PURANIK, N. LAKEMEYER. 2011. RE: Branch Manager, Schenker. Type to ANDERSSON, C. & PURANIK, N. MATTSSON, S.-A. 2004. Logistikens termer och begrepp. In: PRODUKTIONSLOGISTIK, P. F. F. (ed.).
Stockholm. MINISTRY OF ROAD TRANSPORT AND HIGHWAYS, G. O. I. 2011. Available: http://morth.nic.in. NATARAJAN, R. 2010. India - The next big opportunity for global truck manufacturers. Motorindia. Gopali
& Co. NATURVÅRDSVERKET. 2012. Svenska utsläpp av växthusgaser [Online]. Available:
http://www.naturvardsverket.se/Start/Klimat/Utslapp-av-vaxthusgaser/Statistik-och-trender/Svenska-utslapp/.
NEILL, J. 2007. Qualitative versus Quantitative Research: Key Points in a Classic Debate [Online]. Available: http://wilderdom.com/research/QualitativeVersusQuantitativeResearch.html [Accessed 2011-05-14 2007-02-28].
NIC. 2011. Government of India. Available: http://business.gov.in/infrastructure/maritime_transport.php [Accessed 2011-05-17 2011].
PETER TURNBULL, D. F. A. M. C. 1996. Interaction, relationships and networks in business markets: an evolving perspective. Journal of Business & Industrial Marketing, 11, 18.
RANGANATHAN, S. 2011-06-13 2011. RE: President, Namakkal Transport Carriers. Type to ANDERSSON, C. & PURANIK, N.
RESEARCH, C. B. C. 2008. Enhancing Foreign Trade Competitiveness through Logistics Efficiency. CII Conference on Logistics Efficiency. Hyderabad.
SATAPATHY, R. K. & DUBEY, P. 2011. RE: Kuehne+Nagel. Type to ANDERSSON, C. & PURANIK, N. SCANIA 2008. The history of Scania Scania. SCANIA 2011. Annual Report 2010. SETHI, J. 2011. RE: CEO Supply Chain Services, Transport Corporation of India. Type to ANDERSSON, C. &
PURANIK, N. SOMNATH BHATTACHARJEE, P. O. V. T. I. It has been a daunting task. Outlook Business.
83
SRIRAMAN, S. 2006. Competition issues in the road goods transport industry in Indiawith special reference to the Mumbai metropolitan region. New Delhi: The Competition Commision of India.
SUNDQUIST, V. 2011. Intermediation in Business Networks: A case study in the textile and clothing industry. Licentiate of Engineering, Chalmers University of Technology.
TALGERI, K. 2009. It has been a daunting task. Business, Outlook India. TODAY, M. 2011. Logistics. Manufacturing Today. June ed. Mumbai: ITP Publishing Group. TOUBRO, L. A. 2011. Available: www.larsentoubro.com [Accessed 2011-07-20. VAHLNE, J.-E. 2012-03-13 2012. RE: Professor Management & Organisation, University of Gothenburg.
Type to ANDERSSON, C. VRIES, G. D., ERUMBAN, A. A., TIMMER, M. P., VOSKOBOYNIKOV, I. B. & WU, H. X. 2012. Deconstructing
the BRICs: Structural Transformation and Aggregate Productivity Growth. Moscow: Higher School of Economics Research Paper No. WB BRP 04/EC/2011

84
11 APPENDICES
11.1 Pre-study This pre-study is supposed to give an insight and a macro perspective of India and the major goods flows
within the country. It gives a foundation into better understanding the rest of the report and major
factors influencing logistics in India.
11.1.1 Introduction to India
India lies in Southern Asia bordering the Arabian Sea and the Bay of Bengal and also bordering
Bangladesh, Bhutan, Burma, China, Nepal and Pakistan as seen in Figure 51 (CIA, 2012).
Figure 51: Map of India and borders
India is a vast country with traditions going back millennia, making it one of the oldest civilizations in the
world. The country span 28 different states and 7 union territories within which 22 different official
languages are spoken (English being one of them). Figure 52 shows the Hindi belt of India. Hindi is the
most widely spoken language in India, however, it may not be spoken at all in certain parts of India
especially in the southern states of India.
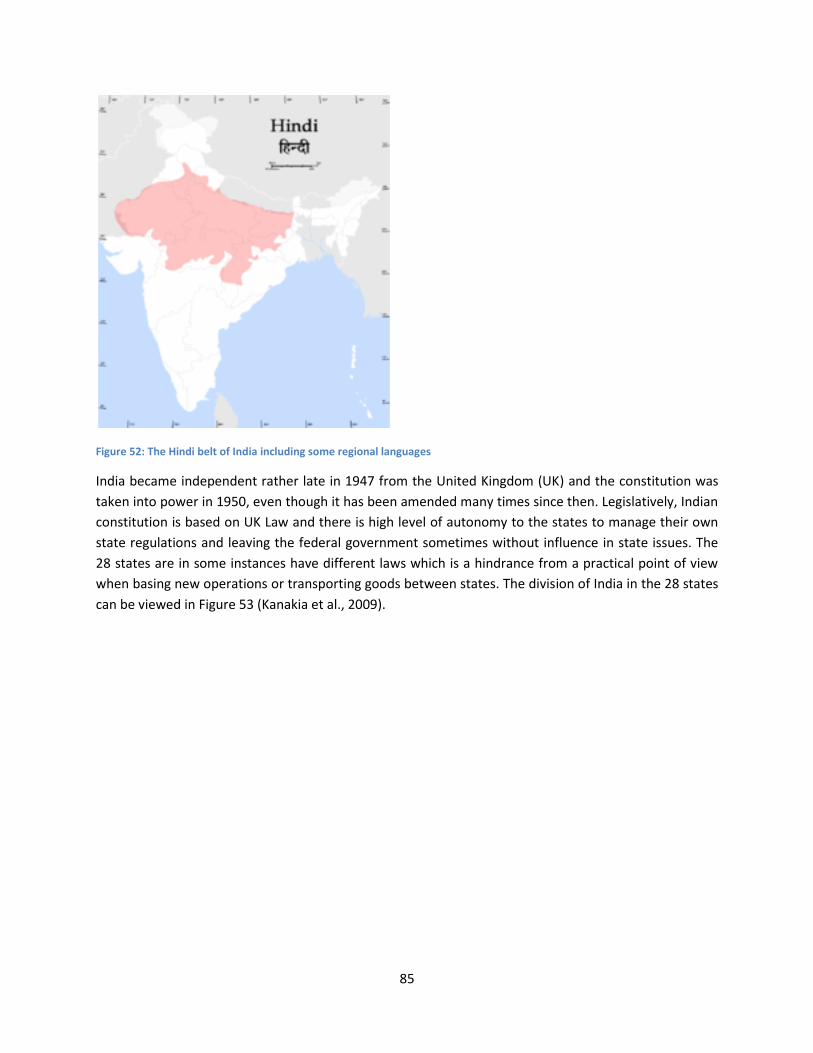
85
Figure 52: The Hindi belt of India including some regional languages
India became independent rather late in 1947 from the United Kingdom (UK) and the constitution was
taken into power in 1950, even though it has been amended many times since then. Legislatively, Indian
constitution is based on UK Law and there is high level of autonomy to the states to manage their own
state regulations and leaving the federal government sometimes without influence in state issues. The
28 states are in some instances have different laws which is a hindrance from a practical point of view
when basing new operations or transporting goods between states. The division of India in the 28 states
can be viewed in Figure 53 (Kanakia et al., 2009).
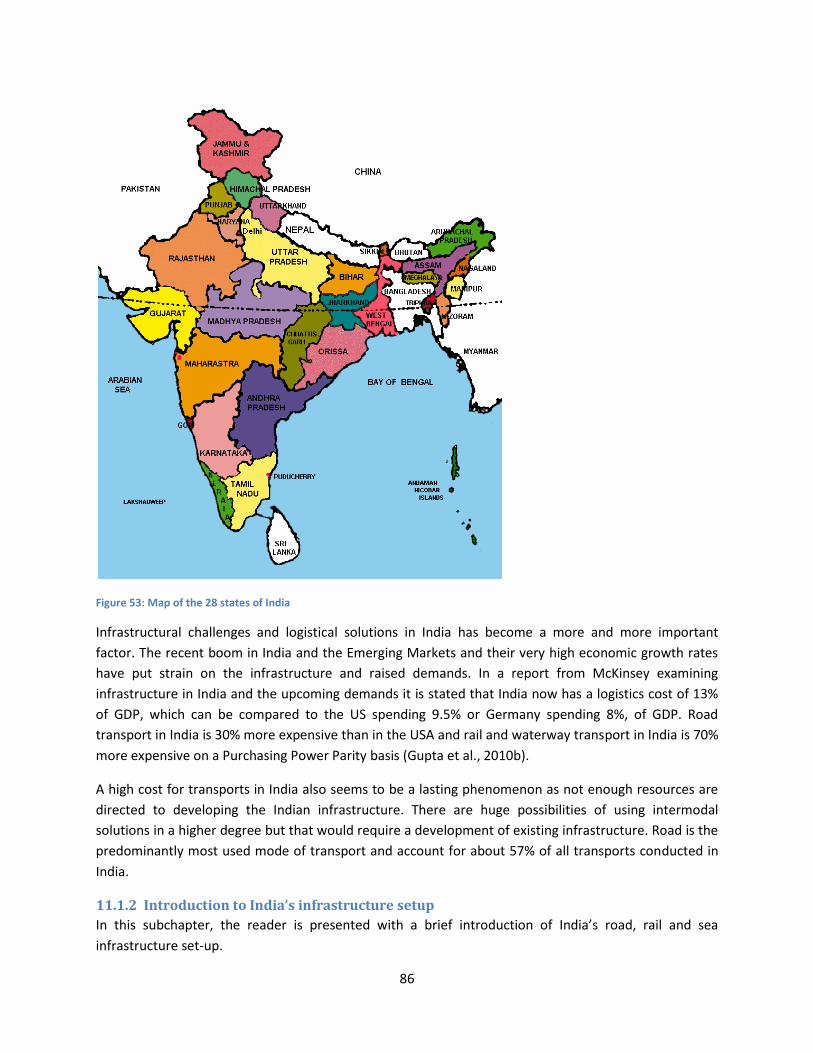
86
Figure 53: Map of the 28 states of India
Infrastructural challenges and logistical solutions in India has become a more and more important
factor. The recent boom in India and the Emerging Markets and their very high economic growth rates
have put strain on the infrastructure and raised demands. In a report from McKinsey examining
infrastructure in India and the upcoming demands it is stated that India now has a logistics cost of 13%
of GDP, which can be compared to the US spending 9.5% or Germany spending 8%, of GDP. Road
transport in India is 30% more expensive than in the USA and rail and waterway transport in India is 70%
more expensive on a Purchasing Power Parity basis (Gupta et al., 2010b).
A high cost for transports in India also seems to be a lasting phenomenon as not enough resources are
directed to developing the Indian infrastructure. There are huge possibilities of using intermodal
solutions in a higher degree but that would require a development of existing infrastructure. Road is the
predominantly most used mode of transport and account for about 57% of all transports conducted in
India.
11.1.2 Introduction to India’s infrastructure setup
In this subchapter, the reader is presented with a brief introduction of India’s road, rail and sea
infrastructure set-up.
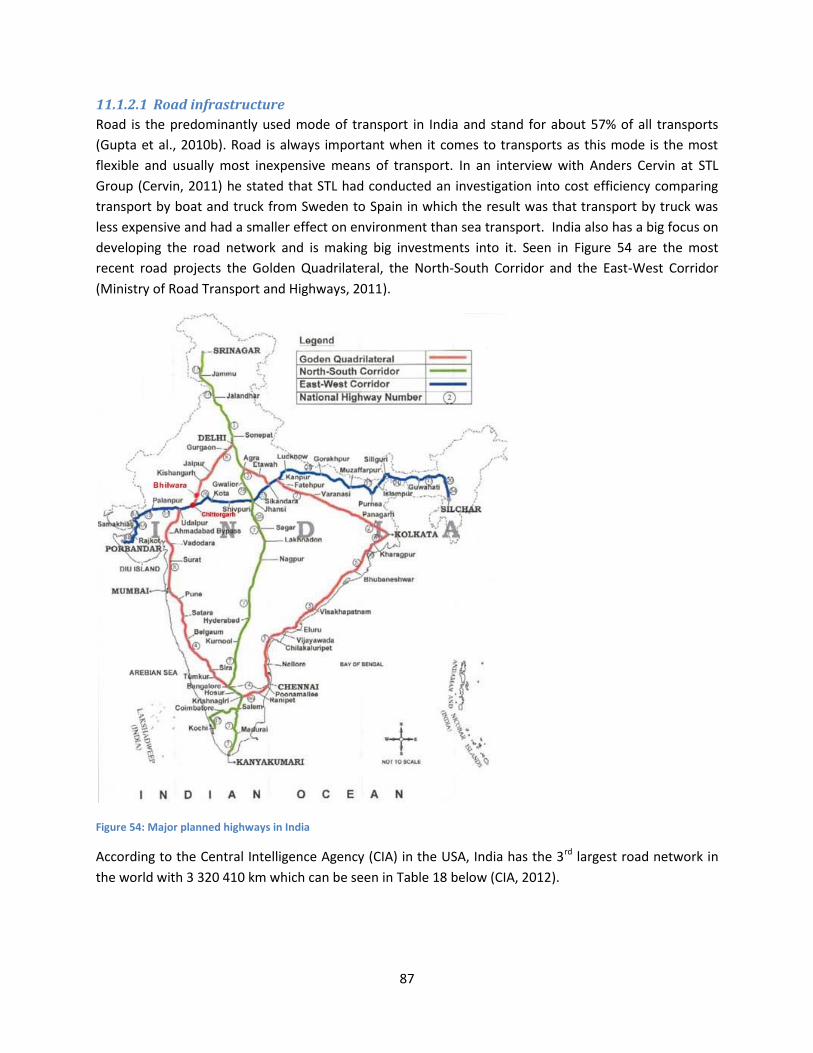
87
11.1.2.1 Road infrastructure
Road is the predominantly used mode of transport in India and stand for about 57% of all transports
(Gupta et al., 2010b). Road is always important when it comes to transports as this mode is the most
flexible and usually most inexpensive means of transport. In an interview with Anders Cervin at STL
Group (Cervin, 2011) he stated that STL had conducted an investigation into cost efficiency comparing
transport by boat and truck from Sweden to Spain in which the result was that transport by truck was
less expensive and had a smaller effect on environment than sea transport. India also has a big focus on
developing the road network and is making big investments into it. Seen in Figure 54 are the most
recent road projects the Golden Quadrilateral, the North-South Corridor and the East-West Corridor
(Ministry of Road Transport and Highways, 2011).
Figure 54: Major planned highways in India
According to the Central Intelligence Agency (CIA) in the USA, India has the 3rd largest road network in
the world with 3 320 410 km which can be seen in Table 18 below (CIA, 2012).
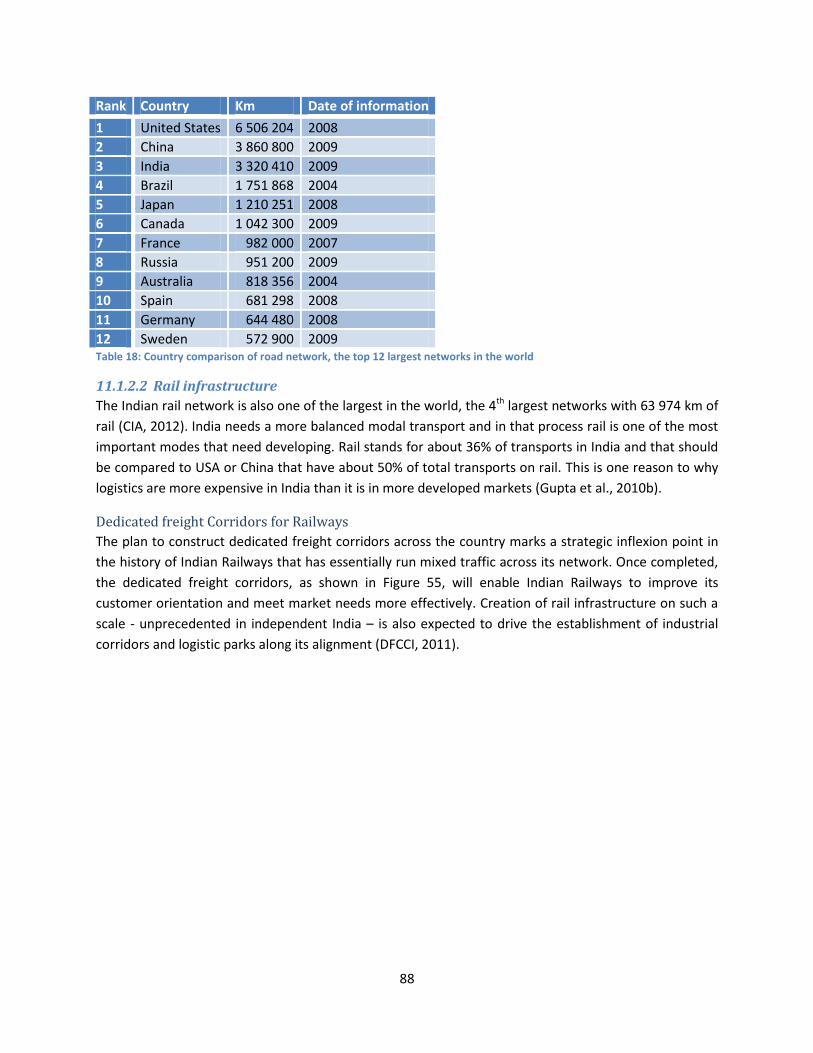
88
Rank Country Km Date of information
1 United States 6 506 204 2008
2 China 3 860 800 2009
3 India 3 320 410 2009
4 Brazil 1 751 868 2004
5 Japan 1 210 251 2008
6 Canada 1 042 300 2009
7 France 982 000 2007
8 Russia 951 200 2009
9 Australia 818 356 2004
10 Spain 681 298 2008
11 Germany 644 480 2008
12 Sweden 572 900 2009 Table 18: Country comparison of road network, the top 12 largest networks in the world
11.1.2.2 Rail infrastructure
The Indian rail network is also one of the largest in the world, the 4th largest networks with 63 974 km of
rail (CIA, 2012). India needs a more balanced modal transport and in that process rail is one of the most
important modes that need developing. Rail stands for about 36% of transports in India and that should
be compared to USA or China that have about 50% of total transports on rail. This is one reason to why
logistics are more expensive in India than it is in more developed markets (Gupta et al., 2010b).
Dedicated freight Corridors for Railways
The plan to construct dedicated freight corridors across the country marks a strategic inflexion point in
the history of Indian Railways that has essentially run mixed traffic across its network. Once completed,
the dedicated freight corridors, as shown in Figure 55, will enable Indian Railways to improve its
customer orientation and meet market needs more effectively. Creation of rail infrastructure on such a
scale - unprecedented in independent India – is also expected to drive the establishment of industrial
corridors and logistic parks along its alignment (DFCCI, 2011).

89
Figure 55: Proposed Freight Corridors for Railways
In the first phase the Dedicated Freight Corridor Corporation of India will be constructing two corridors –
the Western Dedicated Freight Corridor (DFC) and Eastern DFC- spanning a total length of about 3 300
km. The Eastern Corridor, starting from Ludhiana in Punjab will pass through the states of Haryana,
Uttar Pradesh, and Bihar and terminate at Dankuni in West Bengal. The Western Corridor will traverse
the distance from Dadri to Mumbai, passing through the states of Delhi, Haryana, Rajasthan, Gujarat and
Maharashtra (DFCCI, 2011).
11.1.2.3 Sea transport infrastructure
India is a vast nation with a very long coastline of 1 000 km. Historically sea transport has always been
very important and this doesn’t seem to be changing anytime soon. Figure 51 give a good view of India
as a whole and ports and terminals can be seen in Table 19 below (CIA, 2012).
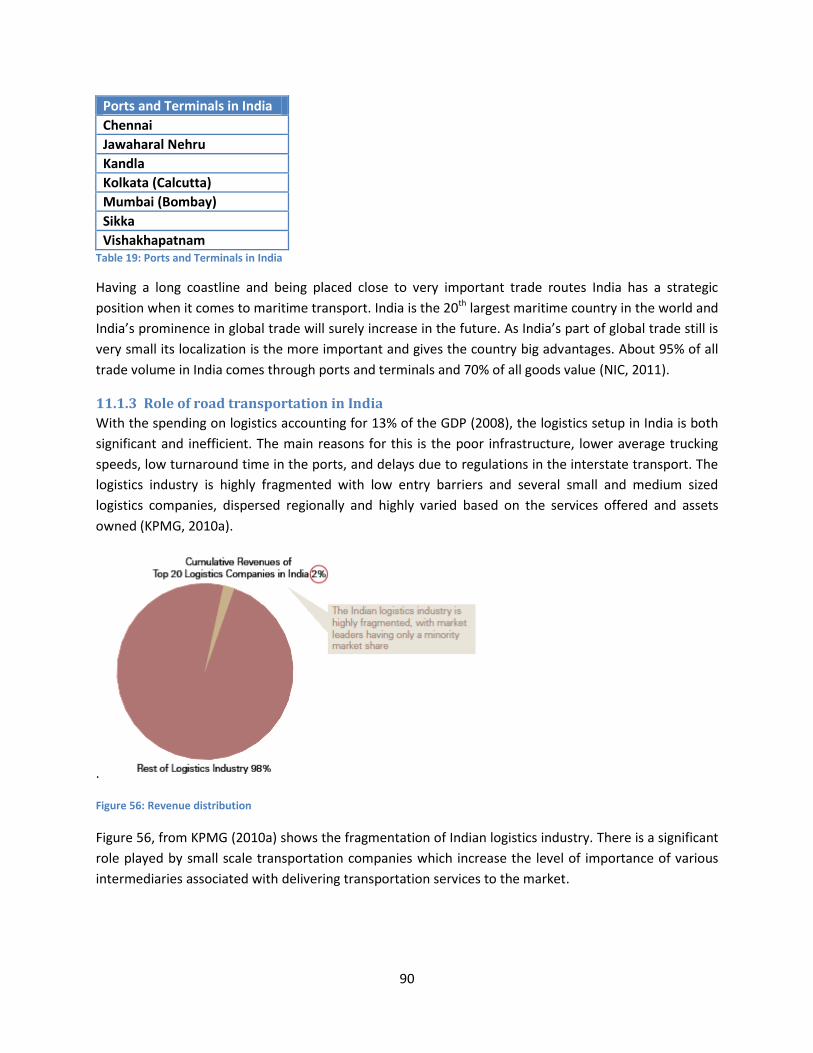
90
Ports and Terminals in India
Chennai
Jawaharal Nehru
Kandla
Kolkata (Calcutta)
Mumbai (Bombay)
Sikka
Vishakhapatnam Table 19: Ports and Terminals in India
Having a long coastline and being placed close to very important trade routes India has a strategic
position when it comes to maritime transport. India is the 20th largest maritime country in the world and
India’s prominence in global trade will surely increase in the future. As India’s part of global trade still is
very small its localization is the more important and gives the country big advantages. About 95% of all
trade volume in India comes through ports and terminals and 70% of all goods value (NIC, 2011).
11.1.3 Role of road transportation in India
With the spending on logistics accounting for 13% of the GDP (2008), the logistics setup in India is both
significant and inefficient. The main reasons for this is the poor infrastructure, lower average trucking
speeds, low turnaround time in the ports, and delays due to regulations in the interstate transport. The
logistics industry is highly fragmented with low entry barriers and several small and medium sized
logistics companies, dispersed regionally and highly varied based on the services offered and assets
owned (KPMG, 2010a).
.
Figure 56: Revenue distribution
Figure 56, from KPMG (2010a) shows the fragmentation of Indian logistics industry. There is a significant
role played by small scale transportation companies which increase the level of importance of various
intermediaries associated with delivering transportation services to the market.

91
Figure 57: Role of road transportation in India
Based on Figure 57 (KPMG, 2010b), the road transportation role can be classified into 4 types. The first is
the haulage. The haulage can be over a long distance greater than 800 km, medium distance i.e. 350-800
km, short haul i.e. 50-250 km and last mile transportation. The second is the size of the operators.
Majority of the truck owners in India have trucks fewer than 5 in quantity. Third is the nature of
operations. The operation can be a Full Truck Load, Less than truck load or express shipments. Fourth is
the nature of the transaction and relationship. This is categorized into a contractual transaction and spot
transactions.
11.1.4 Regulatory framework
The cascading effect of local taxes and complex regulatory structure of central and state bodies have
added to the inefficiencies in business. The dual governance structure of central and state bodies make
the tax system very complicated. The multilayered system with both central and state governments
having the power to levy tax brings much inefficiency in the system. The double taxation policy also add
costs as the tax paid earlier in the value chain gets re taxed and the firms end up paying tax on the tax
paid.
The new Goods and Services Tax (GST) which is scheduled to be presented before the Indian Parliament
after deliberations from the Parliamentary standing committee, is expected to bring major reforms and
major change in rationalizing and simplifying the tax structure. This reform is expected to subsume
many of the state and central indirect taxes as shown in Figure 58 (Today, 2011).
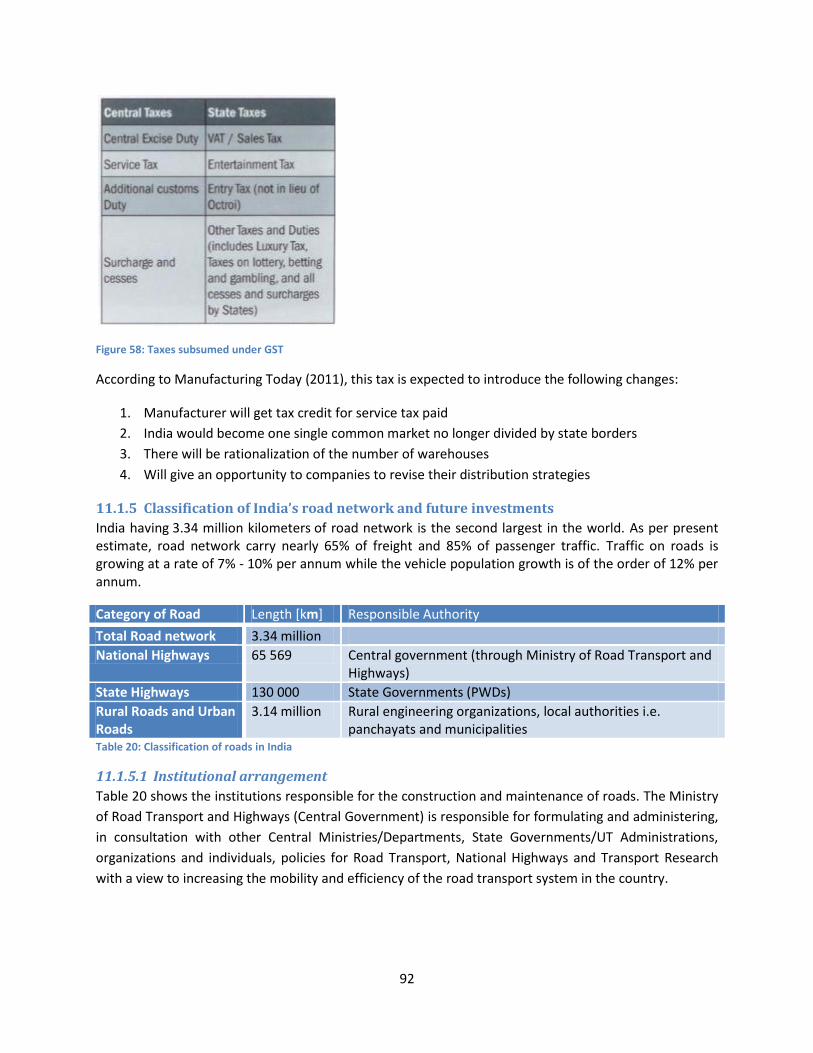
92
Figure 58: Taxes subsumed under GST
According to Manufacturing Today (2011), this tax is expected to introduce the following changes:
1. Manufacturer will get tax credit for service tax paid
2. India would become one single common market no longer divided by state borders
3. There will be rationalization of the number of warehouses
4. Will give an opportunity to companies to revise their distribution strategies
11.1.5 Classification of India’s road network and future investments
India having 3.34 million kilometers of road network is the second largest in the world. As per present estimate, road network carry nearly 65% of freight and 85% of passenger traffic. Traffic on roads is growing at a rate of 7% - 10% per annum while the vehicle population growth is of the order of 12% per annum.
Category of Road Length [km] Responsible Authority
Total Road network 3.34 million
National Highways 65 569 Central government (through Ministry of Road Transport and Highways)
State Highways 130 000 State Governments (PWDs)
Rural Roads and Urban Roads
3.14 million Rural engineering organizations, local authorities i.e. panchayats and municipalities
Table 20: Classification of roads in India
11.1.5.1 Institutional arrangement
Table 20 shows the institutions responsible for the construction and maintenance of roads. The Ministry
of Road Transport and Highways (Central Government) is responsible for formulating and administering,
in consultation with other Central Ministries/Departments, State Governments/UT Administrations,
organizations and individuals, policies for Road Transport, National Highways and Transport Research
with a view to increasing the mobility and efficiency of the road transport system in the country.
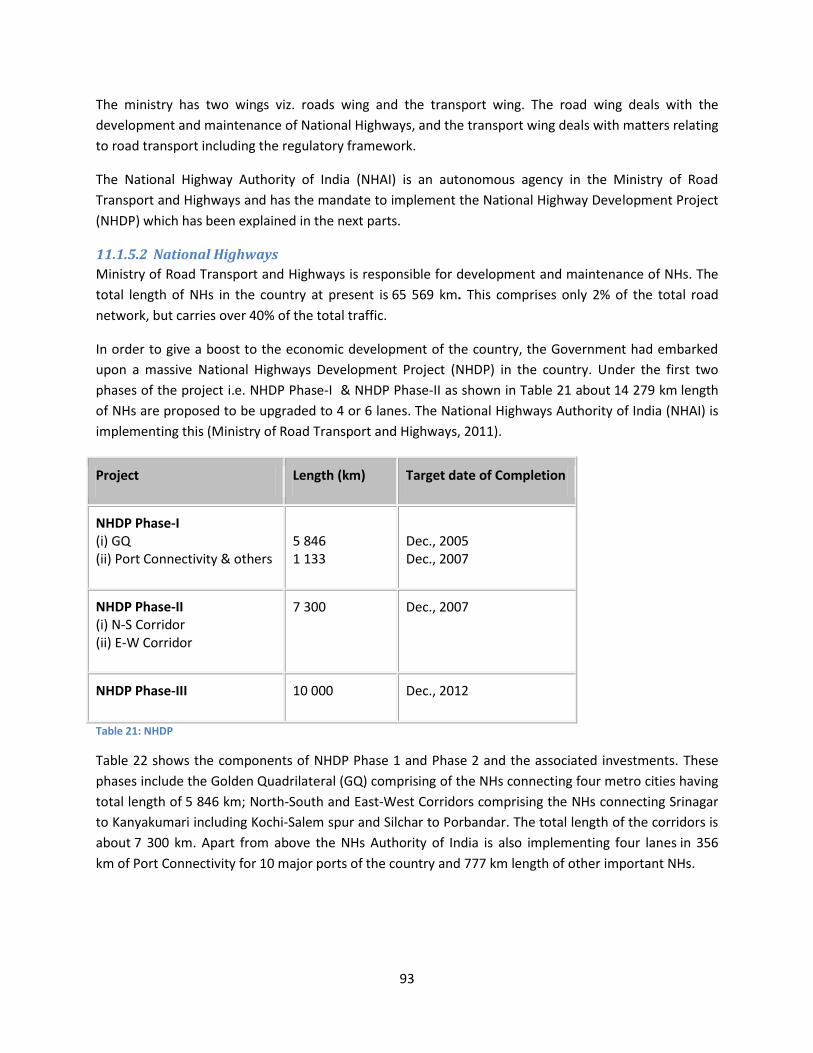
93
The ministry has two wings viz. roads wing and the transport wing. The road wing deals with the
development and maintenance of National Highways, and the transport wing deals with matters relating
to road transport including the regulatory framework.
The National Highway Authority of India (NHAI) is an autonomous agency in the Ministry of Road
Transport and Highways and has the mandate to implement the National Highway Development Project
(NHDP) which has been explained in the next parts.
11.1.5.2 National Highways
Ministry of Road Transport and Highways is responsible for development and maintenance of NHs. The
total length of NHs in the country at present is 65 569 km. This comprises only 2% of the total road
network, but carries over 40% of the total traffic.
In order to give a boost to the economic development of the country, the Government had embarked
upon a massive National Highways Development Project (NHDP) in the country. Under the first two
phases of the project i.e. NHDP Phase-I & NHDP Phase-II as shown in Table 21 about 14 279 km length
of NHs are proposed to be upgraded to 4 or 6 lanes. The National Highways Authority of India (NHAI) is
implementing this (Ministry of Road Transport and Highways, 2011).
Project Length (km) Target date of Completion
NHDP Phase-I (i) GQ (ii) Port Connectivity & others
5 846 1 133
Dec., 2005 Dec., 2007
NHDP Phase-II (i) N-S Corridor (ii) E-W Corridor
7 300 Dec., 2007
NHDP Phase-III 10 000 Dec., 2012
Table 21: NHDP
Table 22 shows the components of NHDP Phase 1 and Phase 2 and the associated investments. These
phases include the Golden Quadrilateral (GQ) comprising of the NHs connecting four metro cities having
total length of 5 846 km; North-South and East-West Corridors comprising the NHs connecting Srinagar
to Kanyakumari including Kochi-Salem spur and Silchar to Porbandar. The total length of the corridors is
about 7 300 km. Apart from above the NHs Authority of India is also implementing four lanes in 356
km of Port Connectivity for 10 major ports of the country and 777 km length of other important NHs.

94
Project Length (km) Cost (Rs. in Crore)
NHDP Phase-I & II (i) GQ (ii) N-S Corridor (iii) E-W Corridor (iv) Port Connectivity & others
5 846 7 300 1 133
64 639
Table 22: NHDP, phase 1 & phase 2
11.1.5.3
NHDP Phase-III Length (In Km) Target date of Completion
NHDP Phase-III A 4 000 Dec. 2009
NHDP Phase-III B 6 000 Dec. 2012
Table 23: NHDP, phase 3
Table 23 shows the program being implemented by the National Highways Authority of India (NHAI)
envisaging four-lane of about 10 000 km of existing NHs (other than NHDP Phase –I&II) and is proposed
to be undertaken on Built – Operate – Transfer (BOT) basis. NHDP phase-III will provide connectivity to
important places not covered under NHDP Phase-I&II. This includes connectivity of numbers of State
Capitals with NHDP Phase-I&II, high-density corridors, places of tourist and economic importance etc.
(Ministry of Road Transport and Highways, 2011).
11.1.5.4 Development of National Highways other than NHDP (Phase I & II)
Apart from National Highways Development Projects (NHDP), there are about 41 290 km of National
Highways whose development and maintenance is being carried out from the funds available from
Budget. The development works like improvement of riding quality, widening to 2/4 lane, strengthening,
construction of bypasses and rehabilitation/construction of bridges etc. have been undertaken for these
National Highways. These sections of National Highways are being executed by the respective State
Departments and Border Road Organization on agency basis. Projects on-road development has also
been taken up in various parts of the country with the assistance of World Bank, Asian Development
Bank and Japan Bank for International Cooperation (Ministry of Road Transport and Highways, 2011).
11.1.5.5 Delhi Mumbai Industrial Corridor
Government of India has announced establishing of the multi-modal, high axle load, dedicated freight
corridor (DFC) between Delhi and Mumbai, covering an overall length of 1 483 km and passing through
the six States – Uttar Pradesh, National Capital Region (NCR) of Delhi, Haryana, Rajasthan, Gujarat and
Maharashtra, with end terminals at Dadri in the Delhi NCR and Jawaharlal Nehru Port near Mumbai as
shown in Figure 59.
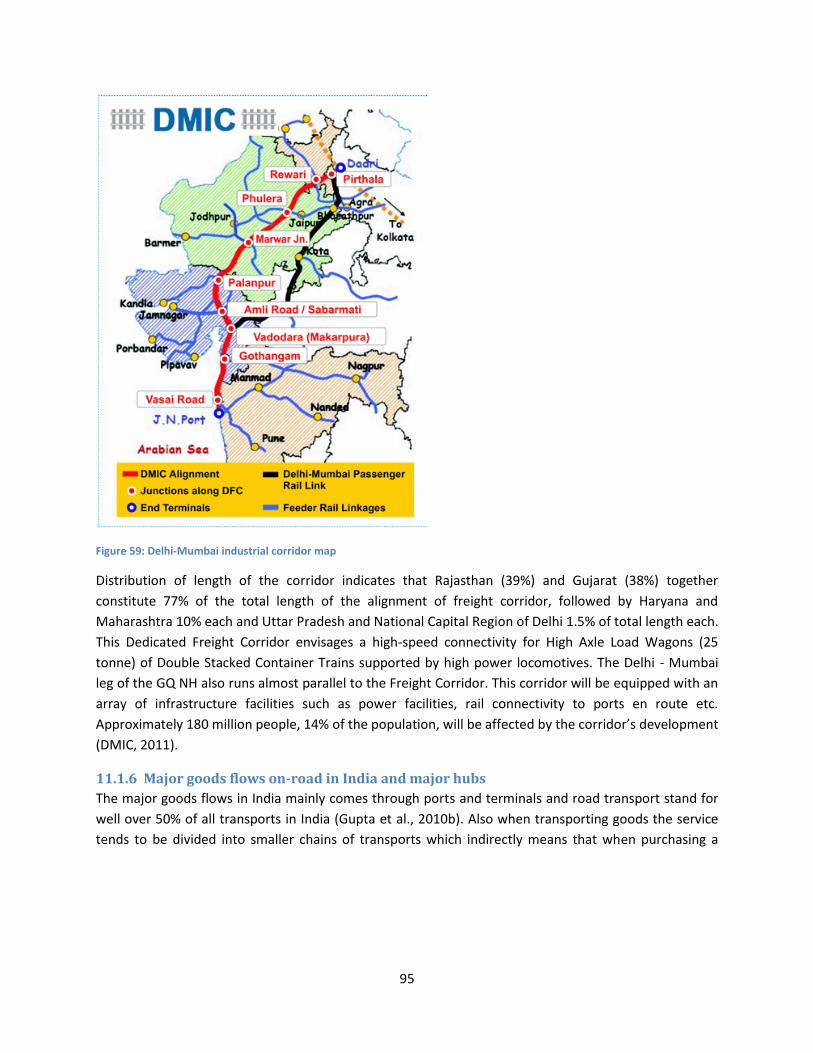
95
Figure 59: Delhi-Mumbai industrial corridor map
Distribution of length of the corridor indicates that Rajasthan (39%) and Gujarat (38%) together
constitute 77% of the total length of the alignment of freight corridor, followed by Haryana and
Maharashtra 10% each and Uttar Pradesh and National Capital Region of Delhi 1.5% of total length each.
This Dedicated Freight Corridor envisages a high-speed connectivity for High Axle Load Wagons (25
tonne) of Double Stacked Container Trains supported by high power locomotives. The Delhi - Mumbai
leg of the GQ NH also runs almost parallel to the Freight Corridor. This corridor will be equipped with an
array of infrastructure facilities such as power facilities, rail connectivity to ports en route etc.
Approximately 180 million people, 14% of the population, will be affected by the corridor’s development
(DMIC, 2011).
11.1.6 Major goods flows on-road in India and major hubs
The major goods flows in India mainly comes through ports and terminals and road transport stand for
well over 50% of all transports in India (Gupta et al., 2010b). Also when transporting goods the service
tends to be divided into smaller chains of transports which indirectly means that when purchasing a

96
transport service in India, at least a part of the transport service would be done on-road.
Figure 60: Estimate of traffic volumes in India 2007
Seen in Figure 60 above (Gupta et al., 2010b) are the major routes for goods transport in India. As can
be seen the 7 major corridors are handle about 50% of all goods transport and they are:
Delhi-Mumbai
Delhi-Kolkata
Mumbai-Kolkata
Delhi-Chennai
Mumbai-Chennai
Kolkata-Chennai
Kandla-Kochi
According to Kumar (2011a), the Golden Quadrilateral accounts for more than 60% of goods transported
in India and the Delhi-Mumbai route accounts for more than 40% of these goods. Further, the volume of
air cargo traffic in the country will be 2.64 million tonnes this year and half of this is expected to come
from Delhi and Mumbai, with Delhi accounting for 600 000 tonnes while Mumbai accounts for 500 000
tonnes.
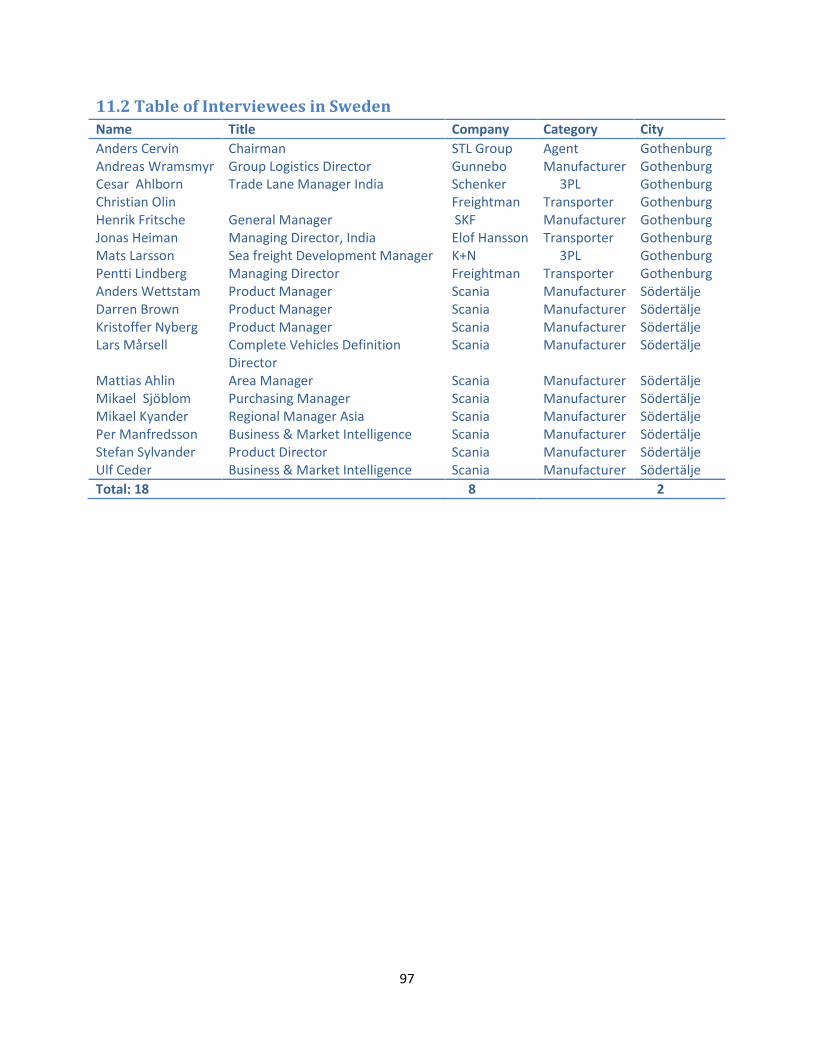
97
11.2 Table of Interviewees in Sweden
Name Title Company Category City
Anders Cervin Chairman STL Group Agent Gothenburg Andreas Wramsmyr Group Logistics Director Gunnebo Manufacturer Gothenburg Cesar Ahlborn Trade Lane Manager India Schenker 3PL Gothenburg Christian Olin Freightman Transporter Gothenburg Henrik Fritsche General Manager SKF Manufacturer Gothenburg Jonas Heiman Managing Director, India Elof Hansson Transporter Gothenburg Mats Larsson Sea freight Development Manager K+N 3PL Gothenburg Pentti Lindberg Managing Director Freightman Transporter Gothenburg Anders Wettstam Product Manager Scania Manufacturer Södertälje Darren Brown Product Manager Scania Manufacturer Södertälje Kristoffer Nyberg Product Manager Scania Manufacturer Södertälje Lars Mårsell Complete Vehicles Definition
Director Scania Manufacturer Södertälje
Mattias Ahlin Area Manager Scania Manufacturer Södertälje Mikael Sjöblom Purchasing Manager Scania Manufacturer Södertälje Mikael Kyander Regional Manager Asia Scania Manufacturer Södertälje Per Manfredsson Business & Market Intelligence Scania Manufacturer Södertälje Stefan Sylvander Product Director Scania Manufacturer Södertälje Ulf Ceder Business & Market Intelligence Scania Manufacturer Södertälje
Total: 18 8 2

98
11.3 Table of interviewees in India
Name Title Company Category City
Björn Savlid Consultant Swedish Trade Council Other Bangalore Henrik Fagrenius MD Scania AB Manufacturer Bangalore Shivaji Prasad Branch Manager DAMCO 3PL Bangalore Archana Bharati Deputy GM Shipping Corporation of
India Other Chennai
Gangadharan Vinod GM Shipping Corporation of India
Other Chennai
Nalena G. Asst. Manager Commercial
VAAS Manufacturer Chennai
P. Mathur General Manager Elof Hansson Manufacturer Chennai Rajinder Singh MD Janta Roadways Transporter Chennai Ranganathan S. President Namakkal Transport
Carriers (Namakkal) Transporter Chennai
S. Vijayakrishnan President VAAS Manufacturer Chennai Suresh Kumar MD Suresh Kumar Transporter Chennai V. Rajaraman Sr. Manager Finance VAAS Manufacturer Chennai A. Bose Country Manager Philips India Manufacturer Gurgaon Jasjit Sethi CEO TCI-SCS 3PL Gurgaon Kshitij Mohan Transport solution
provider K+N 3PL Gurgaon
KV Mittal GM Finance K+N 3PL Gurgaon Pankaj Dubey Deputy GM Business
Development K+N 3PL Gurgaon
R K Satapathy National Manager Distribution
K+N 3PL Gurgaon
A L Goyal MD BLR Logistics Transporter Mumbai Ashutosh Sathe Director Associated Container
Line (ACL) Agent Mumbai
G. Kannan Joint GM L&T-Logistics Manufacturer Mumbai G.D. Agarwal Executive Director Speed Roadways Agent Mumbai Keshav Shetty Deputy Manager-Sea
Freight K+N 3PL Mumbai
Ketan Kulkarni Vice President Marketing
Blue Dart 3PL Mumbai
MRJ Sarma Gunnebo Manufacturer Mumbai Naveen Nischal Head of
Transportation DB Schenker 3PL Mumbai
Puneet Agarwal SCM Director Speed Roadways Agent Mumbai Siddhesh Pujari Asst. Manager- Sea
Exports K+N 3PL Mumbai
Ajay Sachdeva Senior Project Manager
Swedish Trade Council Other New Delhi
Ashok Dhingra MD DGFC Transporter New Delhi K.V. Mittal GM DGFC Transporter New Delhi
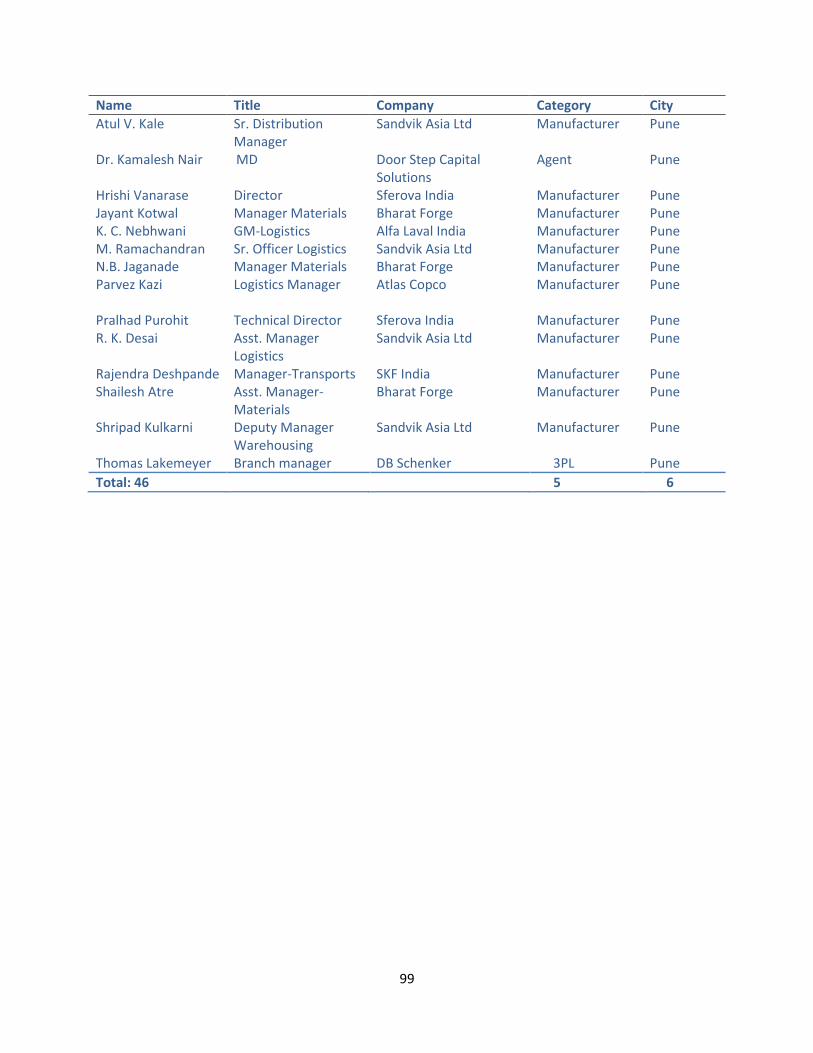
99
Name Title Company Category City
Atul V. Kale Sr. Distribution Manager
Sandvik Asia Ltd Manufacturer Pune
Dr. Kamalesh Nair MD Door Step Capital Solutions
Agent Pune
Hrishi Vanarase Director Sferova India Manufacturer Pune Jayant Kotwal Manager Materials Bharat Forge Manufacturer Pune K. C. Nebhwani GM-Logistics Alfa Laval India Manufacturer Pune M. Ramachandran Sr. Officer Logistics Sandvik Asia Ltd Manufacturer Pune N.B. Jaganade Manager Materials Bharat Forge Manufacturer Pune Parvez Kazi Logistics Manager Atlas Copco
Manufacturer Pune
Pralhad Purohit Technical Director Sferova India Manufacturer Pune R. K. Desai Asst. Manager
Logistics Sandvik Asia Ltd Manufacturer Pune
Rajendra Deshpande Manager-Transports SKF India Manufacturer Pune Shailesh Atre Asst. Manager-
Materials Bharat Forge Manufacturer Pune
Shripad Kulkarni Deputy Manager Warehousing
Sandvik Asia Ltd Manufacturer Pune
Thomas Lakemeyer Branch manager DB Schenker 3PL Pune
Total: 46 5 6
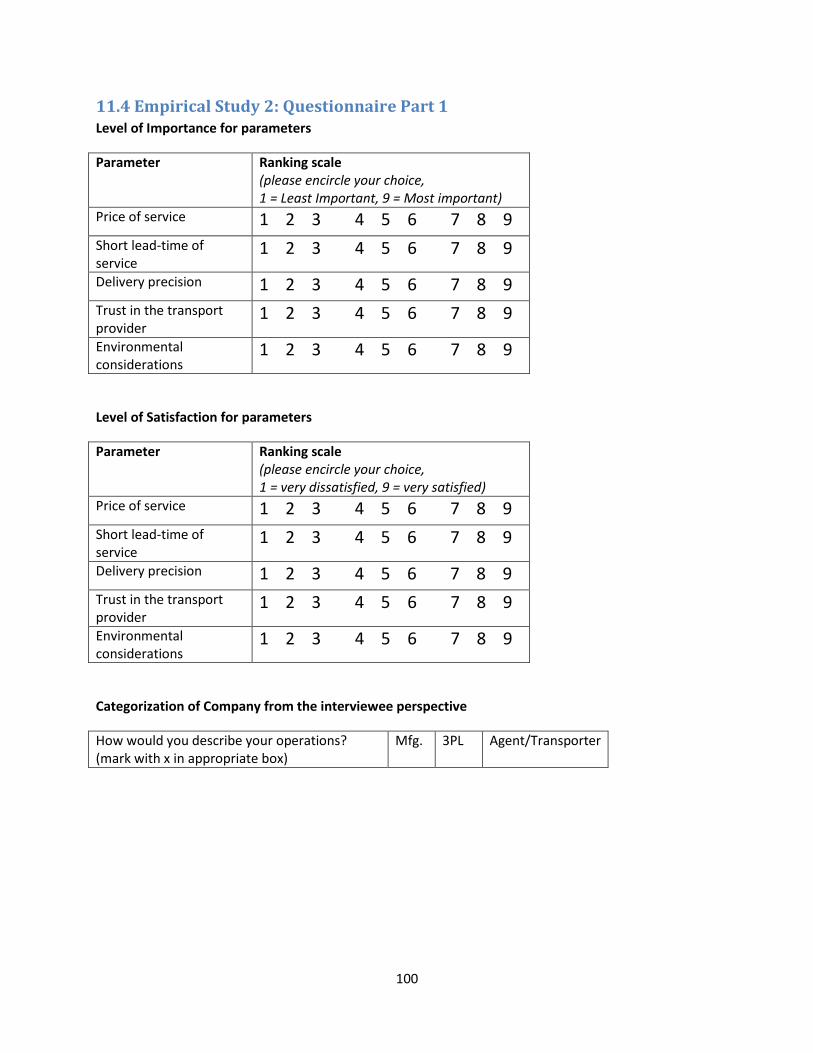
100
11.4 Empirical Study 2: Questionnaire Part 1 Level of Importance for parameters
Parameter Ranking scale (please encircle your choice, 1 = Least Important, 9 = Most important)
Price of service 1 2 3 4 5 6 7 8 9
Short lead-time of service
1 2 3 4 5 6 7 8 9
Delivery precision 1 2 3 4 5 6 7 8 9
Trust in the transport provider
1 2 3 4 5 6 7 8 9
Environmental considerations
1 2 3 4 5 6 7 8 9
Level of Satisfaction for parameters
Parameter Ranking scale (please encircle your choice, 1 = very dissatisfied, 9 = very satisfied)
Price of service 1 2 3 4 5 6 7 8 9
Short lead-time of service
1 2 3 4 5 6 7 8 9
Delivery precision 1 2 3 4 5 6 7 8 9
Trust in the transport provider
1 2 3 4 5 6 7 8 9
Environmental considerations
1 2 3 4 5 6 7 8 9
Categorization of Company from the interviewee perspective
How would you describe your operations? (mark with x in appropriate box)
Mfg. 3PL Agent/Transporter

101
11.5 Empirical Study 2: Questionnaire Part 2 Interviewee presentation
1. Background and Career?
2. What is the current position and responsibility of the interviewee?
Company introduction
3. Global and Indian presence.
4. Which are the different modes of transportation used?
Logistic network in India
5. Describe the logistics network of the company in India, as it relates to physical assets.
6. What logistical activities are performed by the company?
7. Major changes/modifications in these activities in the next 5/10/20 years?
Key actors in the network
8. Describe the role of different major and minor actors within the company’s logistics network.
9. Describe the relationship between the company and these actors (long term/short term/close
collaboration/arm’s length).
10. Which major factors influence these relations?
Important logistics parameters
11. Which are the most important parameters considered to measure the performance of trucking
services?
12. Where do you see the highest possibilities of improving the performance of trucking services in
the future?
On-road transportation needs
13. What kinds of products are shipped on on-road by the company in India?
14. Which are the major routes covered in India by on-road transportation?
15. How much is the capacity of an average truck over long haulage and for distribution?
16. What is the relative cost for transportation and total logistics cost in relation to price of product
or goods value?
On-road transportation requirements
17. What kinds of demands are imposed by the company on the LSPs while purchasing on-road
logistical services?
18. List down the important criteria used in order of their importance while purchasing on-road
transportation services.
102
On-road transportation challenges
19. What are the major problems faced by the company in transportation of goods over long
distances in India focusing on on-road transportation?
20. What is the company strategy to manage these problems?
21. How will the evolving logistical setup in India impact the company’s transportation requirements
in the next 5/10/20 years?
Cost
22. What are the components of cost for trucking services in India?
23. Where do you see the highest possibilities of lowering the cost of the overall trucking
operations?
24. What is the difference between price and cost and how does it relate to TCO?
Quality of trucking services
25. Do you think transshipment services in India are common?
26. Explain how the current on-road infrastructure setup impacts the operational ability of heavy
trucks in India?
27. Will the improvement in the on-road infrastructure lead to a demand for more advanced
trucking services in India?
28. What’s the current uptime/downtime situation for your trucks? (how often are trucks broken or
inoperable)
29. Would an increase in uptime for trucks have an impact on the quality of trucking services?
30. Where do you see improvement in the quality of trucking services?