profile of the indian transport sector - iptu of railways reforms 12 v. ... the evident economic...
TRANSCRIPT

Profile of the Indian Transport Sector From the 2007 Sector Assistance Program Evaluation for the Transport Sector in India— Focusing on Results August 2007 Narendra Singru Operations Evaluation Department

Abbreviations ADB Asian Development Bank BIMSTEC Bay of Bengal Initiative for Multisectoral Technical and Economic Cooperation BOT build-operate-transfer FYP five-year plan NHAI National Highway’s Authority of India NHDP National Highway Development Program PMGSY Pradhan Mantri Gram Sadak Yojana PPP public-private partnership SASEC South Asia Subregional Economic Coopreration
Note In this report, “$” refers to US dollars.

Contents
Page I. Growth in the Transport Sector 1
II. Institutional Arrangements 4
III. Current Developments in the Subsectors 7
IV. Implementation of Railways Reforms 12
V. Tenth Five-Year Plan: Description 13
VI. Midterm Appraisal 14
VII. South Asia Regional Economic Cooperation 15
VIII. The Way Forward 16

I. Growth in Transport Sector 1. The evident economic growth in India over the last 2 decades has increased demand for all transport services, particularly land transport via road and rail, as shown in Table 1. Vehicle ownership has increased, with the number of private motor cars growing by 16%, two wheelers by 20%, and goods vehicles by 13% per year from 1991 to 2003.
Table 1: Key Economic Indicators for India, 1987–2004 Year Population
(millions) Population
Density (persons per km2)
GDP ($ billion,
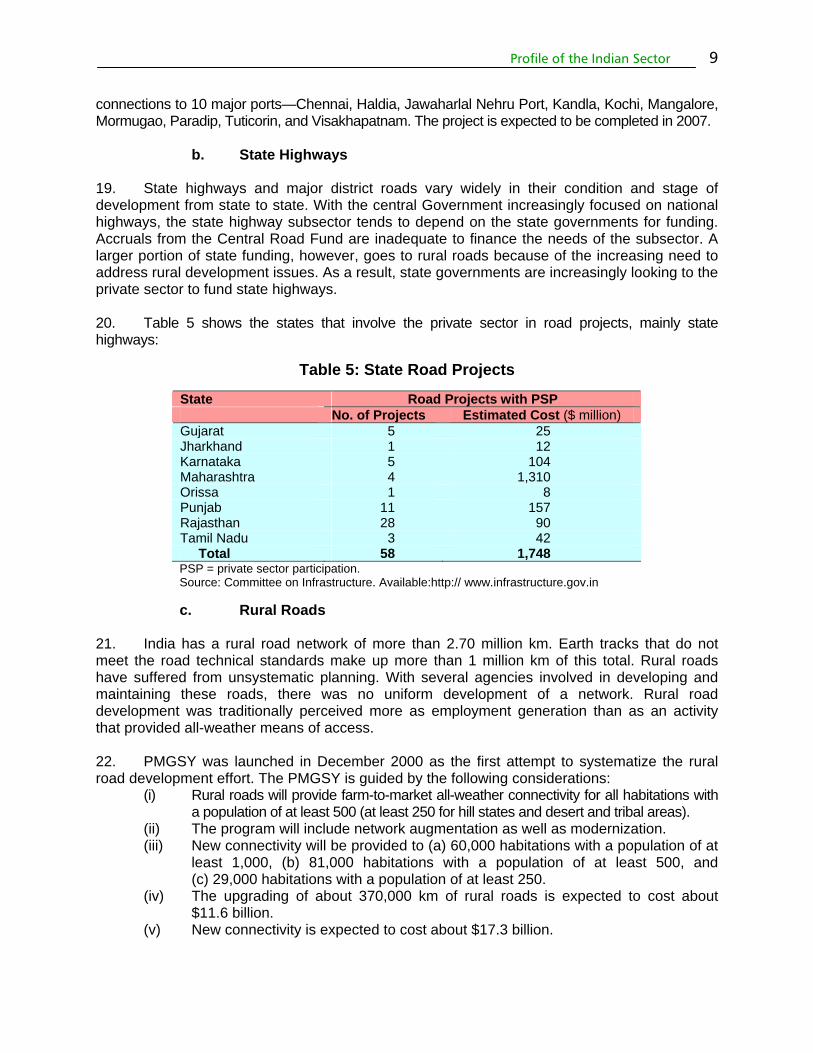
in 1993/1994 prices)
GDP Growth (% annual change)
1987 784 238 137 3.8 1990 835 254 170 5.6 1995 923 281 219 7.3 2000 1,015 309 290 4.4 2001 1,033 314 304 5.8 2002 1,051 320 317 4.0 2003 1,068 325 344 8.5 2004 1,086 330 368 6.9
GDP = gross domestic product, km2 = square kilometer. Source: World Bank. 2004. Key Indicators of Developing Asian and Pacific Countries.
2. In the 1990s, as India's economy expanded by 6–7% a year (Table 1), transport demand grew by about 10% yearly.1 The rate of growth, however, varied by subsector, reflecting structural changes in demand for different modes, as well as the effect of some supply-side factors. 3. Table 2 shows the contribution of the transport sector to gross domestic product and the proportion of public expenditures on this sector. The contribution of the transport sector to the economy is higher than the proportion of expenditures used to improve and maintain the sector.2
Table 2: Share of Transport Sector in the National Economy Year Share of Transport in Overall GDP
(%) Share of Transport in Total
Expenditure (%) 1999–2000 5.7 3.2 2000–2001 5.8 4.5 2001–2002 5.8 4.8 2002–2003 6.0 4.1 2003–2004 6.2 3.9 2004–2005 6.4 4.2 GDP = gross domestic product. Source: Central Statistics Office. Government of India. 2006. National Account Statistics; and CMIE. 2004.
Public Finance. Economic Intelligence Service.
4. The road subsector, which already had an estimated 80% share of land transport demand in 1990, witnessed annual growth of about 12% in freight demand and 8% in passenger demand (footnote 2) (Figure 1). Both air and ocean transport also showed healthy growth, whereas the
1 World Bank. 2002. India’s Transport Sector: The Challenges Ahead. Washington, DC. 2 A World Bank report in 2004 stated that in FY2002, the road sector accounted for slightly less than 3% of
government expenditure and contributed about 15.5% of revenues. Thus, the road sector generated a large fiscal surplus (Source: World Bank. 2004. Highway Sector Financing in India: A Policy Note. Washington, DC).

Profile of the Indian Transport Sector
2
demand for rail transport grew more slowly, at just 1.4% a year for freight and 3.6% a year for passenger traffic. This growth could be attributed to both demand-side and supply-side factors. On the supply side, intense competition from the mostly privately run road transport services, coupled with operating inflexibilities and capacity constraints on key Indian Railways routes, increased the modal share of roads. 5. The above demand is fueled by sustained economic growth and rising incomes over the last 2 decades, resulting in rapidly growing vehicle ownership (Table 3). The increasing vehicle ownership is a key factor underlying the rapid traffic growth. But it has also created congestion on the roads, contributing to longer journey times, higher vehicle operating costs, higher vehicle emissions, and more traffic accidents. Table 4 provides an overview.
Table 3: Registered Motor Vehicles in India, 1981–2003 (thousands)
Year (as of 31 March)
Total Vehicles
Two Wheelers
Cars, Jeeps, and Taxis
Buses Goods Vehicles
Othersa
1981 5,391 2,618 1,160 162 554 897 1991 21,374 14,200 2,954 331 1,356 2,533 2000 48,857 34,118 6,143 562 2,715 5,319 2001 54,991 38,556 7,058 634 2,948 5,795 2002 58,924 41,581 7,613 635 2,974 6,121 2003 67,033 47,525 8,619 727 3,488 6,674 AAGR 1981–1991 (%) 15 18 10 7 9 11 AAGR 1991–2003 (%) 10 11 9 7 8 8 AAGR 1981–2003 (%) 12 14 10 7 9 10 AAGR = average annual growth rate for the period. a Tractors, trailers, three-wheelers (passenger vehicles), and other miscellaneous vehicles not
classified separately. Source: Ministry of Shipping, Road Transport, and Highways.
Figure 1: Transport Demand Growth in India in the 1990s
Source: World Bank. 2002. India’s Transport Sector: The Challenges Ahead. Washington DC
Road Rail Domestic Air
International Air
Seaports
Freight
Passenger
Ann
ual a
vera
ge g
row
th ra
te (%
)
14
12
10
8
6
4
2
0

Table 4: Profile of the Indian Transport Sector Mode Parameter Unit 1950–
1951 1960–1961
1970–1971
1980–1981
1990–1991
1991–1992
1995–1996
1996–1997
1997–1998
1998–1999
1999–2000
Total network: ‘000 km 400 525 915 1,485 2,350 2,486 3,320 2,466 2,540 2,616 2,695 NHs ‘000 km 22 24 24 32 33.7 33.7 34.5 34.6 38.52 49.58 52.01
% of villages with 1,000+ persons
connected by all-weather roads
percent 29 45.8 46.6 85.7
Roads
Surfaced length ‘000 km 156 234 398 684 1,113 1,160 1,517 1,394 1,422 1,450 1,479 Route length km 53,596 56,247 59,790 61,240 62,367 62,458 62,915 62,725 62,495 62,809 62,759
Electrified route length
km 388 748 3,706 5,345 9,968 10,653 12,306 13,018 13,490 13,765 14,261
Freight traffic t 93 156.2 196.5 220 341.4 360 405.5 409.02 429.4 420.9 456.4 Net ton-km b.t. km 44.12 87.68 127.36 158.47 242.7 256.9 273.52 279.99 286.77 284.27 308.04 Passengers million 1284 1,594 2,431 3,613 3,858 4049 4,018 4,153 4,348 4,411 4,585
Railways
Passenger-km million 66,517 77,665 118,120 208,558 296,544 314,564 341,999 357,013 379,897 403,884 430,666 No. of major ports number 5 9 10 10 11 11 11 11 11 11 11a Major ports
Traffic handled t 19.38 33.12 55.58 80.27 151.67 156.64 215.34 227.26 251.66 251.72 271.87 Minor ports Traffic handled t 6.69 6.73 11.27 13.33 24.36 24.93 38.61 36.31 62.52 Inland waterways
Length of navigable waterways
km 14,544 14,544 14,544 14,544 14,544 14,544 14544 14,544 14,646 14,646 14,646
Civil aviation No. of airports number 84 117 117 120 120 120 122 122 Available ton-km million 113 208 663 927 1,090 1,046 1,075 1,094 1,123 1,121 Indian airlines Revenue ton-km million 83 161 420 699 761 723 698 701 709 740 Available ton-km million 515 1,623 2,260 1,973 2,610 2,452 2,294 2,394 2,238 Air India Revenue ton-km million 275 980 1,381 1,149 1,619 1,485 1,454 1,474 1,457
b = billion, km = kilometer, NH = national highway, t = metric ton. a A new major port, Ennore, was commissioned in 2001 bringing the total number of major ports to 12 currently. Source: Planning Commission. India 10th Five-Year Plan (2002–2007). New Delhi.

Profile of the Indian Sector 4
II. Institutional Arrangements
6. Responsibilities for the transport system in India are divided between the central and state governments. In broad terms, the central Government is responsible for railways, national highways, major ports and international shipping, civil aviation, and national inland waterways. The responsibility for each mode resides with a mode-specific ministry in the central Government.3 Figure 2 shows the overall institutional arrangements in the central Government.
7. Roads. The National Highways Authority of India (NHAI) was created under an act of Parliament in 1988 to be responsible for developing, maintaining, and managing the national highway system. Because of lack of funds and a clear organizational strategy, however, NHAI was not formally established until February 1995. In 1998, NHAI initiated the National Highway Development Program (NHDP) for the upgrading and widening of the national highways network. It now implements about $1 billion worth of projects yearly. The Asian Development Bank (ADB) and the World Bank were catalysts in NHAI’s establishment. Aside from providing loans to set up NHAI, ADB worked closely with the authority over the years in providing technical assistance projects for institutional development; capacity building (contract administration, environment and social development, corporate finance); private sector promotion; toll strategy setting; commercialization of operations and maintenance; and road safety. NHAI is now implementing 24,000 kilometers (km) out of the total national highways length of 66,590 km. The development of NHAI has been a major institutional success that has had a positive impact on the development of the road sector.
8. States manage their road development activities through their public works departments (in the case of Maharashtra and Madhya Pradesh, for example) or roads and buildings departments (in Gujarat and other states). With the support of ADB,4 Madhya Pradesh has established the Madhya Pradesh Road Development Corporation to (i) act as the state highway authority; (ii) develop strategic plans for the state road subsector; (iii) identify and prioritize projects according to economic, social, technical, and commercial criteria; and (iv) serve as the nodal agency of the state government in implementing road and related projects under public-private partnership (PPP) and build-operate-transfer (BOT) schemes. The 8,000 km network of state highways in Madhya Pradesh was transferred to the Madhya Pradesh Road Development Corporation for development, construction, improvement, and maintenance. It is the executing agency for the upgrading of 1,750 km of state highways with ADB funding support.5 A similar road development structure is expected to be used in the neighboring Chhattisgarh state.
3 There are five central mode specific ministries—the Ministry of Shipping, Road Transport, and Highways; the Ministry
of Civil Aviation; the Ministry of Railways; the Ministry of Rural Development; and the Ministry of Urban Development. 4 ADB. 2002. Technical Assistance to India for Institutional Strengthening and Capacity Building for Madhya Pradesh
State Road Sector. Manila (TA 4013-IND, for $1.5 million, approved on 5 December). 5 ADB. 2002. Report and Recommendation of the President to the Board of Directors on Proposed Loans and
Technical Assistance Grant to India for the Madhya Pradesh State Roads Sector Development Program. Manila. (Loan 1959-IND [Project Loan], for $150 million, approved on 5 December).

Profile of the Indian Sector 5
Figure 2: Institutional Arrangement in the Central Government for Transportation Infrastructure Delivery
Parliament
Prime Minister and Central Cabinet
Railways
Ministry of Railways
Indian Railways and RVNL/CONCOR
Indian Railways Act
Inland Waterways
Department of Shipping (of MoSRTH)
Inland Waterways Authority of India
Inland Waterways Authority of India
Act of 1985
Civil Aviation/Airports
Ministry of Civil Aviation
Airport Authority of India
Airport Authority of India
Act of 1994
Ports
Department of Shipping (of MoSRTH)
Major Port Trusts
Indian Ports Act of 1908 and
Major Port Trusts Act of 1963
National Highways
Department of Road Transport and Highways
(DORTH) of MoSRTH
National Highways Act of 1956 and
National Highways Authority of India Act of
1988
National Highways Authority of India and
DORTH
Central Road Fund, Tolls, Budgetary Support, Market Borrowings,
Multilateral Loans, PPP
Budgetary Support Internal Accruals, PPP,
Market Borrowings, Loans from Gov’t of India
Internal Accruals, Budgetary Support, from
Gov’t of India, IRFC Borrowings, PPP, Multilateral Loans
Budgetary Support from Gov’t of India, Domestic Loans, Multilateral Loans
Budgetary Support from Gov’t of India, PPP, Market Borrowings,
Internal Accruals
Committee on Infrastructure (under Secretariat of Planning Commission)
Program Planning
Nature of Assets Infrastracture (Government of India)
Line Ministry/ Department
Executing/ Implementing Agency
Principal Governing Legislation
General Financing Instruments
CONCOR = Container Corporation of India; IRFC = Indian Railway Finance Corporation; MoSRTH = Ministry of Shipping, Road Transport, and Highways; PPP = public-private partnership; RVNL = Rail Vikas Nigam Limited. Source: Operations Evaluation Mission.

6 Profile of the Indian Sector
9. Village roads providing local connectivity are managed and maintained by local bodies (panchayat). The centrally-sponsored rural roads program (e.g., Pradhan Mantri Gram Sadak Yojana [PMGSY]) is managed by the state rural roads development agency under the guidance of the central National Rural Roads Development Agency. Funding for the PMGSY comes from the central Government. Roads managed by the public works departments are developed, maintained, and managed with funds from the state’s budget. Some degree of central support to the states for developing and maintaining their roads comes from the Central Road Fund and the 12th Finance Commission allocation. However, adequate funding for road maintenance remains a problem. 10. The Government established the Central Road Fund under the Central Road Fund Act in 2000 as a mechanism for using cess (tax) proceeds exclusively for road development in the country. An explicit cess6 (or tax) on fuel (petrol and high-speed diesel) provides the funds for the Central Road Fund. It collects around $1.23 billion yearly. The cess first flows into the Consolidated Fund of India and is then transferred into the Central Road Fund with the approval of the Parliament. The Central Road Fund is controlled by the Ministry of Finance. Its funds are allocated for national, state, and rural roads as defined in the act. For the national highways, Central Road Fund allocations are earmarked for exclusive use in the implementation of the NHDP. With this assured revenue stream, the NHAI has been able to raise debt funds to finance its program. Corresponding allocations for state highways and rural roads are significant additional resources for these subsectors. The fund differs from the road funds in other countries in that it is meant for both development and maintenance activities. The mechanism of allocations to the various subsectors should be made more transparent. 11. Railways. The Indian Railways is state-owned and operated by the Ministry of Railways. The Indian Railways’ finances are separated from the general budget of the Government, and its annual requirement for funds is voted through a separate budget presented to the Parliament. The Ministry of Railways is headed by the minister of railways. The Indian Railways policy is formulated and managed by the Indian Railways board, comprising a chairman and six functional members. Wide powers are vested in the board to supervise the running of 16 zonal railways, a metro railway (Kolkata), production units, construction organizations, and other rail establishments. Ten subsidiary organizations7 under the Ministry of Railways have specialized responsibilities for Indian Railways’ operations, finance, engineering, and other activities. 12. The Indian Railways incorporated Rail Vikas Nigam Limited as a special purpose vehicle to implement some physical improvements in the Indian Railways’ National Railway Development Program (National Rail Vikas Yojana), which was supported by ADB.8 Rail Vikas 6 The cess was initially set at Rs1 per liter, for both gasoline and diesel, and then increased to Rs1.50 per liter
($0.03 per liter) in 2003. In 2004, $438 million from the Central Road Fund went to the construction and maintenance of national highways, $222 million to state highways, and $511 million to rural roads (Source: Ministry of Finance). Some states have introduced additional fuel cess. Uttar Pradesh, for example, has imposed an additional sales tax of 4% on diesel, and 6% on gasoline, raising about $55 million per year for the road sector.
7 Indian Railway Construction,, Rail India Technical and Economic Services,, Centre for Railway Information Systems, Container Corporation of India,, Indian Railways Finance Corporation, Konkan Railway Corporation,, Indian Railway Catering and Tourism Corporation,, Rail Tel Corporation of India Limited, Mumbai Railway Vikas Corporation, and Rail Vikas Nigam Limited. A new organization is being planned for the dedicated freight corridor.
8 ADB. 2002. Report and Recommendation of the President to the Board of Directors on a Proposed Loan and Technical Assistance Grant to India for the Railway Sector Improvement Project. Manila (Loan 1981-IND, for $313.6 million, approved on 19 December).

Profile of the Indian Sector 7
Nigam Limited’s responsibilities include project development and resource mobilization for commercially run projects, using largely nonbudgetary funds. To mobilize alternative sources of funding, the Rail Vikas Nigam Limited implements BOT projects with funding from various development partners, and raises funds in the capital and debt markets.
III. Current Developments in the Subsectors
1. Roads
13. The road network currently cannot handle high traffic density and has poor surface quality. Nearly 38% of the national highways network is single-lane, while about 59% is double-lane. State highways and major district roads account for about 13% of the road network and 40% of traffic. While inadequate supply of funds is acknowledged as the main issue, the Government has been making efforts to improve the overall network through public as well as
private sector funding. 14. In the road subsector, there is inconsistency in the distribution of public spending between segments. Revenue in the subsector comes from various sources: vehicles taxes (on the initial purchase) and annual fees; fuel taxes imposed by both the central Government and the state governments; road tolls; and direct taxes on road freight and passengers. The revenue from these different sources is collected in a central pool,9 from which expenditures are funded. In 2002, the revenue from road user charges was $3.3–$4.4 billion. Road subsector revenues and expenditure among the different segments that year were as follows:10
(i) Highways. Road user charges ($2.2 billion) exceeded expenditures ($1.4 billion). There could be a broad balance if the highways were adequately maintained.
(ii) District and rural roads. Road user charges ($748 million) were below expenditure ($1.4 billion).
(iii) Urban roads. Road user charges were substantially greater than urban road expenditure.
a. National Highways
15. NHAI has initiated a massive NHDP as summarized below:
(i) NHDP I. Four-laning of the Golden Quadrilateral. This first phase of the NHDP will link the four metropolitan cities—Chennai, Delhi, Kolkata, and Mumbai.
9 The Central Road Fund has been set up by the Government to streamline funding for road rehabilitation and
maintenance in India. 10 Source: World Bank. 2004. Highway Sector Financing in India: A Policy Note. Washington, DC.
Road connectivity to major ports is a vital part of a trade development initiative that will decongest port areas to facilitate the movement of bulk cargo and containers at India’s major ports. The Port Connectivity Project, under the National Highway Development Program, involves improving national highway connections to 10 major ports and is expected to be completed in 2007.

Profile of the Indian Sector
8
(ii) NHDP II. Four-laning of the North-South and East-West corridors. The North-South corridor connects Srinagar to Kanyakumari including the Kochi-Salem spur, and the East-West corridor connects Silchar to Porbandar. This second phase of the NHDP will also cover port connectivity and other national highway projects.
(iii) NHDP III. Four-laning of high-density national highways totaling 10,000 km. This phase is to be implemented through the BOT mode. The stretches of national highways covered carry high volume of traffic, connect state capitals with the network established in the first two phases, and provide connectivity to places of economic, commercial, and tourist importance;
(iv) NHDP IV. Two-laning of 20,000 km of national highways to provide balanced and equitable distribution of the improved highway network throughout the country. Capacity, speed, and safety on the new two-lane highways will match the minimum benchmarks for the entire national highways network.
(v) NHDP V. Six-laning of 6,500 km of four-lane national highways comprising the Golden Quadrilateral and other high-density stretches, through PPP on a BOT basis. These corridors are now being four-laned under NHDP I, and the program for their six-laning was to begin in 2006 and to be completed by 2012. Of the 6,500 km proposed under NHDP V, about 5,700 km will be taken up in the Golden Quadrilateral and the remaining 800 km would be selected on the basis of approved eligibility criteria.
(vi) NHDP VI. Development of 1,000 km of expressways on a BOT basis to serve the growing urban centers, particularly those located within a few hundred kilometers of each other. These expressways will be built on new alignments.
(vii) NHDP VII. Other highway projects—ring roads, bypasses, grade separators, and service roads—considered necessary for the full use of highway capacity and for enhanced safety and efficiency.
16. The NHDP is by far the largest national highways rehabilitation program of the Government. It currently covers 17,161 km11 and is being expanded in phases, as mentioned above. The Government originally intended to complete the Golden Quadrilateral by December 2003, but has had to postpone the deadline several times because of problem projects. Under a revised schedule, about 92% of the Golden Quadrilateral was to have been completed by December 2005, but only 10% of the North-South/East-West corridor improvements had been completed by 28 February 2005. The completion deadline of December 2006 was also not met. Full completion is now expected by December 2007. Meeting even this deadline will be a challenge. 17. The four-laning of 10,000 km of national highways by March 2010 under NHDP III is to be achieved entirely via BOT agreements to avoid the use of budget funds. A special accelerated road development program for the Northeastern Region (NHDP-Northeast), involving 7,639 km of roads (3,251 km of national highways and 4,388 km of other roads), is included to improve connectivity in the northeastern states. The network is expected to accelerate development in this remote, underprivileged region. 18. Road connectivity to major ports is a vital part of a trade development initiative that will decongest growing port areas to facilitate the movement of bulk cargo and containers at India’s major ports. The Port Connectivity Project, under the NHDP, involves improving national highway 11 Planning Commission. 2006. Midterm Appraisal of 10th Five-Year Plan. New Delhi.
Profile of the Indian Sector 9
connections to 10 major ports—Chennai, Haldia, Jawaharlal Nehru Port, Kandla, Kochi, Mangalore, Mormugao, Paradip, Tuticorin, and Visakhapatnam. The project is expected to be completed in 2007.
b. State Highways 19. State highways and major district roads vary widely in their condition and stage of development from state to state. With the central Government increasingly focused on national highways, the state highway subsector tends to depend on the state governments for funding. Accruals from the Central Road Fund are inadequate to finance the needs of the subsector. A larger portion of state funding, however, goes to rural roads because of the increasing need to address rural development issues. As a result, state governments are increasingly looking to the private sector to fund state highways. 20. Table 5 shows the states that involve the private sector in road projects, mainly state highways:
Table 5: State Road Projects
State Road Projects with PSP No. of Projects Estimated Cost ($ million) Gujarat 5 25 Jharkhand 1 12 Karnataka 5 104 Maharashtra 4 1,310 Orissa 1 8 Punjab 11 157 Rajasthan 28 90 Tamil Nadu 3 42 Total 58 1,748 PSP = private sector participation. Source: Committee on Infrastructure. Available:http:// www.infrastructure.gov.in
c. Rural Roads
21. India has a rural road network of more than 2.70 million km. Earth tracks that do not meet the road technical standards make up more than 1 million km of this total. Rural roads have suffered from unsystematic planning. With several agencies involved in developing and maintaining these roads, there was no uniform development of a network. Rural road development was traditionally perceived more as employment generation than as an activity that provided all-weather means of access. 22. PMGSY was launched in December 2000 as the first attempt to systematize the rural road development effort. The PMGSY is guided by the following considerations:
(i) Rural roads will provide farm-to-market all-weather connectivity for all habitations with a population of at least 500 (at least 250 for hill states and desert and tribal areas).
(ii) The program will include network augmentation as well as modernization. (iii) New connectivity will be provided to (a) 60,000 habitations with a population of at
least 1,000, (b) 81,000 habitations with a population of at least 500, and (c) 29,000 habitations with a population of at least 250.
(iv) The upgrading of about 370,000 km of rural roads is expected to cost about $11.6 billion.
(v) New connectivity is expected to cost about $17.3 billion.

Profile of the Indian Sector
10
(vi) About $13.2 billion in total expenditure is planned until 2010; further additions will be planned after that.
(vii) The total estimated cost of the entire project is about $29 billion.
23. The PMGSY is a massive program, running in parallel to the NHDP. Although the overall design of the program is sound in its institutional and progress monitoring arrangements, project prioritization is muddled. This is because the first projects were identified on the basis of unreliable data on habitations. The PMGSY guidelines were also changed a number of times, causing uncertainty in implementation. As a result, several low-priority projects were implemented at the start, on the assumption that these had high priority. These initial problems appear to have been addressed, although progress has been slow.
2. Railways
24. The Indian Railways owns and operates one of the largest rail networks in the world, spreading over 63,140 route-km. Passenger traffic increased from 66 billion passenger-km in 1950–1951 to 457 billion in 2000–2001, while freight traffic during the same period increased from 44 billion net ton-km to 315 billion. However, between 1970–1971 and the late 1990s, the share of railways in the freight traffic market dropped from 65.5% to around 48.0% and its share in passenger traffic, from 32.9% to 23.0% (Figure 3).12
Sources: The Japan International Cooperation Agency (JICA) study team’s estimate based on the Teri Energy Energy Data Directory Yearbook 2002/03 (for 1970/71 to1988/89); JICA study team (for 1996/97); Centre for Monitoring Indian Economy; Basic Statistics for various years relating to the Indian Economy;Ministry of Railways.1998. Status Paper on Indian Railways; Ministry of Finance.1999. Economic Survey.
12 Mukherjee, A., and R. Sachdeva. 2004. Trade in Land Transport Services: Railways. ICRIER Working Paper 119.
New Delhi.
Figure A3.2: Passenger and Freight Traffic Evolution Road Compared to Rail
29.5
48.048.748.6
54.662.361.565.5
52.0
70.5
34.538.5 37.7 45.4
51.4 51.3
34.6
23.0
22.2
23.727.9
29.731.632.9
70.3 72.176.3 77.8 77.0
65.4
68.467.1
0
10
20
30
40
50
60
70
80
90
1970/71 1973/74 1976/77 1979/80 1982/83 1985/86 1988/89 2002/03(P)
%
Rail-freight Road-freight Rail-passengers Road-passengers
Figure 3: Evolution of Passenger and Freight Traffic: Road vs. Rail

Profile of the Indian Sector 11
25. At present, the Indian Railway’s freight and passenger revenues are increasing as traffic flows on both rail and road grow, reflecting India’s economic growth. The growth in traffic could be attributed to both demand-side and supply-side factors. While there was a major increase in demand for both freight and passenger services, the Indian Railways also initiated several measures to regain its lost share of the market. The improvement in the operations of the Indian Railways are shown in Table 6.
Table 6: Recent Improvements in the Performance of Indian Railways
Indicator 2000–2001 2005–2006 Freight unit cost (paise per net ton-km) 61 52 Freight operating margin (%) 22 57 Net ton-km per wagon per day 2,042 3,000 km = kilometer. Sources: Rail Vikas Nigam Limited and Ministry of Railways.
26. However, market-oriented reforms are still needed to ensure that the performance can be sustained and can improve further. The implementation of the reforms has been delayed. For example: (i) consultants for the cost accounting system took an exceptionally long time to be appointed; and (ii) the Indian Railways has expressed reservations about doing a study for a regulatory authority. 27. In 2002, the Government initiated the National Rail Vikas Yojana13 to remove capacity in critical sections of the Indian Railways network. It has three components:
(i) Strengthening of Golden Quadrilateral rail services and diagonals; (ii) Strengthening of rail connectivity to ports and development of multimodal
corridors to the hinterland; and (iii) Construction of four major bridges, namely, (a) Bogibeel, a rail and road bridge
across the Brahmaputra river; (b) Munger, a rail and road bridge across the Ganga river; (c) Patna Ganga bridge; and (d) a bridge over the Kosi river.
28. The Ministry of Railways has formulated an integrated modernization plan for 2005–2006 to 2009–2010 to upgrade the Indian Railways operations, including both passenger and freight services, to modern global standards. The total expenditure involved would be about $5.5 billion. In keeping with the broad concept of NHAI’s Golden Quadrilateral and to enable the Indian Railways to compete with the road transport services using the upgraded national highways network, the Ministry of Railways has announced the launching of dedicated freight corridors. These would consist of new tracks exclusively laid for freight trains along the Golden Quadrilateral, thereby enabling freight trains to travel at speeds of more than 100 km an hour and helping to decongest rail traffic. On the present network, passenger and freight trains move on the same track, causing delays and increasing the risk of accidents.
13 National Railway Development Program.
The Indian Railway’s freight and passenger revenues are increasing as traffic flows on both rail and road grow. The growth could be attributed in demand for both freight and passenger services, and on several measures initiated by the Indian Railways to regain its lost share of the market. However, market-oriented reforms are still needed to ensure that the performance can be sustained and improved further.

Profile of the Indian Sector
12
29. The Indian Railways plans to use a number of PPP models to enhance its capacity and improve the services: (i) a special-purpose vehicle involving various stakeholders, including state governments; (ii) BOT; (iii) private freight terminals; and (iv) a wagon investment scheme. The special-purpose vehicle scheme envisages the participation of the private sector and other beneficiaries and national-level infrastructure funding institutions in the development of railway infrastructure through concessions. The concession period can be fairly long (e.g., 33 years) and can be extended further. Indian Railways will also be involved in such projects with the help of state governments. While this model shares the revenues with the Indian Railways, the BOT model transfers more risks to the concessionaire. The BOT model envisages private sector participation through a consortium of construction contractors and financers. Under the BOT scheme, the concessionaire will design, build, and operate the facility. After the concession period, the facility will be transferred back to the Indian Railways. The Indian Railways will also encourage the private sector to develop freight terminals, with Indian Railways paying service charges to compensate for the capital cost, and the private sponsor allowed to charge customers separately for services such as handling, loading and unloading, warehousing, and transport. 30. To encourage PPP in wagon procurement to meet the anticipated demand for rail freight traffic, the Indian Railways announced a new wagon investment scheme during the 2005–2006 budget presentation. This approach focuses on a guaranteed number of wagons every month to a customer based on the number of wagons procured. Also, freight concessions will be awarded to participating customers. The wagons can be procured by individuals, corporate bodies, or associations or groups of companies. The customers can procure the wagons directly from the builders approved by the Ministry of Railways, subject to the use of the current Indian Railways standard design and specifications and inspection by the agency nominated by the Indian Railways. It remains to be seen, however, whether the Indian Railways’ new initiatives to attract private capital will be more successful than previous schemes. 31. In 2002, the Government set up a special railway safety fund to replace old assets including tracks, bridges, rolling stock, signaling equipment, and other safety enhancement items. However, funding was reduced from $802 million in 2005–2006 to $462 million in 2006–2007 despite the backlog in track renewal and bridge rehabilitation. The Indian Railways has attributed the reduction in allocation to a decrease in the volume of civil works.
IV. Implementation of Railways Reforms 32. Excerpts from Rakesh Mohan Committee Report14 in 2001 suggested that the driving factor behind restructuring of the Indian Railways needs to be the adoption of a commercial orientation. One of the major challenges of commercialization of the railways is to shift the culture and mindset from a bureaucracy into a market savvy and customer-oriented, profit-driven business. With diminishing subsidies and budget allocations, this appeared to be the only route to self-sufficient viability. The report suggested that the Indian Railways needs to review its governance structure; governance which defines the roles and institutional relationships associated with policy, regulation, and management.
14 The Indian Railways Report–2001: Policy Imperatives for Reinvention and Growth—Expert Group on Indian
Railways chaired by Rakesh Mohan.

Profile of the Indian Sector 13
33. The Indian Railways did initiate several measures to adopt a commercially oriented way of conducting business. These included:
(i) Commercial development of railways land and air space as one of the nontariff measures to generate revenues.
(ii) Increase in permissible axle load to 22.9 tons and in some cases to 25 tons, although this is well short of the 30-ton norm in other countries.
(iii) Introduction of roll-on roll-off services on the Konkan Railways, tied-up with the Central Warehousing Corporation to provide more value added services as well as door-to-door transportation of freight.
34. Overall, the Indian Railways did implement some of the reforms suggested by the Rakesh Mohan Committee but did not touch upon the core issues such as revamping the organizational structure, transparent tariff mechanism, and internal product-oriented reorganization. It could be argued that the Indian Railways has gained a lot in the short term but could hit a growth ceiling when the internal slack capacity is fully squeezed out. It is important for Indian Railways to progress further on implementation of reforms. It is indeed difficult for such a huge organization to change in the face of competition from roads and airlines. However, with adequate political will and ownership, this could be achieved.
V. Tenth Five-Year Plan: Description 35. The 10th Five-Year Plan (FYP) (2002–2007) for the transport sector has adopted these broad policy objectives in response to the growing demand in the sector:
(i) Ensuring transport growth in such a way as to enable all regions to participate in economic development, with special attention to the integration of remote regions like the North-East into the economic mainstream;
(ii) Augmenting capacity, improving quality and productivity through technology upgrade, and modernizing operation;
(iii) Emphasizing higher maintenance standards to reduce the need for frequent rebuilding;
(iv) Generating more financial resources internally and increasing private sector participation in transport service provisions;
(v) Increasing overall economic efficiency by bringing competition into the provision and maintenance of transport infrastructure and services;
(vi) Giving more emphasis to safety, energy efficiency, environmental conservation, and beneficial social impact; and
(vii) Developing an optimal intermodal mix, where each mode operates efficiently and according to its comparative advantage, and complements the services provided by other modes of transport.
It could be argued that the Indian Railways has gained a lot in the short term but could hit a growth ceiling when the internal slack capacity is fully squeezed out. It is important for Indian Railways to progress further on implementation of reforms. It is indeed difficult for such a huge organization to change in the face of competition from roads and railways. However, with adequate political will and ownership, this could be achieved.

Profile of the Indian Sector
14
VI. Midterm Appraisal 36. To assess the overall progress made on the various plans and programs, the Planning Commission undertook a midterm appraisal of the 10th FYP in 2006. Its overall assessment of the growth in rail and port traffic from 2002 to 2004 was that “plan targets are likely to be achieved or even exceeded,” with Indian Railways having recorded some improvement in financial performance. However, the commission also found that the Indian Railways’ prescribed targets for internal and extra-budgetary resources would be difficult to achieve. In the road subsector, the four-laning and six-laning of the Golden Quadrilateral was behind schedule, the appraisal found, but work relating to the strengthening of weak pavement and the improvement of the riding quality of roads was ahead of target. The outlook for the various subsectors as outlined in the midterm appraisal report is summarized in Box 1. The 11th FYP is expected to be in line with this outlook.
Box 1: Outlook for Indian Roads, Railways, and Ports from 2006 Roads The Ministry of Shipping, Road Transport, and Highways (MoSRTH) should prepare a detailed, 2-year program to optimize the
use of available budgetary support for a mix of engineering, procurement, construction, and build-operate-transfer projects; MoSRTH should prepare targets and milestones to enable the monitoring of programs, including the National Highway
Development Program; A model concession agreement should be developed for build-operate-transfer projects; The institutional capacity of the National Highway’s Authority of India to establish a multidisciplinary, professional body with high-
quality financial management and contract management expertise should be enhanced; A committee of secretaries must address interministerial issues, including bottlenecks in ongoing projects; A system should be developed for collecting and analyzing traffic information and inventorying the condition of assets; A model concession agreement on the operation and maintenance and tolling of completed stretches of the National Highway’s
Authority of India should be drawn up; A dedicated organization for road safety and traffic management should be set up; A law should be passed for economic regulation and the resolution of disputes in public-private partnerships ; and Leverage the cess amount from the Central Road Fund available for the Pradhan Mantri Gram Sadak Yojana for raising
resources. Railways An integrated modernization plan based on transport corridors should be implemented; The investment strategy should be rationalized by linking future investments with improvements in capacity and in the quality of
services; The Ministry of Railways and the Planning Commission should collaborate in preparing a paper on tariff setting, including the need
for a rail tariff authority; Organizational reforms should be carried out to set up a fully computerized accounting system conforming with international
accounting practices; make production units profit centers; grant concessions to the private sector to operate uneconomic lines; and outsource noncore activities;
Public-private partnerships should be encouraged in the development of high-density corridors, tourist trains, additional goods trains serving major commercial and industrial centers, collieries, and power stations;
Competition in container movement should be allowed; and A time-based plan should be formulated for increasing capacity on specific congested routes to meet the increasing traffic.
Ports The scope of private sector participation in the development of ports should be increased; Ports should be corporatized to encourage efficient management, institutional funding, and private investment; The role of Tariff Authority for Major Ports should be reviewed; The productivity of major ports should be improved through technology upgrades; Manning scales should be rationalized to improve port productivity; and Perspective plans for the long-term development of each major port should be prepared.
Source: Planning Commission. 2006. Midterm Appraisal of 10th Five-Year Plan. New Delhi.
Profile of the Indian Sector 15
VII. South Asia Regional Economic Cooperation
37. The South Asia Subregional Economic Cooperation (SASEC) program, which was launched in 2001 with ADB assistance, provides a forum for the four countries in the region (Bangladesh, Bhutan, India, and Nepal) to discuss, identify, and prioritize subregional cooperation projects in the six priority sectors—transport; energy and power; environment; information and communications technology; tourism, trade, and investment; and private sector cooperation. Some difficulties were encountered during the initial implementation of SASEC but overall progress has improved more recently. Cooperation in transport has progressed, with a framework being developed for subregional connectivity involving 21 corridors (existing and actual), six of which have been identified as priority corridors for upgrading to improve connectivity in the subregion. ADB intends to provide loan assistance selectively for the upgrading of some segments of these corridors. Other activities include broadening the scope of work of SASEC’s Transport Working Group to cover interregional transport issues, specifically the establishment of closer links between SASEC and the Greater Mekong Subregion initiative. 38. The Bay of Bengal Initiative for Multisectoral Technical and Economic Cooperation (BIMSTEC) was formed in December 1997 by Bangladesh, India, Myanmar, Sri Lanka, and Thailand and has emerged as an important cross-regional cooperative initiative joining countries in South Asia and the Greater Mekong Subregion. All SASEC members are now also members of BIMSTEC. At the first BIMSTEC Summit in July 2004, a program for economic cooperation was set out in six sectors: trade and investment, energy, tourism, transport and communications, technology, and fisheries. India is leading the initiatives in tourism, transport, and communications. 39. These subregional efforts are intended to (i) encourage strong political commitment from the participating countries; (ii) identify and implement quick-yielding projects to demonstrate tangible benefits within a short time frame; (iii) establish core working groups with the financial and technical support required to advance project cooperation to achieve the goals of regional cooperation; (iv) ensure the right balance between improving hard and soft infrastructure; (v) mobilize resources for regional cooperation, dependent on identifying sound and viable projects that offer clear and tangible benefits to the countries involved; and (vi) involve the private sector in regional cooperation activities as the promoter of trade, financier of infrastructure projects (e.g., roads), and facilitator of the regional cooperation process. 40. An international north-south transport corridor is planned between India, the Russian Federation, and Iran, using Indian ports to provide outlets to the Indian Ocean. The agreement among the three countries provides a shorter route to Moscow via Bunder Abbas, Bunder Anzali, the Caspian Sea, and Astrakhan, and beyond via Iran. Ongoing studies are exploring various bottlenecks on the route in terms of time, cost, efficiency, risks, information flow, customs requirements, other procedures, etc., and will suggest practical solutions to overcome these difficulties. 41. In the case of the Indian transport sector, there are several potential areas where the above initiatives could bear fruit. For landlocked countries like Bhutan and Nepal, transit through India and Bangladesh is essential to promote economic development. Road connectivity between India and the People’s Republic of China via Nepal could significantly increase trade and investment among the three countries. For the northeastern states of India, transit through

Profile of the Indian Sector
16
Bangladesh can significantly reduce the cost of access to the sea and to neighboring countries and beyond. Inland water transport using the Ganga-Meghna-Brahmaputra river system could be effective in improving the freight transport system in the region. A recent ADB study15 suggested that rehabilitation and improvement in inland water transport facilities in this water basin between India and Bangladesh could reduce the cost of trade between the two countries. Similarly, the technical standardization of the railway system between Bangladesh, India, and Pakistan could significantly reduce the costs of transportation, by substituting a land route for the current long and costly transport through congested seaports.
VIII. The Way Forward 42. For the 11th FYP (2007–2012), the Planning Commission prepared an approach paper in June 2006. This official paper of the Government indicated that infrastructure inadequacies in both rural and urban areas are a major constraint on India’s growth.”16 43. The approach paper indicated that for India to achieve the expected continued growth in gross domestic product of about 9% per year, investment in infrastructure (including road, rail, air, and water transport) will need to be increased. Recognizing that this would place a heavy burden on scarce public sector resources, the approach paper advocates the promotion of PPPs for many infrastructure investments. 44. In the road and highway subsector, the approach paper reaffirmed the NHDP program under NHAI, with its further expansion to include NHDP V (6,500 km six-laning of the Golden Quadrilateral), NHDP VI (1,000 km of expressways during the 12th FYP period), and NHDP VII (consisting of bypasses
and ring roads, with priorities, total length, and other details still to be determined). All NHDP contracts from NHDP III onward would be awarded only on a BOT basis, with traditional engineering, procurement, and construction contracts awarded only in exceptional cases. The paper also reaffirmed an acceleration of the PMGSY program to connect with all-weather rural roads by 2008–2009 all communities with a population of 1,000 or more (500 or more for hilly and tribal areas). 45. Priority will be given in the 11th FYP to ensure the integrated development of the road network, including state highways, major district roads, and other district road within the jurisdiction of the state governments, together with the rural roads system.
15 ADB. 2000. Cooperation in Transport and Communications. Manila. 16 Planning Commission. 2006. Approach Paper to 11th FYP (2007–2012). New Delhi.
The Indian Railways has a long way to go before it can recover its share of the passenger and freight transport market. The Planning Commission’s approach paper for the 11th FYP suggests that consideration should be given to ways of reorganizing Indian Railways structure:
• Manufacture and maintenance of rolling stock should be corporatized, and some current Indian Railways activities outsourced.
• Passenger and freight tariff rationalization to counter the apparent loss of overcharged rails passengers to improving air services
• Overcharged rail freight users to road transport services
• Need to established a rail tariff regulatory authority

Profile of the Indian Sector 17
46. Other new initiatives in the road subsector that are expected to be included in the 11th FYP are as follows:
(i) More attention to road and bridge maintenance activities, with additional funding being allocated for the 2006–2007 to 2009–2010 period;
(ii) Restructuring of NHAI to strengthen the professional skills of its staff and provide the organization with a greater measure of autonomy and accountability; and
(iii) Establishment of an organization dedicated to the promotion of road safety, in recognition of the enormous human and economic losses caused by the very high number of serious traffic accidents on Indian roads. In addition, 1% of the fuel cess is to be earmarked for safety-related measures.
47. In the railway subsector, the paper recognized the progress made by the Indian Railways in 2005–2006 because of improved productivity, but also noted that capacity bottlenecks and constraints still exist within the system—particularly affecting the efficient movement of containers to and from the major ports. During the 11th FYP, dedicated rail freight corridors will be developed on critical routes (e.g., Delhi-Mumbai and Delhi-Howrah). The paper also postulated that opening container services to more service providers would improve levels of service and enable Indian Railways to regain some of its lost market share. 48. In the past few decades, consistent with worldwide experience, the railway subsector has lost its share of the freight and passenger markets to roads. For example, the Indian Railways’ share of the total cement transportation fell from a monopolistic 80% 3 decades ago to about 40% in 2001.17 The Poulose Committee report of 1995 indicated that Indian Railways’ competitiveness with respect to long-distance freight haulage had been reduced from an absolute advantage over road freight for distances over 250 km to an advantage on distances over 750 km, i.e., Indian Railways was steadily losing traffic to roads in the range between 250 km and 750 km. There has been a growing awareness within Indian Railways of the need to reverse this trend. The 2006–2007 budget announced various policy- and tariff-related measures to recover the market share, such as PPPs in customer amenities and rationalized passenger tariffs. These are in line with these overarching initiatives that are expected to be included in the 11th FYP:
(i) Various steps to improve levels of service, including the establishment of logistic parks and terminals, the rationalization of freight structures, and increased use of information technology-enabled services;
(ii) Focus on the use of PPP in building and operating selected railway infrastructure to increase capacity; and
(iii) More attention to steps to modernize the railway, including the provision of good-quality passenger amenities at terminals, modern rolling stock, and improvements in sanitation, and modified wagon designs to increase payload-to-tare ratios.
49. Since 2004, rail tariffs have been set with a conscious focus on the market. Bulk commodities such as iron ore, cement, petroleum, and iron and steel saw a reduction in tariff and an increase in the share of freight carried by the Indian Railways in 2005–2006. Combined with the major initiative of increased axle loading, the Indian Railways managed a 10.8% increase in loading and 17.9% increase in freight revenue. This resulted in net revenue of $1.76 billion and an investible surplus of $2.86 billion in 2005–2006. These figures are a significant increase from 2004 to 2005. Similar growth is expected for 2006–2007. 17 Expert Group on Indian Railways. 2001. The Indian Railways Report. New Delhi.

Profile of the Indian Sector
18
50. Despite this progress, the Indian Railways has a long way to go before it can recover its share of the passenger and freight transport market. The Planning Commission’s approach paper for the 11th FYP suggests that consideration should be given to ways of reorganizing Indian Railways’ structure to enable more focus and concentration on the core activities of the provision of infrastructure and rail operations. The paper suggests that the manufacture and maintenance of rolling stock should be corporatized, and some other current Indian Railways activities outsourced. The paper also addresses passenger and freight tariff rationalization to counter the apparent loss of overcharged rail passengers to improving air services, and overcharged rail freight users to road transport services. To achieve a rational pricing basis for rail services, the paper emphasizes the need to establish a rail tariff regulatory authority.