understanding the fitness burden of esbl plasmids …epubs.surrey.ac.uk/809596/1/understanding...
TRANSCRIPT

UNDERSTANDING THE FITNESS BURDEN OF ESBL
PLASMIDS IN AVIAN PATHOGENIC ESCHERICHIA
COLI (APEC)
by
MISHAAL ALANAZI
Submitted for the degree of Doctor of Philosophy
Department of Microbial & Cellular Sciences
Faculty of Health and Medical Sciences
University of Surrey
Guildford, Surrey, UK
(September, 2015)
Copyright ©Mishaal Alanazi, 2015

Declaration of originality
This thesis and the work to which it refers are the results of my own efforts. Any
ideas, data, images or text resulting from the work of others (whether published or
unpublished) are fully identified as such within the work and attributed to their
originator in the text, bibliography or in footnotes. This thesis has not been submitted
in whole or in part for any other academic degree or professional qualification. I
agree that the University has the right to submit my work to the plagiarism detection
service TurnitinUK for originality checks. Whether or not drafts have been so-
assessed, the University reserves the right to require an electronic version of the
final document (as submitted) for assessment as above.

i
Acknowledgment
I am especially grateful to my country represented by the Ministry of Health in Saudi Arabia,
for funding my studies and providing me with the opportunity to study abroad.
This journey would not have been possible without the supports of my wife, supervisors, and
friends. Foremost, I would like to express my sincere gratitude to my supervisor Prof Roberto
La Ragione for his continuous support throughout my PhD research as well as for his
patience, motivation, enthusiasm, and immense knowledge.
Also a very special thanks to Dr Jennifer Ritchie (my co-supervisor) for her thorough reading
and feedback of my thesis. Her direction, suggestions and technical knowledge and support
enabled me to present my thesis in the best way possible. A big thank you for proof reading
this thesis at the busiest time of your career.
I am so thankful to my wife Salha for her incredible continues support throughout my PhD
and life in general and her immense ability and patience in taking care my beloved children
whom are my invaluable wealth.
I also would like to thank Prof Christopher M. Thomas and Irene Martine for providing me the
plasmid curing vector which without it the thesis would not have been possible.
My sincere thanks also goes to Dr Guido Cordoni, for his help in analysing plasmid and
bacterial DNA, for his bioinformatics advice for analysing my data.
My appreciation also goes to Dr Jane Newcombe for her support and valuable skilful
technical advice in biolog running and data analysis. I also wish to thank all the technicians
especially to Tim and Clifford in the microbiology lab for all the assistance and priceless
help.
Finally, I am blessed knowing Salim, the only friend that I had when I first arrived, without
him, I wouldn’t survive my first day at Surrey. We have been going through loads of ups and
downs while completing our PhD.

ii
Abstract
Extended spectrum β-lactamases (ESBLs) are enzymes produced by bacteria that
confer resistance to cephalosporins, antibiotics that are widely used to treat
infections in animals and humans. The emergence of plasmid-borne ESBL
resistance in humans and animals, especially poultry, is of particular concern. Avian
pathogenic E. coli (APEC) cause colibacillosis, an economically important disease of
poultry, but have also been linked to human disease. Of growing concern is the
potential transfer of ESBL-producing plasmids between E. coli isolates and their
impact on the host bacterium. Thus, the aim of this study was to characterise ESBL
plasmids in APEC isolated from UK poultry and examine their impact on host
bacterial fitness and virulence.
Plasmid profiling and genome sequencing revealed that all three APEC isolates
harboured at least two plasmids, belonging to the IncF and IncI replicon types. The
ESBL plasmid was identical in each isolate, being of 105,610 Kb in size, belonging to
the IncI1-Iy family and carrying the blaCTX-M-1 allele. Upstream of blaCTX-M-1
gene was an ISEcp1 insertion element, which likely contributes to the transmissibility
of the element. The plasmid also carried genes coding for tetracycline resistance that
were co-transferred with the β-lactamase genes. The APEC isolates also harboured
a large virulence plasmid of similar size, but belonging to the IncF replicon type.
Competitive growth studies in rich or minimal media found no significant differences
in the growth of CTX-M-1 plasmid-harbouring and plasmid-cured derivatives.
However, the presence of the CTX-M-1 plasmid in APEC O78 was beneficial to their
growth in iron-limited media, but caused a greater fitness burden at low pH. When
present as the only plasmid in APEC, the ESBL-containing derivatives produced
iii
more biofilm at human and chicken body temperatures and were better able to
invade and survive in human (THP-1) and chicken (HD11) macrophage cell lines
than the cured isolates. Finally, the substrate utilisation profiles of the plasmid-
containing derivatives differed to that of the parent strains, indicating that the plasmid
may influence the metabolic capability of the organism. The studies presented here
indicate that ESBL plasmids of the IncI1-1Y type spread readily to unrelated APEC
isolates and can influence the fitness of APEC under certain conditions.

i
Table of Contents 1 .Introduction ............................................................................................................................. 1
1.1.Introduction ....................................................................................................................................... 1 1.2.Escherichia coli strains associated with extra intestinal diseases ..................................................... 2 1.3.Avian Pathogenic E.coli (APEC): ..................................................................................................... 3 1.3.1 Impact of APEC infections on poultry and the poultry industry ............................................. 3 1.4.APEC pathogenicity .......................................................................................................................... 4 1.4.1.1 Adherence and invasion factors ............................................................................................... 5 1.4.1.2 Avoidance of host defense mechanisms .................................................................................. 7 1.4.2 APEC plasmids and virulence ................................................................................................. 8 1.4.3 APEC Epidemiology ............................................................................................................. 10 1.4.3.1 APEC prevention and control ................................................................................................ 11 1.5.Links between APEC and human ExPEC ....................................................................................... 12 1.6.Antibiotics ....................................................................................................................................... 14 1.6.1 Use of antibiotics ................................................................................................................... 14 1.6.2 Types of antibiotic ................................................................................................................. 16 1.6.3 Emergence of resistance to antibiotics .................................................................................. 18 1.7.Resistance to β-lactam Antibiotics:................................................................................................. 19 1.7.1 Classification of ESBLs ........................................................................................................ 20 1.7.2 Origins of ESBLs .................................................................................................................. 23 1.7.2.1 Types of ESBLs ..................................................................................................................... 24 1.7.3 Epidemiology of ESBLs ........................................................................................................ 29 1.7.4 ESBL in avian pathogenic E.coli (APEC) ............................................................................. 32 1.8.Resistant-plasmids and their impact on host bacterium .................................................................. 34 1.9.Hypothesis ...................................................................................................................................... 37
2. Materials and Methods ........................................................................................................ 40 2.1.Bacterial strains and routine growth media ..................................................................................... 40 2.2.Confirmation of species and phenotypic properties of isolates ...................................................... 42 2.2.1 Species identification using API20E ..................................................................................... 42 2.2.2 Antibiotic susceptibility testing ............................................................................................. 42 2.2.3 Phenotypic confirmation of ESBL production ...................................................................... 44 2.3.Genetic characterisation of avian E. coli isolates............................................................................ 44 2.3.1 Multiplex PCR for phylogenetic group ................................................................................. 45 2.3.2 PCR-based O-antigen typing of avian E.coli isolates ............................................................ 46 2.3.3 PCR-based determination of Virulence gene content ............................................................ 48 2.3.4 PCR-based identification of ESBL and CTX-M enzyme type .............................................. 50 2.4.Characterisation of plasmid content of avian E.coli isolates .......................................................... 51 2.4.1 Plasmid profile of avian E.coli isolates ................................................................................. 51 2.4.2 Plasmid DNA extraction, sequencing and annotation ........................................................... 52 2.5.Whole genome sequencing, assembly, annotation and analysis ..................................................... 54 2.6.Generation of ESBL-producing transformants and cured derivatives of avian E.coli isolates. ...... 55 2.6.1 New ESBL-producing derivatives ......................................................................................... 55 2.6.1.1 Electrocompetent cells preparation ....................................................................................... 56 2.6.1.2 Electrotransformation of E.coli NEB 10-beta (SAP59) ....................................................... 56 2.6.1.3 Transfer of ESBL plasmids by conjugation to avian E.coli (SAP24) ................................... 57 2.6.2 Generation of cured derivatives ............................................................................................. 58 2.6.3 Plasmid Inc/rep typing of ESBL plasmids: ........................................................................... 60 2.7.Impact of ESBL plasmids on bacterial growth and metabolism ..................................................... 63 2.7.1 ESBL plasmids and bacterial growth .................................................................................... 63 2.7.1.1 Single strain growth curves: .................................................................................................. 63

ii
2.7.1.2 Competitve growth studies and long term competitive growth assays .................................. 64 2.7.1.3 Growth under iron limiting conditions .................................................................................. 65 2.7.2 ESBL plasmids and bacterial metabolism ............................................................................. 66 2.7.2.1 Phenotypic microarray assays ............................................................................................... 66 2.7.2.2 Single strain growth on different carbon sources .................................................................. 67 2.8.Impact of pH on APEC growth and transfer of ESBL plasmids ..................................................... 67 2.8.1 Acid tolerance assay .............................................................................................................. 67 2.8.2 Plasmid mobility in different pH conditions ......................................................................... 68 2.8.3 Plasmid mobility in a chicken gut model .............................................................................. 69 2.9.ESBL plasmids and bacterial virulence .......................................................................................... 71 2.9.1 Biofilm formation assay ........................................................................................................ 72 2.9.2 Adhesion and invasion assays using HD11, THP-1 and Caco-2 cells................................... 72 2.9.2.1 Macrophage-like cells ........................................................................................................... 72 2.9.2.2 Intestinal epithelial cells ........................................................................................................ 73 2.9.2.3 Incubation conditions and enumeration of adherent or invasive bacteria: ............................ 74 2.9.3 Galleria mellonella infection model: ..................................................................................... 75
3 . Characterization of APEC strains and ESBL plasmids ................................................... 79 3.1.Bacground and aims ........................................................................................................................ 79 3.2.Results ............................................................................................................................................. 81 3.2.1 Species and isolate characterisation ...................................................................................... 81 3.2.1.1 PCR-based phylogenetic and O-antigen typing ..................................................................... 81 3.2.1.2 Antimicrobial suspectibility profiles ..................................................................................... 83 3.2.1.3 PCR-based identification of ESBL enzyme types ................................................................. 86 3.2.1.4 PCR-based assessment of virulence gene content ................................................................. 88 3.2.2 Plasmid content of APEC isolates ......................................................................................... 91 3.2.3 Generation of ESBL-producing transconjugants in E. coli K12 and a naïve avian E. coli O78
isolate. .......................................................................................................................... 92 3.2.4 Generation of plasmid-cured derivatives of the APEC isolates ............................................ 98 3.3.Discussion ..................................................................................................................................... 101
4 . Plasmid and Genome DNA Characterisation.................................................................. 105 4.1.Introduction: .................................................................................................................................. 105 4.2.Sequence analysis of ESBL plasmids from APEC isolates. ......................................................... 107 4.2.1 Key features of pSAP44 ...................................................................................................... 114 1.1.1.1 Replication region: .............................................................................................................. 114 4.2.1.1 Resistance genes: ................................................................................................................. 115 4.2.1.2 Transfer genes: .................................................................................................................... 118 4.2.1.3 Miscellanous genes. ............................................................................................................. 119 4.3.Key features of pFIB44, the FIB plasmid present in APEC isolate SAP44 .................................. 120 4.3.1 Replication, partitioning and segregation regions ............................................................... 125 4.3.2 Virulence gene content ........................................................................................................ 126 4.3.3 Comparison of pSAP44 and pFIB44 ................................................................................... 126 4.4 .Sequencing and genetic comparison of ESBL-producing (SAP44) and non-ESBL-producing
(SAP24) avian E. coli O78 isolates................................................................................................ 127 4.5.Discussion ..................................................................................................................................... 143
5 .Contribution of ESBL carriage on host cell fitness ......................................................... 151 5.1.Introduction ................................................................................................................................... 151 5.2.Impact of APEC plasmids on bacterial growth ............................................................................. 153 5.2.1 Single strain growth in nutrient-rich media ......................................................................... 153 5.2.2 Competitive growth experiments in defined minimal media .............................................. 155 5.3.Competition of the wild type SAP44 (ESBL) against its cured derivative strains. ...................... 157 5.4.Competition of the wild type SAP24 (non-ESBL) against its derivative SAP140 (ESBL). ......... 160 5.5.ESBL plasmids enhance the growth of APEC O78 type in iron-limited media ........................... 161 5.6.ESBL plasmid has a burden cost fitness on APEC strains to acid shock tolerance ...................... 165 5.7.Transfer of ESBL plasmid in APEC ............................................................................................. 167

iii
5.8.ESBL plasmid transmission in an in vitro chicken caecum model. .............................................. 171 5.9.Discussion .................................................................................................................................... 173
6 . Impact of ESBL plasmids on the metabolic fingerprint of APEC ............................... 179 6.1.Introduction ................................................................................................................................... 179 6.2.Carbon utilisation profile of wild type APEC O78 (SAP44) ........................................................ 180 6.3.Confirmation of Biolog data using growth assays ........................................................................ 183 6.4.Influence of ESBL plasmids on other APEC isolates ................................................................... 185 6.4.1 Impact on O78 APEC .......................................................................................................... 185 6.4.2 Impact on non-O78 APEC ................................................................................................... 186 6.5.Phosphorus and sulphur utilisation profiles of SAP44 ................................................................. 188 6.6.Discussion: .................................................................................................................................... 192
7 . Impact of ESBL plasmid on APEC virulence ................................................................. 197 7.1.Introduction ................................................................................................................................... 197 7.2.Impact of ESBL plasmid carriage on APEC biofilm formation ................................................... 198 7.3.APEC adherence and invasion of macrophage-like cells. ............................................................ 201 7.3.1 Avian macrophage-like cells (HD11) .................................................................................. 201 7.3.2 Human macrophage-like cells (THP1) ................................................................................ 205 7.4.APEC interactions with human intestinal Caco2 epithelial cells .................................................. 209 7.5.Colonisation and lethality of Galleria mellonela infected with APEC ......................................... 213 7.6.Discussion ..................................................................................................................................... 216
8 .Final Disccussion ................................................................................................................. 221
9 .References ............................................................................................................................ 233 10.Appendix ............................................................................................................................ 256

iv
List of tables
Table 1 Summary of β-lactamase classification based on Bush’s new scheme (Bush et al., 2010). ... 22
Table 2. Antibiotic disc content and accepted zones of inhibition (mm) around E. coli NCTC10418, a
suspectible control strain. ...................................................................................................... 43
Table 3. Primers and amplicon sizes used in phylogenetic typing........................................................ 46
Table 4. Primers and amplicon sizes used for O-antigen typing.Taken from Clermont et al. (2011). . 47
Table 5. Primers used for the detection of virulence genes in APEC. .................................................. 49
Table 6. Primers and amplicon sizes used for the detection of different β-lactamase genes by
multiplex PCR. Taken from Fang et al. (2008). ....................................................................... 50
Table 7. Primers and amplicon sizes of different CTX-M groups using a multiplex PCR. Taken from
Woodford et al. (2005). ......................................................................................................... 51
Table 8. Primers used to close the gap in Inc1I and IncFIB plasmids .................................................. 53
Table 9. Primers and amplicon sizes used in PCR-based Inc/rep typing of plasmids. ......................... 62
Table 10. Antimicrobial resistance profiles of APEC isolates. ............................................................. 85
Table 11. Virulence-associated genes in APEC strains and derivatives .............................................. 90
Table 12. Antimicrobial resistance profiles of laboratory E. coli K12 and avian E. coli (SAP24) after
conjugation with ESBL-producing APEC donor isolates. .................................................. 94
Table 14. Features and/or open reading frames of pSAP44................................................................ 109
Table 15. Features and/or open reading frames of pFIB44. ................................................................ 123
Table 16. General features counts of the SAP24, SAP44, APEC O78 (reference strain), APECO1 and
APECO2 .............................................................................................................................. 132
Table 17. Phage associated regions identified by PHAST. ................................................................. 136
Table 18. Genomic islands (GIs) in APEC strains. ............................................................................. 141
Table 19. Presence or absence of virulence genes in APEC isolates .................................................. 142
Table 20 Generation time of wildtype APEC and cured derivatives. ................................................. 154
Table 21 Relative fitness (RF) values of plasmid derivatives following pair-wise competitive growth
experiments.......................................................................................................................... 156
Table 22 . Differences in carbon utilisation between wild type APEC and their derivatives. ............ 183
Table 23 Effect of plasmid carriage on the metabolism of SAP44 strains in phosphorus and sulphur
sources. ................................................................................................................................ 191

v
List of Figures
Figure 1. Antimicrobial consumption in the community and hospitals in UK during 2013. ................ 15
Figure 2. Quantity of antibiotic products used in animals in the UK. .................................................. 15
Figure 3. Insertion sequences (IS) involved in the mobilization and expression of blaCTX-M genes. .... 28
Figure 4. Graph showing the distribution of CTX-M types. ................................................................. 29
Figure 5. Proportion of invasive E.coli isolates with resistant to third-generation cephalosporin in
Europe. .................................................................................................................................. 31
Figure 6 .plFM 27 curing vector which was used to remove the Inc1I ESBL plasmid. ....................... 59
Figure 7. Summary of the plasmid curing procedure. Taken from (Hale et al., 2010). ........................ 60
Figure 8. Schematic of the chicken gut bioreactor model. .................................................................... 71
Figure 9. Phylogenetic analysis of wildtype APEC strains. .................................................................. 82
Figure 10. O-antigen typing of wildtype APEC strains. ....................................................................... 83
Figure 11. Beta-lactam gene typing in wildtype APEC strains. ........................................................... 86
Figure 12. CTX-M group determination in ESBL APEC strains. ........................................................ 87
Figure 13. Multiplex PCR detection of iutA, iss, hlyF, ompT and iroN in APEC.. .............................. 89
Figure 14. Virulence genes determination in APEC strains (Multiplex PCR for 9 genes). .................. 89
Figure 15. Plasmid profiling of ESBL-producing APEC isolates ......................................................... 91
Figure 16. Plasmid profiling of ESBL-producing transconjugants of laboratory E. coli K12 and the
avian E. coli O78 isolate. .................................................................................................... 93
Figure 17. Inc/rep typing of ESBL plasmids in E. coli K12 transconjugants. ...................................... 96
Figure 18. Inc/rep typing of plasmids in ESBL-producing APEC isolates. .......................................... 96
Figure 19. Simplex PCR to identify IncF plasmids in APEC strains. ................................................... 97
Figure 20. Plasmid profiling of cured strains (SAP44 and SAP45). ..................................................... 99
Figure 21. Multiplex PCR of Inc/rep typing in SAP44 and its derivative strains. ................................ 99
Figure 22. Circular map of pSAP44, an ESBL-producing plasmid isolated from APEC ................... 108
Figure 23.Sequence comparison of ESBL harbouring plasmid of APEC and MDR E.coli ............... 113
Figure 24. Sequence comparison pSAP44, the ESBL-producing plasmid of APEC and plasmid R64 of
Salmonella Typhimurium. ................................................................................................ 114
Figure 25. Genetic map of the CTX-M1 region of pSAP44 and pC49-108. ...................................... 115
Figure 26. Genetic map of the tetracycline region of pSAP44 ESBL vs. pC49-108 .......................... 117
Figure 27 . Sequence comparison of the transfer gene regions of pSAP44 and R64 (AP005147) ..... 118
Figure 28. Map of pFIB44 plasmid, the IncF plasmid of ESBL-producing APEC (SAP44). ............ 121
Figure 29. DNA sequence comparison of p44FIB, pAPEC-1 and pAPEC-01-ColBM. ..................... 122
Figure 30. Phylogenetic SNP tree of APEC O78 isolates ................................................................... 129
Figure 31.Genome comparative analysis of SAP24, SAP44 and the APEC O78 reference strain ..... 131

vi
Figure 32. Genomic Islands in SAP44 ................................................................................................ 138
Figure 33. Genomic Islands in SAP24 ................................................................................................ 138
Figure 34. Genomic Islands in APEC O78 ......................................................................................... 139
Figure 35.Competitive growth of wild type APEC strain SAP44 and the plasmid-cured derivative . 157
Figure 36. Competitive growth assay of SAP44WT and its derivative strains. .................................. 159
Figure 37.Competitive growth assay of non-ESBL SAP24 and its derivative strain.......................... 160
Figure 38. Single strain growth curve of wildtype APEC (SAP44) or its derivatives in iron-limited
growth media. ................................................................................................................... 163
Figure 39.Single strain growth curves of non-ESBL APEC (SAP24) or the ESBL-producing
transconjugant (SAP140) in iron-limited growth media. .................................................. 163
Figure 40. Single strain growth curve of wild type APEC (SAP44) or its derivatives in media
supplemented with iron (1.5µM). ..................................................................................... 164
Figure 41. Single strain growth curves of non-ESBL APEC (SAP24) or the ESBL-producing
transconjugant (SAP140) in media supplemented with iron (1.5µM). ............................. 164
Figure 42.Acid tolerance assay in APEC O78 carrying ESBL plasmids. ........................................... 166
Figure 43. Conjugation frequency of ESBL plasmid among APEC O78 strains. .............................. 168
Figure 44. Conjugation frequency of ESBL plasmid transfer between stressed donor (SAP44WT) and
stressed recipient (SAP24). ............................................................................................... 170
Figure 45. Conjugation frequency of ESBL pSAP44 plasmid in APEC O78 strains. ........................ 172
Figure 46. Cluster heat map showing the single values of SAP44WT and its derivative strains
obtained from 190 different carbon sources. .................................................................... 182
Figure 47. Growth of SAP44WT and its derivative strains in minimal media supplemented with α-
keto glutaric acid as a sole carbon source. ........................................................................ 184
Figure 48. Differences in carbon utilisation by non-ESBL SAP24 and SAP44 (plasmidless). .......... 187
Figure 49. Cluster heat map showing the single values of SAP44WT and its derivative strains
obtained from different phosphorus and sulphur sources. ................................................ 190
Figure 50. Biofilm formation of APEC with and without ESBL plasmids in different temperatures. 200
Figure 51. The ability of APEC O78 strains carrying the ESBL plasmid to adhere, invade and survive
in HD11 cells. ................................................................................................................... 203
Figure 52. The ability of APEC strains (SAP45 and SAP46) and K12 E.coli carrying the ESBL
plasmid to adhere, invade and survive in HD11 cells. ...................................................... 204
Figure 53. The ability of APEC O78 strains carrying the ESBL plasmid to adhere, invade and survive
in THP-1 cells. .................................................................................................................. 207
Figure 54. The ability of APEC strains (SAP45 and SAP46) and K12 E.coli carrying the ESBL
plasmid to adhere, invade and survive in THP-1 cells. ..................................................... 208
Figure 55. The ability of APEC O78 strains carrying the ESBL plasmid to adhere, invade CACO2
cells. .................................................................................................................................. 211

vii
Figure 56. The ability of APEC strains (SAP45 and SAP46) and K12 E.coli carrying the ESBL
plasmid to adhere, invade CACO2 cells. .......................................................................... 212
Figure 57. The ability of bacterial hosts carrying ESBL plasmid to cause infection in Galleria
mellonella. ......................................................................................................................... 214
Figure 58. Number of bacteria (cfu/ml) recovered from larvae infected with APEC at various times
post infection. .................................................................................................................... 215

viii
List of abbreviation
Abbreviation Definition
API 20 E Bacterial identification strip (bioMerieux, Inc.)
ATP Adenosine triphosphate
Bla Beta-lactamase
BlaCTX Cefotaximase β-lactamase (ESBL)
BlaOXA Oxacillinase β-lactamase
BlaSHV Sulfhydryl varient β-lactamase (ESBL)
BlaTEM Temorina β-lactamase (ESBL)
Bp Base pair
BSAC British Society for Antimicrobial Chemotherapy
°C Degrees Celsius
CaCl2 calcium chloride
Caco-2 human intestinal epithelial cells
Caz Ceftazidime
CFU Colony forming units
CI Competition index
Ctx Cefotaxime
ddH2O double distilled water
DMEM Dulbecco’s modified Eagle medium
DNA Deoxyribonucleic acid
DNA Deoxyribonucleic acid
Dntp Deoxynucleotide triphosphate
EDTA Ethylenediamenetetra acetic acid
ESBL Extended spectrum β-lactam
FeSO4 Iron sulphate
HBSS Hanks balanced salt solution
HCl Hydrochloric acid
HD11 chicken macrophage-like cell line
Inc Incompatibility
Int Integron gene

ix
Abbreviation Definition
ISEcp1 Insertion element cp1
ISO Iso-sensitest
K2HPO4 Potassium Phosphate (dibasic)
Kan Kanamycin
Kb Kilobase
KH2PO4 Potassium Phosphate (monobasic)
LB Luria Bertani
M Molarity (mol/L)
MDR Multi-Drug resistant
MEM Minimum Essential Medium
MGE Mobile genetic element
MgSO4 Magnesium Sulfate
MIC Minimum inhibitory concentration
Ml Mililitre
Na2HPO4 Sodium phosphate dibasic
(NH4)2SO4 Ammonium Sulfate
Na3C6H5O7 (H2O)2 Sodium Citrate (trisodium, dihydrate)
NaCl sodium chloride
NCTC National collection of typed cultures
NEAA Non-essential amino acids
Ng Nanogram
Nmol Nanomol
OD Optical density
P Probability
PBS PBS Phosphate Buffered Saline
PCR Polymerase chain reaction
PMA Phorbol 12-myristate 13-acetate
Rep Replicon
RNA Ribonucleic acid
RNAse Ribonuclease
Rpm Rate per minute
RPMI1640 Roswell Park Memorial Institute medium

x
Abbreviation Definition
Str Streptomycin
TBE Tris-Borate EDTA buffer
TE Tris EDTA buffer
Tet Tetracycline resistance gene
THP-1 human monocyte-like cell line
U Units/ml
VL Viande Levure media
Μg Microgram
Μl Microlitre
μM Micromolar

Chapter 1: Introduction

1
1 .Introduction
1.1 Introduction
Escherichia coli is a Gram negative rod-shaped bacterium that belongs to the family,
Enterobacteriaceae. Originally called Bacterium coli, the organism was renamed E.
coli in honour of the German pediatrician “Theoder Escherich” who originally
identified it from the faeces of healthy individuals (reviewed in Shulman et al., 2007).
While most E. coli are considered harmless and colonise the colon of infants soon
after birth, some strains are pathogenic and capable of causing a range of intestinal
and extra-intestinal infections.
Pathogenic E. coli are classified into several distinct groups or pathotypes
based on the presence of certain virulence factors and the type of disease they
cause. Intestinal pathogenic E. coli (IPEC) such as Enteropathogenic E. coli (EPEC),
Enteroaggregative E. coli (EAEC), Enterohaemorrhagic E. coli (EHEC),
Enteroinvasive E. coli (EIEC) and Enterotoxigenic E. coli (ETEC) colonise the
intestinal tract and cause diarrheal disease (reviewed in Croxen & Finlay, 2010).
Conversely, extraintestinal pathogenic E. coli (ExPEC) such as urinary pathogenic E.
coli (UPEC) and neonatal meningitis-associated E. coli (NMEC) are groups of
pathogenic E. coli that cause infections at sites outside of the intestinal tract (Kaper
et al., 2004). Grouped with ExPEC are the avian pathogenic E. coli (APEC), which
can cause respiratory disease in poultry and constitute a growing health concern to
humans (Antão et al., 2009).
Recent studies suggest that APEC may be zoonotic and linked to human
ExPEC (Johnson et al., 2007; Ewers et al., 2007; Lima-Filho et al., 2013). In addition
to similarities in their chromosomal attributes, APEC and human ExPEC both

2
harbour similar large, conjugative plasmids, which carry antibiotic resistance genes.
In particular, carriage of genes coding for the production of extended spectrum beta-
lactamases (ESBLs) which confers resistance to current frontline antibiotics such as
the 3rd and 4th generation cephalosporins, is common. Whether carriage of the
plasmids confers a benefit to the organism over and above that attributed to
antibiotic resistance, is not clear. While several studies have examined the impact of
ESBL-plasmids in the context of human infections (Dubois et al,. 2009 ; Lavigne et
al., 2006; Aoki et al., 2004), less is known about the properties and impact of ESBL-
producing plasmids in APEC. This represents a significant gap in knowledge and is
the focus of the work presented in this thesis.
1.2 Escherichia coli strains associated with extra intestinal diseases
Extra-intestinal pathogenic E. coli (ExPEC) differ from intestinal pathogenic E. coli
(IPEC) pathotypes in that they are genetically diverse and exhibit a dual
extracellular/intracellular infectivity (Köhler & Dobrindt, 2011). Like all E. coli, ExPEC
can be found in the intestinal tract of both humans and animals. However, these
organisms are able to escape the gut and multiply at sites distal from the intestine
including the urinary tract, bloodstream and respiratory tract (Kaper et al., 2004).
While UPEC and NMEC are probably the most widely known ExPEC pathotypes,
several other groups that cause disease outside of the intestine in animals have
been described. Of these, infections caused by APEC are responsible for significant
morbidity and mortality in domestic and wild birds and can have devastating effects
on the global poultry industry.

3
1.3 Avian Pathogenic E.coli (APEC):
1.3.1 Impact of APEC infections on poultry and the poultry industry
Colibacillosis is an economically important disease of poultry associated with extra-
intestinal infections of avian pathogenic E. coli (APEC) (La Ragione and Woodard,
2002; Dziva & Stevens, 2008). APEC can cause infections in all ages of birds
producing a variety of disease manifestations including acute septicaemia and death
(reviewed in Lutful Kabir, 2010).The most commonly isolated pathogenic E. coli in
poultry belong to O serogroups, O78, O1, O2, O15 and O55 (Ewers et al., 2003).
APEC have been isolated from a number of different sites in poultry such as
the intestine, on skin and feathers, and in the upper respiratory tract (reviewed in
Lutful Kabir, 2010). However, the route of APEC infection is not clearly established,
with the oral and respiratory tract considered the most likely modes of entry (as
reviewed by Dziva & steven, 2008). From these sites, the organism is thought to gain
access to the bloodstream and colonize specific internal organs causing local and
systemic infections (Nakazato et al., 2008). The most common disease associated
with colibacillosis are airsacculitis, pericarditis and perihepatitis although in some
cases the infection results in syndromes like egg peritonitis, salpingitis,
caligranuloma, omphilitis, cellulitits, osteomyelitis or artheritis (reviewed in
Vandekerchove et al., 2004).
In addition, infection by APEC can show different manifestations when the
infection occurs in combination with other infectious agents such as turkey
rhinotracheitis virus in chicken, which leads to swollen head syndrome (reviewed in
Dziva & Steven, 2008). The infection of the yolk sac by APEC is the major cause of
early mortality in young broilers (Khan et al., 2004). Experimental infection studies
4
have demonstrated that yolk sac infections develop when bacteria were able to cross
the gut wall (as reviewed by Khan et al., 2004; Fuller and Jayne-Williams (1968)).
Outbreaks of colibacillosis have also been reported in laying hens. APEC-induced
septicemia, pericarditis and perihepatitis, with peritonitis and polyserositis were
commonly found at necropsy and O78 strains were the most prominent E. coli
serogroup associated with disease (Vandekerchove et al., 2004).
These diseases have a negative impact on the avian industry and can be
associated with significant economic losses. For example, air sacculitis frequently
presents in birds of 14 days of age, with mortality rates reaching approximately 20%
(Nakazato et al., 2008). Swollen head syndrome often accounts for decline in egg
production of 2 to 3% and mortality rates of 3 to 4% (Nakamura et al., 1997).
Infections with coligranuloma, which is identified by the presence of granulomata in
the liver, caeca and duodenum, can cause high rates of mortality reaching up to 75%
of the affected flock (as reviewed by Lutful Kabir, 2010). It has been estimated that
mortality in the first week of life can lead to more than 50% of total flock losses
(Yassin et al., 2009). Economic losses can also be linked to decreased hatching
rates, lower egg production or increases in the costs of treatment. Despite the high
prevalence of colibacillosis, available data regarding the true economic burden of
this infection to the industry is difficult to assess (Barnes et al., 2008).
1.4 APEC pathogenicity
Evidence is increasing that APEC are well-adapted pathogens in poultry and may
also exhibit zoonotic potential. Thus, infections caused by APEC may not always
arise as secondary infections or a consequence of other predisposing factors
(Barnes et al., 2008). A number of studies have indicated that APEC have unique

5
repertoire of virulence genes and experimental studies have indicated that APEC are
capable of causing primary infections in otherwise healthy birds.
APEC are characterised by the presence of virulence genes that distinguishes
them from commensal avian E. coli (Barnes et al., 2008). These virulence genes
may be located on chromosomal or plasmid DNA (Janben et al., 2001). Acquisition
of virulence genes or plasmids contribute to APEC pathogenicity within the host
which leads to the development of disease symptoms (Mellata et al., 2012).
As mentioned in the previous section, the routes of infection for APEC have
not been clearly defined, although the oral and respiratory routes of infection are
widely regarded as the main modes of entry (as reviewed by Dziva & Steven, 2008).
Regardless of the route of infection, columnar epithelial cells likely represent the first
host cells encountered by the organism as it colonises the host. As a consequence,
adherence and invasion factors likely constitute key mediators of APEC virulence.
Virulence factors associated with APEC adherence include type 1 and P fimbriae,
lipopolysaccharide (LPS), K1 capsular antigen, temperature-sensitive hemagglutinin
(Tsh). Some of these factors have been documented to be important in protecting
APEC against the bactericidal effect of phagocytes, especially heterophils (Mellata et
al., 2003). As such, they become important when APEC invades and survives in the
bloodstream, leading to localised (e.g. lesions on multiple internal organs) and
systemic infections (e.g. septicaemia), and potentially sudden death of the birds
(Ewers et al., 2003).
1.4.1.1 Adherence and invasion factors
Several types of adhesion factors have been identified in APEC and shown to be
important in colonisation of the host. For example, numerous types of fimbriae, thin

6
thread-like projections protruding from the cell surface, have been identified in APEC
including AC/1, F1, F11, Stg and curli (Dho-Moulin & Fairbrother, 1999). Expression
of F1 fimbriae was found to be important during APEC colonisation of tracheal
epithelial cells (Dozois et al., 1994; La Ragione et al., 2000) whereas P fimbriae
were expressed during colonisation of the lower respiratory tract and organic tissues
such as the liver, spleen and kidney (Dho-Moulin & Fairbrother, 1999). Also,
temperature-sensitive haemagglutinin (tsh), an autotransporter protein encoded by
some APEC strains and first identified by Provence and Curtiss (1994), has been
shown to play an important role in the early stages of colonising the chicken
respiratory tract (Dozois et al., 2000).
In addition to fimbriae, several invasion factors have been identified in APEC
including IbeA (an invasion associated protein) and OmpA (outer membrane protein
A) (Germon et al., 2005). More recently, the ibeR gene which is located on the same
genomic island (GimA) as the IbeA gene has been shown to have an important role
in APEC invasion capacity of DF-1 cells, brains and cerebrospinal fluid (CSF) in vitro
and in vivo (Wang et al., 2015).
How APEC crosses the epithelial cell barrier and enters the blood stream is
poorly understood (as reviewed by Dziva & Steven, 2008). In vitro studies show that
APEC is able to invade non-phagocytic cells such as the fibroblast cell line, CEC32,
which suggests that APEC may also be able to invade epithelial cells of the avian
respiratory tract in vivo (Matter et al., 2011). Moreover, experimental infection studies
show that APEC were able to survive within macrophages, resisting the processes of
opsonisation and phagocytosis (Pourbakhsh et al., 1997). Occasionally APEC were
also found in the connective tissue, indicating that they had spread to the internal

7
organs. Thus, this study concluded that the lung and air sac are important sites of
invasion into the blood stream.
1.4.1.2 Avoidance of host defense mechanisms
Survival of APEC in the blood stream and internal organs requires avoidance of host
defense mechanisms, including complement-mediated lysis and opsonisation.
Increased serum survival (Iss) protein was one of the first factors linked to increased
resistance to serum in APEC (Binns et al., 1979). It is thought to act by preventing
the deposition of the membrane attack complex of complement, thereby enabling
APEC to resist the bactericidal effects of complement. The gene iss codes a protein
that is more often found in APEC strains than in commensal E. coli strains isolated
from healthy birds (Johnson et al., 2008) and is usually located on large ColV and
ColBM plasmids (Mellata et al., 2009).
The surface expressed O- and K-antigens also help APEC avoid lysis and
death when inside the host cell. Both the O78 lipopolysaccharide and the K1 capsule
have been linked to increased bacterial resistance to serum and colonization of
internal organs (Mellata et al, 2003). These factors appear to reduce opsonisation by
C3b complement and thus phagocytosis by neutrophils and macrophages
(Pourbakhash et al., 1997).
The ability of invasive bacteria to acquire iron from body fluids is a critical
virulence mechanism (Gao et al., 2012a). Within host body fluids, APEC produces
siderophores including enterobactin, aerobactin or yersiniabactin to sequester iron
from host siderophores (Nakazato et al., 2009). Thus, genes encoding iron uptake
systems are frequently found in APEC and can be carried on chromosomal or
plasmid DNA (Johnson et al., 2008). The ColV and ColBM plasmids of APEC often

8
harbour multiple iron uptake systems including iroBCDN, sitABCD and iutA iucABCD
(Mellata et al., 2009).
APEC produce several toxins that are important in disease (Janben et al.,
2001; Ewers et al., 2009).These toxins include cytotoxins such as the heat labile (LT)
toxin, heat stable (ST) toxin, neurotoxins and verotoxin (or Shiga toxin (Stx)),
cytolethal distending toxin and cytotoxic necrotizing factor1 as well as haemolysins
(Barnes et al., 2008; La Ragione et al., 2002). Some of these toxins are encoded on
virulence plasmids such as hlyF, which is located on the ColV and ColBM plasmids
(Mellata et al., 2009).
1.4.2 APEC plasmids and virulence
APEC carry multiple large plasmids and many of their virulence factors are located
on these mobile genetic elements. Plasmids belonging to different replicon types
have been identified in APEC, with IncFIB being most commonly identified followed
by IncI1, IncFIIA, IncP, IncB/O, IncN, and IncFIC (Johnson et al., 2007). Most of
these plasmid’s replicon types were also found in isolates of E. coli from human
origins (Johnson et al., 2007; (Johnson et al., 2011), suggesting that a common set
of plasmids are circulating between human and avian populations. As in other
pathogenic E. coli, the plasmids are associated with carriage of virulence genes and
antimicrobial resistance factors (Carattoli, 2013; Cantón et al., 2012; Johnson et al.,
2010).
Colicin-encoding plasmids in particular ColV plasmids, have been associated
with APEC virulence (as reviewed by Johnson & Nolan, 2009). Particular diseases in
poultry such as swollen head syndrome have been found to be associated with
strains producing colicin ( Silveira et al., 2002). Colicin expression by APEC strains

9
indicated that colicins Ia, Ib, E1, E2, E3, I, K, B and V are the most prevalent among
these bacterial strains (Fantinatti et al., 1994).
ColV and ColBM plasmids are the most well characterized plasmids found in
APEC (Johnson et al., 2006a; Johnson et al., 2006b). Both are large, conjugative
plasmids that belong to the same incompatibility group (IncFIB or IncFII/FIB types).
The sequence of the ColV plasmid, pAPEC-O2-ColV, was completed in 2006 and
came from an APEC isolate belonging to the O2 serogroup (Johnson et al., 2006).
Analysis of its content revealed that the plasmid contains several virulence genes
known to contribute to APEC pathogenesis. For example, genes coding for iron
acquisition systems, manganese transport systems, outer membrane proteases,
hemolysins, increased serum survival and hemagglutinin, were detected. Three
years after release of the pAPEC-O2-ColV sequence, three large plasmids from an
APEC O78 isolate were fully sequenced and characterized. These plasmids were
found to belong to three different replicon types IncFIB, IncFIIA and IncFIC (Mellata
et al., 2009). However, like pAPEC-O2-ColV, the plasmid pAPEC-1 which belonged
to IncFIB, harboured most of the virulence genes.
These three large plasmids [pChi7122-1 (IncFIB/FIIA-FIC), pChi7122-2
(IncFII), and pChi7122-3 (IncI2)]; and a small plasmid pChi7122-4 (ColE2-like) have
been studied for their roles in APEC infections. The plasmids appeared to enhance
biofilm formation, acid and bile tolerance as well as to encode other virulence genes
such as an ABC iron transport system (eitABCD) and a putative type IV fimbriae
(Mellata et al., 2012).
Several APEC virulence genes were also found on a large conjugative R
plasmid known as pTJ100. This plasmid was present in several different sero-
groups, but was more common in O78 and O2 groups (Rodriguez-Siek et al., 2004).

10
Several other plasmids have now been described including IncFIB: colicin encoding
plasmid, IncHI2: encoding resistance to antimicrobial agents, pAPEC-01-Cryp1 and
pAPEC-01-Cryp2 (Johnson et al., 2007). Recently, plasmids belonging to IncI
replicon types and carrying multi-drug resistance have been increasingly detected in
APEC (Cloeckaert et al., 2010; García-Fernández et al., 2008; Fischer et al., 2014;
Accogli et al., 2013). Plasmid belonging to IncI are often described as conjugative,
large in size and mostly found associated with resistance to extended spectrum
cephalosporin (Johnson et al., 2011).
Despite the prevalence of large plasmids in APEC, their role in the organism’s
virulence is poorly understood. Most experimental studies are limited to a description
of the virulence gene content, resistance profile and plasmid replicon type (Bortolaia
et al., 2010; Accogli et al., 2013). Relatively few completed sequences with full
characterization of plasmid gene content are available in the public databases (as
reviewed by Johnson & Nolan, 2009) and this lack of knowledge has impaired an
understanding of APEC plasmid biology and their contribution to virulence.
1.4.3 APEC Epidemiology
APEC most commonly linked to infections belong to the O1:K1, O2:K2 and O78:K80
serotypes, although the number of serotypes linked to infection is still increasing
(Ewers et al., 2003) and includes some untypeable strains (El-Sukhon et al., 2002).
APEC O78 are considered the most frequent serogroup associated with colibacillosis
which might be due to this strain’s ability to acquire virulence mechanisms
(Collingwood et al., 2014).
Epidemiological studies have found that APEC are widespread globally. For
example, out of 216 E. coli strains isolated from chicken and environmental
specimens in Korea, APEC were found in 31% of layers and 14% of broilers (Kwon

11
et al., 2008). In the UK, approximately 50 % of 70 E. coli strains isolated from an
colibasillosis outbreak in a layer breeder flock belonged to the same clonal group
(Timothy et al., 2008).
In Germany, 50% of 150 APEC isolated from septicaemic poultry were found
to belong to O1, O2 and O78 serogroups (Ewers et al., 2004). In contrast, sero-
group O6 was more prevalent in Brazil followed by O2, O8, O21, O46, O78, O88,
O106, O111, and O143 (Knöbl et al., 2011). In Bangladesh the highest levels of
avian colibacillosis were recorded in the summer and occurred in all age groups of
chicken but particularly in adult layer birds (37%) (MA et al., 2004). In Belgium an
epidemiological study of 20 flocks affected by colibacillosis indicated that the O78
serotype was the predominant type associated with the outbreak, followed by O1
and O2 (Vandekerchove et al,. 2004). Recent study of APEC in outbreaks in
Netherlands revealed that E. coli peritonitis syndrome (EPS) in layer and breeder
chickens was associated with one or two dominant E. coli genotypes in each case
(Landman et al., 2014).
In summary, although many studies show that serotypes O78, O1 and O2 are more
frequently associated with disease, these serogroups are genotypically diverse and
strains can show different cellular responses during in vitro assays (Kabir, 2010).
1.4.3.1 APEC prevention and control
Several important factors which contribute to outbreaks of avian colibacillosis have
been described in the literature. Direct or indirect contact with other animals or
faeces can expose the poultry flocks to new strains (as reviewed by Barnes et al.,
2008). This may include carriage of APEC by rodents and flies. Contaminated water
supplies have also been associated with the spread of disease on several farms
(Dhillon & Jack, 1996). It is believed that colibacillosis outbreaks are also linked with

12
low quality housing conditions including insufficient ventilation, the build-up of
ammonia which can affect respiratory function, and inhalation of excessive dust
which may contain large populations of E. coli (Bermudez, 2008). The distance
between farms, and the amount of space per hen in the cage were also significantly
associated with colibacillosis outbreaks (Vandekerchove et al., 2004b). For example,
the incidence of colibacillosis was decreased six-fold with every 1 km increase in
distance to the nearest poultry farm; a factor that enables better control of the
disease during outbreak scenarios (Vandekerchove et al., 2004b).
There are several recommendations to reduce infections by APECs and other
pathogenic bacteria. These include venting the incubators and hatchers to the
outside, keeping a low number of breeders per unit area, fumigating eggs, and
discarding any cracked eggs or eggs contaminated with faecal material. Good
hygiene and avoiding possible sources of APEC are key measures to control APEC
infections (Kabir, 2010).
1.5 Links between APEC and human ExPEC
A number of studies have indicated that APEC may be zoonotic with human
infections potentially occurring through contact with poultry or poultry products.
However, the identification of ExPEC strains (including APEC) from commensal E.
coli can be challenging because unlike IPEC, these organisms harbor many different
virulence factors (Köhler & Dobrindt, 2011). Several studies reported that there is
similarity between the virulence factors carried by APEC and human ExPEC.
Comparative genomic analysis revealed that “ExPEC and non-pathogenic E. coli
share a large genomic fraction” (Köhler & Dobrindt, 2011), with only 4.5% of the
APEC O1 genome not found in three human ExPEC genomes (Johnson et al.,

13
2007). Over the last decade, many studies have highlighted the genetic similarities of
avian and human ExPEC that causes sepsis (Johnson et al., 2007; Bauchart et al.,
2010). Similarities have been noted in the organism’s virulence gene content,
phylogenetic group and even in plasmids which carry virulence and resistance genes
(Ewers et al., 2007).
Both groups of organisms exhibit similar antimicrobial suspectibility profiles
and harbor similar drug resistance elements (Ajiboye et al., 2009). A study
conducted by Johnson et al. (2010) found that 58 % of neonatal meningitis E. coli
(NMEC) population harbored ColV-type plasmids that are also found in APEC, and
that 26% of these plasmids carried drug resistance genes similar to that of pAPEC-
O103-ColBM found in APEC. Gao et al. (2012a) indicated that no significant
differences were found between mutants lacking the iron acquisition system and wild
type strains of APEC O1 and UPEC during invasion and intracellular survival of the
chicken macrophage-like cell line, HD11. All these findings may suggest that APEC
in poultry act as a source of virulence and resistance genes for human ExPEC
strains.
Finally, recent studies have raised the possibility that APEC might act as a
zoonotic agent (Johnson et al., 2007; Knobl et al., 2011). Experimental studies have
now confirmed that APEC can cause disease in mammalian infection models similar
to human ExPEC infections such as ascending urinary tract infection (UTI) (Fricke et
al., 2009). Conversely, human ExPEC strains appear to have the ability to cause
disease in avian disease models (Jakobsen et al., 2012).

14
1.6 Antimicrobial agents
Antibiotics are defined as molecules that kill or inhibit the growth of microorganisms.
Depending on their mode of action and target in the cell, antibacterial agents are
divided into five main groups (Tenover, 2006). These include molecules that inhibit
1) cell wall synthesis, 2) protein synthesis, 3) nucleic acid synthesis, 4) metabolic
pathways, as well as those that 5) disrupt the cytoplasmic membrane.
1.6.1 Use of antimicrobial agents
Antimicrobials are used in humans and animals for several reasons, including
disease treatment, prevention, and control, as well as historically for growth
promotion (as reviewed by Marshall & Levy, 2011). In England, the β-lactams and
tetracycline are the most commonly used drugs in hospitals or communities,
representing 49% and 16% of the drugs used to treat systemic infections,
respectively (Figure 1).Similarly, these two antibiotics represent 80% of the antibiotics
sold in veterinary medicinal products in the UK, which suggests that there is a high
consumption of these drugs in animal livestock production systems (Figure 2).

15
Figure 1. Antimicrobial consumption in the community and hospitals in UK during 2013.
Distribution of antimicrobial consumption of Antibacterials for Systemic Use (ATC group J01) in the community and hospital sector in United Kingdom, reporting year 2013 (adapted from European Centre for Disease Prevention and Control website, 2015).
T e tra c y c lin
e s
T r ime th
o p r im/s
u lph
ß - lac ta
ms
Am
ino g ly
c o s ide s
Ma c ro lid
e s
F loro q u in
o lon e s
Oth
e r
0
5 0
1 0 0
1 5 0
2 0 0
To
nn
es
ac
tiv
e in
gre
dia
nt
Figure 2. Quantity of antibiotic products used in animals in the UK between 2009 and 2013.
(Adapted from UK veterinary antibiotic resistance and sales surveillance,
https://www.gov.uk/government/uploads/system/uploads/attachment_data/file/440744/VARSS.
pdf).

16
One of the biggest threats to human health is the emergence and spread of
pathogenic bacteria that are resistant to antibiotics, which make infections caused by
these organisms hard to treat. Although this is frequently blamed on the poor use of
antibiotics in the treatment of human infections, it is also believed that the use of
antibiotics as growth promoters in animal production systems has contributed to the
emergence of resistance bacteria (as reviewed by Marshall & Levy, 2011).
1.6.2 Types of antibiotic
Antibiotics are grouped based on their mode of action and target within the cell (Kanj
& Kanafani, 2011). The β-lactam family of antibiotics includes penicillin,
cephalosporins, carbapenems, monobactams and glycopeptides, and are
distinguished by the presence of a β-lactam ring (Bradford, 2001). All are bactericidal
and exhibit various spectrums of activity against Gram positive and Gram negative
bacteria. For example, penicillin is active against Gram positive bacteria that do not
produce beta-lactamase, Neisseria and some anaerobes whereas cephalosporin has
broad spectrum activity against many Gram positive and Gram negative bacteria.
Inhibition of the cell wall synthesis by these agents occurs when the β-lactam ring
binds to the penicillin binding proteins, which are essential components involved in
the synthesis of the peptidoglycan layer in bacteria (Tenover, 2006).
Inhibition of protein synthesis by aminoglycosides occurs via binding to the
30S ribosomal subunit which subsequently prevents formylmethionyl-transfer RNA
(fmet-tRNA) from binding to the ribosome (Bradford, 2001). All antimicrobials
belonging to this class are bactericidal and have broad spectrum of action against
Gram positive and Gram negative bacteria. They are often used in combination with
β-lactam antibiotics to treat severe bacterial infections (Kotra et al., 2000).

17
Tetracycline and chloramphenicol are bacteriostatic and also interfere with
protein synthesis. However, these drugs bind to the 50S ribosomal subunit where
they prevent the aminoacyl transfer RNA action and peptide bond synthesis
respectively (Doi & Arakawa, 2007; Connell et al., 2003). Macrolide antibiotics like
erythromycin, are also bacteriostatic and have the same mode of action as
tetracycline by binding to the bacterial 50S ribosomal subunit but their spectrum of
activity mainly against Gram positive cocci (Roberts, 2008).
Fluroquinolones are bactericidal synthetic agents able to deactivate
deoxyribonucleic acid (DNA) gyrase and topoisomerase IV, disrupting DNA
replication (Blondeau, 2004). Rifampicin is another bactericidal agent that is able to
inhibit the synthesis of messenger RNA (mRNA) by binding to DNA – dependent
RNA polymerase. It is primarily used against Gram positive and some Gram
negatives. It is also used in combination with other drugs to treat tuberculosis and
used as prophylaxsis to treat carriers of N.meningitides (Campbell et al., 2001). Both
fluroquinolones and rifampicin have higher affinity for their site target in bacterial
cells than in mammalian cells (Blondeau et al., 2004).
Sulfonamides and Trimethoprim also known as co-trimoxazole, are
bactericidal and consist of one part of trimethoprim to five parts of sulfamethoxazole.
They are both able to block the synthesis of tetrahydro folic acid (THFA), which is
essential for producing purines and pyrimidines, principal components of DNA
(Sköld, 2001). Sulfonamides /Trimethoprim are mainly described for treatment of
urinrary tract infections (UTIs), otitis media in children and chronic bronchitis in
adults (Connor ,1998).
The last mechanism of action is the disruption of the cytoplasmic membrane
by polymyxins or lipopeptides. Polymyxin A, B, C, D and E are all bactericidal and

18
have free amino groups which disrupt the phospholipid structure of the bacterial cell
membrane (Landman et al., 2008), whereas lipopeptides act by depolarizing the
bacterial cytoplasmic membrane (Yeaman & Yount, 2003). Both have narrow
spectrum activity against Gram negative bacteria associated with UTI, blood, CSF
and eye infections (Landman et al., 2008). Polymyxin can be used in combination
with other drugs against infections caused by resistant Pseudomonas and Klebsiella
pneumoniae (Landman et al., 2008).
1.6.3 Emergence of resistance to antibiotics
It is widely believed that the use and mis-use of antibacterial agents in humans and
animals has contributed to the increase in resistance among pathogenic bacteria
(Angulo et al., 2004). Organisms may acquire resistance as a result of mutations in
chromosomal genes or through the exchange of resistance genes between
microorganisms. Mobilization of antibiotic resistance genes by mobile genetic
elements has contributed to the spread of resistant bacteria. Key mobile genetic
elements include i) plasmids, which play a role in the emergence of multidrug
resistant bacteria by translocating several resistance genes from one host cell to
another via conjugation (Stokes & Gillings, 2011); ii) conjugative transposons, which
contribute to the spread of antibiotic resistance genes in a manner similar to that of
plasmids but by first excising the mobilized genes and transferring a copy of itself by
conjugation to another bacterium where it integrates to its genome (Salyers et al.,
1995); and iii) integrons, which transfer resistance genes that are inserted one after
another, by a site specific mechanism which involves specific site attachment and
integrase (Mazel, 2006). Transposons and integrons are both found in plasmids and
in the bacterial chromosome; mutations in these elements enable the

19
microorganisms to rapidly adapt to changing environments (Henriques Normark &
Normark, 2002).
Resistance to antimicrobial agents can occur via several different mechanisms.
These include producing enzymes that inactivate the antimicrobial agent, producing
alternative enzymes that are insensitive to the enzymatic activity of the drug,
mutation in the drug’s target site, altering of permeability of the outer membrane, and
activating efflux pumps to remove the drug from the cell (Tenover, 2006).
1.7 Resistance to β-lactam Antibiotics:
Beta-lactam antibiotics are one of the most widely used antimicrobial agents (Kanj &
Kanafani, 2011), therefore the emergence of resistance at high levels has been
reported in many countries (Tenover, 2006). There are three possible mechanisms
bacteria use to become resistant to beta-lactams. Firstly, by alteration in the target
site, resistant bacteria are able to avoid the beta-lactam activity. For example, the
mecA gene in methicillin-resistant Staphylococcus aureus (MRSA) synthesizes a
new penicillin binding proteins (PBPs) that has a lower affinity to beta-lactams (Rice,
2006). Other organisms such as Haemophilus Influenzae and Neisseria gonorrhoeae
have also achieved their resistance by the same mechanism (Bradford, 2001).
Alteration in access to the target site is the second mechanism that such
resistant bacteria can use for beta-lactam resistance. This is mostly described in
Gram negative bacteria where the impermeability of the outer membrane is
increased in order to prevent the accumulation of the drug inside the cell. This
occurs as a result of mutations in the porins (protein channels) located in the outer
membrane (Blondeau et al., 2004). The permeability barrier of the outer membrane

20
is a major factor in the resistance of Pseudomonas aeruginosa to many β-lactam
antibiotics (Tenover, 2006).
The third and most important mechanism of resistance is by the production of β-
lactamases, enzymes that hydrolyze the beta-lactam ring of certain antibiotics
(Therrien & Levesque, 2000). The genes coding for β-lactamases are mostly found
on plasmids (Tenover, 2006). There are several classes of β-lactamases (see
below), and many of these have now been reported from countries around the world
(Bradford, 2001; Li et al., 2007).
1.7.1 Classification of ESBLs
The classification of β-lactamases was proposed on the basis of two types of
categories, molecular structure and amino acid sequences (Ambler et al., 1991;
Bush & Jacoby, 2010). In the Ambler classification, β-lactamases were divided into
four classes (A, B, C and D) depending on their amino acid sequence. Ambler
initially identified two classes; A, which has a serine residue in the active site of the
β-lactamase and B, which has the Zn ion at its active site (Ambler, 1980). The
following year, a new class of serine B-lactamases (designated as class C) was
reported, which was found to bear less similarity to the known sequences in class A
(Jaurin & Grundström, 1981). Lastly, class D comprising a another group of serine β-
lactamases was identified, which appeared to be distinct from either class A or C
(Ouellette et al., 1987).
Bush and Jacoby scheme uses the β-lactamases substrate and inhibition
profiles (a functional classification) to classify the enzymes (Bush et al., 1995). More
recently, the two classification schemes have been integrated to include the newly
emerging β-lactamase (see Table 1;(Bush & Jacoby, 2010)). Serine containing β-

21
lactamases are subdivided based on their response to the B-lactamase inhibitor,
clavulanic acid. Extended- spectrum beta-lactamases (ESBLs) are classified in the
molecular class A and belong to group 2be that are able to hydrolyze oximino-
cephalosprins but are inhibited by clavulanic acid (Braford, 2001). ESBLs have been
reported in different species of the Enterobacteriaceae particularly in E. coli and
Kelbsiella pneumoniae. They are also described in other non-fermentative Gram
negative bacteria, for example in Acinetbacter baumanni and Pseudomonas
aeruginosa (Falagas & Karageorgopoulos, 2009).

22
Table 1. Summary of β-lactamase classification based on Bush’s new scheme (Bush et al., 2010).
Ambler
class
Bush-Jacoby
scheme
Active site Functional characteristics Inhibited by
Clavulanic acid
Representative enzyme
families
A 2a,2b,2be,2br,2b
er,2c,2ce
Serine Penicillinase,cephalosporinases and
carbapenemases
Yes TEM,SHV,CTX-M,VEB
B 3a,3b Metallo ion Broad-spectrum carbapenemases
inhibited by EDTA
No VIM,IMP,IND
C I,Ie Serine Cephalosporinases No CMY. E.coli AmpC, FOX
D 2d,2de,2df serine Oxacillinases,cephalosporinases and
carbapenemases
Yes OXA

23
1.7.2 Origins of ESBLs
ESBLs are originally derived from TEM or SHV enzymes (Falagas &
Karageorgopoulos, 2009; Heffron et al., 1975; Naas & Nordmann, 1999; Tzouvelekis
& Bonomo, 1999). These historically comprise the largest two families of plasmid–
encoded beta-lactamases that are prevalent in resistant bacteria of human origin,
mainly in K. pneumoniae and E. coli (Li et al., 2007). The first ESBL-producing strain
was reported in Germany in 1983 when strains of Klebsiella pneumoniae were found
to exhibit resistance to cefotaxime and ceftazide, mediated by SHV-1 (Knothe et al.,
1983). Two years later in 1984, K. pneumoniae with a similar resistance spectrum
was identified in France and found to contain a variant of the broad spectrum TEM-2
β-lactamase (as reviewed by Cantón et al., 2008). Since then, both enzymes have
become prevalent worldwide and today more than 200 variants have been described
(www.lahey.org). The ability of these enzymes to become prevalent was based on
point of mutations in its amino acid sequences (as reviewed by Cantón et al., 2008).
In the early 1990s, another type of ESBLs known as CTX-M, emerged. The CTX-M
enzymes are able to hydrolyze cefotaxime (CTX) to a greater extent than ceftazidime
(Bradford, 2001). There are many types of beta-lactamases in the family of CTX-M
and it is believed that this family was originally mobilized by the insertion of
chromosomally-encoded β-lactamases from Kluyvera ascorbata (Livermore &
Hawkey, 2005).

24
1.7.2.1 Types of ESBLs
1.7.2.1.1 SHV type
SHV-1 was the first beta-lactam enzyme discovered in K. pneumoniae in Germany.
SHV stands for sulphydyl variable which refers to the biochemical properties of the
enzyme (Tzouvelekis & Bonomo, 1999). SHV family of β-lactamases are believed
to be derived from Klebsiella spp. SHV-1 showed nucleotide sequence homology to
LEN-1, which is a chromosomally encoded β-lactamase found in K. pneumoniae
(Heritage et al., 1999). SHV enzymes belong to the molecular class A of serine β-
lactamases and share extensive functional and structural similarity with TEM β-
lactamases (Bush et al., 2010). The first SHV enzymes identified in E. coli was in
USA in 1993 (Bradford et al., 1995). The gene was carried by a plasmid and
conferred broad spectrum resistance to the second generation cephalosporins. The
SHV β-lactamases accounts for up to 20% of plasmid-mediated ampicillin resistance
in E. coli and K. pneumoniae (Tzouvelekis & Bonomo, 1999). Nowadays, more than
200 of SHV varieties are known (http://www.lahey.org/Studies/webt.asp#SHV, as of
September 2015).
1.7.2.1.2 TEM type
The TEM family of β-lactamases are derivatives of TEM-1 and TEM-2. According to
the Bush-Jacoby-Medeiros classification scheme it belongs to group 2b and class A
(Bush & Jacoby, 2010). TEM-1 was the first enzyme of the TEM family reported in
1965 from an E. coli isolate (Datta & Kontomichalou, 1965). These enzymes are
mostly detected in Gram negative bacteria particularly E. coli and Klebsiella spp.
and are often found on plasmids or transposons (Heffron et al., 1975). In E. coli,
90% of ampicillin resistance is due to the production of TEM-1 enzyme (Cooksey et
al., 1990). TEM-1 is able to deactivate penicillins and first generation cephalosporins,

25
but are not able to hydrolase clavulanic acid or extended spectrum cephalosporins.
TEM-2 differs from TEM-1 by single point mutation in their amino acid sequence
(Bradford, 2001), but this did not change the activity of the enzyme until the first
report of TEM-3 in 1988 by which time the isolates showed extended spectrum beta
lactamase activity (Sougakoff et al., 1988). Since then, over 200 derivatives of TEM
enzymes have been reported (http://www.lahey.org/Studies/temtable.asp, as of
September 2015). .
1.7.2.1.3 OXA type
The OXA type β-lactamase differ from TEM and SHV enzymes as they are
classified to belong to group 2d and class D ( Bush et al., 2010). They were initially
identified in Pseudomonas aeruginosa in Turkey (Paterson & Bonomo, 2005). These
enzymes are characterized by their ability to hydrolyze oxacillin and cloxacillin
(hence the name OXA) and are poorly inhibited by clavulanic acid (Bardfor, 2001).
OXA enzymes are mostly detected in Gram negative bacteria particularly P.
aeruginosa (Bradford, 2010). Unlike TEM and SHV, OXA genes are encoded by
narrow host range of plasmids with different enzyme activities (Naas & Nordmann,
1999). It is believed that the emergence of OXA enzymes coincided with the
introduction of methicillin and fluoxacillin as a treatment therapy for Staphylococcal
infections (Evans & Amyes, 2014). More than 400 of OXA derivative enzymes are
reported and these are widely disseminated in Gram negative bacteria
(http://www.lahey.org/Studies/ as of September 2015).
1.7.2.1.4 CTX-M type
The predominance of TEM, SHV and OXA enzymes has been replaced by the
emergence of another group of ESBLs called CTX-Ms, which have been increasingly
reported over the last two decades (Bonnet, 2004). CTX-M β-lactamases are

26
classified as belonging to class A and functional group 2be (Bush et al., 2010).
These enzymes are not closely related to the SHV and TEM enzymes, in fact they
show only approximately 40% amino acid identity with these commonly detected β-
lactamases (Tzouvelekis et al., 2000).
The first enzyme discovered capable of hydrolyzing cefotaxime but with
sensitivity to ceftazidime, was isolated in Japan in 1986 from E. coli. The enzyme
was detected in a fecal sample obtained from a dog used to study cephalosporin
pharmacokinetics, and was first named as FEC-1(Matsumoto et al., 1988). The first
human isolate with cefotaximase activity was identified in E. coli recovered from an
ear swab sample taken from a 4-month-old child in Germany in 1989; it was named
CTX-M-1 (Bauernfeind et al., 1990). CTX-Ms are able to hydrolyze broad spectrum
beta-lactam antibiotics and they hydrolyze cefotaxime (CTX) more effectively than
ceftazidime, and hence the group acquired its name CTX and M from Munich
(Bradford, 2001). In the same year, cefotaximase activity was identified in
Salmonella Typhimurium from a patient with meningitis, septicemia and enteritis in
Argentina (Bauernfeind et al., 1992). This enzyme had a different isoelectronic point
(PI value) than that found for CTX-M-1. However, comparison of amino acid
sequences showed that it had 84% homology to CTX-M-1 and so it was named
CTX-M-2 (Bauernfeind et al., 1996). Since that time the emergence of CTX-Ms
enzymes have become prevalent worldwide and now more than 172 subtypes are
recognized (http://www.lahey.org/Studies/other.asp#table1, as of September 2015).
CTX-M enzymes have been categorized into five different clusters based on their
differences in amino acid sequence: CTX-M-1, CTX-M-2, CTX-M-8, CTX-M-9 and
CTX-M-25 (Smet et al., 2010). Isolates producing these enzymes are mostly Gram
negative bacilli including E. coli, Klebsiella spp, Shigella spp, Citrobacter spp,

27
Acinetobacter spp, Serrtia marcescens, Enterobacter spp, and Sallmonella spp
(Shibata et al., 2006; Fujita et al., 2011).
The spread of CTX-M genes is largely due to their dissemination by
conjugative plasmids (Rossolini et al., 2008). The plasmids belong to different
incompatibility types including IncI1, IncF, IncFII and IncA/C, and range in size from
between 7 and 160 kb (Novais et al., 2012 ; Coque et al., 2008; Accogli et al.,
2013). Broad host range plasmids such as IncI1,IncN and IncL/M are also known to
carry additional genes conferring resistance to tetracycline, aminoglycosides and
fluroquinolones (Bonnet, 2004). Thus, multi-drug resistant organisms have become
widespread in nature.
Certain types of CTX-Ms enzymes such as CTX-M-9, CTX-M-14 and CTX-M-
15 are reported to be associated with plasmids belonging to certain Inc types. For
example, CTX-M-15 has been linked with incompatibility group IncI1 and IncFII
plasmids in E. coli strains isolated from different sources in human and animals
(Smet et al., 2010).
As well as plasmids, mobile genetic elements such as transposons and
insertion sequences (IS), play a crucial role in the dissemination of the CTX-M allele.
IS and transposons are pieces of DNA that are able to move between and around
the bacterial chromosome using the transposon enzyme (Frost et al., 2005). One
such factor has been identified upstream of the CTX-M genes and is associated with
their mobilization (Cantón et al., 2012). ISEcp1, which was the first identified IS, is
widely distributed and usually located 24 - 266 bp upstream of the blaCTX-M gene. It
provides a high level expression promoter for the downstream located CTX-M genes
(Zhao & Hu, 2012). Other insertion sequences like IScR and IS10, have mostly been

28
detected in strains containing CTX-M-2, CTX-M-9 and CTX-M-8 subtypes,
respectively (Cantón et al., 2012)(Figure 3).
Figure 3. Insertion sequences (IS) involved in the mobilization and expression of
blaCTX-M genes.
Insertion sequence (IS) surrounding blaCTX-M genes within different CTX-M groups (CTX-M-1,
CTX-M-2, CTX-M-9 ,and CTX-M-25). (Adapted from Cantón et al., 2012).

29
1.7.3 Epidemiology of ESBLs
Beta lactam-CTX-Ms are now ubiquitous and have been reported in isolates
recovered from many sources, including humans, animals, food and sewage
(Livermore & Hawkey, 2005). The rise of bla-CTX-M within hospitals may not be
linked simply to the spread of resistant bacteria but could also be due to acquisition
of resistant organisms from the wider community (Cantón & Coque, 2006).
The prevalence of CTX-Ms among clinical isolates varies from country to
country and from hospital to hospital (Figure 4). As illustrated in Figure 4, resistance
mediated by CTX-M alleles is found worldwide and has now reached a high level
(Hawkey & Jones, 2009). The level of ESBL-producing E.coli strains in Asian
countries ranges between less than 10% in Australia and Japan to more than 30% in
Singapore and China. CTX-M-15 is widely prevalent across the world and
predominates in the UK over CTX-M-14.
Figure 4. Graph showing the distribution of CTX-M types and their relative proportions in each area.
Adapted from Hawkey and Jones (2009).

30
In USA, in a sample of more than 5000 isolates from 72 US hospitals
collected in 2012, the highest rate of ESBLs was found in K. pneumoniae (16%),
followed by E. coli (12%), K. oxytoca (10%) and Proteus mirabilis (5%) (Castanheira
et al., 2014). In this study CTX-M belonging to CTX-M group1, 8, 9, 25 and in
particular group 15, were the most common ESBL enzymes identified. In Europe,
during the last four years (2010-2013) the level of resistance to third cephalosporins
has increased significantly for E. coli, mostly in the south and east countries (Figure
5). Closer examination of clinical isolates in the UK revealed that 75 % of ESBL-
positive isolates were associated with the production of CTX-M enzymes, of which
CTX-M group1 and CTX-M group 9 predominated in E.coli and CTX-M-9 in
K.pneumoniae (Enoch et al., 2012).
In northern European countries, several studies also report high levels of
ESBL-producing strains. In Denmark, CTX-M-15 and 9 predominated among E.coli
isolates (Kjerulf et al., 2008). A Norweigian study found that CTX-M was the most
common ESBL enzyme present in clinical E.coli isolates with reduced susceptibility
to oxyimino-cephalosporins. Nearly 90% of E. coli isolates examined carried the
CTX-M allele, of which CTX-M-15 and CTX-M-9 were the most prevalent types
(Tofteland et al., 2007). In a Swedish study, CTX-M-15 was found to be the
dominant resistance gene and was present in 58% of ESBL-producing E. coli
isolates between 2007 and 2012 (Brolund et al., 2014).
In southern European countries, the detection of CTX-M producing strains
was more prevalent in E. coli strains. In Spain, CTX-M-9 (27%) and 14 (20%) were
the prominent alleles found in inpatients, outpatients as well as health workers
(Hernández et al., 2005). In Portugal, surveillance study in individual hospitals found
that of 181 E. coli isolates, 66 % ESBL producers of which 90% carried CTX-M-15

31
and 8% carried CTX-M-14 (Mendonça et al., 2007). An Italian study of ESBL
production among Enterobacteriaceae isolated from 10 health centers found that the
CTX-M allele was mostly identified in E. coli isolates, of which CTX-M-15 (60%) and
CTX-M-1 (35%) were prevalent (Mugnaioli et al., 2006).
Figure 5. Proportion of invasive E.coli isolates with resistant to third-generation cephalosporin in Europe.
ECDC Annual Report, 2013 (Adapted from ECDC).
In France, the prevalence of CTX-M ESBLs was reported in different
hospitals. CTX-M enzymes were most common in E. coli isolates and CTX-M-15
(57%) was the most common ESBL type (Lavigne et al., 2007).

32
In European countries, all published studies have confirmed that the
prevalence of ESBL-producing isolates in northern countries is low compared to that
found in eastern countries (Adriana et al., 2012). The prevalence of ESBL-producing
isolates is estimated to be more than 10% in Hungary, Poland, Russia and Turkey
with K. pneuminae being among the most common ESBL producers and CTX-M-3
being the most wide spread in hospitals (Adriana et al., 2012). This could be due to
the poor implementation of infection control protocols within the hospitals in these
countries, which help eliminate the resistant bacteria.
1.7.4 ESBL in avian pathogenic E.coli (APEC)
APEC isolates with multidrug resistance have now emerged worldwide (Overdevest
et al., 2011; Zhao et al., 2005; Jakobsen et al., 2010). Avian ESBL–producing E. coli
isolates have been increasingly reported worldwide. Poultry to human dissemination
of resistant bacteria either via direct contact or via the food products, has been
reported (Leverstein-van Hall et al., 2011).
Carriage of multidrug resistance by both pathogenic and non-pathogenic E.
coli isolates has been reported in poultry (van den Bogaard et al,. 2002 ; Costa et al.,
2009). Lambie et al., (2000) found that approximately 50% of E. coli isolated from
diseased birds were resistant to 9 of 11 selected drugs, including aminoglycoside, β-
lactam and sulfamethoxazole-trimethoprim. In another study, Zhao et al. (2005)
reported that multidrug resistance in APEC included resistance to cephalothin,
ampicillin, amoxicillin/clavulanic acid, cefoxitin, tetracycline, nalidixic acid,
sulfamethoxazole, streptomycin, and gentamicin, and mostly occurred in isolates
belonging to the O78, O15 and O53 serotypes.
The carriage of resistance in APEC have been mainly reported in isolates
harboring resistant plasmids (Zhao et al., 2005; Fricke et al., 2009; Platell et al.,

33
2011). The plasmids belong to different replicon groups including IncX, IncN, IncFI,
IncFIB and IncI (Carattoli, 2011), and are generally described as large and
conjugative plasmids, which also carry resistance genes to heavy metals (Caudry &
Stanisich, 1979). In poultry, plasmids harbouring the CTX-M genes were found to
belong to a variety of incompatibility groups like A/C, P/F, I1-Ү, F, FIA and K, and the
most common CTX-M types identified were 1, 3,14,15 and 55 (Randall et al., 2010).
Recent studies have detected highly similar ESBL-producing E. coli in human
and chickens (Accogli et al., 2013; Leverstein-van Hall et al., 2011). In the
Netherlands, 35% of human isolates containing ESBL genes were similar to those
found in chickens (Leverstein-van Hall et al., 2011). CTX-M-1 was the most
predominant gene found in this study corresponding to 86 % and 78% of human and
chicken isolates, respectively. It was also noted that 19 % of ESBL genes detected in
humans were carried by plasmids belonging to IncI1 type that were genetically
identical to those found in poultry.
A chinese study examined the patterns of antimicrobial resistance found in
more than 700 isolates of E. coli isolated from chickens between 1970 and 2007 (Li
et al., 2010). This study revealed that the detection rate of narrow spectrum β-
lactamase genes declined from 71% in 1970 to 29% in 2007, while the detection rate
of third generation cephalosporin resistant strains increased to 18% between 2004
and 2007. This corresponded to the period when CTX-M genes became globally
distributed and increased worldwide.
The prevalence of ESBLs in E.coli isolated from poultry in the UK was
examined over a three year period between 2006 and 2009 (Randall et al., 2011).
The study found that CTX-M genes were the main ESBL type present in 55% of
E.coli isolates and the IncI1 plasmid type was the most common carrier of the gene.

34
The main zoonotic risk is likely associated with horizontal transfer of broad-host-
range IncI1 plasmids carrying blaCTX-M from avian E. coli to other zoonotic human
pathogenic Enterobacteriaceae such as Salmonella. In addition, the broad host
range of some strains belonging to certain sequence type complex, such as ST10, is
worrying as this sequence type is found in both humans and healthy poultry
(Bortolaia et al., 2011). However, characterizing plasmid relatedness among 1000 E.
coli isolates of avian, human and poultry meat origin revealed that plasmids
belonging to IncFIB replicon type is the most prevalent followed by IncI1 regardless
of isolate origin (Johnson et al., 2007). Moreover, IncFIB and IncI1 plasmid types
were the most frequent plasmid types found in APEC and retail poultry E. coli
(RPEC) rather than in uropathogenic E. coli (UPEC), human and avian fecal
commensal E. coli. In fact, most virulence and resistance genes found in APEC
particularly the O78 serogroup, are located on IncFIB plasmids such as pAPEC-1
(Mellata et al., 2009).
1.8 Resistant-plasmids and their impact on host bacterium
The importance of plasmid biology was first realized by Ledberg and Tatum in 1952
after identification of sex factor (F), as the transmissible agent mediating conjugation
in E. coli (Johnson and Nolan, 2009). Bacterial plasmids are viewed as self-
replicating pieces of DNA smaller in size than the bacterial chromosome, which
generally do not possess essential genes for bacterial cell growth but contain genes
essential for the plasmid's replication, stability and transfer (Johnson and Nolan,
2009). A number of research studies on plasmids and their properties have now
been carried out in both Gram negative and Gram positive bacteria which has

35
increased understanding of plasmid behavior (reviewed in Garcillán-Barcia et al.,
2011).
Many plasmids contain additional genes that add specific traits to the host bacterium
(Frost et al., 2005). The fitness of bacteria within a specific ecological niche may be
enhanced by acquiring traits that are not found in other competing strains (Hacker
and Carniel, 2001). For example, it has been found that conjugative plasmids like R
plasmids increase the fitness of newly transformed cells, even when acquired by
different species (Dionisio et al., 2005). Notable fitness advantages have been
reported. For example, the R1 plasmid which belongs to the IncFII group, carries
genes conferring resistance to six antibiotics. Carriage of this plasmid significantly
enhanced the fitness after 420 generations of resistant strains compared to the
plasmid-free ancestral cells. To understand how evolved bacteria gain an advantage
after propagation with the naïve plasmid for several hundred generations, Lenski et
al.( 1994) examined fitness by deleting specific resistance genes from the plasmid.
Using this approach, the authors showed that the tetracycline resistance gene
increased the fitness of plasmid carriage in the evolved hosts. Another study also
reported that fitness advantages were enhanced by apramycin resistance wild-type
plasmids from non-pathogenic E. coli to new host suggesting that the plasmids may
have evolved in these commensal hosts (Yates et al., 2006).
The impact of the plasmids containing resistance genes and whether they
enhance or are a burden to the bacterium in vivo has been also examined in strains
of E. coli harboring plasmids confering resistance to fluroquinolones (Michon et al.,
2011). The authors found out that plasmids carrying qnrA3 genes enhanced bacterial
fitness. This would suggest that the acquisition of resistance genes may enhance E.
coli fitness even in environments where exposure to antibiotics are absent.

36
Plasmids of different Inc groups including IncN (pVE46, R46 and N3) and IncP (RP1
and PUB307) on different E. coli host strains showed variable results in fitness
impact in vitro and in vivo experiments. Derivatives of these plasmids carry
expressed and partially silent resistance genes have been recently investigated by
Humphrey et al. (2012). These plasmids contain genes blaoxa-2, sul1, aadA1 and tet
(A) in the IncP groups or blaTEM-2, sul1, aadA1, tet(A) and aphA in the IncN group that
confer resistance to first generation of cephalosporins, tetracyclines and other
antimicrobial agents. In their study it was reported that PUB307 conferred a slight
fitness cost compared to Rp1 in in vitro experiments, but in vivo neither plasmid
showed an effect on bacterial colonization of the pig gut compared to the plasmid-
free strains. Similar results were obtained with R46, however N3 which belongs to
the same group, showed a fitness advantage in both laboratory assays and in
colonization of the pig gut. The contrasting results for R46 and N3, which belong to
the same Inc group and are of approximately the same size, could be related to the
effect of extra genes that carried by the two plasmids. Although the researchers have
highlighted this may explain this difference, they did not mention that the difference
in fitness cost could be the result of R46 harboring a beta lactamase gene (blaoxa-2)
whereas N3 does not.
Plasmids contribute significantly to the pathogenesis of APEC O78. Strain
x7122 has been used as a model APEC strain for the O78 serogroup (Mellata et al.,
2012 ; Gao et al., 2012 ; Provence & Curtiss, 1994). A study carried by Mellata et al.,
(2010) found that curing x7122 of its’ three major plasmids attenuated the virulence
of the strain in chickens. Thus, the fitness impact associated with large plasmids
harbored by APEC has been generally based on plasmids that have been previously
characterized and annotated (Mellata et al., 2009).

37
IncI1 plasmids were recently observed in isolates of pathogenic E. coli and
Salmonella spp. from poultry and human origin and were found to be associated with
ESBL genes particularly the CTX-M-1 allele (Cloeckaert et al., 2010). However, the
positive or negative impact of plasmids carrying the CTX-M β-lactamase in APEC
has not been studied in detail. This is a significant gap in knowledge given that these
plasmids are often associated with ExPEC strains of human origin. Despite the
extensive molecular characterization in ESBL-producing isolates around the world,
few studies have focused on their ‘cost’ to the host bacterium and/or their role in the
virulence of avian pathogenic E. coli isolates.
1.9 Project aims and hypothesis
The ESBL family of β-lactamases confers resistance to most β-lactams and are often
carried on large promiscuous plasmids, which have become increasingly prevalent
within animal and human bacterial isolates. However, there is a paucity of
information regarding the ‘cost’ of ESBL plasmid carriage on the host bacterium,
usually an E. coli isolate. Thus, the overall aim of this study was to investigate the
impact of ESBL-containing plasmids on the fitness of avian pathogenic E. coli
(APEC), an important pathogen of poultry and potential zoonotic threat to humans.
Examining this question will enable testing of the underlying hypothesis that in the
absence of antibiotic selection pressure ESBL plasmids confer a burden to the host
bacterium which influences the fitness of the host bacterium.
Main aims of the project:
To genotypically and phenotypically characterise ESBL-producing avian
pathogenic E. coli (APEC) using plasmid profiling, PCR and next generation
sequencing.

38
To determine the transmissibility of the ESBL-producing plasmids to other
avian or laboratory E. coli strains in vitro and ex vivo using a model of the
chicken caeca.
To generate ESBL plasmid transconjugates and produce ESBL plasmid-free
isolates in order to examine the impact of plasmid carriage on host cell
phenotypes including growth and ability to form biofilms.
To determine the metabolic profile of ESBL-producing and non-ESBL-
producing isolates in order to investigate the link between plasmid carriage
and bacterial metabolism.
To assess the impact of ESBL plasmid carriage on APEC interactions with
eukaryotic cells and on their ability to produce an infection in the Greater
Waxmoth larvae (Galleria mellonella) model.

39
Chapter 2: Materials and Methods

40
2. Materials and Methods
2.1 Bacterial strains and routine growth media
Three E. coli isolates obtained from a survey examining the prevalence of ESBLs in
broiler chicken and turkey flocks in the UK were examined in this thesis (Randall et
al., 2011) and one strain non-resistant avian pathogenic E. coli strain was provided
by Professor Roberto La Ragione. The three presumptive ESBL-producing strains
(herein called SAP44, SAP45 and SAP46) were originally selected following growth
on CHROMagar containing 1 µg /L cefotaxime and were presumed to be E. coli. The
fourth isolate, herein called SAP24, a non-ESBL-producing E. coli isolate was
included for comparative analysis. Strains were confirmed as E. coli (see section
2.2.1) and verified where appropriate as ESBL producers (see section 2.2.2) prior to
the start of any experiments. In addition, laboratory E. coli K-12 strain NEB 10-beta
was used as a recipient bacterium in some of the conjugation assays.
All media and media supplements were obtained from Oxoid (Basingstoke, UK)
unless stated otherwise. Media were prepared using reverse osmosis water and
sterilised by autoclaving at 121°C, 15lb in-2 for 15 min. All antibiotics were obtained
from Sigma-Aldrich® (UK). All prepared media was stored at 4°C for a maximum of 2
weeks until required.
For routine bacterial culture, strains were grown in Luria-Bertani (LB) broth or
LB broth solidified with 1.5% bacteriological agar. LB broth was prepared by adding
5 g of tryptone, 2.5 g of yeast extract and 5 g of NaCl to 0.5 L of distilled water and
adjusting to pH 7.0 with 1 N NaOH prior to autoclaving. When needed, LB broth or
LB agar was supplemented with 1 µg/mL cefotaxime in order to provide a selective
media for the ESBL-producing isolates.

41
For long term storage, bacterial isolates were stored in MicrobankTM (Pro-
Lab Diagnostics, UK) vials at -80 oC until required. Strains were routinely grown from
frozen stocks in LB broth or LB agar. Cultures grown on solidified media were
incubated at 37°C for 16 - 18 h whereas liquid cultures were incubated with shaking
at 150- 200 rpm under the same conditions.
For competitive growth assays, strains were grown in Davis minimal broth
(Carlton and Brown 1981), supplemented with 25 mg/L glucose. Davis minimal broth
was prepared by adding 3.5 g of potassium phosphate (diabasic trihydate) (K2HPO4),
1.0 g of potassium phosphate (monobasic anhydrous) (KH2PO4), 0.5 g of ammonium
sulfate (NH4)2 SO4) and 0.25 g of sodium citrate (Na3C6H5O7 (H2O)2) to 500 mL of
distilled water. After autoclaving, 125 µl of 10% glucose, 500µl of 10% magnesium
sulfate (MgSO4) and 500µl of 0.2% Thiamine (vitamin B1) was added.
For bacterial survival assays, bacteria were grown in M9 minimal media,
supplemented with single carbon sources or iron sulfate (FeSO4), as appropriate. M9
minimal media was prepared by adding 3 g of sodium phosphate (Na2HPO4), 1.5 g
of potassium phosphate (Na2PO4), 0.5 g of sodium chloride (NaCl) and 1 g of
ammonium chloride (NH4Cl) to 500ml of water. After autoclaving, 500 µl of 1M
magnesium sulfate (MgSO4), 500 µl of 0.1M calcium chloride (CaCl2) and 5 ml of 10
%( w/v) glucose (or another carbon source) was added.
Viande Levure (VL) media was used in the in vitro chicken gut model in order to
provide nutritional support for the microflora obtained from the chicken caecum
(Nisbet et al., 2000). To 1 L of citrate buffer (prepared by adding 118 ml of 0.1 M
citric acid and 382 ml of 0.1 M sodium citrate and adjusting the pH to 5.8), the
following compounds were added prior to autoclaving: 2.5 g of beef extract, 5 g of
42
yeast extract, 2.5 g of glucose, 10 g of tryptone, 5 g of NaCl and 0.6 g of L-cysteine
HCl.
2.2 Confirmation of species and phenotypic properties of isolates
2.2.1 Species identification using API20E
API20 E test strips, which contain 20 miniaturised biochemical reactions, were used
to verify the species identity of the strains (bioMerieux, UK). The strips were
inoculated with bacterial suspensions according to the manufacturer’s instructions
and incubated at 37oC for 18h. The following day, any colour changes evident in
each well were compared to the index book and the most likely species for each
isolate determined.
2.2.2 Antibiotic susceptibility testing
The avian E. coli isolates were tested for their sensitivity to different antimicrobial
agents in accordance to the guidelines described by the British Society for
Antimicrobial Chemotherapy (BSAC, 2012). Bacterial antimicrobial sensitivity assays
were performed using Iso-sensitet agar (ISA) (Iso-Sensitest™ Agar CM0471, Oxoid),
prepared by 15.5 g of ISA agar to 500 ml of water as stipulated by the manufacturer.
Bacterial suspensions were spread on petri dishes containing ISA agar and when
dry, discs impregnated with different antibiotics (Table 2) were carefully placed on
the surface of the media. Plates were incubated for 18 hr at 37˚C. The following day,
the zone of inhibition around each disc was measured and resistance or sensitivity
determined based on the BSAC guidelines. In these assays, E. coli NCTC 10418,
which is a susceptible strain, was used as a negative control to ensure all discs
contained an active antimicrobial. All antimicrobial discs and chemicals were
obtained from Sigma-Aldrich (UK).

43
Table 2. Antibiotic disc content and accepted zones of inhibition (mm) around E. coli
NCTC10418, a suspectible control strain.
Antimicrobial agents Disc content
(g)
Zone of
inhibition
(mm)
Amikacin 30 24-27
Gentamicin 10 21-27
Ampicillin 10 21-26
Cefotaxime 30 36-45
Cefoxitin 30 28-33
Cefpodoxime 10 29-36
Ceftazidime 30 32-40
Cefotaxime-clavulanic acid 30/10A 39-44
Ceftazidime-clavulanic acid 30/10 31-39
Ciprofloxacin 1 31-40
Nalidixic acid 30 28-36
Tetracycline 10 23-29
Chloramphenicol 10 21-27
Sulphamethoxazole
/Trimethoprim
25 28-36
The susceptible E. coli NCTC10418 control strain was grown in the presence of antibiotic
discs containing the following antibiotic content. Zones of inhibition are provided by the
manufacturer and represent typical values that can be used to indicate the susceptibility or
otherwise of test isolates grown under the same conditions. All plates were incubated at 35-
37˚C in air for 18-20 h.
Footnote: A, two values are given for performing β-lactamase tests and for screening and confirmatory
tests for ESBLs.

44
2.2.3 Phenotypic confirmation of ESBL production
In order to confirm ESBL production in the avian E. coli isolates, the combination
disc diffusion method was performed according to BSAC standards (BASC, 2012).
Discs containing cefotaxime (30 μg) or ceftazidime (30 μg), with or without the β-
lactamase inhibitor, clavulanic acid, were placed on Iso-sensitet agar that had been
spread with bacterial suspensions. Strains were considered ESBL producers when
the zone of inhibition around the disc containing either cefotaxime or ceftazidime and
clavulanic acid, was 5 mm or more than that around either cefotaxime or ceftazidime
alone.
2.3 Genetic characterisation of avian E. coli isolates
The phylogenetic group, O-antigen type and virulence gene content of the avian E.
coli isolates was assessed using various single and multiplex PCR (see below). For
all PCR assays, template DNA was prepared by suspending one bacterial colony in
1 ml of nuclease-free water and subjecting the cell suspension to heating at 95oC for
10 min. Two µl of the resulting cell lysate was added to each PCR reaction. PCR
products were separated by mixing with an appropriate volume of loading dye
(Promega) and loading into 0.7 - 1.2 % (w/v) agarose gels made with 1x TAE (Trise-
Acetate-EDTA) or 1x TBE (Trise-Borate-EDTA) buffer. A 50X stock of TAE buffer
was made as mixing 242g Tris-base, 57.1 mL acetic acid and 100 mL of 0.5M
sodium EDTA and making the solution up to 1 L with water. A 10X TBE stock was
made by mixing 108 g of Tris base, 55 g of boric acid and 40 mL of 20mM EDTA (pH
8.0) and making the solution up to 1 L with water. To stain nucleic acids present in
the gel, 5 µl of RedSafe DNA staining solution (iNtRON biotechnology, Korea) was
added to 100 ml of molten agarose prior to pouring into the gel tray. DNA ladders

45
containing fragments corresponding to 1 kb or 100 bp scaled ladders were used to
estimate the size of any products. Gel electrophoresis was performed at 95V for 90
min in a Model H5 tank (BRL, USA) and an image of the gel was captured under UV
light using GeneFlash (Syngene, UK).
2.3.1 Multiplex PCR for phylogenetic group
Multiplex PCR was used to determine the phylogenetic group of each isolate as
previously described (Clermont et al., 2000). Phylogenetic group classification was
based on the combination of these genes: group A (chuA−, TSPE4.C2−, yjaA+),
group B1 (chuA−, TSPE4.C2+,yjaA−), group B2 (chuA+, TSPE4.C2−/+, yjaA+) and
group D (chuA+,TSPE4.C2−/+, yjaA−). E. coli negative for all products were
assigned to group A0 (Kemmett et al., 2014).
The sequences of the primers and the expected amplicon sizes for each
reaction are listed in Table 3 . PCR amplification reactions were performed in a total
volume of 25 µl, made up of 12.5 µl of 2X Qiagen Multiplex PCR Master Mix (Qiagen
GmbH, Hilden, Germany), 0.5 µl of 10 µM primer solution (final concentration 0.2
µM) and 2 µl of DNA template. The cycling parameters were as follows: an initial
denaturation at 95°C for 15 min; followed by 30 cycles of 94°C for 30 s, 62°C for 90
s, and 72°C for 60 s; and with a final extension at 72°C for 10 min. The amplified
PCR products were subjected to electrophoresis in a 1.5% agarose gel in 1X TAE
buffer. Positive control strains were available in-house (from Elie Salim, personal
communication) and nuclease-free water was used as a negative control.

46
Table 3. Primers and amplicon sizes used in phylogenetic typing.
Primers name Primer sequence Size
ChuA
F- GACGAACCAACGGTCAGGAT
279 R- GCCGCCAGTACCAAAGACA
YjaA
F- TGAAGTGTCAGGAGACGCTG
211 R- ATGGAGAATGCGTTCCTCAAC
TspE4C2
F- GAGTAATGTCGGGGCATTCA
152 R- CGCGCCAACAAAGTATTACG
Taken from Clermont et al. (2000).
2.3.2 PCR-based O-antigen typing of avian E.coli isolates
To further characterise the isolates, O-antigen typing was performed by PCR as
previously described (Clermont et al., 2011). The primer sequences of all available
O-antigen alleles and the expected amplicon sizes are given in Table 4. Single PCR
amplification reactions were performed in a total volume of 25 µl, made up of 12.5 µl
of 2X Qiagen Multiplex PCR Master Mix (Qiagen GmbH, Hilden, Germany), 0.5 µl of
10 µM primer solution (final concentration 0.2 µM) and 2 µl of DNA template. The
cycling parameters were as follows: an initial denaturation at 95°C for 15 min;
followed by 30 cycles of 94°C for 30 s, 62°C for 90 s, and 72°C for 60 s; and with a
final extension at 72°C for 10 min. The amplified PCR products were subjected to
electrophoresis in a 1.5% agarose gel in 1X TAE buffer.

47
Table 4 Primers and amplicon sizes used for O-antigen typing.
Primer
designation
Primer sequence Target Size of PCR
product (bp)
gndbis.f 5’-ATACCGACGACGCCGATCTG -3’
rfbO1.r 5’-CCAGAAATACACTTGGAGAC-3’ rfbO1 189
rfbO2.r 5’-GTGACTATTTCGTTACAAGC-3’ rfbO2 274
rfbO4.r 5’-AGGGGCCATTTGACCCACTC-3’ rfbO4 193
rfbO6a.r 5’-AAATGAGCGCCCACCATTAC-3’ rfbO6 584
rfbO7.r 5’- CGAAGATCATCCACGATCCG -3’ rfbO7 722
rfbO8a.r 5’-GAACAATATTGTAAGGTCGCC-3’ rfbO8a 227
rfbO15.r 5’-TGATAATGACCAACTCGACG-3’ rfbO15 536
rfbO16.r 5’-GGATCATTTATGCTGGTACG-3’ rfbO16 450
rfbO17.r 5’-CGGTGTTAAAGGTGCTGCTA-3’ rfbO17 302
rfbO18.r 5’-GAAGATGGCTATAATGGTTG-3’ rfbO18 360
rfbO21.r 5’-CAGTAAGAGCTCTTGCTAAG-3’ rfbO21 250
rfbO25a.r 5’-GAGATCCAAAAACAGTTTGTG-3’ rfbO25a 313
rfbO25b.r 5’-TGCTATTCATTATGCGCAGC -3’ rfbO25b 300
rfbO26.r 5’-GTATGAGCAAAATGGTGAGC-3’ rfbO26 329
rfbO45a.r 5’-GCGCAATAAATGGCTGACTG-3’ rfbO45a 312
rfbO45b.r 5’-TGCGAGTAGACTATCTCAAG-3’ rfbO45b 436
rfbO55.r 5’-AATTTAGGTCCGGCAGCAAG -3’ rfbO55 675
rfbO75.r 5’-GTAATAATGCTTGCGAAACC-3’ rfbO75 419
rfbO78.r 5’-GCACTGCCATTGGTATTTACG-3’ rfbO78 464
rfbO81.r 5’-GAGCAGTATATATTACTGGTG-3’ rfbO81 383
rfbO83.r 5’-TTCCTTCACGACAACTAAGG-3’ rfbO83 219
rfbO86.r 5’-CGTTGTTAATAATTCTGAATGCG-3’ rfbO86 361
rfbO88.r 5’-AAGGAAAAACGCTGGGAGAG-3’ rfbO88 494
rfbO103.r 5’-GAACTTGGATGGAAAGCCTG-3’ rfbO103 242
rfbO104.r 5’-TGGCTTAGGATACTTGCAGC-3’ rfbO103 410
rfbO111.r 5’-TTGAGTTCTGAGTGGGAAGG-3’ rfbO111 522
rfbO127.r 5’-ACGTCAATTCATGTGCGACG-3’ rfbO127 554
rfbO128.r 5’-AACTCGGAGAGTTCCCTATG-3’ rfbO128 319
rfbO150.r 5’-TAACGCTAGTGGCAGCAATG-3’ rfbO150 602
rfbO157.r 5’-TACGACAGAGAGTGTCTGAG-3’ rfbO157 672
Taken from Clermont et al. (2011).

48
2.3.3 PCR-based determination of Virulence gene content
While no single virulence gene defining APEC, the presence of several virulence
genes (iss, ibeA,iucD etc.) is widely recognised as confirmation of E. coli belonging
to the APEC pathotype (Köhler & Dobrindt, 2011). Thus, the avian E. coli test
isolates used in this thesis were examined for the presence of 14 common virulence
genes using two separate multiplex PCRs. Table 5 lists the primers and sizes of the
expected amplicons of the five plex and nine plex PCR reactions, respectively. In the
five plex PCR, the presence of the following genes was examined: iroN, ompT, hylF,
iss and iutA. The reaction tube contained 0.3 µl of Taq (Promega), 0.5 µl of each
primer, 1 µl of dNTPs (Promega),2 ul of MgSO4, 5 µl of Taq buffer, 3 µl DNA and
was made up to 25 µl with dH2O. The PCR reaction conditions consisted of a 5 min
denaturation step at 95oC, followed by 35 amplification cycles of 30s at 95oC, 30s at
55oC and 40s at 72oC, with a 7 min elongation step at 72oC. Samples were run on a
3% gel and analysed for amplicon content.
In the nine plex PCR, the presence of the following genes was examined:
astA, irp2, papC, iucD, tsh, vat, cvi/cva, ibeA and sitA. The reaction tube contained
0.3µl of GoTaq, 0.5µl of each primer, 1µl of dNTPs, 2µl of MgCl2, 5µl of GoTaq
buffer, 3µl of DNA and was made up to a 25µl total volume with dH2O. The PCR
reaction conditions consisted of a 5 min denaturation step at 95˚C, followed by 35
amplification cycles of 30s at 95˚C, 30s at 55˚C and 2 min at 72˚C, with a 10 min
elongation step at 72˚C. Samples were electrophoresed on a 2% agarose gel and
analysed for amplicon content.
.

49
Table 5. Primers used for the detection of virulence genes in APEC.
Gene Forward primer (5’-3’) Reverse primer (5’-3’) size
(bp)
Function
Five plex PCR primers (Johnson et al., 2008)
iroN AATCCGGCAAAGAGACGAACCGCCT GTTCGGGCAACCCCTGCTTTGACTTT 553 Siderophore receptor
ompT TCATCCCGGAAGCCTCCCTCACTACTAT TAGCGTTTGCTGCACTGGCTTCTGATAC 496 Outer membrane protein
hlyF GGCCACAGTCGTTTAGGGTGCTTACC GGCGGTTTAGGCATTCCGATACTCAG 450 Hemolysin
iss CAGCAACCCGAACCACTTGATG AGCATTGCCAGAGCGGCAGAA 323 Serum survival
iutA GGCTGGACATCATGGGAACTGG CGTCGGGAACGGGTAGAATCG 302 Siderophore receptor
Nine plex PCR primers (Arabi et al., 2013; Momtaz et al., 2013; Zhao et al., 2009 ; wers et al., 2007 ; Schouler et al., 2012 ; Kwon et al., 2008)
astA TGCCATCAACACAGTATATCC TCAGGTCGCGAGTGACGGC 116 Toxin
irp2 AAGGATTCGCTGTTACCGGAC AACTCCTGATACAGGTGGC 413 Iron acquisition
papC TGATATCACGCAGTCAGTAGC CCGGCCATATTCACATAA 501 Adhesin
iucD ACAAAAAGTTCTATCGCTTCC CCTGATCCAGATGATGCTC 714 Iron acquisition
tsh ACTATTCTCTGCAGGAAGTC CTTCCGATGTTCTGAACGT 824 Adhesin
vat TCCTGGGACATAATGGTCAG GTGTCAGAACGGAATTGT 981 Toxin
cvi/cva TGGTAGAATGTGCCAGAGCAAG GAGCTGTTTGTAGCGAAGCC 1181 Colicin V operon
ibeA AGGCAGGTGTGCGCCGCGTAC TGGTGCTCCGGCAAACCATGC 171 Invasion
sitA AGGGGGCACAACTGATTCTCG TACCGGGCCGTTTTCTGTGC 608 Binding protein

50
2.3.4 PCR-based identification of ESBL and CTX-M enzyme type
PCR was used to identify the type of ESBL present in the ESBL-producing avian E.
coli isolates. The presence of blaSHV, blaTEM, blaCTX-M, and blaOXA-type resistant genes
was assessed using a previously published multiplex PCR assay (Fang et al., 2008).
The primer sequences and the expected amplicon size for each gene are listed in
Table 6. PCR amplification reactions were performed in a total volume of 25 µl, made
up of 12.5 µl of 2X Qiagen Multiplex PCR Master Mix (Qiagen GmbH, Hilden,
Germany), 0.5 µl of 10 µM primer solution (final concentration 0.2 µM) and 2 µl of DNA
template. The cycling parameters were as follows: an initial denaturation at 95°C for
15 min; followed by 30 cycles of 94°C for 30 s, 62°C for 90 s, and 72°C for 60 s; and
with a final extension at 72°C for 10 min. The amplified PCR products were subjected
to electrophoresis in a 1.5% agarose gel in 1X TAE buffer. A pathogenic E. coli strain
known to be positive for the 4 tested genes was included as a positive control
(available from Elie Salim, personal communication).
Table 6 Primers and amplicon sizes used for the detection of different β-
lactamase genes by multiplex PCR. Taken from Fang et al. (2008).
Primers and Amplicon sizes
Gene Primer sequence Size bp
SHV blaSHV-F CTT TAT CGG CCC TCA CTC AA
blaSHV-R AGG TGC TCA TCA TGG GAA AG
237
TEM blaTEM-F CGC CGC ATA CAC TAT TCT CAG AAT GA
blaTEM-R ACGCTCACC GGCTCC AGA TTT AT
445
CTX blaCTX-M-F ATG TGC AGY ACC AGT AAR GTK ATG GC
blaCTX-M-R TGG GTR AAR TAR GTS ACC AGA AYC AGC GG
593
OXA blaOXA-F ACA CAA TAC ATA TCA ACT TCG C
blaOXA-R AGT GTG TTT AGA ATG GTG ATC
813

51
Strains that were positive for the presence of the CTX-M genes were subject to further
characterisation to identify the specific CTX-M group type by multiplex PCR (Woodford
et al., 2005). The PCR assay distinguishes between CTX-M genes belonging to the 5
CTX-M groups: group 1, 2, 8, 9 and 26. The primers and sizes of the expected
amplicon products for each group are listed in Table 7.
Table 7 Primers and amplicon sizes of different CTX-M groups using a
multiplex PCR. Taken from Woodford et al. (2005).
Primer name
Primer Sequence (5'-3')
Product size
CTX-M group 1
F- AAAAATCACTGCGCCAGTTC
415-bp R- AGCTTATTCATCGCCACGTT
CTX-M group 2
F- CGACGCTACCCCTGCTAT T
552-bp R- CCAGCGTCAGATTTT TCAGG
CTX-M group 9
F- CAAAGAGAGTGCAACGGATG
205-bp R- ATTGGAAAGCGTTCATCACC
CTX-M group 26 – F F- GCACGATGACATTCGGG 327-bp
CTX-M group 8/26 – R R- AACCCACGATGTGGGTAGC 327-bp or 666-bp
CTX-M group 8 F- TCGCGTTAAGCGGATGATGC 666-bp
2.4 Characterisation of plasmid content of avian E.coli isolates
2.4.1 Plasmid profile of avian E.coli isolates
In order to determine the plasmid content of the avian E. coli isolates, plasmid DNA
was extracted from broth cultures and analysed by gel electrophoresis. Plasmids in
the different bacterial strains was prepared by the method of Kado and Liu (Kado &
LIU, 1981). The method uses the molecular properties of the plasmid DNA to separate
it from chromosomal DNA. As the covalently closed circular DNA, which is released
from the bacterial cells under conditions where the bacterial genome is denatured by
using alkaline sodium dodecyl sulphate (pH 12.6) at an elevated temperature.
Isolates were grown with shaking at 37˚C for approximately 18 h in 3 ml of LB broth.
The following day, broth cultures were centrifuged at 13,000 rpm for 5 minutes. The

52
supernatants were discarded and the cell pellets re-suspended in 20 µl of suspension
buffer (50 mM Tris-HCl, 1 mM EDTA, pH 8.0). To lyse the cells, 150 µl of lysis buffer
(3% SDS, 50 mM Tris, pH 12.5) was added to the suspension and the resultant
solution incubated for 30 minutes at 55˚C. After incubation, 150 µl of phenol-
chloroform-isoamyl (25:24:1) was added to denature proteins and inactivate RNAases.
The suspension was then centrifuged at 13,000 rpm for 10 minutes and the upper
aqueous phase containing the plasmid DNA, transferred into fresh microtube for
analysis by gel electrophoresis. Plasmid DNA (35 µl) was loaded together with 7 µl of
loading dye into an 0.8% agarose gel, to which Redsafe stain had been added. The
gel was electrophoresed at 95 V for 1 hour and the banding pattern visualised under
the Ultra-Violet transilluminator system. E .coli 39R strain was used a reference strain
in this method as it contains several plasmids of known sizes. The E.coli 39R strain
was obtained from Animal and Plant Health Agency (APHA, Weybridge, UK).
2.4.2 Plasmid DNA extraction, sequencing and annotation
Plasmid DNA for sequencing was extracted from the avian E. coli isolates using the
large-construct Plasmid DNA extraction kit (Qiagen, location) according to the
manufacturer’s instructions. Plasmid DNA was assessed for quantity and purity based
on the A260/A280 ratio using a NanoDrop (Thermo scientific, UK). Purified plasmid DNA
was sent to the Animal and Plant Health Agency (APHA, Weybridge, UK) for next
generation sequencing using an Illumina sequencer. Illumina sequencing raw data
was assembled de novo using sequence analysis software such as VELVET (version
1.2.10) or CLC Main Workbench (version 7.5.1). The quality of the assembled
sequence data was examined using VELVET and FastQ software. The generated
contigs were ordered by aligning them against a reference fully-sequenced plasmid,
pC49-108 (accession no: KJ484638) and annotated using CLC Main Workbench

53
(version 7.5.1). To close the gaps in plasmid sequence following alignment, PCR
primers were designed using Primer3 software (http://simgene.com/Primer3) (Table 8)
and PCR reactions performed using standard reaction conditions. The PCR products
were sent to Beckman Coulter Genomics, UK for PCR primer walk sequencing. The
new sequence data was then inserted in to fill the gaps in the plasmid DNA backbone.
The newly closed plasmid DNA backbone was subsequently aligned against two
reference plasmids pC49-108 (accession no: KJ484638) and R64 (accession no:
AP005147) using the Artemis comparison Tool (Sanger, UK). For the pFIB44 plasmid,
the reference pAPEC-1 plasmid DNA (accession no: CP000836) was used for
comparative analysis.
Table 8 Primers used to close the gap in Inc1I and IncFIB plasmids
Plasmids Forward primer (5’-3’) Reverse primer (5’-3’)
pSAP44 (IncI plasmid) ACCTTTGATGGTGGCGTAAG
GGCTGAAAATCACCACCACT
pFIB44 (IncFIB plasmid) TCCATTCCTGGTCTACTGCC TACCAGAAATGCGAAGACCC

54
2.5 Whole genome sequencing, assembly, annotation and analysis
The genome sequences of SAP44 and SAP24 strains were selected for comparison
because both strains belonged to the same phylogenetic and O-antigen group, but
differed in their ESBL status. Moreover, strains within this grouping (CP004009; O78)
represent a major cause of colisepticemia, an invasive infection caused by APEC
(Schouler et al., 2012). It was postulated that genomic comparisons could provide
insights into whether ESBL plasmid carriage influenced host genome structure. In this
case, SAP44 is an ESBL-producing avian E. coli while SAP24 is the naïve, non-ESBL-
producing avian E. coli belonging to the same serogroup.
For genomic sequencing, the ArchivePure DNA Purification kit (5PRIM, UK)
was used to extract and purify genomic DNA from the avian E. coli isolates according
to the manufacturer’s instructions. Following extraction, DNA quantity and purity (ratio
A260/A280 nm) were determined using a NanoDrop (Thermo scientific, UK). Genomic
DNA was sequenced by next generation sequencing by the Animal Health Trust (AHT,
location) using an Illumina sequencer. Illumina sequencing raw data was de novo
assembled using VELVET version (1.2.10). The quality of the sequence reads was
assessed using FastQC software (version 0.10.1). A preliminary annotation of each
genome was generated using the automated annotation software RAST(Aziz et al.,
2008). Phage-associated gene clusters within the genomic scaffolds were initially
identified using the PHASTserver(Zhou et al., 2011). Genomic scaffolds with positive
PHAST hits were further verified to be phage-associated in the RAST annotation
output. Single nucleotide polymorphisms (SNP) was examined using snpTree 1.1, a
web-based on-line server for SNP analysis (Leekitcharoenphon et al., 2012). Multi
locus sequence typing (MLST) was performed in order to determine the clonality of the
strains using the free access server provided by the University of Warwick

55
(http://mlst.warwick.ac.uk/mlst/). IslandViewer software (Dhillon, 2015) was used to
identify putative genomic islands (GIs). IslandViewer is a tool server that integrates
three different genomic island prediction methods: IslandPick, IslandPath-DIMOB, and
SIGI-HMM. Comparative analysis of the core scaffolds of each whole genome
sequence was performed using Mauve software (version 2.3.1).
The genomes of APEC O78 (CP004009), APECO1 (PC000468), APEC O2
(PC005930) and Uropathogenic E. coli (UPEC O6, AE014075.1) obtained from the
NCBI GenBank database were analysed alongside the genomic data of SAP44 and
SAP24. These genome sequences were included in this analysis as out-groups to
confirm the validity of the comparison methods used in this study.
2.6 Generation of ESBL-producing transformants and cured derivatives of avian E.coli
isolates.
In order to study the impact of ESBL plasmid carriage on the bacteria, two sets of
derivatives were obtained. First, the ESBL plasmid was transferred to naïve non-
ESBL-producing E. coli isolates. Second, the ESBL plasmid was removed from the
original ESBL-producing isolates to obtain cured (or plasmid-free) derivatives.
Serendipitously during this process, derivatives that had lost one or both of the large
plasmids present in SAP44 were obtained (see section 2.6.2).
2.6.1 New ESBL-producing derivatives
ESBL plasmids were transferred to naïve, non-ESBL-producing laboratory and avian
E. coli isolates using electroporation or conjugation, respectively. Electroporation was
used to transfer the plasmid to the laboratory E. coli NEB 10-beta strain (herein
referred to as SAP59) (see below). Once these new ESBL-producing E. coli K12
derivatives were obtained, the strains were used to move the ESBL plasmid via

56
conjugation to a naïve non-ESBL-producing avian E. coli isolate (SAP24). Plasmids
from each of the native ESBL-producing APEC isolates (SAP44, SAP45 and SAP46)
were subject to these manipulations.
2.6.1.1 Electrocompetent cells preparation
NEB 10 - beta E. coli electrocompetent cells were prepared as described by Wu et al.,
(2010). Bacterial cells were streaked out onto LB agar and grown for 18 h at 37oC. A
single colony was inoculated into 10 ml of LB broth and the culture incubated for 18 h
at 37 oC in a shaking incubator. Two and half millilitre of bacterial culture was then
transferred to 500 ml of LB medium and incubated at 37ºC with vigorous shaking at
300 rpm till the cell density reached an OD between 0.5 – 0.7 at 600nm
(approximately 4 hours). The culture flask was then chilled in ice for 30 min. Then, the
cells were collected by centrifugation and subjected to 15 ml of 10% ice-cold glycerol
in order to wash the cells free of salts. Washed cells were resuspended in 10% ice-
cold glycerol and left on ice for 10 min before pipetting 100 ul aliquot into each
cryovial. The cell aliquots were either directly applied for electroporation of plasmid
DNA or immediately transferred to the -80 ˚C freezer.
2.6.1.2 Electrotransformation of E.coli NEB 10-beta (SAP59)
The electroporation protocol was performed as follows: previously prepared
electrocompetent cells were placed on the ice for about 10 minutes to thaw. The cells
were mixed gently prior to 25 µl being transferred to a chilled microcentrifuge tube. To
the cells, 1 µl of plasmid DNA was added. The cells/plasmid DNA mix was transferred
into a chilled 1 mm electroporation cuvette. Electroporation was carried out at the
following settings: 2.kV, 200 ῼ and 25 µF. The typical time constant was 4.8 to 5.1

57
milliseconds using a Bio-Rad Gene Pulser Electroporator (Bio-Rad, USA).
Immediately after electroporation, 975 µl of SOC media (0.5% Yeast Extract, 2%
Tryptone, 10 mM NaCl, 2.5 mM KCl, 10 mM MgCl2, 10 mM MgSO4, 20 mM Glucose)
was added and the entire contents of the cuvette transferred to a 15 ml falcon tube.
The cells were incubated with gentle shaking for 1h at 37˚C. As a negative control, 1
µl of nuclease-free water was used instead of plasmid DNA. The cells were then
diluted and100-200 µl spread on a pre-warmed LB plates containing 1ug/ml of
cefotaxime to select for the transformants that had taken up the plasmid. Putative
transformants were screened using the ESBL combination disc test, tested for
amplification of the CTX-M gene by PCR and their plasmid profile was assessed in
order to confirm that they harbored the CTX-M plasmid. Following confirmation of
plasmid transfer, the strains were named SAP56 (contains ESBL plasmid from
SAP44), SAP57 (contains ESBL plasmid from SAP45) and SAP58 (contains ESBL
plasmid from SAP46), respectively.
2.6.1.3 Transfer of ESBL plasmids by conjugation to avian E.coli (SAP24)
Bacterial conjugation was used to transfer the ESBL plasmids from the newly
generated ESBL-producing E. coli K12 derivatives, SAP56, SAP57 and SAP58 (see
above) to the avian E. coli isolate (SAP24). Conjugation was performed by mixing
approximately equal numbers of stationary phase cells of the donor and recipient
strains. Bacteria were grown in 3 mL of LB broth for approximately 18 h prior to
centrifugation and re-suspension in 1 ml of fresh LB broth. Thereafter, 100 µl of the
donor and recipient strain were mixed to give a final volume of 200 µl, which was
spotted onto a nitrocellulose filter disc placed on top of a LB agar plate and incubated
for 4 hours at 37 ˚C.

58
After incubation, the entire filter disc was transferred using sterile forceps to 25 ml of
1X M9 media and placed in a vigourously shaking incubator for 10 minutes to re-
suspend the attached cells. Next, the cell suspension was centrifuged at 4,500 rpm for
10 minutes and the supernatant was discarded. The cell pellet was re-suspended in 1
ml of fresh 1X M9 salts and after gentle pipetting to resuspend the cells, 100 µl was
plated on LB agar plates containing 1µg/ml of cefotaxime and 80 uM/ml of X-gal. X-
gal was added to the selection plates in order to provide a selective marker and
enable discrimination between SAP24 and SAP59 strains. While SAP 24 is able to
cleave X-gal giving rise to blue-coloured colonies on the plate, SAP59 does not
harbour this enzymatic function, and thus grows as white-coloured colonies. As
mentioned above, all putative transconjugants were confirmed for ESBL production,
PCR amplication of the CTX-M allele and plasmid content. Following confirmation of
plasmid transfer, strains were denoted as SAP140, SAP141 and SAP142.
2.6.2 Generation of cured derivatives
Curing the original avian E. coli isolates their ESBL plasmid offers another approach to
experimentally study the contribution of the plasmid to the host bacterium. Curing was
performed using a plasmid curing vector (pIFM27), which is a derivative of pCURE
(Hale et al., 2010) and was developed by Irene Martin (PhD thesis, University of
Surrey). This method avoids using stress or chemical detergents which may have a
mutational effect on chromosomal DNA (Hale et al., 2010). Curing is based on using
plasmids with the same incompatibility group and antisense RNA as the target plasmid
so that the curing vector displaces the ESBL plasmid from the cell (see Figure 6).
Plasmid pIFM27 was introduced by electroporation into electro-competent ESBL-
producing APEC cells and putative transformants selected by plating on LB agar

59
containing 50 µg/ml kanamycin. The plates are incubated for 18 h at 37oC. The
following day, putative transformants are checked for loss of the target plasmid by
examining kanamycin-resistant colonies for their plasmid profile and gene content (by
PCR). In order to remove the curing vector plasmid, transformants were grown for 18
h with shaking at 37˚C in 5 ml of LB broth containing 50 µg/ml kanamycin. The
bacterial cultures were then serially diluted in PBS to 10-6 and 100 µl of the
appropriate dilution spread on LB agar plates and LB agar plates supplemented with
5% sucrose. Only cells from which the vector plasmid has been removed, will grow on
the sucrose-containing plates. Any colonies will be tested for the presence or absence
of both plasmids by examining their susceptibility to kanamycin and cefotaxime as well
as checking for loss of the CTX-M gene by PCR (summarized in Figure 7).
Figure 6 .plFM 27 curing vector which was used to remove the Inc1I ESBL
plasmid.

60
Figure 7. Summary of the plasmid curing procedure. Taken from (Hale et al., 2010).
2.6.3 Plasmid Inc/rep typing of ESBL plasmids:
The properties of the CTX-M plasmids were further characterized by examining their
origins of replication. SAP59 derivatives (SAP56, SAP57 and SAP58) were selected
for these assays in order to avoid cross-contamination with other plasmids present in
the avian E. coli isolates. Strains were examined for the presence of 18 plasmid
replicons types using five multiplex PCR reactions and three simplex PCR reactions
as previously described (Carattoli et al., 2005). The primers and expected amplicon
sizes following PCR amplification are listed in Table 9. PCR amplification reactions
were performed in a total volume of 25 µl, made up of 12.5 µl of 2X Qiagen Multiplex
PCR Master Mix (Qiagen GmbH, Hilden, Germany), 0.5 µl of 10 µM primer solution
(final concentration 0.2 µM) and 2 µl of DNA template. The cycling parameters were

61
as follows: an initial denaturation at 95°C for 15 min; followed by 30 cycles of 94°C for
30 s, 62°C for 90 s, and 72°C for 60 s; and with a final extension at 72°C for 10 min.
The amplified PCR products were subjected to electrophoresis in a 1.5% agarose gel
in 1X TAE buffer. All E.coli control strains were grown with 50 ug/ml ampicillin except
where stated in the E. coli culture database.

62
Table 9 Primers and amplicon sizes used in PCR-based Inc/rep typing of plasmids.
Inc group Forward primer (5’-3’) Reverse primer (5’-3’) size (bp)
Multiplex PCR (1)
HI1 (multiplex 1) 5’-GGAGCGATGGATTACTTCAGTAC 5’-TGCCGTTTCACCTCGTGAGTA 471
HI2 (multiplex 1) 5’-TTTCTCCTGAGTCACCTGTTAACAC 5’-GGCTCACTACCGTTGTCATCCT 644
I1-Iγ (multiplex 1) 5’-CGAAAGCCGGACGGCAGAA 5’-TCGTCGTTCCGCCAAGTTCGT 139
Multiplex PCR (2)
X (multiplex 2) 5’-AACCTTAGAGGCTATTTAAGTTGCTGAT 5’-TGAGAGTCAATTTTTATCTCATGTTTTAGC 376
L/M (multiplex 2) 5’-GGATGAAAACTATCAGCATCTGAAG 5-CTGCAGGGGCGATTCTTTAGG 702
N (multiplex 2) 5’-GTCTAACGAGCTTACCGAAG 5’-GTTTCAACTCTGCCAAGTTC 242
Multiplex PCR (3)
FIA (multiplex 3) 5’-CCATGCTGGTTCTAGAGAAGGTG 5’-GTATACCTTACTGGCTTCCGCAG 462
FIB (multiplex 3) 5’-GGAGTTCTGACACACGATTTTCTG 5’-CTCCCGTCGCTTCAGGGCATT 402
W (multiplex 3) 5’-CCTAAGAACAACAAAGCCCCCG 5’-GGTGCGCGGCATAGAACCGT 242
Multiplex PCR (4)
Y (multiplex 4) 5’-AATTCAAACAACACTGTGCAGCCTG 5’-GCGAGAATGGACGATTACAAAACTTT 765
P (multiplex 4) 5’-CTATGGCCCTGCAAACGCGCCAGAAA 5’-TCACGCGCCAGGGCGCAGCC 534
FIC (multiplex 4) 5’-GTGAACTGGCAGATGAGGAAGG 5’-TTCTCCTCGTCGCCAAACTAGAT 262
Multiplex PCR (5 )
A/C (multiplex 5) 5’-GAGAACCAAAGACAAAGACCTGGA 5’-ACGACAAACCTGAATTGCCTCCTT 465
T (multiplex 5) 5’-TTGGCCTGTTTGTGCCTAAACCAT 5’-CGTTGATTACACTTAGCTTTGGAC 750
FIIAs(multiplex 5) 5’-CTGTCGTAAGCTGATGGC 5’-CTCTGCCACAAACTTCAGC 270
Simplex PCR
F (simplex) 5’-TGATCGTTTAAGGAATTTTG 5’-GAAGATCAGTCACACCATCC 270
K (simplex) 5’-GCGGTCCGGAAAGCCAGAAAAC 5’-TCTTTCACGAGCCCGCCAAA 160
B/O (simplex) Forward primer same as used for K simplex 5’-TCTGCGTTCCGCCAAGTTCGA 159

63
2.7 Impact of ESBL plasmids on bacterial growth and metabolism
The impact of the ESBL plasmids on the growth and metabolism of avian E. coli was
assessed by comparing the response of wild type isolates to that of the cured
(plasmid-free) derivatives. In addition, the response of some newly-transformed
ESBL-producing derivatives was compared to that of the naïve host strain.
2.7.1 ESBL plasmids and bacterial growth
2.7.1.1 Single strain growth curves:
In order to examine the impact of the avian E. coli plasmids on bacterial growth,
single strain growth experiments were performed in LB broth, a nutrient-rich media.
ESBL-producing and plasmid-free derivatives of E. coli were grown in LB broth with
gentle agitation at 37˚C for 16 hours. The following day, a 100 µl of the culture was
used to inoculate 100 ml of pre-warmed LB broth. Growth was monitored by
measuring the absorbance of the culture solution at 600nm using a
spectrophotometer (Helios Alpha,UK) as well as by enumerating the number of
viable bacteria by serial dilution and plating. Growth curves were typically run over 8
h and samples were analysed every hour. The Miles and Misra technique was used
to accurately quantify the number of viable bacteria present at each time point.
Bacterial suspensions were serially diluted 10-fold using maximum recovery diluent
(MRD). Three 20 μl volumes of the cell suspension at each dilution were pipetted
onto a suitable solidified growth medium. Where spread plates were also used due
to the low numbers of viable bacteria, 0.1 ml of the bacterial suspension was spread
on the surface of the media using a sterile plastic spreader. The growth of each
bacterial strain was performed using at least three biological replicates.

64
2.7.1.2 Competitve growth studies and long term competitive growth assays
Competitive growth experiments, where equal numbers of two differentially marked
strains are grown together in the same medium usually offers a more sensitive way
to identify differences in growth. Pair-wise competition growth experiments were
performed for the naïve avian E. coli isolate (SAP24) and the ESBL-producing
derivative (SAP140) in Davis minimal medium supplemented with 25 mg/ml glucose
(aka DM25) as described previously (Enne et al., 2005). Strains were separately
cultured for approximately 18 h in nutrient broth (NB) and inoculated singly at a
dilution of 1:104 into DM25. The following day, the individual cultures were diluted at
a ratio of 1:100 into fresh DM25 and incubated with shaking for another 24 h at 37˚C.
Following this second period of growth, the absorbance of the cultures was
measured and adjusted such that equal densities of cells were mixed together, in a
1:1 ratio. This mixture was then diluted at 1:100 into a fresh DM25 and incubated
with shaking at 37˚C for 24 h. After 24 h, the culture was then transferred at a
dilution of 1:100 into fresh DM25 and this process was repeated 6 times in total. The
input culture and at each subsequent subculture step, 100 µl samples were plated
out on nutrient agar plates with and without 1µg/ml of cefotaxime. Three independent
repeats of the competitive growth experiments were performed. The fitness impact of
the ESBL plasmid was determined using the following formula as previously
described:
W = In (Rf/Ri) / In (Sf/Si).
Where Ri and Si refer to the number of resistant and susceptible cells at baseline,
and Rf and Sf to the number of resistant and susceptible cells at endpoint of the
study, respectively (Gagneux et al., 2006).

65
A parallel experiment using a streptomycin resistant SAP24 derivative (SAP24Strr)
instead of SAP140 as a recipient, was performed to estimate the rate of ESBL
plasmid transfer during the competitive assay. Such a transfer event could confound
the outcome of the competitive experiments. SAP24Strr was obtained by daily
subculturing SAP24 on nutrient broth (NB) agar containing increasing concentrations
of streptomycin. Cultures from the competive growth experiment were plated out on
NB agar plates supplemented with 100 µg/ml streptomycin as well as those
supplemented with both 100 µg/ml streptomycin and 1 µg/ml of cefotaxime.
2.7.1.3 Growth under iron limiting conditions
To investigate the impact of ESBL plasmid carriage on APEC growth under iron
limiting conditions, bacteria were cultured in M9 minimal media supplemented with
glucose as the sole carbon source and 1.5 µM of ferric sulphate (FeSO4) as an iron
source. Iron-free media was made by adding the iron chelator, 2,2 dipyridyl (100 µM)
to the media. Bacterial strains were grown in LB broth, with shaking for 18 h at 37 ˚C
and the following day, the OD of the cultures was adjusted to be the same for all
strains. Cultures were centrifuged at 4,500 rpm for 10 minutes, the supernatant
discarded and cell pellet washed 2x with PBS. Washed cells were then diluted 1:100
into 50 ml of M9 minimal media. At time zero, the number of viable bacteria of each
strain was determined using the Miles and Misra technique, and thereafter the
bacteria were enumerated every 24 hours for 7 days. All assays were repeated in
triplicate. Depending on the number of strains being compared, data were analyzed
by one-way analysis of variance (ANOVA), followed by Tukey’s multiple-comparison
test (GraphPad Prism software, version 6.0) or using an unpaired, two-tailed student

66
t test. The levels of significance (P values) are reported and values P < 0.05 were
taken to be significant.
2.7.2 ESBL plasmids and bacterial metabolism
2.7.2.1 Phenotypic microarray assays
The metabolic utilization profiles of newly transformed ESBL-producing E. coli strains
were compared to those of the naïve host using Biolog, a phenotypic microarray
consisting of microtiter plates containing single carbon, nitrogen or other nutrient
sources (Bochner, 2009). In these studies, the laboratory (SAP59) and naïve avian
(SAP24) E. coli strains were compared to their respective ESBL plasmid-containing
derivatives (SAP56) and (SAP140), respectively. Biolog plates PM1 to 4 were used
according to the manufacturer’s instructions. All PM plates were inoculated with
bacterial suspensions at 100 µl per well. Suspensions were prepared by picking
bacteria colonies from media plates using a sterile cotton swab and resuspending
the cells in 15 ml of IF-0 fluid (supplied by manufacturer). The turbidity of the solution
was adjusted to 85% transmittance (t) using the Biolog turbidimeter. When needed,
disodium succinate (20mM) and ferric citrate (2uM) were added to the PM3 and PM4
plates, which measures N, P, and S utilization. All plates were incubated for 48 h at
37oC in the Omnilog plate reader (Biolog Inc, USA) and color changes resulting from
reduction of the tetrazolium violet (dyeA) in the wells were recorded automatically
every 15 minutes. Kinetic respiration data were analyzed with Omnilog PM Software.
All strains were tested in triplicate for each PM plate.

67
2.7.2.2 Single strain growth on different carbon sources
To confirm some of the findings obtained in the phenotypic microarray assays (see
above), bacteria were grown in DM25 minimal media supplemented with a single
carbon source. In each case, the final concentration of the carbon source was
adjusted at 10 µg/ml, consistent with that used in the Biolog assays. All selected
strains were cultured with shaking for 18 h in LB broth and inoculated at a dilution of
1:100 into DM25 media. Cultures were incubated with shaking at 37˚C for 24 h.
Changes in the growth of each strain was determined using Miles and Misra to
enumerate the number of viable bacteria at the start (t=0) and at 24 h intervals over
the 6-day experiment. The number of bacteria present were quantified on LB agar, in
the presence and absence of 1 µg/ml cefotaxime. Three replicates of each assay
were performed and the number of cells over time used to calculate the specific
growth rate of each strain. The growth rates, of otherwise isogenic, plasmid-
containing and plasmid-free strains were compared using the unpaired Students t
test.
2.8 Impact of pH on APEC growth and transfer of ESBL plasmids
2.8.1 Acid tolerance assay
To assess if ESBL plasmid carriage modifies the acid tolerance of the host
bacterium, acid tolerance assays were performed as described previously (Mellata et
al., 2012). For these experiments, the optical density of liquid bacterial cultures
grown for 18 h at 37˚C, were adjusted to give OD600 = 1.0 The cell suspension was
centrifuged to pellet the cells and the cells were washed twice with PBS before finally
being diluted 1:1000 in 50 ml of LB, adjusted to pH 2.5 with 1M HCL. The bacterial
cultures were incubated at 37˚C with gentle shaking (50 rpm) and samples removed
68
at 8 h, 24 h and 36 h for enumeration by serial dilution and plating on LB agar plates.
Assays were repeated in three independent experiments and data compared using
oneway ANOVA followed by Tukey’s multiple comparison test.
2.8.2 Plasmid mobility in different pH conditions
Like most E. coli, APEC encounter changes in acidity as they pass through the
chicken intestine. In addition to affecting the survival of the isolates, low pH may alter
the rate of ESBL plasmid transmission to other bacteria thereby promoting the
spread of the resistance determinant. In order to investigate this further, conjugation
experiments were set up to assess the transfer of the ESBL plasmid following
exposure of the bacterium to different pH levels. In these experiments, donor (those
carrying an ESBL plasmid) and recipient (lacking ESBL plasmids) strains were first
grown in a range of pH conditions (pH 4.0, 5.0, 6.0 and 7.0) before being mixed in
equal proportions and conjugation assays performed.
Donor and recipient strains were grown in LB broth for 18 h at 37˚C. Following
growth, cells were washed and diluted in PBS to give a final optical density (OD600nm)
of 0.1. Then 200 µl aliquots of the OD = 0.1 suspension were inoculated into LB
broth, adjusted to the pH mentioned above using 1M HCL or 1M NaOH. After
overnight incubation, the stressed cells were once again washed and diluted with
PBS to a cell density equivalent to OD600nm = 0.1. The donors and recipient strains
were then mixed in equal amounts and 200 µl of the mixture was spotted onto filter
paper, placed on top of LB agar, adjusted to the same pH value. The conjugation
assays were carried out in triplicate in three independent experiments for each pH
condition. As a control, the equivalent non-stressed cells (grown in LB pH 7) were
included. Plasmid transfer rates were calculated as the number of trans-conjugants
per number of recipients.

69
2.8.3 Plasmid mobility in a chicken gut model
While pH-adjusted media provides one way to study APEC behavior in low pH
conditions, a better approach would involve more closely replicating the natural
chicken intestinal environment. For example, the presence of host compounds and
the normal chicken microbiota may have profound effects on APEC growth and
plasmid transmission rates. In vivo studies were beyond the scope of this thesis,
however, attempts were made to develop an in vitro chicken gut model which used
natural chicken microbiota to try and address this question.
To mimic the filling and emptying of the caeca in the bioreactor (Nisbet et al.,
2000) (Figure 8) , a cyclic fed batch model was adopted in which the bioreactor (200
ml Duran) containing 50 ml of inoculum would fill with media at a flow rate of 0.30 ml
per minute to 100 ml and then every 8 hours, 50 ml of the contents would be
pumped out into a collecting Duran from which samples would be taken for pH
testing. PH testing was carried out using a non-bleeding pH-indicator strip (range 0 –
6.0; Merck Millipore). The remaining 50 ml provided a starting inoculum for the
following cycle.
Citrate buffered custom VL media was pumped in to provide nutrition and pH
balance at a pre-determined flow rate of 0.30ml per min. The temperature of the
bioreactor was maintained at 42 ˚C in an incubator. A low motility was induced in the
contents by the use of a small flea and magnetic stirrer set to a low voltage. The flea
was autoclaved inside the bioreactor and the bioreactor was placed atop the stirrer in
the incubator. To ensure an anaerobic environment was maintained the headspace
of the vessel was flushed with nitrogen at a low flow rate. The inoculum was 5 ml of
chicken faecal contents injected directly into the bioreactor via a syringe at the start

70
of the experiment. The faecal contents inoculum constituted of 5 ml faecal content
paste, made from faecal droppings and reagent grade water, and 45ml of VL media
to make a 10% starting inoculum. Samples from the bioreactor were obtained
according to the following sampling protocol: one sample was taken directly from the
starting inoculum (0 h time point); the second at 8h, after the first cycle; the third at
24h, after the completion of the third cycle. Immediately after the 24h sample was
collected, the bioreactor was inoculated with 2 ml of a suspension of the donor strain
(APEC harbouring the ESBL plasmid) and the recipient strain (streptomycin resistant
mutant of SAP24) and a final sample (8h + ) was taken 24 hours after the addition of
the suspension (i.e. after one cycle was completed). The bioreactor was run for a
total of 7-8 days (3, 8 hour cycles), in which every 24 hours the sample was collected
for analysis.

71
Figure 8. Schematic of the chicken gut bioreactor model.
The chicken gut bioreactor model consisted of a bioreaction chamber (200 duran), a collecting chamber (500ml Duran), a reserviour to supply fresh media and a supply of N2 gas to maintain a reduced oxygen atmosphere. Chicken caecal samples were added to 45 mls of VLA media and samples were collected every 8 hours for analysis of the number of donor, recipient and transconjugant cells.
2.9 ESBL plasmids and bacterial virulence
While APEC lack any definitive single virulence factor, the ability of strains to
colonise the host and avoid detection by the immune system are likely to be
important virulence strategies (Pourbakhsh et al., 1997). Thus the impact of the
ESBL plasmid on the ability to strains to form biofilms, adhere to intestinal and
macrophage cells, and multiply in the Galleria mellonella infection model was
examined.

72
2.9.1 Biofilm formation assay
To assess the effect of ESBL plasmid carriage on biofilm formation, the crystal violet
microtitre plate biofilm assay was performed as described previously (Mellata et al.,
2012). Stationary phase cultures of bacteria grown in LB broth were diluted 1:100
into fresh LB broth supplemented with 0.1% glucose. Thereafter, 200 µl aliquots of
each test strain were dispensed into a 96-well microtitre plate. Each strain was
tested in quadruplicate and negative control wells containing uninoculated medium
were also included on each plate. The microtitre plates were sealed with parafilm to
prevent evaporation losses and incubated without shaking at 30 ˚C, 37 ˚C and 42 ˚C
for 5 days. After incubation, the contents of the plates were removed and the plates
were washed twice with copious amounts of sterile double distilled water (ddH2O).
Biofilms formed on the microplates were stained with 200 µl of 1.0 % crystal violet for
30 min, before the plates were washed four times with ddH2O to remove any excess
stain, and air dried for 1 h. After drying, the dye present in adherent cells was
solubilized by adding 200 µl of 30% acetic acid to each well. Finally, the optical
density (OD) of the solution in each well was measured by reading the absorbance
of the solution at 570 nm (OD570nm). All tests were carried out in triplicate, and the
results were averaged.
2.9.2 Adhesion and invasion assays using HD11, THP-1 and Caco-2 cells.
2.9.2.1 Macrophage-like cells
The ability of avian E. coli isolates to adhere and invade chicken or human
macrophage-like cells was assessed using two different cell lines, HD11 and THP-1,
respectively. HD11 cells, a chicken macrophage-like cell line, was obtained from
APHA (Weybridge, UK). HD11 cells were cultured in RPMI1640 medium containing
73
20 mM L-glutamine (Gibco), 2.5% newborn calf serum (Autogen Bioclear), 2.5%
chicken serum (Sigma), 10% tryptose phosphate broth(Sigma), 3% sodium
bicarbonate (Sigma), 0.4% folic acid (Sigma), and 1% of penicillin and streptomycin
(Gibco). Cells were routinely propagated in 75 cm2 flasks (BD falcon). For assays,
HD11 cells were seeded at a density of 2 × 10⁵ cells/ml in 24-well tissue culture
plates and incubated at 37 ˚C for 2 days prior to use.
THP-1 cells, a human monocyte-like cell line (ATCC® TIB-202™), were obtained from
in-house stocks. THP-1 cells were cultured in RPMI 1640 medium supplemented
with 5% 2 mM L-glutamine, 5% penicillin and streptomycin and 10% FBS. Cells were
routinely propagated into 75 cm2 flasks (BD falcon). For assays, THP-1 cells were
seeded at a density of between 1x10⁵ cells/ml to 1x10⁶ cells/ml in 24-well tissue
culture plates. To promote differentiation, cells were centrifuged and re-suspended in
fresh media to a concentration of 2x10⁵ cells per ml and treated with 100 nM Phorbol
12-myristate 13-acetate (PMA) (P8139, Sigma). After treatment with PMA,
immediately 1ml of cell suspension was added per well in a 24-well culture plates,
and cells were incubated at 37 ˚C for 3 days prior to use.
2.9.2.2 Intestinal epithelial cells
In addition to testing the ability of avian E. coli isolates to adhere and invade
macrophages, their interactions with human intestinal epithelial cells was also
examined as entry via the intestine may occur. Caco-2 cells are human colon
adenocarcinoma cells that exhibit similar properties as epithelial cells lining the small
intestine (Natoli et al., 2012). Caco-2 cells were obtained from APHA (Weybridge,
UK) and were routinely grown in Dulbecco’s modified Eagle medium (DMEM)

74
(Invitrogen) supplemented with 10 % (v/v) fetal bovine serum (FBS; Invitrogen) and
1% of penicillin and streptomycin in 95 % air/5 % CO2 at 37 °C. For routine culture,
propagated cells were seeded at approximately 106 cells cm–2 into 75 cm2 flasks (BD
falcon). After 5 days of culture, cells were harvested by treating with 0.25% trypsin
and once detached re-suspending in DMEM containing 10 % FBS. For assays,
Caco-2 cells were seeded into 24-well plates at ~4×10⁵ cells per well. The medium
was changed daily until cells reached a confluent state and thereafter it was changed
every second day.
For the infection assays, bacterial were grown in 20 ml LB broth and
incubated at 37 ˚C on shaking at 225 rpm for 16 h. The cells were then pelleted by
centrifugation at 4000 rpm for 10 minutes at 20˚C. The cells were re-suspended in
PBS (pH 7.2) and the optical density of the cell suspension adjusted to OD540nm =
1.2. Then the cell suspension was further diluted 1:20 in pre-warmed RPMI or
DMEM media supplemented with 200mM L-glutamine and 1% (v/v) non-essential
amino acids (NEAA) (Sigma). One ml of the bacterial solution was added to each
well of the plate, giving an MOI of 100:1, unless stated otherwise. Eukaryotic cells
were washed three times in Hank's balanced salt solution (HBSS)(Sigma) pre-
warmed to 37 ˚C prior to inoculation of the bacterial strains. The highly virulent S.
Typhimurium SL1344 strain was used as a positive control in these studies.
2.9.2.3 Incubation conditions and enumeration of adherent or invasive bacteria:
All infected plates were incubated at 37Co in the presence of 5% of CO2. Bacterial
association assays were incubated for 2 hours, whereas bacterial invasion and
survival assays were performed after 4 and 8 hours, respectively. The gentamicin
protection assay was used to determine the number of cells that had invaded

75
(Edwards & Massey, 2011). Growth media containing 100 µg/ml gentamicin and 1%
NEAA was added to the infected cells in order to kill any extracellular bacteria,
Bacteria that are located inside the host cells are protected from the actions of
gentamycin, and are quantified after removal of the gentamicin-containing media as
described below.
After each time point, microtitre plates were washed three times with HBSS
and 1ml of 1% Triton was then added for 10 min to lyse the host cells and extract the
bacteria. The lysates were serially diluted in PBS (pH 7.2) from 10-1 to 10-4 for
association assays, and from 100 to 10-3 for invasion and survival assays. To
determine the actual inoculum used in the assays, the initial inoculum was also
serially diluted and plated on selective agar plates.
For each tested strain, the assay was carried out at least in triplicate and in 3
independent experiments. Data were analysed using Graphpad Prism (version 6.2,
company and location) and differences between the mean percentage adherence,
invasion or survival determined by one-way ANOVA, followed by Tukey’s multiple
comparison post test.
2.9.3 Galleria mellonella infection model:
Greater waxmoth larvae (Galleria mellonella) have become a widely adopted insect
model to study the pathogenesis of a range of pathogens including Listeria spp.,
Streptococcus pyogenes, Campylobacter jejuni, Yersinia pseudotuberculosis, as well
as several pathogenic fungi (Mukherjee et al., 2010; Alghoribi et al., 2014; Senior et
al., 2011). G. mellonella larvae are easily maintained and infected, and can
withstand incubation at 37°C. Thus, this infection model was used to assess if ESBL
plasmids affect the ability of APEC to infect this non-mammalian model host.

76
G. mellonella larvae were purchased from Live Foods, UK and maintained on wood
chips at 15 ˚C. Larvae infection were carried out as previously described (Champion
et al., 2010). Using a Hamiliton syringe, 10 µl of a bacterial suspension (105 cfu) was
injected into the haemocoel via the right foreleg. Larvae were then incubated at 37˚C
and their survival and macroscopic appearance examined at various times post-
infection. Normal healthy larvae appear cream-coloured and move readily around
the Petri dish whereas unhealthy larvae turn brown and are unable to right
themselves when placed on their back. No movement is detected in dead larvae. In
these studies, uninfected controls and larvae receiving sterile PBS were included in
each independent experiment. In each experiment, groups of ten G. mellonella
larvae were infected.
Intracellular growth assay:
In addition to quantifying larvae survival, the number of bacteria present in the
haemolymph was determined at various times post-infection. Thus, at 5 and 10 h
p.i., haemolymph was extracted from three infected larvae as previously described
(Harding et al., 2013). In order to release any intracellular bacteria, the haemolymph
was incubated with 1 µl of 1% triton for 5 min at room temperature. Then, the
resultant solution was serially diluted in PBS and plated onto LB agar or LB agar,
supplemented with 1µg/ml cefotaxime.
2.10 Data manipulation and statistical analysis
Data including antimicrobial resistance profiles, gene content, bacterial counts
(cfu/ml) and larvae survival were tabulated using Microsoft Excel (version 2010) and
means and standard deviations calculated as necessary. Bacterial count data were
log transformed in order to obtain normally distributed data prior to further analysis.
Strain generation times were calculated from bacterial growth curves. Statistical

77
analyses including t-tests, were performed using GraphPad Prism 6. Unpaired two-
tailed Student’s t-test was used to compare two samples, whereas oneway or
twoway ANOVA with Bonferroni’s Multiple Comparison post-hoc tests were used to
compare two or more variables. In all cases, statistical significance was set at
P≤0.05.

78
Chapter 3: Characterization of APEC strains and
ESBL plasmids

79
3 . Characterization of APEC strains and ESBL plasmids
3.1 Background and aims
Avian pathogenic E. coli (APEC) are considered as ExPEC and are associated with
a range of mainly extra-intestinal infections of mild to severe disease severity in birds
(Nakazato et al., 2009). Recent studies have indicated that APEC and human
ExPEC share many common features such as virulence genes, serogroups,
phylogenetic groups, and the possession of certain plasmids (Bauchart et al., 2010a;
Johnson et al., 2007; Mellata, 2013). Thus, it is possible that APEC has the potential
to be a human pathogen and to act as a virulence gene reservoir for human ExPEC
strains, and vica versa (Mellata, 2013).
Resistance to antimicrobials is widespread in the Enterobacteriaceae and the
presence of resistance genes on APEC plasmids has been recognised as
contributing to their potential risk in terms of food safety and human health (Lima-
Filho et al., 2013). The most prominent plasmids in APEC strains carrying virulence
and resistance genes belong to different incompatibility groups including IncFIB,
IncFIIA, IncI1 and IncN replicon types (Johnson & Nolan, 2009). Extended spectrum
β-lactamases (ESBLs) are enzymes produced by resistant bacteria, that act to
hydrolyse the β-lactam ring of extended-spectrum cephalosporins and
monobactams, which are frontline antibiotics used in the treatment of infections
(Livermore & Woodford, 2006). In the last decade, the ‘original’ ESBL enzymes, TEM
and SHV have been rapidly replaced by the CTX-M allele as the most common
resistance type (Carattoli , 2009). Their rapid spread within Gram negative bacteria
has been associated with the presence of insertion sequences such as ISEcp1,
which are also located on the plasmid (Cantón & Coque, 2006). CTX-M harbouring
plasmids of different incompatibility types have been identified in isolates from

80
chickens, human and environmental origin (Livermore & Hawkey, 2005). Of these,
plasmids belonging to IncI1 and IncF replicon types have been reported to be
predominant in chicken and human isolates (Carattoli, 2009). Particular concerns
have been raised since CTX-M has been frequently identified in the community and
in food production animals (Bortolaia et al., 2011).
Given the significant economic cost of APEC infection to the poultry industry,
the potential risk of zoonotic transmission to humans and the fact that many of these
organisms harbour resistance plasmids, a better understanding of APEC plasmid
gene content and biology is warranted. Thus, the aim of this chapter was to
characterise the genetic and phenotypic properties of several ESBL-producing APEC
isolated from UK poultry and to generate plasmid-containing transconjugants as well
as plasmid-free derivatives to enable study of the effect of ESBL plasmid carriage on
host cell fitness. To this end, three cefotaxime-resistant and one cefotaximine-
sensitive APEC strain were selected for further investigation. These strains were
randomly chosen from a collection of putative ESBL-producing E. coli UK poultry
isolates (Randall et al., 2011).
The objectives of this chapter were to:
Characterise the genetic background and virulence gene content of wild type
APEC in order to determine whether the strains belonged to the same
phylogenetic group and to assess their pathogenic potential.
Determine the size, number and origin(s) of replication of plasmids present in
the host strains in order to further characterise the plasmid content of APEC.
Generate ESBL transconjugants and plasmid-cured strains in order to study
the impact of the ESBL plasmid on host bacterium biology.
Determine the antibiotic resistance profiles of wild type APEC and the ESBL-
producing transconjugants in order to accurately describe their resistance

81
patterns and ascertain which resistance genes and alleles are located on the
conjugative plasmids.
3.2 Results
3.2.1 Species and isolate characterisation
Four strains of avian pathogenic E. coli SAP24, SAP44, SAP45 and SAP46 were
used in this study. Three of these strains (SAP44, SAP45 and SAP46) were
originally among strains isolated by Randall and colleagues to study the presence of
virulence genes in isolates of CTX-M producing E. coli from broiler chicken and
turkey flocks in UK (Randall et al., 2011). The sensitive non-ESBL wild type strain,
SAP24, was kindly provided by Professor Roberto La Ragione, and was originally
obtained from a clinical case of avian colibacillosis in the UK.
Prior to the start of experiments, the species identity of the four strains was
confirmed using the commercially-available API 20E test kit, a miniaturised 20-
chamber strip that contains individual test media. Based on the pattern of
biochemical reactions obtained for each of the four test isolates, the bacteria were
positively identified as E. coli.
3.2.1.1 PCR-based phylogenetic and O-antigen typing
In order to examine whether APEC isolates were derived from the same
clonal group, phylogenetic typing of the strains was performed based on the chuA,
YjaA and TspE4C2 genes as previously described (Clermont et al., 2000). The
results of the phylogenetic typing showed that the three APEC strains belonged to
different phylogenetic groups. SAP44 and the wild type isolate (SAP24) belonged to
the same group (A1) as they harboured yjaA genes (Figure 9). In contrast, no

82
amplicons were generated for SAP45 placing this isolate in group A0, whereas
SAP46 was found to amplify the chuA amplicon, making this isolate a member of
group D1.
To further characterize the APEC strains, the O-antigen type was determined
using allele–specific PCR (Clermont et al., 2011). Both wild-type APEC isolates
SAP44 and SAP24 were classified as having the same O- antigen type (O78),
whereas, the other APEC isolates, SAP45 and SAP46, were found to have different
O antigens, corresponding to O7 and O15, respectively (Figure 10). These findings
indicate that the two APEC isolates, SAP44 and SAP24, are potentially ancestrally
related.
Figure 9. Phylogenetic analysis of wildtype APEC strains.
Phylogenetic analysis of APEC isolates based on PCR amplification of yjaA, chuA and TspE4C2, as previously described (Clermont et al., 2000). The data indicates that SAP24 and SAP44 strains were in the same phylogenetic group (A1) as both amplified the yjaA gene (211bp). No PCR amplicons were observed for SAP45, indicating that it is grouped as A0. SAP46 was positive for the chuA gene (279 bp) and thus, was placed in group D1. Lane N: negative control of nuclease-free water; Lane P: positive control strain that harbours all three genes; Lane L: 1 kb DNA ladder.

83
Figure 10. O-antigen typing of wildtype APEC strains.
O-antigen typing of APEC isolates based on PCR amplification of several common O-antigen types (Clermont et al., 2011). An O78 strain was included as a positive control. SAP24 and SAP44 both amplified the same O-antigen type (O78; 464 bp), whereas SAP45 and SAP46 amplified fragments belonging to different O- groups, O7 (722bp) and O15 (536bp), respectively. Lane N: negative control of nuclease-free water; Lane L: 1 kb DNA ladder.
3.2.1.2 Antimicrobial suspectibility profiles
The sensitivity of the APEC isolates to various antimicrobial agents was assessed
using the disc diffusion assay in accordance with BSAC methods (BSAC, 2012). The
antibiogram profiles are presented in the table (Table 10). All APEC isolates were
resistant to ampicillin. More importantly, with the exception of SAP24, the APEC
isolates showed full resistance to first and second generation of cephalosporins
(ampicillin, cefotaxime and cefpodoxime) and tetracycline but were sensitive to
aminoglycosides, fuluroqoinilones, chloramphenicol and sulphanilamid/trimethoprim.
Based on these findings, the production of ESBLs was confirmed by the combination
disc method according to the BSAC standards. ESBL-producer strains were
considered positive if the zone of inhibition around the combination disc (cefotaxime
plus clavulanic acid) was 5 mm or more than that present around cefotaxime alone.
All APEC strains (SAP44, SAP45 and SAP46) that demonstrated full resistance to

84
cephalosporin also showed a zone of inhibition around the combination disc that was
more than 5mm greater than that present around the cefotaxime only disc. Thus, the
APEC isolates SAP44, SAP45 and SAP46 were confirmed as ESBL-producing
bacteria while SAP24 was confirmed as being sensitive to most β-lactam antibiotics.

85
Table 10. Antimicrobial resistance profiles of APEC isolates.
Strains and their
derivatives
Antimicrobial agents A
MP
AM
C
CT
X
CE
F
FO
X
CP
D
CA
Z
CIP
NA
C
TE
SX
T
AK
GC
AP
R
Cut off points (in mm) R<14
S>15
R<12
S>13
R<23
S>30
R<23
S>28
S>23 R<19
S>20
R<22
S>27
R<16
S>20
R<17
S>18
R<20
S>21
R<13
S>14
R<15
S>16
R<15
S>19
R<16
S>20
R<13
S>14
Original strains
SAP44 R S R R S R R S S S R S S S S
SAP45 R S R R S R R S S S R S S S S
SAP46 R S R R S R R S S S R S S S S
SAP24 R S S S S S S S S S S S S S S
R and S stand for resistant and sensitive. Antibiotics are abbreviated as follows: AMP: ampicillin, AMC: amoxycilin, CTX: Cefotaxime, CEF: Ceftriaxone, FOX: Cefoxitin,
CPD: Cefpodoxim, CAZ: Ceftazidime, CIP: Ciprofloxacin, NA: Nalidixic acid, C: Chloramphenicol, TE:Tetracycline, SXT: Sulpha/Trim, AK; Amikacin, GC: Gentamin,
APR: Apramycin.
APEC isolates were tested as sensitive (S) or resistant (R) to the anitbiotics listed above using a disc diffusion assay (BSAC). SAP44, SAP45 and SAP46 were resistant to first and second generation cephalosporins, whereas SAP24 was susceptible to all antibiotics except amplicillin.

86
3.2.1.3 PCR-based identification of ESBL enzyme types
In section 3.2.1.2, three of the APEC isolates were found to be resistant to first and
second generation cephalosporins and confirmed as ESBL-producing bacteria. The
identification of the ESBL gene conferring resistance was determined using a
previously published multiplex PCR that enabled the detection of blaSHV, blaTEM,
blaOXA and blaCTX-M genes (Fang et al., 2008). With the exception of SAP24, all
isolates were found to carry the blaCTX-M gene (Figure 11). To further characterise the
type of CTX-M enzyme present in these isolates, PCR specific primers to each of the
main CTX-M groups were used (Woodford et al., 2005). All APEC isolates used in
this study were found to harbour the blaCTX-M-1 group allele (Figure 12 ).
Figure 11. Beta-lactam gene typing in wildtype APEC strains.
APEC isolates were assessed for the presence of the common β-lactam genes using PCR (Fang et al., 2008). The blaCTX-M, blaOXA, blaSHV and blaTEM genes were detected based on the expected amplicon size: CTX-M (593 bp), OXA (813 bp), SHV (237 bp) and TEM (445 bp). Strains tested are APEC strains, SAP44, SAP45, and SAP46. SAP24 was included as a negative control strain. Lane L: 1 kb DNA ladder, Lane N: negative control of nuclease-free water and Lane P: positive control strain that contains all four bla types.

87
Figure 12. CTX-M group determination in ESBL APEC strains.
Wild type APEC isolates contain β-lactam enzymes that belong to CTX-M group1. Plasmid DNA was tested against primers specific for CTX-M group1 (expected size 415pb), include others. Only a fragment specific to the CTX-M group1 was amplified. Strains tested include wild type APEC isolates (SAP44, SAP45 and SAP46), one derivative strain of SAP59 (SAP56).

88
3.2.1.4 PCR-based assessment of virulence gene content
The pathogenicity of the APEC isolates was investigated using several multiplex
PCR assays that allowed the detection of 14 virulence genes that are usually
associated with APEC (iutA, iss, hlyF, ompT, iroN, astA, ibeA, irp2, papC, sitA, iucD,
tsh, vat, and cvi/cva). The virulence genes are associated with adhesins, toxins, iron
uptake systems and resistance to host serum.
Previously established criteria indicates that isolates are considered as APEC
if they are associated with 5 or more virulence associated genes (Ewers et al., 2009)
however, the specific set of virulence factors possessed by APEC has not been
clearly established (Dho-Moulin & Fairbrother, 1999; Johnson et al., 2008). The
studies presented here indicated that all the original test E. coli strains were
classified as APEC strains (see Table 11). Although there was variability in the
number of virulence genes present, two virulence genes (sitA and iss) were found in
all four APEC isolates used in this thesis, indicating that their presence is not
associated with carriage of the ESBL plasmid (Figure 14). Two additional virulence
genes (hlyF and ompT) were only found in the ESBL-producing isolates (SAP44,
SAP45 and SAP46) (Figure 13). It was interesting to find that SAP44 (O78) was the
only APEC isolate to possess the tsh gene, which is commonly found in APEC
(Köhler & Dobrindt, 2011) . The variable virulence gene content of APEC as evident
here reflects the difficulty of developing specific markers for the APEC pathotype
based on their virulence gene content.

89
Figure 13. Multiplex PCR detection of iutA, iss, hlyF, ompT and iroN in APEC..
A 5-gene multiplex PCR assay was used to detect the presence of iutA, iss, hlyF, ompT and iroN in APEC (Johnson et al., 2008) . The expected amplicon sizes were iutA (302 bp), iss (323 bp), hlyF (450 bp), ompT (496 bp) and iroN (533 bp). Strains tested included APEC strains SAP24, SAP44, SAP45 and SAP46. PCR products were run on 2% agarose gel. L: 1 kb DNA ladder and N: negative control of nuclease-free water.
Figure 14. Virulence genes determination in APEC strains (Multiplex PCR for 9 genes).
Multiplex PCR analysis of the virulence genes in wild type APEC and its derivatives. Primers specific for astA (116bp), ibeA (171bp), irp2 (413bp), papC (501bp), sitA (608bp), iucD (714bp), tsh(824bp), vat(981bp) and cvi/cva (1181bp) were used. Strains tested are APEC strains SAP24, SAP44, SAP45 and SAP46 . N stands for negative control of nuclease free water.

90
Table 11 Virulence-associated genes in APEC strains and derivatives
Virulence genes
APEC strains
SAP24 (O78) SAP44(O78) SAP45(O7) SAP46(O15)
iutA
Iss + + + +
hlyF + + +
ompT + + +
iroN + +
astA
ibeA +
irp2 + + +
papC +
sitA + + + +
iucD + + +
Tsh +
Vat
cvi/cva
total no. genes 4/ 14 7 / 14 8 / 14 6 / 14
Virulence genes detected in ESBL- harbouring wild type APEC strains and wild type non ESBL plasmid pathogenic
strain (SAP24).

91
3.2.2 Plasmid content of APEC isolates
In order to further analyse the genetic background of APEC, the plasmid content of
the different isolates was determined using plasmid profiling. Purified plasmid DNA
from each of the isolates was subject to gel electrophoresis and the relative size and
number of plasmids determined. As shown in Figure 15, all ESBL-producing APEC
strains possessed at least one large plasmid of just less than 148 kb, based on the
migration of plasmids of known size in the reference strain E. coli 39R. SAP44
appears to harbour a single large plasmid (likely encoding the blaCTX-M gene),
whereas strain SAP45 harbours two plasmids of size 63.4 and 148 kb, respectively.
Interestingly, the intensity of plasmid DNA extracted from SAP44 was much brighter
than for any of the plasmids extracted from the other isolates. Strain SAP46
harboured four plasmids, ranging in size between ˂ 6.8 kb to approx. 148 kb. With
the exception of SAP44, these findings are consistent many other studies (Johnson
et al., 2007; Mellata et al., 2009) which show that APEC harbours multiple, large
plasmids, and this is a defining feature of the pathotype.
Figure 15. Plasmid profiling of ESBL-producing APEC isolates
ESBL-producing APEC isolates (SAP44, SAP45 and SAP 46) were subject to plasmid profiling.
Plasmid DNA was extracted from each strain and subject to gel electrophoresis on 0.7% agarose gel.
The gel shows that SAP44 appears to harbour a single large plasmid (CTX-M plasmid), whereas
strain SAP45 harbours two plasmids of size 63.4 and 148 kb, respectively. SAP46 contains four
plasmids, ranging in size between ˂ 6.8 kb to approx. 148 kb. E. coli 39R is a reference strain that
contains four plasmids of known sizes, corresponding to 148kb, 63.4kb, 36 kb and 6.8 kb.

92
3.2.3 Generation of ESBL-producing transconjugants in E. coli K12 and a naïve avian
E. coli O78 isolate
In order to investigate the metabolic burden and phenotypic effects attributed to
carriage of the ESBL plasmid, two sets of plasmid–harbouring derivatives were
constructed. Firstly, plasmid DNA from each of the ESBL-producing APEC was
introduced into the laboratory E. coli K12 strain (herein named SAP59) by
electroporation. The plasmid-containing E. coli K12 derivatives were selected
following growth on LB agar supplemented with 1 µg/ml cefotaxime and designated
as SAP56, SAP57 and SAP58 having been derived from SAP44, SAP45 and SAP46
respectively. The presence of a band just less than 148 kb in each of these
derivatives confirmed the transfer of a large plasmid (Figure 16). Growth on the
selection plates and subsequent antimicrobial resistance profiling of the
transconjugants (SAP56, SAP57 and SAP58) was consistent with the transfer of the
CTX-M gene (Table 12).
Secondly, the ESBL plasmids were introduced into the non-ESBL-producing
avian E. coli O78 isolate (SAP24) by conjugation. SAP24 was used as it belonged to
the same serogroup and phylogroup as one of the APEC isolates (O78). Plasmid
transfer was mediated by bacterial conjugation using the SAP59 derivatives (SAP56,
SAP57 and SAP58) generated above as donors and SAP24 as the recipient strain.
The SAP59 derivatives were used for conjugation rather than the original APEC
isolates because they only contain the ESBL plasmid, and thus transfer of other
APEC plasmids was avoided.
As shown in Figure 16, SAP24 normally harbours one large plasmid (< 63.4
kb) and two smaller plasmids (both < 36 kb). Following conjugation, the SAP24
transconjugates (SAP140, SAP141 and SAP142 derived from SAP56, SAP57 and

93
SAP58, respectively) were found to harbour an additional large plasmid (size just
less than148 kb) indicating that the presence of the ESBL plasmid. The presence of
the ESBL plasmid was also confirmed by the production of ESBL using the disc
combination test (cefotaxime and clavulanic acid) that used to test the original APEC
isolates (see section 3.2.1.2). Finally, the antimicrobial resistance patterns of the
SAP24 transconjugants were found to be similar to that of the donor strain (SAP59
derivative carrying the ESBL plasmid). Thus, the ESBL plasmid was able to express
the resistance genes in E. coli of a different genetic background (see Table 12 ).
Figure 16. Plasmid profiling of ESBL-producing transconjugants of laboratory E. coli
K12 and the avian E. coli O78 isolate.
Plasmid content of ESBL-producing E. coli K12 transconjugants (SAP56, SAP57 and SAP58) and the naïve avian E. coli O78 (SAP24) transconjugants (SAP140, SAP141 and SAP142). Plasmid DNA was extracted ffrom each of the strains and subject to gel electrophoresis to verify plasmid content and size. Lanes: 39R-E. coli reference strain containing plasmids of known size, SAP24 – plasmid-free recipient, SAP56, SAP57 and SAP58 are E. coli K12 (SAP59) derivatives that contain the CTX-M plasmids originally isolated from the wild type strains; Lanes - SAP140, SAP141 and SAP142 are SAP24 derivatives that contain the CTX-M plasmid as follows: SAP140 (SAP24 transconjugant from SAP56), SAP141 (SAP24 transconjugant from SAP57), SAP142 (SAP24 transconjugant fromSAP58.

94
Table 12 Antimicrobial resistance profiles of laboratory E. coli K12 and avian E. coli (SAP24) after conjugation with ESBL-producing
APEC donor isolates.
Strains and their
derivatives
Antimicrobial agents
AM
P
AM
C
CT
X
CE
F
FO
X
CP
D
CA
Z
CIP
NA
C
TE
SX
T
AK
GC
AP
R
Cut off points (in
mm)
R<14
S>15
R<12
S>13
R<23
S>30
R<23
S>28
S>23 R<19
S>20
R<22
S>27
R<16
S>20
R<17
S>18
R<20
S>21
R<13
S>14
R<15 S>16 R<15
S>19
R<16
S>20
R<13
S>14
E. coli K12 (SAP59) and its derivatives
SAP59 S S S S S S S S S S S S S S S
SAP56 R S R R S R R S S S R S S S S
SAP57 R S R R S R R S S S R S S S S
SAP58 R S R R S R R S S S R S S S S
Avian E. coli O78 (SAP24) and its derivatives
SAP24 R S S S S S S S S S S S S S S
SAP140 R S R R S R R S S S R S S S S
SAP141 R S R R S R R S S S R S S S S
SAP142 R S R R S R R S S S R S S S S
R and S stand for resistant and sensitive. (AMP: ampicillin, AMC: amoxycilin, CTX: Cefotaxime, CEF:Ceftriaxon, FOX:Cefoxitin,CPD;Cefpodoxim, CAZ;Ceftazidime, CIP:
Ciproflloxacin, NA: Nalidixic acid, C: Chloramphenicol,TE.Tetracyclin, SXT: Sulpha/Trim, AK; Amikacin, CN: Gentamin,APR: Apramycin
Antimicrobial suspectibility profiles of laboratory E. coli K12 (SAP59), avian E. coli O78 (SAP24) and their respective ESBL-producing transconjugants. The donor strains consisted of the ESBL-producing APEC isolates. The zone of inhibition around the various antibiotic discs was measured and compared to the BSAC guidelines to assign as sensitive (S) or resistant (R). All transconjugants showed resistance to first and second generation of cephalosporins after acquisition of the ESBL plasmid.

95
To classify the ESBL plasmids, their origin of replication was determined using
multiplex PCR that amplifies replicon-specific sequences as previously described
(Carattoli et al., 2005). The E. coli K12 strains harbouring the ESBL plasmid (SAP59
derivatives) were used as the source of plasmid DNA in order to avoid issues of
contamination with other plasmids present in the wild-type APEC isolates. All
plasmids were found to contain the Inc I1-IY replicon type (Figure 17). After
determining the ESBL plasmid Inc type in the E.coli K12 transconjugants, it was
possible to identify the non-ESBL plasmid types present in the wild type APEC
isolates. All ESBL-producing APEC strains were also found to harbour the Inc FIB
type plasmid. In addition, SAP45 and SAP46 also harboured Frep type plasmids Inc
FIA and Inc FIA and F types respectively (Figure 18 and Figure 19). Interestingly,
none of the 18 rep types was found in SAP24 (the non-ESBL avian O78 strain) even
though plasmid profiling indicated the presence of more than one plasmid.

96
Figure 17. Inc/rep typing of ESBL plasmids in E. coli K12 transconjugants.
Multiplex PCR was used to identify the Inc/rep type plasmid present in E. coli K12 transconjugants. A strain containing HI1, HI2 and I1-IY orgins was used as a positive control with expected amplicon sizes of 471 bp, 644 bp and 139 bp respectively. Lanes: L - DNA ladder 100 bp, Lane 1 – positive control strain, lane 2, 3 and 4 are SAP59 derivative strains (SAP56, SAP57 and SAP58, respectively) and lane 5 - negative control (nuclease-free H2O). Based on amplicon size, all strains have I1-IY plasmid type.
Figure 18. Inc/rep typing of plasmids in ESBL-producing APEC isolates.
Multiplex PCR was used to identify the Inc/rep type of plasmids harboured by ESBL- producing APEC isolates (SAP44, SAP45 and SAP46). A positive control strain containing plasmids belonging to FIB (702 bp), FIA (462 bp) and W (242 bp) was included. Lanes: L- DNA ladder 100 bp, lane 1 - positive control, lanes 2, 3 and 4 contains SAP44, SAP45 and SAP46, respectively, and lane 5 - SAP24.

97
Figure 19. Simplex PCR to identify IncF plasmids in APEC strains.
Simplex PCR was used to amplify the IncF (270 bp) plasmid type in the ESBL- producing APEC isolates (SAP44, SAP45 and SAP46). Lanes: L - DNA ladder 100 bp, lane 1 - positive control containing PCR products of known size IncF (270bp), lanes 2, 3 and 4 contain SAP44, SAP45 and SAP46, respectively and lane 5 contains SAP24.

98
3.2.4 Generation of plasmid-cured derivatives of the APEC isolates
Curing the original APEC isolates of their respective ESBL-producing plasmids was
essential in order to study the contribution of the plasmid to the phenotype of the
host bacterium. Curing was performed using a plasmid curing vector (pIFM27) in
order to avoid secondary mutations occurring as a result of manipulations based on
stress or treating the bacterium with chemical detergents (Hale et al., 2010). By
having the same incompatibility group and antisense RNA as the target plasmid, the
curing vector was able to cure the host strains of their ESBL plasmids (Figure 20).
Plasmid profiling showed that a band of approximately 100 kb in size was still
present after curing of SAP44 (Figure 20, lane 2 and 3). Subsequently, it was found
that SAP44 harbours two plasmids of approximately the same size, one belonging to
the Inc I1-1y replicon type (ESBL plasmid) and the other belonging to the Inc FIB
replicon type. This was confirmed by PCR-based Inc typing of the strains (Figure
18). Interestingly, screening of transformants after the curing process revealed that
the FIB plasmid has been lost from one of the ‘cured’ colonies (herein named SAP44
plasmidless). The FIB cured strain was complemented with ESBL plasmid (I1-IY)
and renamed SAP44C, and both were used for further study (Figure 21 and Table
13). Loss of the ESBL plasmid was also confirmed by PCR-based detection of the
CTX-M gene and Inc I1-1y type, as well as the transformants phenotypic sensitivity
to cefotaxime in growth media.

99
Figure 20. Plasmid profiling of cured strains (SAP44 and SAP45).
Plasmid profiling gel of new cured strains. For strain SAP44, 1 is the original strain, 2 and 5 are transformants carrying the curing plasmid, but which don’t seem to have lost the large plasmid although the band density colour become more fade in the presence of curing vector and after the vector was cured from the strain. For strain SAP45 the curing was successfully achieved. Lane 8 is the original strain. Lanes 9 and 12 are the transformants carrying the curing plasmid. Lanes 10, 11, 13 and 14 are the cured strains after vector removal. (gel profiling was performed by Irene Martin).
Figure 21. Multiplex PCR of Inc/rep typing in SAP44 and its derivative strains.
Multiplex PCR analysis of Inc/rep typing plasmids harboured by of ESBL- producing APECs SAP44 and its derivatives. L (marker ladder 100bp). Lane 1 is a positive control containing PCR products of known size FIB (702bp) and I1-IY (139bp). Lane 2, 3,4 and 5 are SAP44(the origin isolate), SAP44(cured of ESBL plasmid but still has FIB plasmid) and SAP44(cured of ESBL plasmid and lost the FIB plasmid) and SAP44 (complemented cured strain with ESBL plasmid), respectively.

100
Table 13. Summary of APEC isolate properties and that of their derivatives
The table summarises most APEC genetic features that were found in the tested isolates in
this chapter. It will be as a reference table for the subsequent studies in the next chapters.
Footnote: A, Plasmid belonging to IncFIB replicon type was designated as pFIB44 and the
SAP44 derivative harbouring pFIB44 as a single plasmid was designated as SAP44F. B,
Plasmid belonging to IncI1 replicon type (ESBL) was designated as pSAP44 and the SAP44
cured derivative strain which was complemented with pSAP44 was designated as SAP44C.
Name Strain derivation O-type Phylogenic group
Plasmid content
SAP44 ESBL-producing APEC O78 A1 IncFIB, I1-Iy SAP44F SAP44C
SAP44 cured of ESBL plasmid SAP plasmidless transformed with ESBL plasmid
IncFIBA
I1-IyB
SAP44 plasmidless SAP44 cured of ESBL and FIB plasmid
none
SAP45 ESBL-producing APEC O7 A0 IncFIB, I1-Iy, IncFIA
SAP45 cured SAP45 cured of ESBL plasmid IncFIB, Inc FIA
SAP46 ESBL-producing APEC O15 D1 IncFIB,I1-Iy,IncW
SAP46 cured SAP46 cured of ESBL plasmid IncFIB, IncW
SAP24 Avian E. coli O78 isolate O78 A1 Non-type able plasmids
SAP140 SAP141
SAP24 transformed with ESBL plasmid from SAP44 SAP24 transformed with ESBL plasmid from SAP45
O78 A1 Transformed with I1-Iy I1-Iy
SAP59 E. coli K12 laboratory strain A1 None
SAP59 derivative strains(SAP56) A1 Transformed with I1-Iy

101
3.3 Discussion
In this study, three ESBL-producing APEC originally isolated from broiler chicken
and turkey flocks in the UK were examined for their genotypic and phenotypic
properties. All three isolates (named SAP44, SAP45 and SAP46) showed high levels
of resistance to the third generation beta-lactams as well as the broad spectrum
antibiotic, tetracycline. The isolates belonged to different O-antigen serogroups,
namely O78, O7 and O15, as well as different phylogenetic groups, namely A1, A0
and D1, respectively.
The isolation of ESBL-producing E.coli belonging to phylogenetic group A1 in
poultry is concerning. Ciccozzi and colleagues found that avian and human E. coli
isolates exhibiting multidrug resistance (MDR) and belonging to group A1 formed
several tightly-related clusters compared to those belonging to either group B and D
(Ciccozzi et al., 2013). This led the authors to propose that human MDR E. coli
strains belonging to phylogenetic group A1 were most likely descended from MDR
E.coli clones found in poultry.
Molecular characterisation of the ESBL-producing isolates showed that
despite belonging to different sero- and phylogenetic groups, all possessed CTX-M-
containing plasmids of the same size and Inc type (I1-IY) (see Figure 15). In each
case, the CTX-M gene belonged to CTX-M group 1. The blaCTX-M1 gene has been
detected in chicken isolates in the UK and several other European countries such as
Germany and Netherlands (Schink et al., 2011; Leverstein-van Hall et al., 2011).
Indeed, the CTX-M1 variant is one of the most commonly reported ESBL subtypes in
the European Union for E. coli isolated from food-producing animals (EFSA, 2011).
Moreover, genes coding for ESBLs have also been detected in avian E. coli isolated

102
from the faeces of healthy poultry, suggesting that poultry may act as a reservoir for
the resistance genes (Asai et al., 2011).
ESBLs of the CTX-M type have rapidly spread and have a wide distribution in
both hospitals and community settings (Livermore & Hawkey, 2005). These enzymes
have been reported from several sources including humans, animals, food and
sewage. This wide distribution may help explain the increased detection of blaCTX-
M within hospitals and the emergence of resistant bacteria within the community
(Cantón & Coque, 2006).
Although several virulence genes have been linked with APEC pathogenicity
(Janßen et al., 2001), no standard virulence gene profile has been identified for this
pathotype (Schouler et al., 2012). The most common virulence genes associated
with isolates causing avian colibacillosis include those coding for adhesins (F1, P,
and Stg fimbriae and curli), anti-host defense factors (OmpA, Iss, lipopolysaccharide
and K1 capsule), iron acquisition systems (aerobactin, Iro proteins, yersiniabactin,
and the Sit iron acquisition locus), autotransporters (Tsh, Vat, and AatA), the
phosphate transport system, sugar metabolism, and the invasion-associated IbeA
protein (Schouler et al., 2012).
In this study, it was found that the APEC isolates harboured different virulence
gene profiles. At least six of the virulence genes tested were detected in the ESBL-
producing isolates (Table 11), confirming their assignation as APEC. In contrast, the
non-ESBL-producing avian E. coli O78 isolate (SAP24) contained only 4 of the
virulence genes, perhaps indicating that this bacterium is less virulent .
Common to all isolates is the presence of genes coding for two iron
acquistion mechanisms, namely SitA (an iron transport system) and IucD (aerobactin
system), as well as a gene promoting survival inside the host, namely Iss (increased
serum survival). These genes have been well characterised and are mostly carried

103
on virulence plasmids belonging to the IncFIB type (Johnson et al., 2008). Other
predominant virulence genes detected in the isolates were hlyF (haemolysin protein),
and ompT (outer membrane protease T).
Many studies have reported that APEC possesses virulence factors that
contribute to the ability of the organism to colonize and invade tissues, which result
in developing colibacillosis (Zhao et al., 2005; La Ragione & Woodward, 2002). Of
these factors increased serum survival (iss) and temperature-sensitive haemaglutinin
(tsh), are important. The iss gene was present in 3 of APEC (SAP44, SAP45 and
SAP24) whereas tsh was only present in SAP44 (O78).
In order to further study the ESBL-producing plasmids harboured by the
APEC isolates, the plasmids were sequenced, annotated and compared to
determine their gene content and genetic relationship to each other. Furthermore,
the genome of the host bacterium was sequenced in order to examine if the genome
harboured factors that may promote uptake of plasmid DNA.

104
Chapter 4 : Plasmid and genome DNA characterisation

105
4 . Plasmid and Genome DNA Characterisation
4.1 Introduction:
In chapter 3, three ESBL-producing APEC isolates were characterised and found to
belong to different sero- and phylogenetic groups. Variability in O-antigen types can
sometimes reflect genetic variability within the strains. However, it remains to be
determined whether the strains harbour similar blaCTX-M1 expressing plasmids.
In addition, most virulence plasmids in E. coli belong to the IncF family and
have evolved in synergy with the host bacterium over time (Johnson & Nolan, 2009).
In this study, each of the three APEC isolates carried both an ESBL-producing
plasmid (IncI origin) and an IncFIB plasmid. Sequencing of the two plasmids may
reveal links between carriage of IncI1 and IncFIB plasmids in the same host
bacterium. The link between carriage of multi-drug resistance and plasmids made by
researchers in the 1960s stimulated intense interest in plasmid biology and
understanding the genetics of transmission in greater detail. However, much of this
work was focused on single plasmids, and the impact of additional plasmids within
the host bacterium was not extensively explored. Therefore, in this chapter, the
sequence of the ESBL-producing plasmid from each APEC was sequenced and
compared, together with the FIB plasmid from one of the isolates in order to gain
insights into the gene content and clonality of the different genetic structures.
Furthermore, the genomes of the ESBL-producing APEC isolate (SAP44) and the
non-ESBL-producing avian E. coli (SAP24) were sequenced and subject to
comparative analyses in order to identify host specific factors that distinguish the two
isolates.

106
The specific objectives of this chapter were to:
Sequence and annotate the ESBL and FIB plasmids harboured by APEC in
order to fully describe their genetic content.
Perform comparative analysis on the plasmid sequences in order to gain
insights into common features and determine the relatedness of plasmids in
ESBL-producing APEC.
Perform genomic sequencing of ESBL-producing and non-ESBL- producing
APEC O78 strains (SAP44 versus SAP24) in order to identify host specific
factors that distinguish these two organisms.
Perform comparative analyses against other known sequenced strains of
APEC O78 in order to identify if harbouring ESBL plasmid has an effects on
gene content.

107
4.2 Sequence analysis of ESBL plasmids from APEC isolates.
The ESBL plasmids were extracted and sequenced from the three APEC isolates
SAP44, SAP45 and SAP46, which belonged to O78, O7 and O15 serogroups,
respectively. Preliminary analysis of the sequence data revealed that the plasmids
were of identical size and exhibited 100% nucleotide sequence identity indicating
that the same ESBL plasmid was present in each of the three APEC isolates. As a
result of this finding, the ESBL plasmid from SAP44 (hereafter called pSAP44) was
selected as representative of the other two ESBL plasmids. The gene content and its
further characterisation are reported in this chapter.
Plasmid pSAP44 was 105,610 bp in size and had an average GC content of
51.1%. Consistent with rep/Inc typing by PCR (section 3.2.3), sequencing confirmed
the presence of the IncI1 replicon type. Sequencing also revealed the plasmid
encoded several genes that were known to be involved in conjugation, mobilisation,
partitioning, antibiotic resistance as well as several hypothetical genes (Figure 22
and Table 14), and these are discussed in more detail below.

108
Figure 22. Circular map of pSAP44, an ESBL-producing plasmid isolated from APEC
Circular genome of ESBL-encoding pSAP44 plasmid from APEC. The different rings
represent (from outer to inner) all genes and insertion elements, which are color coded by functional group (rings 1 and 2), deviation from average G+C content (ring 3), and GC skew ((G-C)/(G+C).The functions of genes are classified into 8 groups and genes in the same groups are indicated by the same colours, which are shown at the left side of the figure. Blue boxes indicates conjugation related genes; yellow, transposon genes; red, antibiotic resistance and virulence genes;orange, pil genes;green, maintenance and stability genes; pink, known function proteins; black, replication associated genes and light blue, hypothetical proteins.

109
Table 14. Features and/or open reading frames of pSAP44.
Name Region Protein function
TraC 176..586 IncI1 plasmid conjugative transfer protein TraC
hypothetical protein 589..762 hypothetical protein
hypothetical protein 759..1310 hypothetical protein
PilI 1472..1726 IncI1 plasmid conjugative transfer protein PilI
hypothetical protein complement(1832..2050) hypothetical protein
hypothetical protein 2067..2198 hypothetical protein
hypothetical protein complement(2311..2442) hypothetical protein
PilK 2495..2788 IncI1 plasmid conjugative transfer protein PilK
PilL 2822..3889 IncI1 plasmid conjugative transfer protein PilL
PilM 3889..4326 IncI1 plasmid conjugative transfer protein PilM
PilN 4340..6022 IncI1 plasmid conjugative transfer lipoproteinPilN
PilO 6015..7310 IncI1 plasmid pilus assembly protein PilO
PilP 7297..7749 IncI1 plasmid pilus assembly protein PilP
PilQ 7760..9313 IncI1 plasmid conjugative transfer ATPase PilQ
PilR 9326..10423 IncI1 plasmid conjugative transfer innermembrane
protein PilR
PilS 10441..11055 IncI1 plasmid conjugative transfer prepilinPilS
PilT 11065..11625 IncI1 plasmid conjugative transfer putativemembrane
protein PilT
PilU 11661..12266 Type-IV sectretion leaderpeptidase/N-methyltransf
erase, PilU
PilV 12254..13690 IncI1 plasmid conjugative transfer pilus-tipadhesin
protein PilV
ISEcp1 14159..15421 ISEcp1
hypothetical protein 15402..15524 hypothetical protein
CTX-M-1 15709..16584 Beta-lactamase, CTX-M-1
Tryptophan synthase beta
chain like
complement(16631..16903) Tryptophan synthase beta chain like
Rci 17970..19157 Shufflon-specific DNA recombinase, Rci
TraE 19308..20132 IncI1 plasmid conjugative transfer protein TraE
TraF 20217..21419 IncI1 plasmid conjugative transfer protein TraF
TraG 21479..22063 IncI1 plasmid conjugative transfer protein TraG
hypothetical protein complement(22077..22226) hypothetical protein
TraH 22458..22916 IncI1 plasmid conjugative transfer protein TraH
TraI 22913..23731 IncI1 plasmid conjugative transfer protein TraI
TraJ 23728..24876 IncI1 plasmid conjugative transfer protein TraJ,related
to pilus biogenesis/retracton protein
TraK 24873..25163 IncI1 plasmid conjugative transfer protein TraK
Nuc 25178..25729 Plasmid conjugative transfer endonuclease
SogS/SogL 25818..29585 IncI1 plasmid conjugative transfer DNA

110
primase,SogS/SogL
TraL 29603..29950 IncI1 plasmid conjugative transfer protein TraL
TraM 29947..30639 IncI1 plasmid conjugative transfer protein TraM
TraN 30650..31633 IncI1 plasmid conjugative transfer protein TraN
TraO 31636..32925 IncI1 plasmid conjugative transfer protein TraO
TraP 32925..33629 IncI1 plasmid conjugative transfer protein TraP
TraQ 33635..34156 IncI1 plasmid conjugative transfer protein TraQ
TraR 34207..34611 IncI1 plasmid conjugative transfer protein TraR
TraS 34675..34863 IncI1 plasmid conjugative transfer protein TraS
TraT 34847..35647 IncI1 plasmid conjugative transfer protein TraT
TraU 35737..38781 IncI1 plasmid conjugative transfer protein TraU
TraV 38781..39395 IncI1 plasmid conjugative transfer protein TraV
TraW 39362..40564 IncI1 plasmid conjugative transfer protein TraW
TraX 40593..41177 IncI1 plasmid conjugative transfer protein TraX
TraY 41274..43442 IncI1 plasmid conjugative transfer integralmembrane
protein TraY
ExcA 43516..44166 surface exclusion protein, ExcA
hypothetical protein complement(44238..44447) hypothetical protein
hypothetical protein 44682..44810 hypothetical protein
hypothetical protein 44839..45015 hypothetical protein
hypothetical protein 45674..45925 hypothetical protein
pndA complement(45997..46149) post segregation killing protein
pndC complement(46004..46207) post-segregation killing protein
TrbA 46441..47649 TrbA protein
TrbB 47668..48738 TrbB protein
TrbC 48731..51022 TrbC protein
hypothetical protein complement(51059..53758) hypothetical protein
Nickel ABC complement(53769..54149) Nickel ABC transporter, periplasmicnickel-binding
protein NikA
hypothetical protein 54229..54345 hypothetical protein
YggA 54335..54670 YggA protein
YgfB complement(54755..55603) YgfB protein
hypothetical protein 55704..55982 hypothetical protein
hypothetical protein 55952..56149 hypothetical protein
YgeA 56183..56434 YgeA
hypothetical protein complement(56465..56635) hypothetical protein
YgdB complement(56697..57638) YgdB protein
YgdA complement(57703..57969) YgdA protein
YgcA complement(58061..58495) YgcA protein
hypothetical protein 58600..58803 hypothetical protein
hypothetical protein 58800..59084 hypothetical protein
hypothetical protein complement(59097..59240) hypothetical protein
ArdA complement(59224..59739) Antirestriction protein ArdA
hypothetical protein 59885..60025 hypothetical protein
YgaA complement(60187..60783) YgaA protein

111
PsiA complement(60780..61499) PsiA protein
PsiB complement(61496..61930) PsiB protein
YfhA complement(61985..63943) YfhA protein
Putative cytoplasmic protein complement(64002..64235) Putative cytoplasmic protein
Ssb complement(64293..64820) Single-stranded DNA-binding protein, Ssb
YffB 64941..65399 YffB protein
YffA complement(65590..65781) YffA protein
YfeC complement(65778..66200) YfeC protein
YfeB complement(66247..66672) YfeB protein
YfeA 66834..66974 YfeA protein
YfdA complement(67090..67911) YfdA protein
YfcB complement(67911..68345) YfcB protein
YfcA complement(68357..68578) YfcA protein
YfbB complement(68579..69262) YfbB protein
hypothetical protein 69370..69495 'hypothetical protein
hypothetical protein complement(69647..70573) hypothetical protein
hypothetical protein 70806..70970 hypothetical protein
ImpC 70967..71215 ImpC protein
ImpA 71212..71649 ImpA protein
ImpB 71649..72923 ImpB protein
ParB complement(72925..73341) ParB protein
ParA complement(73334..74314) ParA protein
YegA complement(74728..75036) YegA protein
YefA complement(75123..75767) YefA protein
ResD complement(75947..76726) Resolvase, ResD
hypothetical protein complement(76728..77141) hypothetical protein
hypothetical protein 77255..77449 hypothetical protein
hypothetical protein 77467..77580 hypothetical protein
hypothetical protein 77673..78599 hypothetical protein
hypothetical protein 78644..78898 hypothetical protein
hypothetical protein complement(79204..79479) hypothetical protein
hypothetical protein complement(79917..80918) hypothetical protein
hypothetical protein complement(80923..81135) hypothetical protein
hypothetical protein 81117..81284 hypothetical protein
YdfA 81281..81526 YdfA protein
hypothetical protein 81574..82116 hypothetical protein
hypothetical protein complement(82164..82484) hypothetical protein
Colicin Ib immunity protein 82603..82950 Colicin Ib immunity protein
Colicin Ib protein complement(82968..84848) Colicin Ib protein
hypothetical protein complement(84954..85118) hypothetical protein
YagA complement(85127..86473) YagA protein
hypothetical protein 86551..86670 hypothetical protein
YafB 86827..87429 YafB protein
hypothetical protein 87446..87979 hypothetical protein
hypothetical protein 87976..88245 hypothetical protein

112
hypothetical protein complement(88368..88490) hypothetical protein
hypothetical protein 88499..88642 hypothetical protein
YadA complement(88722..89195) YadA protein
YacC complement(89312..90160) YacC protein
YacB complement(90200..90460) YacB protein
Phd antitoxin complement(90478..90747) Prevent host death protein, Phd antitoxin
Mobile element protein 91114..92250 Mobile element protein
Phosphoglucosamine mutase complement(92426..92728) Phosphoglucosamine mutase
Dihydropteroate synthase complement(92815..93630) Dihydropteroate synthase
putative replication protein complement(93818..93961) putative replication protein
Mobile element protein complement(94318..95007) Mobile element protein
tnpA, IS26 complement(95113..95817) tnpA (transposase), IS26(insertion sequence)
tnpA 96228..96429 Transposase
tetR complement(96460..97137) bacterial regulatory protein TetR
tetA 97216..98415 tetracycline efflux protein
pecM complement(98447..99331) hypothetical transmembrane protein
hypothetical protein 99331..99603 hypothetical protein
Mobile element protein 99584..100792 Mobile element protein
hypothetical protein complement(100907..101083) hypothetical protein
hypothetical protein complement(101334..101483) hypothetical protein
replication initiation protein,
repZ
complement(101815..102891) replication initiation protein, repZ
repY complement(102834..102923) replication protein repZ regulatory protein
Inc 102938..103009 Inc
hypothetical protein 103054..103173 hypothetical protein
TraA 104000..104287 IncI1 plasmid conjugative transfer protein TraA
hypothetical protein 104601..104723 hypothetical protein
TraB 104729..105262 IncI1 plasmid conjugative transfer NusG-type
transcription antiterminator TraB

113
Compared to other previously sequenced CTX-M1-encoding plasmids,
pSAP44 exhibits 99% nucleotide identity and 96% query coverage to pC49-108
(accession no: KJ484638). pC49-103 was originally identified in a multidrug
resistant (MDR) E.coli isolate obtained from a food producing- animal (Wang et al.,
2014). However, one key difference between the plasmids is in the organization of
the class 1 integron (aadA5, dftA17, IntI1) and the insertion sequence Tn1722, which
are absent in pSAP44 but present in pC49-108. Instead pSAP44 contains the genes
coding for tetracycline resistance (about 3 kb) in this location (Figure 23).
Figure 23.Sequence comparison of ESBL harbouring plasmid of APEC and MDR E.coli
Artemis comparison Tool (Sanger, UK) was used to compare the complete DNA sequence of pSAP44 isolated from APEC (bottom-line) with the complete sequence of plasmid pC49-108 isolated from MDR E. coli (top line). Bands of color indicate homology between sequences, red lines shows sequence homology in the same confirmation. The resistance cassette which encodes the tetracycline resistance genes (tetR, tetA and Pem) in pSAP44 and the class 1 integron in pC49-108 are highlighted with a black box.

114
4.2.1 Key features of pSAP44
1.1.1.1 Replication region:
The first 1,000 bp of pSAP44 was identified as the replication region of the plasmid
(with an IncI1 replicon type) and it showed high sequence homology (99% identity) to
two plasmids, that of pC49-108 and R64 (accession no: AP0051457.1) (Figure 23
and Figure 24). The R64 plasmid was originally identified in Salmonella Typhimurium
(Komano et al., 1987). The replication region has three essential genes inc, repY
and repZ, which were found to play important roles in replication maintenance and
control the plasmid copy number in host bacterium (Sampei et al., 2010).
Figure 24. Sequence comparison pSAP44, the ESBL-producing plasmid of APEC and
plasmid R64 of Salmonella Typhimurium.
Artemis comparison Tool (Sanger, UK) was used to compare the complete DNA sequence of pSAP44 ESBL (bottom-line) with the complete sequence of plasmid pR64 (top line). Bands of color indicate homology between sequences, red lines shows sequence homology in the same confirmation; blue lines show sequence inversion.

115
4.2.1.1 Resistance genes:
The blaCTX-M1 gene has been reported frequently on plasmids belonging to the IncI1
replicon type from E. coli isolated from human and animal sources (Carattoli, 2013).
In pSAP44, the CTX-M1 gene was found to be located downstream of the insertion
sequence ISEcp1 (Figure 25). The CTX-M1 gene has also been reported in plasmids
belonging to different Inc types adjacent to ISEcp1, or to other insertion elements
such as IS26, in IncF, IncB/O and IncN plasmids (Wang, 2015). Comparing the
nucleotide sequence of ISEcp1 to the IS database (http://www-is.biotoul.fr/page-
is.html) , revealed that it was 100% identical to the IS1380 family of insertion
elements. The IS1380 family are noted for their ability to mobilize easily and
efficiently among different bacterial species, which may explain the high prevalence
of CTX-M1 genes among different bacterial species (Jacoby, 2009).
Figure 25. Genetic map of the CTX-M1 region of pSAP44 and pC49-108.
CLC main workbench version (7.5.1) was used to compare the genomic organization of the pSAP44 ESBL CTX-M-1 genes with those of pC49-108. The insertion sequence ISEcp1 is located upstream the CTX-M-1 gene.

116
Genes coding resistance to tetracycline were also identified in pSAP44.
Resistance to tetracycline was also observed when pSAP44 was transferred to
recipient E. coli strains (section 3.2.3) which suggested that the tetAR genes were
co-transferable with the CTX-M1 gene and likely located on the same plasmid. The
tetAR cluster contains the class A tetracycline efflux protein (TetA) and a repressor
(TetR) with 100 % nucleotide sequence identity to the Inc1 plasmid pSC138
(accession no:AY509004) isolated from a highly invasive strain of Salmonella
enterica serovar Cholerasuis (Chiu et al., 2005). Although the genetic organisation of
this cluster (pem-tetA-tetR) was highly similar to pSC138 as well as to plasmids of
other Inc types e.g pH1038-142 (IncF-IncN) (accession no: KJ484634), the
transposon TnpA gene located upstream of this loci was completely different and
unique to pSAP44. This loci of organisation was not detected in the reference
plasmid pC49-108, being disrupted by a mobile element Tn1721 and genes of the
class 1 Integron module (IntI1-dfrA17-aadA5) (see Figure 26). It is believed that
tetAR genes and the adjacent genes are linked with a direct repeat sequence
(cgcccgcagca) which flanks the tetAR cluster and which might serve as a ‘hotspot’
location for the deletion and insertion of new mobile elements (Chiu et al., 2005).
However the direct repeat sequence was lacking in pSAP44. Instead, analysis of the
region flanking tetR, tetA and pecM, revealed inverted repeats of 7 bp (tatttgc-
ataaacg) in both pC49-108 and pSAP44 ESBL plasmid (see Figure 26). It is possible
that this region also acts as a hotspot for gene exchange.

117
Genetic map of the tetracycline region (3kb) presents in pSAP44 ESBL and absent in pC49-108 where class 1integron genetic organization is present. The genetic organization of both regions are flanked with inverted repeat sequence (ATTTGCA, TGCAAAT) indicated in a black box.
Figure 26. Genetic map of the tetracycline region of pSAP44 ESBL vs. pC49-108

118
4.2.1.2 Transfer genes:
Conjugative transfer is an important mechanism by which plasmids spread among
different bacteria. The cluster of genes in the pSAP44 transfer region (39,447 kb)
showed homology to that found in R64 and pC49-108 except for the absence of two
genes (traD and pilJ) in pSAP44. The pC49-108 plasmid also lacked these two
genes. Comparison of the gene organisation in pSAP44 transfer region to that of
R64 and pC49-108 plasmids revealed many conserved genes as indicated in Figure
27. This included four major parts of the transfer region consisting of the traABC
regulatory genes, traA and traB genes for conjugation, pil genes for type IV pilus
biogenesis and the oriT operon for conjugation processing (Takahashi et al.,
2011).The traABC genes in all these plasmids are located upstream of the
replication region consisting of the repYZ genes.
Figure 27 . Sequence comparison of the transfer gene regions of pSAP44 and R64
(AP005147)
CLC main workbench version (7.5.1) was used to compare the genomic organization of the pSAP44 ESBL transfer genes with those of R64. The genomic organisation of the transfer genes shows high homology with only two genes, traD and pilJ are absent in pSAP44ESBL.

119
Thirteen of pil genes were found to be identical to those of the R64 plasmid, with
exception of pilJ, which was missing in pSAP44. The pil genes are involved in the
formation of the type IV pilus, which is important for conjugation (Sampei et al.,
2010). Notably, pilJ does not appear to be essential in the conjugation process as
the absence of this gene in pSAP44 did not limit transfer of the plasmid to other E.
coli strains.The ISEcp1 and CTX-M-1 genes are located between pilV gene and rci
gene (shufflon- specific DNA recombinase) in pSAP44, but are not present in R64. It
is possible that the sequence region between the pilV and rci genes acts to promote
the insertion of new mobile elements.
4.2.1.3 Miscellanous genes.
The colicin 1b gene (colIb) was also identified in pSAP44 (see Figure 22).
Comparing the colIb gene sequence to those present in the Genbank database
(blast.ncbi.nlm.nih.gov) showed 100% nucleotide identity to the colIb gene located
on other large conjugative plasmids, most of which belonged to different Inc types
but also harboured antimicrobial resistance genes, such as blaCTX-M1.
The stability genes, psiA and psiB, in pSAP44 were located downstream of
the gene ardA coding for an anti-restriction protein. However, the stability region of
the R64 plasmid presented as mck/kor genes is disrupted in pSAP44 by
hypothetical proteins and only parAB (encoding for partitioning proteins) and resD
(encoding for resolvase D protein) were detected (see Figure 22).

120
4.3 Key features of pFIB44, the FIB plasmid present in APEC isolate SAP44
APEC virulence factors are commonly encoded on large plasmids, most of which
belong to the IncFIB replicon type (Johnson. et al, 2006). Previously in chapter 3,
PCR-based replicon typing showed that all ESBL-producing APEC isolates used in
this study also contained plasmids belonging to the Inc FIB type in addition to the
ESBL IncI plasmid. Thus, the FIB plasmid was sequenced in order to determine its’
gene content and to better understand its relationship, if any, to the ESBL-producing
plasmids of APEC.
Sequence data analysis revealed that the plasmid belonged to the Inc FIB
type (herein designated pFIB44), consistent with PCR-based rep typing in chapter 3.
pFIB44 was 97.245 kb in size, contained 149 features and had an average of GC
content of 60%. Like pSAP44, the plasmid contained several genes involved in
conjugation, mobilisation, partitioning, virulence as well as some unknowns (Figure
28).

121
Analysis of the DNA sequence of pFIB44 showed that it had 99% similarity at the
nucleotide level to that of plasmid, pAPEC-1 (accession no:CP000836), which was
also isolated from an APEC O78 isolate (Mellata et al., 2009). A gap of about 600
bp was missing from pFIB44. Closing the gap by PCR primer walking showed that
the repA region found in pAPEC-1 was missing in pFIB44. The finQ and crnB genes
found flanking the repA region in pAPEC-1, and also in the pAPEC-01-ColBM
plasmid (accession no.BQ381420) were identical to that found in pFIB44 (Figure 29).
In addition, one of two insertion sequences (IS30) located upstream of the crnB gene
in pAPEC-1 was identical to that of pFIB44. This was not the case however, in the
ColBM plasmid where neither of the insertion sequences were similar to those found
Circular representation of pFIB44 plasmid present ESBL-producing APEC. The different rings represent (from outer to inner) all genes and insertion elements, which are color coded by functional group (rings 1 and 2), deviation from average G+C content (ring 3), and GC skew ((G-C)/(G+C).Colors represent the following: red, virulence associated; yellow, mobile elements; dark blue, plasmid transfer; black, plasmid replication; green, plasmid maintenance; light blue, hypothetical proteins; and gray, transposons and insertion elements .
Figure 28. Map of pFIB44 plasmid, the IncF plasmid of ESBL-producing APEC (SAP44).

122
in pFIB44 and pAPEC-1.The region flanking the missing repA cluster in pFIB44
could act as a hotspot for the insertion or excision of foreign DNA. A complete list of
the features based on the DNA sequence of pFIB44 are presented in Table 15. Key
features in this plasmid are described in more detail below.
Figure 29. DNA sequence comparison of p44FIB, pAPEC-1 and pAPEC-01-ColBM.
Comparison of the genetic structure of the region flanked the repA cluster of the pAPEC-1 and pAPEC-01 ColBM to that of pSAP44FIB. Colours represent the following: Black, known ORFs genes; white, hypothetical protein genes; hatched arrows, insertion sequence genes.

123
Table 15. Features and/or open reading frames of pFIB44.
CODING REGION COORDINATES FUNCTION
MM1_0001 44 334 conserved hypothetical protein
MM1_0002 340 462 hypothetical protein
MM1_0003 444 1079 transposase, putative
MM1_0004 1042 1161 transposase, putative
MM1_0005 1466 1600 conserved hypothetical protein
MM1_0006 1646 1774 conserved hypothetical protein
MM1_0008 1847 2116 hypothetical protein
MM1_0007 2113 2262 hypothetical protein
IROB 2315 3430 IroB, glycosyltransferase
IROC 3444 7229 IroC, ABC transport protein
IROD 7333 8562 IroD, ferric enterochelin esterase
IROE 8647 9603 IroE, hydrolase
IRON 9648 11825 IroN, siderophore receptor
AROH 12691 13725 phospho-2-dehydro-3-deoxyheptonate aldolase
MM1_0016 13743 13934 hypothetical protein
MM1_0017 13924 14070 hypothetical protein
MM1_0018 14285 14593 conserved hypothetical protein
MM1_0019 14692 14874 conserved hypothetical protein
MM1_0020 14871 15068 YacA, putative
MM1_0022 15220 15342 hypothetical protein
MM1_0021 15328 15444 hypothetical protein
MM1_0023 15588 15746 hypothetical protein
CVAA 15750 17024 colicin V secretion protein
CVAB 17017 19113 colicin V secretion/processing ATP binding protein
CVAC 19283 19594 colicin V synthesis protein
CVI 19572 19808 colicin V immunity protein
MM1_0028 19690 19896 hypothetical protein
MM1_0029 19999 20370 conserved hypothetical protein
MM1_0030 20342 20746 conserved hypothetical protein
MM1_0031 20733 21017 conserved hypothetical protein
MM1_0032 21014 21994 dimethylaniline monooxygenase
MM1_0033 22061 22450 Transposase
MM1_0034 22447 22794 transposase, putative
MM1_0036 22844 24250 Transposase
MM1_0035 24235 24384 hypothetical protein
MM1_0038 24430 24687 Resolvase
DEF 24674 25126 peptide deformylase
MM1_0040 25080 25247 hypothetical protein
TSH 25235 29368 temperature-sensitive hemagglutinin Tsh
MM1_0041 29491 29913 conserved hypothetical protein
MM1_0042 29973 30377 Transposase
INSI1 30334 31464 transposase InsI for insertion sequence element IS30B/C/D
MM1_0044 31508 32287 transposase, putative
SRNB 32688 32936 Hok/Gef family protein
MM1_0060 33105 33221 endonuclease, putative
MM1_0061 33455 33667 conserved hypothetical protein
FINO 33803 34363 fertility inhibition protein
MM1_0063 34466 35326 conserved hypothetical protein
TRAX 35385 36131 TraX
TRAI 36151 38036 TraI
TRAK 38227 38955 TraK
TRAE 38942 39508 type IV conjugative transfer system protein TraE
TRAL 39530 39841 type IV conjugative transfer system protein TraL
TRAA 39856 40221 fimbrial protein precursor
TRAY 40254 40655 TraY
TRAJ 40748 41437 TraJ
TRAM 41624 42007 TraM

124
MM1_0074 42340 42930 Transglycosylase
MM1_0075 42956 43090 hypothetical protein
MM1_0076 43109 43258 hypothetical protein
MM1_0077 43227 44156 conserved hypothetical protein
MM1_0078 44226 44498 hypothetical protein
MM1_0079 44542 44745 hypothetical protein
MM1_0080 44855 45087 conserved hypothetical protein
MM1_0081 45094 45249 hypothetical protein
HOK 45374 45490 Hok protein
MOK 45378 45590 Mok
SOK 45576 45800 Sok
PSIA 45812 46532 plasmid SOS inhibition protein A
PSIB 46529 46966 PsiB
MM1_0086 47018 47152 conserved domain protein
YUBL 47243 47482 YubL
SSB 47544 48083 plasmid-derived single-stranded DNA-binding protein
MM1_0089 48109 48315 hypothetical protein
MM1_0090 48317 48874 conserved hypothetical protein
SOPB 49414 50385 SopB
SOPA 50385 51560 SopA
INSB 51851 52354 insertion element IS1 protein InsB
MM1_0094 52365 52577 conserved domain protein
MM1_0095 52619 52924 conserved hypothetical protein
IUTA 53033 55231 ferric aerobactin receptor precursor
IUCD 55316 56593 L-lysine 6-monooxygenase
IUCC 56590 58332 IucC
IUCB 58332 59279 IucB
IUCA 59280 61061 IucA
MM1_0101 60976 61095 hypothetical protein
SHIF 61140 62333 transposon function, ShiF, putative
MM1_0103 62449 62565 hypothetical protein
CRCB 62713 63093 CrcB protein
ENO 63434 63868 Enolase
MM1_0106 64224 64370 hypothetical protein
SITD 64336 65193 SitD
SITC 65190 66047 SitC
SITB 66044 66871 SitB
SITA 66871 67785 SitA
INSA 68142 68417 IS1 protein InsA
MM1_0112 68336 68839 IS1 protein InsB
IMPB 69019 69408 impB
ISTA 69666 70022 transposase for insertion sequence element IS21
MM1_0116 70244 70468 hypothetical protein
MM1_0117 70605 70775 hypothetical protein
REPB 70768 71745 rep FIB replication protein B
MM1_0119 71821 71940 hypothetical protein
INTM 72030 72770 site specific recombinase, putative
MM1_0121 72927 73052 hypothetical protein
MM1_0122 73453 74361 conserved hypothetical protein
HYLF 74424 75533 hemolysin F
MM1_0124 75783 75940 hypothetical protein
OMPT 75973 76932 protease 7
MM1_0126 77036 77425 conserved hypothetical protein
MM1_0127 77564 77701 hypothetical protein
MM1_0128 77793 78056 hypothetical protein
MM1_0129 78205 78363 transposase, putative
MM1_0130 78547 78873 IS629 taxon, putative
MM1_0131 78873 79064 transposase for insertion sequence element IS629
MM1_0132 79048 79747 transposase for insertion sequence element IS629
MM1_0133 80019 80325 transposase, putative

125
MM1_0134 80347 80475 hypothetical protein
MM1_0135 81085 81213 hypothetical protein
ETSA 81219 82406 macrolide-specific efflux protein etsA
ETSB 82403 84343 EtsB
ETSC 84347 85717 outer membrane protein
MM1_0139 85720 85848 hypothetical protein
MM1_0140 85845 85988 hypothetical protein
MM1_0141 86046 86234 conserved hypothetical protein
MM1_0142 86336 86491 hypothetical protein
MM1_0143 86514 87455 conserved hypothetical protein
MM1_0144 87465 87653 hypothetical protein
MM1_0145 87690 88076 conserved hypothetical protein
MM1_0146 88213 89079 transposase, putative
MM1_0147 89266 89577 conserved hypothetical protein
MM1_0148 89594 89746 hypothetical protein
MM1_0149 89716 90909 conserved hypothetical protein
MM1_0150 91324 91548 hypothetical protein
MM1_0151 91529 91648 hypothetical protein
MM1_0152 91798 91962 Transposase
MM1_0153 92151 92890 transposase insD for IS2
MM1_0154 92940 93239 transposase insE for IS3
MM1_0155 93236 94102 transposase InsF for IS3
MM1_0156 94116 94316 Transposase
MM1_0157 94274 94639 transposase insC for IS2
MM1_0158 94870 94994 hypothetical protein
MM1_0159 94995 95122 hypothetical protein
ISS 95250 95567 Increased serum survival
MM1_0161 95580 95872 conserved hypothetical protein
MM1_0162 95887 96007 hypothetical protein
MM1_0163 96076 96258 hypothetical protein
MM1_0164 96453 96710 conserved hypothetical protein
MM1_0165 96716 96838 hypothetical protein
MM1_0166 96820 97243 conserved hypothetical protein
4.3.1 Replication, partitioning and segregation regions
The repFIB gene is located downstream of the insertion sequence element IS21
between the sitABCD and etsABC gene clusters. In comparison to other FIB
replicons, pFIB44 showed a similar homologous structure to the FIB replicons of
pAPEC-1 and pAPEC-01-ColBM (accession no: DQ381420). Plasmid partitioning
(sopA and B) and post-segregation systems (smB, and hok/sok) are located either
side of smB of the tra region (see Table 15). This genetic organisation including the
tra region clusters was identical to that of pAPEC-1. Although pSAP44 (the ESBL
plasmid) was shown to transfer to other E. coli strains, the pFIB44 plasmid which co-

126
exists in the same donor strain, was not detected in the recipient strains by PCR.
Consistent with this observation, analyses the tra gene cluster in the pFIB plasmid
revealed that several important tra genes are missing including traV, traU, traF,
traW, traC, traH, traQ, and trbC, traD (controls DNA transfer), traT and traS (which
mediate surface exclusion), as well as several others, including traR, trbG, trbH,
trbF, trbD, and trbI. Given these gene omissions, it is perhaps not surprising that
pFIB44 was not found in the recipient cell.
4.3.2 Virulence gene content
The pFIB44 sequence showed that 9 virulence gene clusters accounted for
approximately 80% (80 kbp of 97 kbp) of the DNA sequence (Figure 28). These
virulence mechanisms included three iron acquisition systems (iroBCDN, sitABCD
and iutA iucABCD), a colicin V operon (cvi and cva ABC), temperature sensitive
haemagglutinin (tsh), haemolysin protein (hlyF), macrolide resistant genes (etsABC),
increased serum survival (iss), and the outer membrane protease (ompT). While
detailed gene comparisons for pFIB44 were beyond the scope of this thesis, in
general the sequence of the virulence genes identified in pFIB44 had similar
homologous structures to that of pAPEC-1 and the pAPEC-01-ColBM plasmids.
4.3.3 Comparison of pSAP44 and pFIB44
The APEC strains used in this thesis were found to harbour two large plasmids
approx. similar in size but belongin to different replicon types (Inc1 and IncFIB,
respectively). While both plasmids encoded some virulence genes which likely
conferred benefits to the host bacterium, the number of plasmid-coding for known
virulence factors were markedly different. For example, pSAP44 carried resistance

127
genes (CTX-M1 and tetR) mediating resistance to antibiotics, whereas pFIB44
harboured at least 9 virulence gene clusters, most of which are commonly reported
in APEC. Interestingly, both plasmids carry genes coding for colicin proteins but of
differing types, Col1 b and ColV, respectively. A striking feature of both plasmids was
the number of unknown functional genes (hypothetical proteins) which represent
14% and 17% of DNA in pSAP44 and pFIB44, respectively. Furthermore,
comparison in the number and size of insertion sequence and transposons revealed
that 12% of pFIB44 DNA was associated with mobile genetic elements (foreign DNA)
whereas only this was accounted for only 4% in pSAP44. This may explain why so
many common virulence genes are carried on plasmids belonging to the FIB
replicon.
4.4 Sequencing and genetic comparison of ESBL-producing (SAP44) and non-ESBL-
producing (SAP24) avian E. coli O78 isolates
APEC belonging to the O78 serogroup are the most prevalent serogroup linked to
diseases in poultry (Schouler et al., 2012). In chapter 2, two of the E. coli isolates
were found to belong to the O78 serogroup, one of which harboured an ESBL
plasmid while the other did not. These strains were selected for further study in order
to determine whether the chromosomal content of ESBL-producing and ESBL-
negative isolates varies and/or may explain ESBL plasmid carriage. The fully closed
genome sequence of APEC O78 (CP004009) was used as a reference strain, and
ExPEC strains of different O-antigen types APEC O1 (PC000468), APEC O2
(PC005930) and urine pathogenic E.coli (UPEC O6, AE014075.1) were included as
‘out-groups’ in the analysis. These additional genomes were used to confirm the
validity of the comparisons and included in the final phylogenetic tree to facilitate
visualization of the relationships among E. coli populations.

128
De novo assembly of the SAP44 DNA sequence generated 203 scaffolds with
a predicted genome size of 4,686,633 nucleotides. For SAP24, de novo assembly
generated 225 scaffolds with a predicted genome size of 4,765 667 nucleotides.
Phylogenetic single nucleotide polymorphism (SNP) analysis of the assembled
genomes was performed to gain a better understanding of the genetic relationship of
the O78 strains, as well as their relationship to other ExPEC, including APEC O1,
APEC O2 and UPEC O6. The SNP based phylogenetic analysis is able to detect
non-related strains and group those that are related into one clade. As can be seen
in Figure 30, SAP24 and SAP44 were grouped together into one clade together with
the reference genome APEC O78 (PC004009). In contrast, APEC O1 and APEC O2
which belonged to different O-antigen groups are placed together in a single clade,
as a sub-clade of UPEC. Using the genomic sequence data, it was also possible to
perform multi locus sequence typing (MLST) to confirm the clonal complex of the test
strains. MLST is a typing method for bacteria based on the sequence of the internal
fragments of seven housekeeping genes (e.g. adk, fumC, gyrB, icd, mdh, purA and
recA). The DNA sequence of the tested strains were uploaded into the freely
available MLST database (www.warwick.ac.uk/mlst/dbs/Ecoli) to generate the
sequence typing number. MLST analysis clustered SAP44, SAP24 and the APEC
O78 reference strain into the same sequence type (ST23), consistent with what had
been found for the SNP analysis. In contrast, APEC O1, APEC O2 and UPEC O6
were each given a different clone number, of ST95, ST140 and ST73, respectively
suggesting that they were not so closely linked. Overall, the findings from the SNP
and MLST analysis confirmed that SAP24, SAP44 and reference O78 strain were
very closely related O78 strains.

129
Figure 30. Phylogenetic SNP tree of APEC O78 isolates
SNP Tree was used to produce a phylogenetic SNP tree: the number located on each node is a time scle root to 1.0, values near to 1.0 indicating the branch at the node exist with high probability. SAP24, SAP44 and APECO78 (reference) were placed into a single clade. APECO1 and APECO2 are in single clade were closely related to UPEC.

130
The scaffolds of SAP44 and SAP24 were reordered based on the genome of the
APEC O78 reference strain (Mangiamele et al., 2013(CP004009)) using the Mauve
contig mover. In Figure 31, regions that are shared between the three strains appear
as blocks of the same colour whereas regions of difference are represented by
‘white’ gaps, which were mostly a result of insertion by prophage-associated genes.
To facilitate analysis, the differences found in the strains was investigated using a
fully automated service for annotating bacteria genomes, Rapid Annotation
Subsystem Technology (RAST) (www.rast.nmpdr.org). This program detects protein
coding regions, assigns function to genes and predicts which subsystems are
represented in the genome.
The reference APEC O78 strain has a chromosome which is 32 kb larger than
that of SAP24, and 112 kb larger than that of SAP44. Within APEC O78 reference
strain 4,644 chromosomal genes were predicted, whereas SAP24 and SAP44 were
predicted to contain 4,584 and 4,503, respectively. The genome of APEC O1 and
APEC O2 strains were also included in this analysis to validate the comparison
among APEC O78 strains and to identify the common virulence genes that are
shared by APECs. The data generated from RAST showed that the APEC O78
genomes shared many genes normally found in E. coli and identified several
virulence genes associated with APECs including adhesins, invasin and iron
acquisition systems (Table 16). (Complete list of gene functions found in APEC O78,
SAP44 and SAP24 are listed in additional file on a CD enclosed within this thesis).

131
Figure 31.Genome comparative analysis of SAP24, SAP44 and the APEC O78
reference strain
Comparative mauve analysis between the core scaffolds of each whole genome sequence of SAP44, SAP24 and a reference genome, the closely related E.coli APECO78. Predicted sequence homology among all three genome sequences is represented by colour matching regions. Regions within black boxes are identified phage sequences and phage associated regions. Sequence below the line of SAP24 represents a predicted inversion, based on scaffold tiling to the APECO78 reference.

132
Table 16. General features counts of the SAP24, SAP44, APEC O78 (reference strain), APECO1
and APECO2
Genome features APEC O78 SAP24 SAP44 APECO1 APECO2
Genome size (bp) 4,798,435 4,765,667 4,686,633 5,082,025 4,929,051
Possibly missing genes 12 25 24 16 4
G+C content 50.68% 51.1% 51.7%
Number of coding sequence 4.644 4.584 4.503 5122 4827
Cell wall and Capsule:
Capsular and extracellular
polysaccharides
81 81 81 106 105
Gram negative cell wall
components
100 96 100 102 103
Virulence, Disease and
defence:
Adhesion 7 7 7 7 7
Toxins and super antigens 0 0 0 6 0
Bacteriocins, ribosomally
synthesized antbacterial
peptides
12 12 12 12 12
Resistance to antibiotics and
toxic compounds
74 75 76 73 77
Invasion and intracellular
resistance
15 13 13 14 14
Phages, prophages 71 48 48 218 124
Membrane transport 202 204 203 231 233
Iron acquisition and
metabolism:
Siderophores 15 36 15 15 14
Iron acquisition 8 9 8 34 34
RNA metabolism 248 247 247 253 254

133
Protein metabolism 299 291 289 299 299
Cell Division and cycle 37 39 37 37 37
Motility and chemotaxis 84 83 82 81 79
Regulation and cell signalling 154 158 153 152 151
Secondary metabolism 26 26 26 5 5
DNA metabolism 134 127 129 134 136
Fatty acids and lipids and
isoprenoids
134 135 133 138 136
Potassium metabolism 28 28 28 30 29
Nitrogen metabolism 75 74 74 72 72
Respiration 193 191 191 183 179
Stress response 190 188 189 190 191
Metabolism of aromatic
compounds
27 27 27 3 3
Amino acids and derivatives 396 397 394 419 405
Sulfur metabolism 57 57 58 58 59
Phosphorus metabolism 54 54 54 51 51
Carbohydrates 774 768 768 838 837
Cofactors, vitamins and
pigments
283 283 284 294 298
Function based comparison of APEC related strains belong to the same O78 type APEC O78 (reference strain), SAP24 (non ESBL APEC) and SAP44 (ESBL producing APEC).
Strains belonging to the O78 serogroup (e.g. SAP44, SAP24 and APEC O78
(CP004009) generally have the same number of features as defined by the RAST
system (see Table 16). For example, SAP44, SAP24 and APECO78 contained 12
bacteroicins each. However, almost twice as many phage and prophage features
were found in APECO78 as compared to SAP44 and SAP24. Furthermore, the non-
ESBL-producing SAP24 isolate contained more than twice the number of
siderophores as either SAP44 or APECO78.

134
The number of features shared by the APEC O78 serogroup isolates and
APEC O1 / APEC O2 genomes was largely similar, with the exception of the number
of regions related to phages, siderophores and some metabolic capabilities (Table
16). For example, there was 3-5-fold less prophage elements in O78 than APEC O1
and APEC O2 whereas there was 9-fold more regions related to aromatic
metabolism compounds in O78 than APEC O1 and APEC O2.
All the genomes contained siderophores such as enterobactin, aerobactin and
ferrous iron transporter system, EfeUOB. In addition, APEC O1 and APEC O2
genomes have haemin uptake and utilization systems, which are not found in the
O78 genome strains. Interestingly, the metabolism of the isolates seemed to differ.
For example, the degradation enzymes of the aromatic compounds,
phenylpropionate (PP) and cinnamic acid (CA), were only found in the genome of
O78 strains while the ribulose monophosphate pathway was only identified in the
APEC O1 and APEC O2 genomes. CMP-N-acetylneuraminate biosynthesis was only
identified in the genome of APECO1 and APECO2 and not in the O78 strains.
However, other polysaccharide protein structures were predicted including
derivatives of N-acetylneuraminate such as sialic acid metabolism.
Few phages and prophages were detected in SAP24 and SAP44 compared to
the O78 reference strain. However when the number of phages in APEC O78 strains
compared to other APEC strains it showed 3 to 5 fold less which indicate that the
genome of O78 type is much conserved than other type of APECs (Table 16).
Given that RAST identified that the number of phage-associated regions was
different between the APEC O78 strain genomes, the PHAST server was used to
further annotate prophage sequences within the bacterial genomes
(http://phast.wishartlab.com). PHAST server is a tool server to identify and annotate

135
prophage sequences from raw DNA sequence or Genbank format with 94%
predictive value.
Ten phage –associated regions designated Phage Regions (A1-A10), seven
designated (B1-B7) and 7 designated (C1-C7), were identified in APEC O78, SAP24
and SAP44 respectively (Table 17). Three of the ten phage regions in the APEC O78
were identified to be intact prophages by PHAST whereas just one of the seven
SAP44 and none of the SAP24 phage regions were identified as intact. The majority
of these phages were composed of > 70% phage genes and some hypothetical
genes. Incomplete phage region A5 and B1 of APEC O78 and SAP24 respectively
were mostly similar to lambda phage and encoded the increased serum survival
gene, bor. Also three of the incomplete Phage regions A1, A4 and A9 of APEC O78
along with three incomplete Phage regions C1, C6 and C7 of SAP44 were similar to
Phage mEP460 and encoded a transcriptional activator of EaeA/BfpA expression in
enteropathogenic E.coli. Each genome examined has at least three unique phage
regions not found in the other organisms, but also shared at least one phage region
between one another. Interestingly, an incomplete Stx2-converting prophage was
identified in SAP44. The stx2 genes are usually found on the genome of lambdoid-
like bacteriophages integrated in the chromosome of their bacterial hosts (Strauch et
al., 2001).

136
Table 17. Phage associated regions identified by PHAST.
1percent identity of the region compared to the PHAST annotation. 2percentage of identified ODRs that encode phage or
hypothetical genes. 3 PHASTs prediction of whether each prophage encodes the genes necessary for lysogeny.
E.coli APEC O78
Region Region Position (bp) Size(kb) PHAST Annotation Annotation identity1
(phage Identity)2
PHAST
Prediction3
A1 569218-590142 15.1Kb mEp460 NC_019716 43.55% (70.5%) incomplete
A2 648202-703555 41.3Kb SfV NC_003444 50.43% (92.8%) intact
A3 1813936-1847980 42.2Kb SfII NC_021857 50.61% (89.4%) intact
A 4 2384488-2397576 27.6Kb mEp460 NC_019716 46.81% (75.7%) incomplete
A 5 2797858-2811582 23.8Kb Lambda NC_001416 45.61% (93.5%) incomplete
A 6 3000640-3041713 16.1Kb RE2010 NC_019488 47.40% (82.6%) incomplete
A 7 3151597-3186778 36.6Kb P2 NC_001895 50.44% (88.8%) intact
A 8 569218-590142 8.3Kb PhiCh1 NC_004084 47.43% (54.5%) incomplete
A 9 648202-703555 49.9Kb mEp460 NC_019716 46.05% (68.1%) incomplete
A 10 1813936-1847980 18.6Kb SfIV NC_022749 45.03% (75%) incomplete
Non ESBL APEC O78 (SAP24)
Region Region Position (bp) Size(kb) PHAST Annotation Annotation identity1
(phage Identity)2
PHAST
Prediction3
B1 569218-590142 20.9Kb Lambda NC_001416 49.5% (76.4%) incomplete
B 2 648202-703555 55.3Kb Fels 2 NC_010463 51.1% (56.8%) incomplete
B 3 1813936-1847980 34Kb L 413C NC_004745 51.5 % (85.1%) incomplete
B 4 2384488-2397576 13Kb RE 2010 NC_019488 49.3% (60%) incomplete
B 5 2797858-2811582 13.7Kb P2 NC_001895 47.9% (61.9%) incomplete
B 6 3000640-3041713 41Kb SfIV NC_022749 50.9 % (76.1%) incomplete
B 7 3151597-3186778 35.1Kb P88 NC_026014 52 % (85.7%) incomplete
ESBL producing APEC O78 (SAP44)
Region Region Position (bp) Size(kb) PHAST Annotation Annotation identity1
(phage Identity)2
PHAST
Prediction3
C1 845590-865476 19.8Kb mEp460 NC_019716 47.6 % (78.5%) incomplete
C 2 1167076-1176957 9.8Kb Cronob ENT39118
NC_019934
47.7 % (41.1%) incomplete
C 3 1378183-1389753 11.5Kb Stx2 converting I
NC_003525
46.7 % (77.2%) incomplete
C 4 1407964-1447393 39.4Kb Yersin L 413C
NC_004745
51.2 % (83.8%) questionable
C 5 2997477-3034017 36.5Kb Fels 2 NC_010463 52.3 % (88.8%) intact
C 6 3244105-3255375 11.2Kb mEp 460 NC_019716 50.7 % (78.9%) incomplete
C 7 3819696-3862920 43.2Kb mEp 460 NC_019716 50.5 % (54.7%) incomplete

137
To further assess differences between the three genomes, IslandViewer software
(Dhillon, 2015) was used to identify putative genomic islands (GIs). Island Viewer is
a tool server that integrates three different genomic island prediction methods:
IslandPick, IslandPath-DIMOB, and SIGI HMM to produce a comprehensive list of
islands (http://www.pathogenomics.sfu.ca/islandviewer/).
The SAP44 genome was found to contain 42 genomic islands (GI-1 to GI-42)
ranging in size from 4 kb to 30 kb whereas SAP24 contained 37 genome islands (4
kb to 35 kb) and the APEC O78 reference genome contained 48 genomic islands (2
kb to 30 kb) (Figure 32 – 34).

138
Figure 32. Genomic Islands in SAP44
Genomic islands in SAP44 were predicted using Islandviewer software. Genomic islands are plotted to scale and labelled clockwise on the genome map.
Figure 33. Genomic Islands in SAP24
Genomic islands in SAP24 were predicted using Islandviewer software. Genomic islands are plotted to scale and labelled clockwise on the genome map.

139
Figure 34. Genomic Islands in APEC O78
Genomic islands in APECO78 (reference) were predicted using Islandviewer software. Genomic islands are plotted to scale and labelled clockwise on the genome map.

140
Approximately half of the genomic islands in SAP44 and APECO78 code for
defective prophages. Conversely, SAP24 chromosome has less prophage-related
genes representing only 14% of the genomic islands. Four GIs in SAP44 and
APECO78 and 5 in SAP24 were detected to be fimbrial islands (Table 18). EmrKY-
ToIC multidrug resistance efflux pump and the sensor kinase, EvgA involved in acid
resistance was only found in APECO78. Genomic islands involve in transport and
metabolism of various sugars and iron uptake system were identified in all APEC
genomes (Table 19).
One genomic island coding for the biofilm PgaA and PgaB synthesis
lipoprotein was identified in both SAP24 and SAP44 genomes but not in the
APECO78 reference. The genomic regions coding for a type 3 secretion system
were identified in all APEC strains, in addition the SAP24 genome also contains type
IV secretion. While GIs involved in lipopolysaccharide or capsular polysaccharide
biosynthesis predicted in all studied genomes, less were found in SAP44 and
APECO78 genomes. A complete analysis of all the genomic islands and their gene
content is beyond the scope of this thesis, however a full list of this information can
be found on CD enclosed with this thesis.

141
Table 18. Genomic islands (GIs) in APEC strains.
CHARACTERISTICS OR TRAIT
ENCODED
SAP44 SAP24 APEC O78
(REFERENCE
STRAIN)
DEFECTIVE PROPHAGES GI-12,GI-13,GI-14,GI-
15,GI-16,GI-17,GI-
18,GI-24,GI-25
GI-18,GI-23,GI-
25,GI-27,GI-28
GI-2,GI-4,GI-
9,GI-10,GI-13,GI-
14,GI-17,GI-
18,GI-19,GI-
21,GI-30,GI-31
FIMBRIA ISLANDS GI-7,GI-8,GI-23,GI-31 GI-7,GI-8,GI-
17,GI-18,GI24
GI-7,GI-11,GI-
29,GI-36
LIPOPOLYSACCHARIDE OR CAPSULAR
POLYSACCHARIDE BIOSYNTHESIS
GI-30 GI-18,GI-22 GI-35,GI-47,GI-48
EMRKY-TOIC MULTIDRUG
RESISTANCE EFFLUX PUMP AND THE
SENSOR KINASE,EVGA INVOLVED IN
ACID RESISTANCE
GI-39
METABOLIC ISLANDS CODE FOR
TRANSPORT AND METABOLISM OF
VARIOUS SUGARS
GI-5,GI-22,GI-39,GI-
41
GI-18,GI-31,GI-
32,GI-35
GI-34,GI-44,GI-45
IRON UPTAKE SYSTEM GI-2,GI-3 GI-2,GI-18 GI-4
BIOFILM PGA SYNTHESIS
DEACETYLASE PGAB AND BIOFILM
PGA OUTER MEMBRANE SECRETIN
PGAA
GI-19 GI-13
TYPE III SECRETION SYSTEM GI-37 GI-30 GI-43
TYPE IV SECRETION SYSTEM GI-18
Summary of the genomic Islands (GIs) in SAP44, SAP24 and APECO78 genomes were predicted using IslandViewer.

142
Table 19. Presence or absence of virulence genes in APEC isolates
Genes Presence or absence of iron uptake
determinant in the following APEC strain:
SAP44 SAP24 APECO78
Ferric citrate fecEDCBARI + + +
Yersiniabactin (ybtSXQPA-irp2-irp1-ybtUTE). - + -
Aerobactin sidrophore receptor + + +
Type1 fimbrial adhesin + + -
Putative avian haemolysin + - +
Type 3 secretion system(T3SSs) proteins homologs to that of
Yersinia proteins (YopD and YscJFUTQ)
+ + -
Type 3 secretion system(T3SSs) proteins homologs to that of
Salmonella and Shigella protiens (EprKJIH,EpaRQ and
SpaSPO)
- - +
Type 4 secretion system (T4SSs) - + -
N-acetyl neuraminic acid capsule + + +
Biofilm pgaA and pgaB + + -
Iron decitrate ABC transport and Iron uptake genes were detected in different APECO78 isolates (-) means the genes absent and (+) means the genes is present.

143
4.5 Discussion
The overall aim of this chapter was to characterise the CTX-M plasmid found in three
APEC strains, including one belonging to the O78 serogroup. In addition, a IncFIB
plasmid present in one of the test strains was also characterised because APEC
virulence genes are mostly located in large plasmids belonging to IncFIB replicon
type. Moreover, analysis of the plasmid enables the study of the effect of two large
plasmids within one host bacterium, a common occurrence in APEC strains. While
plasmids may confer new phenotype(s) to the host cell, it was deemed important to
study what effect a plasmid may have on the host genome structure. To do this, two
avian E. coli isolates, one an ESBL-producer and one not, and belonging to the
same O-antigen group, were compared.
There were differences found in the number and size of plasmids harboured
by the individual strains. SAP24 harboured at least three plasmids ranging in size
from approximately 6 kb to 60 kb. However, PCR-based Inc typing did not identify
the replicon types of these plasmids and as a result they were considered as ‘un-
typable’. In contrast, SAP44 harboured two large plasmids with a size greater than
100 kb. In this study, the complete annotated sequence of the SAP44 plasmids
(pSAP44 and pFIB44) was characterised. The IncI1 plasmid with a size of 105,610
bp (pSAP44) was demonstrated to carry resistance and virulence genes such as
CTX-M-1 coding for the ESBL enzyme and Col1b coding for colicin 1b. Moreover,
comparative analysis of pSAP44 with pC49-108 and R64 plasmids showed that
differences in DNA content mainly with respect to the presence of mobile genetic
elements and insertion sequences whereas regions involved in plasmid mobility,
stability, and transfer were largely identical and conserved among IncI1 plasmids.

144
The pC49-108 plasmid showed high identity and coverage of DNA sequence
to that of pSAP44 at 99%. However, a 5.0 kb region of the class 1 integron
(aadA5,dftA17,IntI1) and the insertion sequence Tn1722 in pC49-18 were absent in
pSAP44, being replaced by a 3.0 kb insertion sequence coding for tetracycline
resistance genes. It is believed that tetRA and adjacent genes are linked with a
direct repeat sequence (cgcccgcagca) which might serve as a location for the
deletion and/or insertion of new mobile elements (Chiu et al., 2005). However, this
feature was not detected in SAP44. Instead, the flanking region of pSAP44 and
pC49-108 contained an inverted repeat sequence of 7 bp (tatttgc-ataaacg). The fact
that the inverted repeat sequences flanked the same region in two separate
plasmids belonging to the same Inc type, may suggest it plays a role in the deletion/
insertion of new mobile genetic elements and promote the evolution of IncI1
plasmids.
The CTX-M-1 genes has been found in other plasmids belonging to different
Inc types with the ISEcp1 or other insertion elements such as IS26 in IncF,IncB/O
and IncN (Wang, 2015). ISEcp1 has been extensively characterized and found to be
important in the dissemination of blaESBL genes in Enterobacteriaceae, including E.
coli strains (Poirel et al., 2008). Furthermore, it was found that ISEcp1 has dual
function by which it can act as a transposase and also regulate the expression of the
downstream open reading frame (ORF) (Jacoby, 2009). By comparing the nucleotide
sequence of the ISEcp1 in the IS database (http://www-is.biotoul.fr/page-is.html), it
was found to belong to the IS1380 family (100% identity). The IS1380 family is
known for their ability to mobilize easily and efficiently among different bacterial
species which may explain the high prevalence of CTX-M genes (Jacoby, 2009).

145
The traABCD genes are always found upstream of the replication region and
are usually responsible for DNA transfer (Takahashi et al., 2011). However, traD was
not detected in pSAP44 or pC49-108 plasmids. This was surprising as traD has
previously been found upstream of the traABC genes and is considered part of this
gene system (traABCD) (Sampei et al. 2010). Furthermore, one of the pil genes
(pilJ) which is missing in pSAP44 and pC49-108. In general, the pil genes have a
role in the formation of type IV pilus, which are important in the conjugation process
(Sampei et al., 2010). It might be noted that the presence of traD and pilJ genes is
not essential for the conjugation process at least in pSAP44, as this plasmid was
able to transfer to other bacterial strains.
The col1b gene was detected in pSAP44, showed similar homologous
structure to that found in pC9-108 and R64. Colicins are antimicrobial peptides which
are encoded on plasmids and regulated as part of SOS response as a result of
cellular stress (Glazebrook et al., 1983). The toxin is fatal for the producing cell and
any cells in the surrounding environment that are sensitive to the colicin (Riley &
Wertz, 2002). The plasmid-encoded colicin gene cluster normally includes a gene
coding for an antibacterial toxin, a gene encoding an immunity protein to protect the
producing cells and a gene coding for a lysis protein to release the colicin from the
producing cell (Riley & Wertz, 2002). The prevalence of colicin-producing E.coli
strain has been well established. Colicin EI and Ia are described as the most
commonly detected colicins in E. coli (Gordon & O’Brien, 2006). Colicin I1 is carried
on a conjugative plasmid and is readily acquired by E. coli populations (Gordon &
O’Brien, 2006). The same can be said to colicin B, M and V which are mostly found
in animal E. coli isolates, including APEC strains (Christenson & Gordon, 2009; Pinto
Da Rocha et al., 2002).

146
The IncFIB plasmid found in SAP44 carries several virulence genes including
an iron uptake system (hemolysine) and a gene coding for increase serum survival.
Replicons belonging to IncFIB and colicin-associated plasmids were found to be the
most common Inc types among APEC isolates followed by IncI1 type (Johnson et al.,
2007). It is believed that APEC virulence is mostly associated with virulent genes
encoded on large conjugative plasmids such as the ColV plasmids (Johnson &
Nolan, 2009). pFIB44 showed high identity to both ColV and ColBM plasmids. It is
believed that ColBM plasmids evolved from ColV plasmids as their genetic content
and organisation are highly similar (Johnson & Nolan, 2009). In general all these
plasmids belong to IncFIB type and some of the most commonly found virulence
genes include those coding for iron acquisition (sitABCD), serum resistance (iss),
hemolysin protein (hlyF), putative outer membrane protease gene (ompT), and
temperature sensitive haemagglutinin (tsh) (Johnson & Nolan, 2009).
Although plasmid pSAP44 was readily transfered to other E. coli strains
(section3.2.3), the pFIB44 plasmid was not detected in the recipient strains by PCR.
Analysis of the tra region of pFIB44 revealed that several important tra genes are
missing. Important tra genes were also missing from pAPEC-1 and this plasmid was
only transfered to other recipient strains through the use of transfer machinery from
other conjugative plasmids (Mellata et al., 2009). In SAP44, however it seems that
pSAP44 could not compensate for the defective conjugation apparatus of pFIB44.
The genomes of two E. coli O78 strains SAP44, SAP24 and the APECO78
reference strain showed a minor degree of genome plasticity. This plasticity was
evident in the presence and composition of plasmids, bacteriophages and
transposable elements (Table 16). Genomic island analysis detected that all APEC
examined strains possess type 3 secretion systems (T3SSs) and iron uptake
systems, but differences were found in which type of system was present. For

147
instance,SAP24 and SAP44 genomes code for T3SS with the proteins similar to that
found in Yersinia sp such as YopD and YscJFUTQ proteins whereas APECO78
strain codes for a T3SS with proteins similar of that found in Salmonella and Shigella
spp, like EprKJIH,EpaRQ and SpaSPO proteins (Table 19). In addition to T3SSs,
SAP24 was only strain found to have type 4 secretion system (T4SSs) by GIs
analysis. T4SSs are considered a versatile attribute that has a variety of functions.
Pathogenic Gram negative bacteria use it to translocate a wide variety of virulence
factors into the host cell or utilize it for horizontal gene transfer (Alvarez-Martinez &
Christie, 2009).
Other factors required for pathogenicity is the ability to acquire iron from the
surrounding environment when free iron is scarce. Generally, APEC has iron uptake
systems that rely on the production of siderophores as iron chelators, to bind and
form a complex of soluble Fe3+, which is transported back inside the bacterial cell
(Gao et al., 2012). In this study, several types of iron uptake systems were identified
in plasmid and chromosomal DNA. The SAP44 genome contains four iron
acquisition systems, one located in the chromosome (fecEDCBARI encode for ferric
citrate uptake) and three located on IncFIB plasmid (ironBCDN, sitABCD and iutA
iucABCD) (Table 19 and Figure 28). In contrast to SAP44, the sitABCD and
iucABCD systems were identified on the SAP24 chromosome, together with the
yersiniabactin gene cluster. It has been found that deletion of the chromosomal
yersiniabactin gene cluster significantly influenced the growth of E. coli O78 in an
iron-limited media compared to the deletion of any other plasmid-encoded iron
uptake system (Sagi, 2015). The yersiniabactin gene cluster was absent from SAP44
and the APECO78 reference genome. Perhaps, SAP44 could compensate for the
absence of this gene with other unknown functional genes located on its ESBL
plasmid (pSAP44).

148
Type 1 fimbriae were found in all APEC genomes in this study. APEC
adherence to chicken epithelial cells and trachea are mediated by type 1 fimbriae
which consists of major subunits such as fimA and minor subunits such as fimH
(Mellata et al., 2003). Type 1 fimbriae are believed to play a role in the early stage of
colonisation of the upper respiratory tract in poultry (La Ragione & Woodward, 2002).
Another study showed that the wild type of APEC O78 strains were significantly
better at adhering to human lung epithelial cells (A549) in an in vitro infection model
comparing to the fimH mutant strains (Musa et al., 2009). In a study carried out by
Mellata et al. (2003), type 1 fimbriae type were found to protect the bacterial cell from
being phagocytised.
The genome of all APEC O78 strains were found to contain degradation
enzymes for the aromatic compounds, phenylpropionate (PP) and cinnamic acid
(CA), that were not detected in APEC O1 and APEC O2. This could be specific
feature of O78 strains in that they have the ability to use these compounds as a sole
of carbon and energy source. In contrast, ribulose monophosphate (RuMP) was only
identified in APEC O1 and APEC O2 genomes. The RuMP was originally found in
methylotrophic bacteria which are able to utilize C1 compound as a sole of source of
carbon and energy (Fei et al., 2014).
Genetic differences were largely associated with the acquisition of prophage-
associated genes. This was confirmed by sequence alignment and RAST annotation
tools server. Specific prophages were common between the three studied strains
suggesting they may have been acquired prior to an evolutionary divergence.
Incomplete lambda prophage with 23 kb in size contains bro gene was identified in
SAP24 and the reference strain APECO78 (Table 17). This gene is associated with
increased serum survival and has identical sequence of iss genes located on ColV
plasmid (Lynne et al., 2007). Interestingly the Lambda prophage that carries this

149
gene was not detected in SAP44 chromosome, but instead SAP44 could
compensate for the absence of this gene by encoding the iss gene on its IncFIB
plasmid. Incomplete prophage-related genes with a size of 11.5 kb of the Stx2
converting phage I were only detected in SAP44. However, having an incomplete
prophage does not mean Shiga toxin is expressed and produced by SAP44. It is
possible that the complete Stx2 prophage I sequence was partially lost from the
SAP44 genome. Shiga toxin (Stx)-producing E. coli have been detected in many
species and the toxins can be found in many serotypes including the O78 type
(Nataro & Kaper, 1998).
In conclusion, the presence of multiple large plasmids is a defining feature of
the APEC (Johnson et al., 2007). However, the variability in the core genome of the
three O78 strains studied here was limited mainly to phages and mobile element
accessory genes. This would suggest that the APEC O78 serotype in general has a
conserved repertoire of genes, but a flexibility to harbour multiple plasmids without a
detrimental gene burden on the host bacterium. Analysis of IncII and IncFIB plasmids
demonstrated that they encoded resistance and virulence genes that may have a
role in the pathogenicity of APEC and indeed SAP44. The fact that the genomic
islands found in the APEC genomes studied here are showed high similarity which
suggests that these genomic islands have an influential role in the phenotype of
APEC belong to O78 type.
150
Chapter 5: Contribution of ESBL carriage on host
cell fitness

151
5 . Contribution of ESBL carriage on host cell fitness
5.1 Introduction
Plasmid carriage may positively, negatively or have no impact on the ‘fitness’ of a
host bacterium. Fitness is usually defined as the ability of an organism to survive,
proliferate and spread in a specific environment (Laurent et al., 2001). Thus fitness is
relative and may vary depending on the environmental niche the organism occupies.
For example, plasmids carrying antibiotic resistance genes may confer a clear
benefit to the host bacterium when located in an infected individual undergoing
antibiotic treatment, but appear neutral when the organism resides in the non-host
environment or in the absence of that selection pressure. Finally, any fitness ‘cost’
may change over time due to changes in the plasmid or changes in the host
bacterium (Dahlberg & Chao, 2003), and fitness-related compensatory mutations
have been described in a number of organisms (Barrick et al.,2010; Björkman et al.,
2000; Levin et al., 2000).
Fitness costs related to plasmid carriage may be associated with the process
of plasmid maintainance and/or the expression of specific genes on the plasmid
(Dahlberg & Chao, 2003). Plasmid maintainance costs are believed to be as a result
of the cellular activities required to maintain a plasmid in the host via the processes
of replication and partitioning at every generation (Ebersbach & Gerdes, 2005).
Conversely, the expression of resistance genes may interfere with bacterial growth
or other cellular functions causing a decrease in host cell fitness (Turner et al.,
1998).
The fitness of bacteria within a specific ecological niche and an increased
selective advantage may occur by the acquisition of traits that are not found in other
competitive strains. In terms of pathogenic bacteria, such as ExPEC and APEC, the

152
acquisition of resistance and virulence plasmids may increase fitness under several
conditions (Hacker & Carniel, 2001).
The overall aim of this chapter was to assess the contribution of the ESBL-
harbouring plasmids to the fitness of the host APEC isolates, as well as to examine
their impact on the fitness of related avian and laboratory E. coli strains.
Furthermore, given that APEC usually harbour several large plasmids, where
possible using the bacterial derivatives described in chapter 3, the impact of the
virulence plasmid (pFIB44) was also explored. These experiments tested the
hypothesis that carriage of ESBL plasmids may decrease growth or survival of the
host bacterium during stressful environmental conditions. As such, APEC isolates
and their derivatives were studied under different environmental conditions including
low iron, low pH and nutrient-poor conditions, as well as when in competition with
other microorganisms.
The objectives of this chapter were to:
Determine the impact of ESBL plasmid acquisition on host growth in rich and
minimal media in single strain or competition growth experiments
Assess whether the ESBL plasmid confers a fitness cost to plasmid-
containing and plasmid-free isolates using a competitive growth assay.
Evaluate bacterial growth under low iron and low pH conditions in order to
uncover additional beneficial traits associated with ESBL plasmid carriage in
APEC
Assess the transmissibility of the ESBL plasmid to avian (O78) and laboratory
E. coli K12 isolates by performing conjugation assays, under different pH
conditions

153
Determine the transmissibility of the ESBL plasmid in an ex vivo model of the
chicken caecum in order to evaluate the extent of this process under more
realistic in vivo conditions
5.2 Impact of APEC plasmids on bacterial growth
5.2.1 Single strain growth in nutrient-rich media
To begin to examine whether carriage of ESBL plasmids confers a metabolic burden
to the host bacterium, single strain growth curves were performed on the wildtype
APEC strains and their cognate pESBL-cured derivatives. The generation time of the
3 wildtype APEC (SAP44, SAP45 and SAP46) in nutrient-rich media was similar and
ranged between 19 – 21 minutes. As can be seen in Table 20, loss of both plasmids
(pSAP44 (ESBL) and pFIB44) from SAP44 did not significantly alter the generation
time of the parental strain (see appendix I for growth curves). In addition, loss of
ESBL-producing plasmids from the other two APEC strains SAP45 and SAP46 also
did not affect the organisms’ growth. Finally, transfer of the pSAP44 ESBL plasmid to
a naïve non-ESBL-producing APEC strain (SAP24) or to a laboratory E. coli K12
strain (SAP59) did not significantly alter the generation time of the transconjugant
compared to the plasmid-free host strain (Table 20). These results suggest that
carriage of large plasmids including those coding for ESBLs, does not appear to
impact the growth of the organisms under the conditions of the study. However, the
fitness of an organism can vary under different environmental conditions (Keller &
Surette, 2006) and hence further analysis of the strains was performed to investigate
this in more detail.

154
Table 20 Generation time of wildtype APEC and cured derivatives.
name serotype host / plasmid content generation time
(mins) (mean ±
SD)
Significance level
Strains derived from wild type APEC strains SAP44 O78 APEC / pSAP44
(ESBL) + pFIB44 19 ± 0.03
NS SAP44 cured - APEC / none 20 ± 0.05
SAP45 O7 APEC / pIncI1 (ESBL) + pIncFIB + pIncFIA
20 ± 0.07
NS SAP45 cured - APEC / pIncFIB +
pIncFIA 20 ± 0.06
SAP46 O15 APEC / pIncI1 (ESBL) 21 ± 0.03
NS SAP46 cured - APEC / none 20 ± 0.06
ESBL transconjugants
SAP24 O78 APEC / multiple non-typeable plasmids
18 ± 0.04
NS SAP140 - SAP24 / pSAP44 18 ± 0.06
SAP59 K12 E. coli / none 22± 0.07
NS SAP56 - SAP59 / pSAP44 25 ± 0.06
Bacteria were inoculated in LB media as single strain growth experiments performed
at 37˚C with shaking for 8 h. Generation times were calculated based on the
maximum rate of growth and data were compared using Student’s t test. Data are
mean of 3 independent experiments ± standard deviation (SD).

155
5.2.2 Competitive growth experiments in defined minimal media
Competitive growth experiments where equal numbers of organisms are mixed
together and grown over successive days, offers a more sensitive way to detect
differences in an organisms’ fitness (Lenski, 1998). Thus, pair-wise competitive
growth experiments were set up to study the impact of plasmids on SAP44 (wildtype
APEC) growth as well as that of E. coli transconjugants harbouring pSAP44.
Changes in population size were measured by counting CFU following serial dilution
and plating on selective media. As well as changes in population density, the data
were expressed as Relative Fitness (RF) values which are calculated as the ratio of
the increase of each population from time 0 to the end of the experiment at 7 days
(Lenski, 1998). Given that sequencing revealed the ESBL plasmids of the 3 wildtype
APEC to be identical, these studies focused on SAP44 as isogenic derivatives which
contained one or both of the large plasmids naturally present in the organism, were
available (see below). Finally, pair-wise comparisons between plasmid-containing
and naïve non-ESBL-producing APEC (SAP24) strains were carried out because
SAP44 and SAP24 belonged to the same serogroup.
As shown in Chapter 3 and 4, wild type SAP44 carries two large plasmids
(named pSAP44 and pFIB44) of about 100 kb in size. Curing the ESBL plasmid
(pSAP44) from the host strain resulted in the generation of two derivatives,
SAP44(plasmidless) in which both plasmids had been lost and SAP44F, in which
pSAP44 (ESBL) had been lost but pFIB44 was retained. The complemented
derivative, SAP44C, was subsequently generated by re-introducing pSAP44 into
SAP44-cured by conjugation. It was not possible to generate a derivative
complemented with pFIB44 in the same way because of the lack of a selectable
marker on this plasmid. Therefore, these 3 derivative strains of SAP44 were used to

156
investigate the impact of large APEC plasmids on the fitness on the host strain as
well as on the fitness of a naïve non-ESBL-producing APEC (SAP24).
Table 21 Relative fitness (RF) values of plasmid derivatives following pair-wise
competitive growth experiments.
Strain A host / plasmid content
strain B host / plasmid content
relative fitness (RF)1,2
P value3
SAP44 APEC / pSAP44 + pFIB44
SAP44-cured
APEC / none 0.8 <0.05
SAP44 APEC / pSAP44 + pFIB44
SAP44F APEC / pFIB44
1 NS
SAP44-cured
APEC / none SAP44C SAP44-cured / pSAP44
1 NS
SAP44F APEC / pFIB44 SAP44C SAP44-cured / pSAP44
0.75 <0.05
SAP24 APEC / untypeable plasmids
SAP140 SAP24 / pSAP44 + untypeable plasmids
1 NS
1Pair-wise competitive growth experiments were carried in DM media and values represent the mean of at least 3 independent experiments. 2RF values were calculated 3RF values were compared to a theoretical value of 1 using Z score test.

157
5.3 Competition of the wild type SAP44 (ESBL) against its cured derivative strains.
First, wildtype SAP44 containing both plasmids (pSAP44 and pFIB44) was competed
against the plasmidless derivative strain SAP44-cured. During the first 48 hours of
co-culture, approximately equal numbers of the two strains were maintained in the
population (Figure 35). Thereafter, the number of wild type SAP44 cells significantly
decreased by 2 logs and remained at this level for the rest of the experiment. The
relative fitness (RF) value was 0.8 ± 0.004, which was significantly less than 1
indicating that the plasmidless SAP44-cured strain outcompeted the wild-type (Table
21).
Figure 35.Competitive growth of wild type APEC strain SAP44 and the plasmid-cured
derivative
In c u b a tio n T im e b y D a y s
Lo
g o
f C
FU
/ml
0 2 4 6 8
5
6
7
8
9
S A P 4 4 (W T )
S A P 4 4 (p la s m id le s s )
In a competition growth assay in a minimal media (MD25) supplemented with glucose (25mg/ml) as a carbon source. The presence of the ESBL and FIB plasmids (pSAP44 and pFIB44) indicated cost fitness in the wild type strain SAP44 (WT) when co-cultured with its derivative plasmidless strain SAP44. The fitness impact was estimated as <1.0 by calculating the selection rate constant from at least three biological and two technical repeats.

158
Next, in order to find out which plasmid contributed to the change in fitness, wild type
SAP44 was first competed against SAP44F, the pESBL-negative but pFIB44-
containing SAP44 derivative. There was no fitness cost detected in this competitive
assay as the RF value was approx. 1.0 (Figure 36). This suggests that pESBL had
no detrimental effect on the organisms’ growth. Consistent with this finding, a
competitive growth experiment between the plasmidless strain, SAP44-cured, and
the complemented strain harbouring pSAP44 (SAP44C), gave rise to an RF value
close to 1 (Figure 36). Finally, when SAP44F (which contains pFIB44) was competed
against SAP44C (which contains pSAP44), SAP44C outcompeted SAP44F with a
relative fitness cost <0.75 (Table 21). When taken together these results indicate that
the fitness deficit associated with the native strain was attributable to carriage of
pFIB44 rather than the ESBL-producing plasmid, pSAP44. Unfortunately, the lack of
a selectable marker on pFIB44 precluded direct testing of SAP44F against SAP44-
cured in the competitive growth assay.

159
Figure 36. Competitive growth assay of SAP44WT and its derivative strains.
0 2 4 6 8
4
5
6
7
8
T im e in d a y s
Lo
g o
f C
FU
/ml
S A P 4 4 (W T )
S A P 4 4 F
in c u b a tio n T im e b y D a y s
Lo
g o
f C
FU
/ml
0 2 4 6 8
5 .0
5 .5
6 .0
6 .5
7 .0
7 .5
S A P 4 4 (p la s m id le s s )
S A P 4 4 C
A B
In a competition growth assay in a minimal media (MD25) supplemented with glucose (25mg/ml) as a carbon source. A:The presence of the ESBL and FIB plasmids (pSAP44 and pFIB44) did not indicate cost fitness in the wild type strain SAP44 (WT) when co-cultured with its derivative strain SAP44F (containing only pFIB44). B: The plasmidless strain complemented with ESBL plasmid SAP44C (pSAP44) did not indicate cost fitness when co-cultured with its ancestor plasmidless strain. The fitness impact was estimated as =1.0 by calculating the selection rate constant from at least three biological and two technical repeats. .

160
5.4 Competition of the wild type SAP24 (non-ESBL) against its derivative SAP140
(ESBL).
To investigate whether the ESBL-producing plasmid (pSAP44) affects the fitness of
a naïve non-ESBL-producing APEC strain, pSAP44 was introduced by conjugation
into SAP24. The resultant cefotaxime resistant transconjugant was designated
SAP140. Co-cultures of SAP24 and SAP140 were subject to the competitive growth
assay as described above. As can be seen in Figure 37, there was no significant
fitness cost associated with carriage of pSAP44 as similar numbers of SAP24 and
SAP140 colonies were recovered in both nutrient-rich and defined minimal media.
Consistent with this, the mean RF value in the two different media was approx. 1.0.
(Table 21).In summary, these studies indicate that carriage of SAP44, a large ESBL
plasmid, had no significant impact on the growth of APEC under the conditions used
in these experiments.
Figure 37.Competitive growth assay of non-ESBL SAP24 and its derivative strain.
T im e in h o u r
lo
g C
FU
/m
l
0 2 4 6 8 1 0
5
6
7
8
9
1 0
S A P 2 4
S A P 1 4 0
T im e in (d a y s )
lo
g C
FU
/m
l
0 2 4 6 8
4
5
6
7
8
S A P 2 4
S A P 1 4 0
A B
In a competition growth assay in LB broth media, the presence of the ESBL plasmid (pSAP44) in SAP140 did not indicate a fitness cost when co-cultured with its ancestoral non ESBL strain SAP24 (A). The same also can be said in a competition growth assay in minimal media (MD25) supplemented with glucose (25 mg/ml) as a carbon source (B).The fitness impact was estimated as =1 by calculating the selection rate constant from at least three biological and two technical repeats. .

161
5.5 ESBL plasmids enhance the growth of APEC O78 type in iron-limited media
In chapter 4, one difference noticed between pFIB44 and pSAP44 was that the
former contained genes which coded for an ABC iron uptake locus eitABCD (Figure
28). Since available iron is often limiting in the environment as well as in the intestine
of humans and animals (Fischbach et al., 2006), it was postulated that the different
plasmids may affect the ability of organisms to scavenge iron and grow in iron-limited
environments. Therefore, the impact of each plasmid on APEC fitness was examined
in single strain growth experiments performed under iron-limited (minimal media +
1.5 uMFeSo4 + 100 uM 2,2-dipyridyl) or iron-replete conditions (minimal media + 1.5
uM FeSO4). As previously, SAP24 and the ESBL-producing transconjugant SAP140,
were included in order to examine the impact of pSAP44 in a related but different
strain background.
Compared to growth in iron-replete M9 media (see Figure 38 ), SAP44 grew
slowly and reached a final cell density (107 cfu/mL) that was approx. 100-fold lower
(Figure 38). The plasmidless derivative SAP44-cured followed a similar growth
kinetic during the early stages of growth, but after 38 hrs incubation, cell numbers
steadily increased to reach ~108 cfu/mL. The presence of either pFIB44 or pSAP44
increased the growth of strains in the iron-limited environment although each
derivative exhibited different growth kinetics (Figure 39). While SAP44F, which
contains pFIB44, increased the rate of growth throughout the incubation period,
SAP44C, which contains pSAP44, only resulted in increased growth from approx. 20
hrs. Thus while the presence of both plasmids reduced the growth of SAP44, the
presence of either plasmid conferred a growth advantage.

162
In order to verify the effect of pSAP44 on organism growth under iron-limiting
conditions, single strain growth experiments were also carried out using SAP24 and
the ESBL-producing transconjugant, SAP140. As found previously, the presence of
pSAP44 significantly (p<0.05) increased the growth of the host bacterium after ~20
hrs in iron-limited media (Figure 39). Similar experiment could not be performed with
pFIB44 due to the lack of appropriate derivative strains. When taken together, these
results suggest that pSAP44 confers a fitness advantage to APEC O78 strains in
environments where available iron is scarce. Further analysis is required to identify
the genes encode for iron uptake in pSAP44. To our knowledge, this is the first
report would shows that an IncI1 plasmid carrying ESBL/CTX-M-1 genes able to
enhance the growth of E. coli strains particularly APEC strains belonging to O78
group.

163
Figure 38. Single strain growth curve of wildtype APEC (SAP44) or its derivatives in
iron-limited growth media.
0 2 0 4 0 6 0
5
6
7
8
9
1 0
1 1
T im e in h o u r
Lo
g o
f C
FU
/ml
S A P 4 4 (W T )
S A P 4 4 C
S A P 4 4 F
S A P 4 4 (p la s m id le s s )p < 0 .0 5
Comparison of growth curve of SAP44WT (containing pFIB44 and pSAP44 plasmids) and its derivatives, SAP44F (containing pFIB44plasmid), SAP44C (containing ESBLpSAP44 plasmid) and SAP44-(plasmidless cured stain) in iron-restricted media containing 2,2-dipyridyl (- iron)100 µM and supplemented with FeSO4(1.5 µM). Varaiability in growth was observed in different time point from at least three biological and two technical repeats. .
Figure 39.Single strain growth curves of non-ESBL APEC (SAP24) or the ESBL-
producing transconjugant (SAP140) in iron-limited growth media.
t im e in h o u r
Lo
g o
f C
FU
/ml
0 2 0 4 0 6 0
5
6
7
8
9
1 0
1 1
S A P 2 4
S A P 1 4 0
p < 0 .0 5
Comparison of growth curve of SAP24 and its derivative SAP140 (containing ESBL pSAP44 plasmid) in iron-restricted media containing 2,2-dipyridyl (- iron)100 µM and supplemented with FeSO4(1.5 µM). The growth kinetics of each strains using at least three biological and two technical repeats indicated that SAP24 carries the ESBL plasmid (pSAP44) grew significantly after 24 h of incubation while the non ESBL wildtype strains remined in stationary phase from the same time point (24 h).

164
Figure 40. Single strain growth curve of wild type APEC (SAP44) or its derivatives in
media supplemented with iron (1.5µM).
0 5 1 0 1 5
5
6
7
8
9
1 0
1 1
T im e in h o u r
Lo
g o
f C
FU
/ml
S A P 4 4 (W T )
S A P 4 4 (p la s m id le s s )
S A P 4 4 C
S A P 4 4 F
Comparison of growth curve of SAP44WT (containing pFIB44 and pSAP44 plasmids) and its derivatives, SAP44F (containing pFIB44plasmid), SAP44C (containing ESBLpSAP44 plasmid) and SAP44-(plasmidless cured stain) in M9 minimal media supplemented with FeSO4 (1.5 µM). Variability in growth was observed in different time point from at least three biological and two technical repeats.
Figure 41. Single strain growth curves of non-ESBL APEC (SAP24) or the ESBL-
producing transconjugant (SAP140) in media supplemented with iron (1.5µM).
0 5 1 0 1 5
5
6
7
8
9
1 0
1 1
T im e in h o u r
Lo
g o
f C
FU
/ml
S A P 2 4
S A P 1 4 0
p < 0 .0 5
Comparison of growth curve of SAP24 and its derivative SAP140 (containing ESBL pSAP44
plasmid) in M9 minimal media supplemented with FeSO4 (1.5 µM). The growth kinetics of each
strains using at least three biological and two technical repeats indicated that SAP24 carries the ESBL
plasmid (pSAP44) grew significantly and reached the stastionary phase after 6 h of incubation while
the non ESBL wildtype strains had long lag phase for a period of 12 h.

165
5.6 ESBL plasmid has a burden cost fitness on APEC strains to acid shock tolerance
Acid resistance is an important attribute of organisms that contributes to their fitness
in the intestinal tract (Kanjee & Houry, 2013). In this series of single strain growth
experiments, the impact of the plasmids on the ability of APEC to survive in low pH
was tested. SAP44, SAP24 and their derivatives were used and their survival in LB
media adjusted to pH 2.5 determined at various times post-incubation. Data are
expressed as the percentage reduction from the number of viable bacteria at the
start of the incubation. None of the strains grew (increased in numbers) during the
experiment, but the decrease in the number of cells was time and strain-dependent.
Twenty-four hours after incubation, no significant differences between the survival of
plasmid-containing and plasmidless SAP44 were detected. However, by 36 hours
incubation, there was a significantly greater reduction in the number of viable cells
recovered for the strain SAP44-cured than for the wildtype strain SAP44 (Figure 42).
The presence of the ESBL plasmid (in SAP44C) did not abrogate this effect,
however, when pFIB44 was present in the cell (in SAP44F) survival was significantly
higher (2 fold). This finding may suggest that the APEC strains carrying pFIB44
plasmids have a better tolerance to acid condition whereas carrying ESBL plasmid
pSAP44 showed a cost fitness when exposed for a long time to acidic conditions.

166
Figure 42.Acid tolerance assay in APEC O78 carrying ESBL plasmids.
SA
P44(W
T)
SA
P44F
)
SA
P44C
SA
P44(p
lasm
idle
ss)
SA
P24
SA
P140
0
2 0
4 0
6 0
pe
rc
en
tag
e o
f s
urv
iva
l (%
)
S A P 4 4 (W T )
S A P 4 4 F )
S A P 4 4 C
S A P 4 4 (p la s m id le s s )
S A P 2 4
S A P 1 4 0
Percentage acid survival of APEC strains belong to O78 type .SAP44 wild type strain (containing pSAP44 and pFIB44) and its derivative strains, SAP44F (pFIB44), SAP44C (pSAP44) and SAP44-(plasmidless). Non ESBL wild type strain SAP24 and its derivative strain SAP140 (pSAP44). APEC O78 strain survive better with pFIB44 plasmid. The effect of ESBL plasmids was only significant in the wild type strains harbouring both plasmids. P < 0.05. But strains did not harbour the pFIB44 plasmid the reduction was significantly high. P <0.05. Data are displayed as a mean of three separate expermints all performed with three technical repeats.

167
5.7 Transfer of ESBL plasmid in APEC
In addition to different environmental conditions affecting the survival of APEC, it is
likely that the rate of plasmid transfer between cells is also altered, which may have
significant consequences for the spread of the resistance plasmids. The results
obtained in chapter 3 demonstrate that the ESBL plasmid transmits readily to other
E.coli strains during filter mating (section 3.2.3). In order to more accurately quantify
this process, plasmid transfer between different APEC O78 strains was determined.
In these experiments, wild type SAP44 (containing both pSAP44 and pFIB44
plasmids), SAP44C (cured strain complemented with pSAP44) and the pSAP44-
harbouring naïve APEC strain (known as SAP140) were used as donors whereas
two streptomycin resistant O78 APEC strains (SAP44cured and SAP24) were used
as recipients. Streptomycin-resistant derivatives were needed in order to facilitate
selection of putative transconjugants. Conjugation experiments were performed on
filters placed on LB agar plates. Each experiment was repeated at least three
different occasions.
As can be seen in Figure 43, the rate of pSAP44 transfer to SAP44 SmR was
significantly greater (P<0.05) for SAP44C than for either the wild type APEC strain
SAP44 or the recent transconjuant, SAP140. A similar pattern of response was seen
when the naïve non-ESBL-harbouring strain SAP24 was used as a recipient (see
part B of figure). One possible explanation for this pattern is that pSAP44 was
present in a higher copy number in the cured strain compared to the wild type or
recent transconjugant strain. Other explanations could be the plasmid was quickly
adapted by the cured strain facilitating more plasmid transfer to recipients.

168
Figure 43. Conjugation frequency of ESBL plasmid among APEC O78 strains.
co
nju
ga
tio
n f
re
qu
en
cy
/do
no
r c
ell
SA
P44(W
T)
SA
P44C
SA
P140
0
51 0 -4
11 0 -3
21 0 -3
SA
P44(W
T)
SA
P44C
SA
P140
0
2 .01 0 -3
4 .01 0 -3
6 .01 0 -3
8 .01 0 -3
1 .01 0 -2
co
nju
ga
tio
n f
re
qu
en
cy
/do
no
r c
ell
A
B
The graph bars show the rate of ESBL plasmid transfer in APEC O78 strains. The rate of pSAP44 transfer to SAP44 SmR (A) and SAP24SmR (B) was significantly higher for SAP44C (SAP44 cured strain complemented with pSAP44) than for wild type SAP44 or recent transconjugant SAP140. P < 0.05. The ESBL conjugation frequencies were measured from donor strains during 4 h period from at least three separate experiments.
In the previous section, the rate of plasmid transfer was determined under optimal
conditions, however these conditions poorly resemble the natural environment of the
chicken intestine. The pH of the chicken intestinal tract contents increases towards
the caecal site from pH 4.5 in the crop, to pH 5.7–6.0 in the duodenum/jejunum, to
pH 6.3–6.4 in the ileum/rectum and finally up to pH 7.0 or higher in the caecum

169
(Siragusa, 2008). Thus, a series of experiments were set up to investigate if acidic
conditions influenced the rate of ESBL plasmid transmission.
ESBL plasmid transmission was studied using acid pre-stressed SAP44 (WT)
as a donor and acid pre-stressed SAP24 as a recipient strain in order to more
closely replicate the conditions experienced by the organisms in the chicken
intestine. Figure 44 showed that at low pH the transfer frequency for pSAP44
plasmid was significantly lower than that found in more alkaline environments. The
frequency of plasmid transfer from one APEC to another increased with pH, from
1.0x10⁻⁴ to 5.0x10⁻⁴, but was below the detection limits of the assay at pH 4.0. The
plasmid transfer in this condition was 5 times less than that found previously in non-
stress strains in non-stress condition. Thus, conditions in the chicken caecum pH
5.7-6.0 are conducive to ESBL transfer and are correlated with the findings found in
the acid shock tolerance assay.

170
Figure 44. Conjugation frequency of ESBL plasmid transfer between stressed donor
(SAP44WT) and stressed recipient (SAP24).
Tr
an
sfe
r r
ate
Ra
tio
of
tra
ns
form
an
ts v
s u
n-t
ra
ns
for
ma
nts
PH
4.3
PH
5.0
PH
5.8
PH
7.0
0
21 0 -4
41 0 -4
61 0 -4
Rate of transfer of pSAP44 ESBL plasmid from pre-stressed donor ESBL SAP44 (WT) to pre-stressed recipient non ESBL SAP24 (WT) related strain in low pH condition range from 4.3 to 7.0 mimic the pH of chicken intestinal tract contents. P < 0.05. The ESBL conjugation frequencies were measured from donor strains during 4 h period on at least three separate experiments.

171
5.8 ESBL plasmid transmission in an in vitro chicken caecum model.
In addition to low pH, the gut microbiota may exert a significant influence on the
transfer of conjugative plasmids. In order to investigate this further and to better
mimic the conditions of the chicken intestine, a model of the chicken ceacal
environment was developed. The model was set up as a continuous flow bioreactor
model, where chicken faecal material was used as a starting inoculum. By adjusting
the medium in-flow and the waste outflow in the bioreactor and keeping growth
conditions such as temperature and pH, constant the growth rate of bacteria was
tightly controlled (see methods and materials section 2.8.3 for more information).
The inoculum of chicken faecal contents (2mL) injected directly into the bioreactor
via a syringe at the start of the experiment. Then 24 hours later, a 1:1 mixture of
donor (SAP44) or (SAP140) and recipient cells (SAP24 SmR) or (SAP44 SmR) were
added to the media. The inoculum was tested for the presence of bacteria with ESBL
resistance phenotype before adding the tested strains. Samples from the bioreactor
were taken as follow: one sample was removed at 0 hour immediately after adding
the starting inoculum; a second sample was collected at 8 hours (first cycle) and a
third sample at 24 hours. After injecting the tested strains, the samples were taken
in the same manner for the first cycle, but then continue every 24 hours for 10 days
to monitor the plasmid mobility and the trans-conjugant strains for a long period of
continuous growth. The total number and ratio of recipient, donor and trans-
conjugant cells was determined by plating an appropriate dilution on antibiotic
selective agar.
In general all tested recipient strains SAP44 and SAP24 acquired the pSAP44
ESBL plasmid in the model from the first cycle which indicates that the plasmid is
able to transfer easily even in the complex microbiome of the chicken caeca. The pH
condition in this experiment was fixed at pH 5.8 to mimic the average condition of
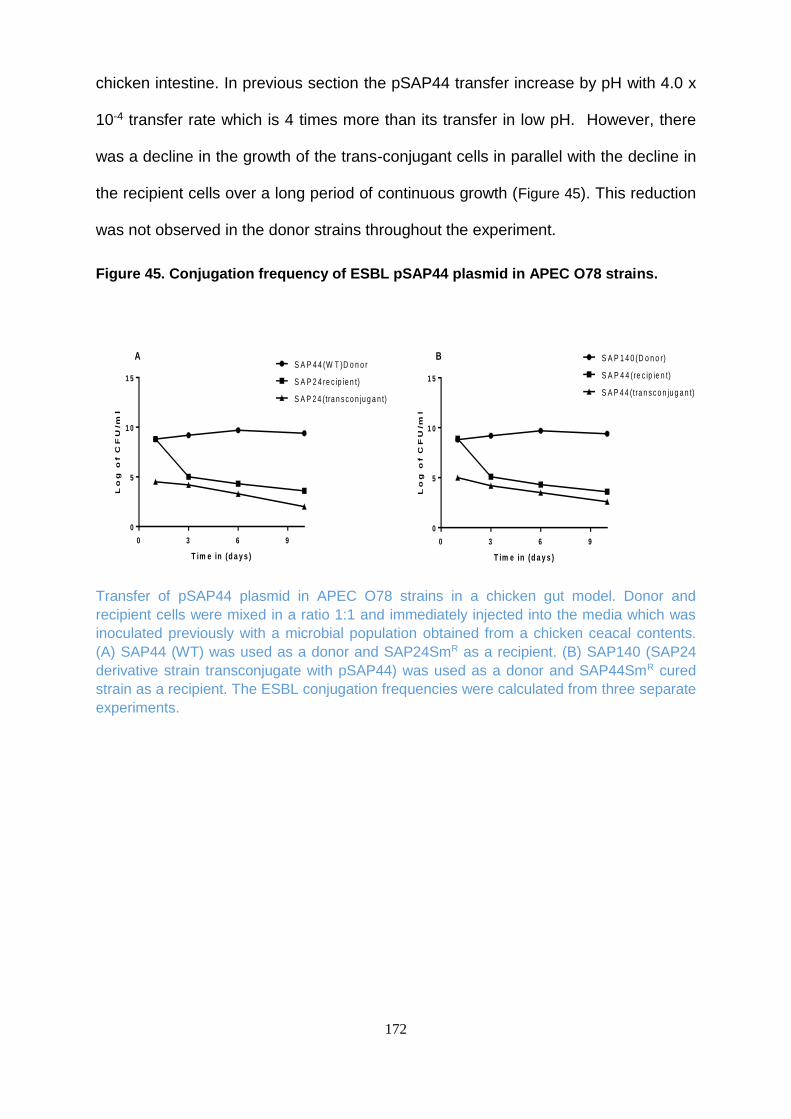
172
chicken intestine. In previous section the pSAP44 transfer increase by pH with 4.0 x
10-4 transfer rate which is 4 times more than its transfer in low pH. However, there
was a decline in the growth of the trans-conjugant cells in parallel with the decline in
the recipient cells over a long period of continuous growth (Figure 45). This reduction
was not observed in the donor strains throughout the experiment.
Figure 45. Conjugation frequency of ESBL pSAP44 plasmid in APEC O78 strains.
0 3 6 9
0
5
1 0
1 5
T im e in (d a y s )
Lo
g o
f C
FU
/m
l
S A P 4 4 (W T )D o n o r
S A P 2 4 re c ip ie n t)
S A P 2 4 (tra n s c o n ju g a n t)
A
0 3 6 9
0
5
1 0
1 5
T im e in (d a y s )
Lo
g o
f C
FU
/m
l
S A P 1 4 0 (D o n o r)
S A P 4 4 (re c ip ie n t)
S A P 4 4 (tra n s c o n ju g a n t)
B
Transfer of pSAP44 plasmid in APEC O78 strains in a chicken gut model. Donor and
recipient cells were mixed in a ratio 1:1 and immediately injected into the media which was
inoculated previously with a microbial population obtained from a chicken ceacal contents.
(A) SAP44 (WT) was used as a donor and SAP24SmR as a recipient. (B) SAP140 (SAP24
derivative strain transconjugate with pSAP44) was used as a donor and SAP44SmR cured
strain as a recipient. The ESBL conjugation frequencies were calculated from three separate
experiments.

173
5.9 Discussion
Plasmids frequently impose a fitness burden on their host cells (Dahlberg & Chao,
2003) and the relative fitness of bacteria containing plasmids has usually been
assessed by comparing its growth rate and generation time with its derivative
plasmid-free strains in pure culture as an indicator of bacterial fitness if difference in
growth kinetics were detected (Lenski, 1998).This simplistic assay fails to
recapitulate the complexities of the physical, chemical and biological interactions
encountered by organisms in the real world. However, it offers a starting point from
which to ask questions relating to the impact of plasmids on the host bacterium.
In this study, the fitness burden of ESBL plasmids on avian and laboratory E.
coli was assessed by comparing their growth kinetics. In rich media, carriage of the
ESBL plasmid had no significant effect on the generation times of the strains. These
results are in agreement with Fischer et al. (2014) who found no difference in
estimated growth parameters between donors, recipients and transconjugants
containing a plasmid belonging to the IncI1 carrying blaCTX-M-1 plasmid. In addition,
as APEC strains harbour more than one plasmid, it is perhaps not surprising that
ESBL plasmids did not confer any fitness impact on APEC when strains were grown
in rich media. However it was interesting to note that the plasmid also had no effect
on a naïve host organism, like E. coli K12. This data contradicts the statement “that
the plasmid will initially have a growth burden to a naïve host” (Lenski, 1998). It is
possible that ESBL plasmids conferred a low growth burden to the host that is not
detectable by the growth curve experiments performed in this thesis.
Because no differences in growth were found in rich media, competitive
growth assays in minimal media were used to further test the comparative fitness of
the APEC O78 isolates. Growth competitions between isogenic bacteria provides a

174
more sensitive measurement for determining the relative fitness since the two strains
compete for resources in the same media (Lenski, 1998).In these experiments
SAP44 showed a fitness cost when competed against the plasmidless derivative
SAP44-cured. This cost could be associated with carriage of either one or both of the
large plasmids carried by this isolate. Pair-wise comparison growth experiments
showed differences in growth when the plasmid-free strain was competed against
the ESBL-producing derivative nor when SAP44 was competed against the pFIB44-
containing derivative. Interestingly, a fitness cost occurred when the single plasmid
derivatives of SAP44 were competed against each other. When taken together, the
data would suggest that the cost is not associated with carriage of the ESBL plasmid
but rather is associated with carriage of the pFIB44 plasmid.
Thus the ESBL plasmid had no effect on the ‘fitness’ of APEC O78 isolates
under these conditions.Starikova et al. (2013) indicated that any cost associated with
newly-acquired plasmids encoding antibiotic resistance can be rapidly compensated
for, even in the absence of the selective antibiotic pressure. Alternatively, SAP44
may already be ‘primed’ to carry multiple plasmids as this natural isolate harbours
two such plasmids. Technical reasons precluded direct comparison of pFIB44 in the
recipient strains, however if possible, this would have added further support to its
impact on host cell fitness.
Many studies equate ‘fitness’ with the growth of the organism in replete,
defined growth media, however, an impact on other cellular functions such as
metabolic function or virulence, following incubation under less-than-optimal growth
conditions, has received much less attention(Vogwill & MacLean, 2015). In the
environment the level of free iron has been estimated to be very low (10-18M)
whereas bacteria need iron concentrations of approximately 10-7 to 10-5 M to survive

175
(Mellata et al., 2009). In chapter 4, iron acquisition systems were identified in the
genome of the APEC O78 isolates, SAP44 and SAP24. In addition, the pFIB44
plasmid of SAP44 contains three iron acquisition systems namely, iroBCDN,
sitABCD and iutA iucABCD. These systems have been previously described to play
a role in the growth and virulence of APEC O78 (Dozois et al., 2003). The ESBL
plasmids do not appear to contain known iron acquisition genes and to our
knowledge, there are no reports of iron acquisition genes being found on ESBL-
producing IncI1 plasmids. However, the significant proportion of genes of unknown
function does not preclude this possibility. Therefore, in this study, the role of ESBL
plasmid in iron acquisition by APEC O78 isolates was assessed in iron-limited
media. Surprisingly, carriage of pSAP44 enhanced the growth of the strain in both
iron-replete and iron-limited minimal media. However, when both SAP44 plasmids
were present in the same cell, this growth phenotype was supressed. This could be
as a result of conflict between the two plasmids, each expressing genes which put a
burden on host growth or because gene expression in one plasmid interferes with
those expressed by the other plasmid. Further experiments are required to dissect
this phenomenon.
Survival in low pH is an essential pre-requiste of bacteria residing in the
intestine. The ability of APEC to persist in poultry facilities is associated with its
capacity to survive in an acidic environment found in the avian intestine (La Ragione
& Woodward, 2002). Carriage of the pFIB44 plasmid and not the ESBL plasmid
(pSAP44) significantly enhanced survival of APEC O78 isolates under low pH
conditions. Variable results have been reported in the literature. For example, Ji et
al. (2007) found that plasmid-cured strains survived better in acidic conditions than
isogenic wild type strains. In contrast, however, Mellata and colleagues found that a
single plasmid (pChi7122-3 belongs to IncI2, 57 kb) increased the survival of the

176
isogenic plasmid-free APEC isolate, although this study did not identify any genes
which may be responsible for this phenotype (Mellata et al.,2009). A number of
studies have linked the iron regulatory gene (fur) with acid tolerance in
Enterobacteriaceae (Bearson et al., 1998 ; Zhu et al., 2002). Fur is a regulatory
protein that able to sense either iron or pH independently (Foster & Hall. 1992).
Bearson et al. (1998) found that Fur mutants of Salmonella challenged by low pH
media were acid sensitive compared to the wild type. In addition, Zhu et al. (2002)
stated that fur is involved in acid tolerance in APEC but not essential in the APEC
virulence. In this study, pFIB44 plasmid harboured by SAP44 was found to have
three iron acquisition system (iroBCDN, sitABCD and iutA iucABCD). The aerobactin
operons, iucABCD and iutA are regulated by fur proteins (Litwin & Calderwood,1993)
and could explain the contribution of the FIB plasmid to acid tolerance in SAP44.
The spread of resistant bacteria is also linked to the transfer of resistant
determinants within and between bacterial species. ESBL plasmids were readily
transferred to other strains of E. coli, including another avian isolate and a laboratory
K12 strain. Somewhat unexpectedly, recently transformed recipients were then
better able to transfer the plasmid to new recipients than the original host strain. This
may help explain the rapid spread of ESBL-producing plasmids. Furthermore,
plasmid transfer occurred in acidic conditions and in an in vitro chicken caecal
model, indicating that the chicken intestine may represent a ‘hotpsot’ for conjugation.
In conclusion, this chapter described how ESBL plasmids can affect the growth of
the host bacterium under a range of environmental conditions, and began to explore
the transmissibility of these resistance determinants under more realistic
environmental conditions. However, the impact of the plasmid on non-growth-related

177
properties of the bacterium has not been considered and this will be addressed in
chapter 6.

178
Chapter 6: Impact of ESBL plasmids on the
metabolic fingerprint of APEC

179
6 . Impact of ESBL plasmids on the metabolic fingerprint of APEC
6.1 Introduction
Differences in the ability of the bacterium to utilise various carbon, nitrogen,
phosphorus and/or sulphur substrates could confer a fitness benefit to the organism
over and above that related to the acquisition of antibiotic resistance. This may
enable resistant bacteria to outcompete sensitive variants in different ecological
niches or environments, where nutrient supplies are variable and/or limiting. Thus,
the metabolic ‘fingerprint’ of ESBL-producing and non-ESBL-producing strains were
compared using a commercially-available phenotypic microarray.
Biolog™ phenotyptic microarrays, a high throughput screening assay were
used to examine the metabolic profiles of wild type APEC. Biolog™ microarrays
enable the investigation of a large number of cellular phenotypes in a single
experiment using four different microarray plates (PM1 to PM4) and provides a
metabolic ‘fingerprint’ for each organism. The plates PM1 and PM2 contain 190
different carbon sources while PM3 contains 95 different nitrogen sources and PM4
contains 59 and 35 different phosphorus and sulfur sources, respectively. In total,
these plates facilitate the analysis of 379 different metabolic activities (Bochner et al.,
2001). Biolog™ microarrays has been used previously to study the metabolic
changes associated with resistance genes in Salmonella Typhimurium LTL where a
sensitive strain indicated better utilisation of 10 and 5 carbon and phosphorus
sources respectively than the resistant strain (Zheng et al., 2011).
The aim of this chapter was to:
Study the impact of ESBL plasmid acquisition to the host metabolism using
Biolog phenotypic microarray.

180
Test and compare any significant data generated by Biolog using limited
media growth and viable counts.
In order to explore the influence of the plasmids on APEC metabolism, plasmid-
cured and plasmid-complemented derivatives generated in chapter 3 were examined
using Biolog™ phenotypic microarrays. All Biolog™ microarray tests were performed
in triplicate over 48 hours. However, all data using the PM3 plates were
subsequently excluded from the study because respiratory activity was found in the
negative control wells. Data from E. coli K12 strains was also excluded from further
analysis because of the weak (low) respiratory activity found on most plates. Data
were recorded using the Omnilog PM Software and transferred into Microsoft Excel
for statistical analysis by one-way analysis of variance (ANOVA) and Tukey Honestly
Significant Difference (HSD) test. Data were expressed in ‘heat’ maps, a colour
density representation of the amount of substrate utilised by each strain after 48 h. In
the heat maps, the colours correspond to substrate utilisation ranging from none
(blue colour) to low (green/yellows) to high (bright orange colour). A difference
between the strains was considered significant when the p value ≤ 0.05.
6.2 Carbon utilisation profile of wild type APEC O78 (SAP44)
As evident by the blocks of orange colour in Figure 47, SAP44 was able to respire
approx. 50% (94/190) of the carbon substrates present on the PM1 and PM2 plates
(Graphs in appendix II). Curing SAP44 of both plasmids (pSAP44 and pFIB44)
resulted in marked differences in respiration for approximately 6% (6/94) of the
utilised carbon sources, as evident by the differences in colour coding between
SAP44W and SAP44 (plasmidless) (Figure 46).. Despite these differences, cluster
analysis performed by the heat map aligned wildtype APEC SAP44 and the

181
plasmidless derivative into a single closely related cluster (see Figure 46) (left hand
edge of heat map).
In general, the single plasmid-containing derivatives, SAP44C and SAP44F,
showed lower levels of respiration than either the wild type (SAP44W) or the
plasmid-free derivative (colours tend to be yellow and light orange rather than bright
orange) (Figure 46). Moreover, cluster analysis placed the two single plasmid-
containing derivatives in a single group, distinct from SAP44 or the plasmid-free
derivative. Closer examination of the data revealed that 78% (74/94) and 66%
(62/94) of the carbon sources were more poorly utilised by the SAP44 derivatives
carrying a single plasmid. However, the two single plasmid-containing derivatives
were significantly better able to utilise some carbon sources than their respective
parental strains. For example, SAP44F, which contains pFIB44, was significantly
(P<0.05) better able to respire pectin, D-fucose and L-alaninamide whereas
SAP44C, which contains pSAP44, showed significantly (P<0.05) higher rates of
respiration on formic acid, α-keto glutaric acid and mono-methyl succinate (Table
22). Notably, both SAP44F and the plasmid-free cured derivative were no longer
able to utilize formic acid as a carbon source. Given that SAP44C which contains
pSAP44, utilised formic acid as well as the wild type APEC strain, this indicates that
factors required for the regulation or utilisation of formic acid may be carried on the
ESBL plasmid. Taken together, the findings suggest that APEC plasmids harbour
factors that enhance the utilisation of some substrates by the bacterium. An
alternative explanation is that conflict(s) in gene expression that occurs when both
plasmids are present in the same bacterium, are resolved in the single plasmid-
bearing derivatives allowing enhanced utilisation of certain substrates. An example
of this is seen for D-malic acid. Loss of both plasmids significantly (P<0.05)
increased the utilisation of D-Malic acid compared to derivatives carrying only a

182
single plasmid. It is possible that factors present on both plasmids normally interfere
with the utilisation or regulation of malic acid metabolism in E. coli.
Cluster heat map showing respiratory activity of SAP44W and its various derivatives. Bacterial strains were incubated for 48 h in the presence of 190 different carbon sources on Biolog™ PM1 and PM2 plates. The cumulative levels of respiration are colour-coded, with
blue indicating no utilisation, low levels indicated by green/yellows and dark orange indicating high levels of utilisation. Carbon sources are identified by their position on the 96-well plate (letter and number format) as listed in appendix III. Curing wildtype APEC of both plasmids resulted in some changes to carbon utilisation patterns. Single-plasmid containing derivatives (SAP44C and SAP44F) showed less intense colours than the parental strains.
Figure 46. Cluster heat map showing the single values of SAP44WT and its derivative strains obtained from 190 different carbon sources.

183
Table 22 . Differences in carbon utilisation between wild type APEC and their derivatives.
Strains No. of carbon sources where the strain respire less than the parent
No. of carbon sources where the strain respires more than parent
Name of components where the strain respire bettera or lessb than the parent
SAP44 (plasmidless)
6% (6/94) 1% (1/94) D-Malic acida
SAP44C(pSAP44) 79% (74/94) 3% (3/94) (Formic acid,α-glutaric acid, monomethyl succinate)a
SAP44F(pFIB44) 66%(62/94) 3% (3/94) (pectin,, D-fucose and L-Alaninamide )a
SAP24 0 0 - SAP140(pSAP44) 0 0 - SAP45(cured) 7%(7/98) 1% (1/98) m-Tartaric Acida , (D-Glucuronic Acid, α-
Keto-Glutaric Acid, m-Tartaric Acid, D-Threonine, Fumaric Acid, L-Threonine)b
The table shows the number of significant differences which were found in carbon utilisation between parent and its derivative strains with and without ESBL plasmids.Footnote: a, name of components where the strain respired better than the parent strains. b, name of components where the strains respire less than the parent strains.
6.3 Confirmation of Biolog data using growth assays
As evident in Table 22(above), Biolog™ assays revealed many differences in carbon
utilisation between SAP44 and the various plasmid-containing derivatives. While it is
beyond the scope of this thesis to investigate all the differences revealed when
comparing the strains, one carbon substrate (α-keto glutaric acid) was selected for
further study. α-keto glutaric is known to contribute to the a variety of metabolic
process including tricarboxylic acid cycle (TCA) (Seol & Shatkin, 1991). In these
experiments, M9 minimal media broth supplemented with 10 µM α-keto glutaric acid
was used to provide independent confirmation of the Biolog data and verify a role for
this substrate in the growth (versus respiration) of the bacteria.
Wild type SAP44 grew slowly in M9 media, exhibiting a long lag phase but
finally reached a cell density of >109 cfu/mL after approximately 72 h (Figure 47).

184
Loss of both plasmids did not alter the length of the lag phase but slowed the growth
of the organism and significantly (P≤0.01) reduced the final cell density by
approximately 1 log. Re-introduction of pESBL to the cured strain to yield SAP44C
restored the organism’s growth, in agreement with the results found in the
microarrays. This provides independent validation for a role for the ESBL plasmid in
α-ketoglutaric acid metabolism in APEC.
Figure 47. Growth of SAP44WT and its derivative strains in minimal media supplemented with α-keto glutaric acid as a sole carbon source.
In c u b a tio n T im e b y D a y s
Lo
g o
f C
FU
/ml
0 2 4 6 8
5
6
7
8
9
1 0
S A P 4 4 W
S A P 4 4 C
S A P 4 4 (p la s m id le s s )
p .v < 0 .0 1
Growth of wild type APEC SAP44 and its derivatives in minimal media supplemented with α-keto glutaric acid as a sole carbon source. Bacteria were grown in M9 minimal media supplemented with 10µM α-keto glutaric acid for 7 days at 37°C with shaking. The graph shows the ability of plasmid-free SAP44 derivative to respire as well as the wildtype organism after complementing with the ESBL plasmid, pSAP44 (P≤0.01). Data are displayed as a mean of three separate experiments.

185
6.4 Influence of ESBL plasmids on other APEC isolates
6.4.1 Impact on O78 APEC
As described in chapter 3 and 4, SAP44 and SAP24 are APEC, which belong to the
O78 serogroup and share 99% nucleotide identity, whereas SAP45 and SAP46 are
APEC, which belong to differing serogroups (O7 and O15, respectively) but harbour
identical ESBL plasmids, to SAP44. Therefore, it would be interesting to compare the
effects of the ESBL plasmid on the metabolism of the other APEC strains described
in this study. Prior to these experiments, the carbon utilisation fingerprint of the
plasmid-free host bacterium (SAP24) was examined and compared to that of the
plasmid-free SAP44 derivative. The analysis revealed that SAP24 utilised 8
additional substrates compared to the plasmid-free SAP44 strain (Figure 48).
Interestingly, SAP24 respired α-ketoglutaric acid even in the absence of the pESBL
plasmid (P<0.005). Furthermore, acquisition of pESBL did not abrogate this activity
suggesting that all the factors required for α-ketoglutaric acid respiration are located
on the chromosome rather than the possibility that plasmid-borne factors are
repressing this activity. However, chapter 3 revealed that SAP24 contained multiple
plasmids that were not type-able by PCR-based typing. It is possible that the
presence of these untypeable plasmids may enhance the strain’s ability to respire α-
keto glutaric acid. While pESBL was linked to changes in the utilisation of 3% (3 out
of 94) of carbon substrates for SAP44, there were no significant differences in
substrate utilisation in the presence or absence of pESBL for SAP24.

186
6.4.2 Impact on non-O78 APEC
To examine if the ESBL plasmid affected the carbon metabolism of APEC belonging
to different serogroups, wildtype and plasmid-free derivatives of SAP45 and SAP46
were compared using Biolog™. As described previously (chapter 3), SAP45 and
SAP46 belong to O7 and O15 serogroups, respectively, but harbour identical ESBL
plasmids to SAP44.
Curing the strains of their ESBL plasmids using pCURE resulted in significant
changes to the host bacterium’s ability to respire on the different carbon substrates.
Unfortunately, the Biolog™ data obtained for the SAP46 plasmid-cured derivative
had to be excluded from further analysis. The data were of poor quality due to the
very low levels of respiration exhibited by the cured strain. It is possible that the
curing process had adverse effects on the host bacterium.
However, significant differences in respiratory activity were found for 7% (7
out of 98) of carbon substrates used by SAP45 compared to its plasmid-free
derivative (see Table 22). Most differences reflected a reduced ability of the plasmid-
free strain to utilise certain substrates. For example, similar to SAP44, respiration of
α-keto glutaric acid was enhanced in the presence of the ESBL plasmid. This finding
indicates that this may be a general response applicable to other APEC and is
attributable to the ESBL plasmid examined in this thesis. It would be interesting to
explore this further by testing the plasmid in a wider range of APEC isolates.

187
Figure 48. Differences in carbon utilisation by non-ESBL SAP24 and SAP44 (plasmidless).
Differences in carbon utilisation between non ESBL APEC O78 strains SAP44 (plasmidless) and SAP24. SAP24 utilised 8 additional substrates (listed beside the graph) compared to the plasmid free SAP44.

188
6.5 Phosphorus and sulphur utilisation profiles of SAP44
While carbon is a key substrate required for microbial growth, the ability of strains to
utilise different phosphorus or sulphur sources can also have a significant impact on
an organism’s fitness. Thus, strains were incubated in PM4 Biolog™ plates which
contain an array of phosphorus or sulphur substrates, and the response of plasmid-
containing and plasmid-free derivatives compared as before.
As evident by the heat map (Figure 49), SAP44 attained high levels of
respiratory activity on the majority of phosphorus substrates but respired less well on
many of the sulphur sources (note: the predominance of orange colour for wells
containing phosphorus substrates). However, closer examination of the data
revealed that SAP44 exhibited significantly higher levels of respiration than the
negative control for 51 of 59 phosphorus sources and 30 of 35 sulphur sources,
indicating that SAP44 was able to utilise the majority of P or S substrates to some
extent.
Curing both plasmids from SAP44 resulted in significantly reduced levels of
respiration on 2 phosphorus substrates (Adenosine- 3’,5’-cyclic monophosphate and
Cytidine- 3’,5’-cyclic monophosphate).In contrast, the cured strain exhibited
significantly (P≤0.05) higher levels of respiratory activity for triethyl phosphate
compared to the wild type strain. While neither the wild type strain nor the plasmid-
free derivative were able to utilise O-phospho-D-serine, both of the single plasmid-
containing derivatives, SAP44C and SAP44F, were able to respire on this substrate.
When SAP44 strains carry pSAP44 or pFIB44 plasmid as a single carrier
were examined in the Biolog, approximately between 47%-60% of the the strains
respired the sulphur compounds better compared to the plasmidless and wild type

189
strains (Table 23). As was the case for the carbon utilisation, no differences in
phosphorus or sulphur utilisation could be attributed to the ESBL plasmid (pSAP44)
in the SAP24 genetic background.
Similar to the findings observed for carbon utilisation, analysis of the data for
phosphorus and sulphur utilisation also suggested that the plasmids harbour factors
that enhance the utilisation of certain components in the host bacterium, but only
when carried singly. Likewise the alternative explanation that points to conflicts in
gene expression may be true. An example of this may be the increased utilisation of
triethyl phosphate by the plasmid-free strain compared to the wild type organism.
Thus, whether considering carbon, phosphorus or sulphur ulitisation profiles, there is
evidence to suggest that the plasmids, either singly or in combination, exhibit a
physiological effect on SAP44 metabolism. One important caveat to these studies,
however, is the need to verify any effects by measuring the growth and not just the
respiratory activity of the organism.

190
Figure 49. Cluster heat map showing the single values of SAP44WT and its derivative strains obtained from different phosphorus and sulphur sources.
Cluster heat map showing the signal values of SAP44W and its derivative strains obtained from 95 biochemical tests using PM4 for phosphorus
(59 test)and sulphur sources (35 test), with blue showing no utilisation through to dark orange showing high levels of utilisation. As it can be seen
SAP44C and SAP44F strains are clustered in one group as they respire better with pSAP44 and pFIB44 plasmids in sulphur sources whereas
SAP44W and plasmidless strains respire less in sulphur sources.

191
Table 23 Effect of plasmid carriage on the metabolism of SAP44 strains in
phosphorus and sulphur sources.
The table shows the percentage utilaisation of phosphorus and sulphur substrates and
significant differences were found among SAP44 strains when compared to the wild strain
SAP44W and free plasmidless strain SAP44 (plasmidless). aThe phosphorus and sulphur
sources are designated by number and letters adapted from biolog labelled names. A6:
Triethyl Phosphate, A11: Adenosine- 2’,3’-cyclic monophosphate, B2: Dithiophosphate,B5:
Carbamyl Phosphate,B8: Guanosine- 2’-monophosphate,B9: Guanosine- 3’-
monophosphate, C6: D-Glucosamine-6-Phosphate, C7: 6-Phospho-Gluconic Acid, C9:
Cytidine- 3’- monophosphate, C10 :Cytidine- 5’- monophosphate, C11: Cytidine- 2’,3’-cyclic
monophosphate, D1: D-Mannose-1-Phosphate,D2:D-Mannose-6-Phosphate, D3:
Cysteamine-S-Phosphate, D5: O-Phospho-D-Serine, D6: O-Phospho-L-Serine, D7: O-
Phospho-L-Threonine,D8: Uridine- 2’- monophosphate, D11: Uridine- 2’,3’- cyclic
monophosphate, E10: Thymidine-5’-
monophosphate,E11:InositolHexaphosphate,F2:Sulfate,F3:Thiosulfate,
F5:Thiophosphate,F6:Dithiophosphate,F8:D-Cysteine,F9:L-Cysteinyl-Glycine,F10:L-Cysteic
Acid,F11:Cysteamine,F12:L-Cysteine Sulfinic Acid, G2:S-Methyl-L-
Cysteine,G3:Cystathionine,G4: Lanthionine,G5: Glutathione,G6: D,L-Ethionine,G7: L-
Methionine,G8:D-Methionine,G9: Glycyl-L-Methionine,G10: N-Acetyl-D,L-Methionine,G11:L-
Methionine Sulfoxide,G12:L-Methionine Sulfone, H1:L-Djenkolic Acid,H2:Thiourea,H3:1-
Thio- -D-Glucose,H5:Taurocholic Acid,H7: Hypotaurine, H11: Methane Sulfonic
Acid,H12:Tetramethylene Sulfone.
Phosphorus substrates Sulphur substrates
Strains No. of substrates
utilised (59)
Higher respiration
compared to SAP44Wa
Higher respiration
compared to SAP44
(plasmidless)
No. of substrates
utilised (35)
Higher respiration
compared to SAP44W
Higher respiration
compared to SAP44
(plasmidless)
SAP44W 86% (51)
- 0 86% (30)
- 1% (1/30) G11
SAP44 (plasmidless)
88% (52)
1% (1/51)
A6
- 86% (30)
0
SAP44C (pSAP44)
88% (52)
8% (4/52)
B5,D1,D5,E10
4% (2/52) D5,E10
89% (31)
16% (5/30)
F5,F9,G4, G6,H2
47% (14/30)
F2,F3,F6,F8,G2,G3,G4,G5,G6,G11,G12,H1,H2,
H11
SAP44F (pFIB44)
88% (52)
89% (31)
(too many to list)
4% (2/52) D1,D5
6% (3/52)
A11,B5,D5
47% (14/30)
F5,F6,F9,F12,G4,G8,G9,G10,G11,G12,H3,H5,H11,H12
60% (18/30)
F2,F3,F6,F8,F9,F10,F12,G3,G4,G7,G8,G9,G11,G12,H1,H3,H7,H12

192
6.6 Discussion:
The aim of this chapter was to investigate whether ESBL plasmid carriage conferred
a metabolic benefit to the host bacterium. There were three carbon compounds for
which the ESBL plasmid had a positive impact - formic acid, α-ketoglutaric acid and
mono-methyl succinate. Respiratory activity was restored to wild type levels for these
compounds when the cured strain was complemented with the plasmid. However,
introducing the plasmid into non-ESBL avian E. coli O78 isolate (SAP24) showed no
alteration in its carbon utilisation profile, which means that this response is specific to
SAP44. Interestingly, curing an identical ESBL plasmid from an unrelated APEC
isolate (SAP45) also resulted in reduced utilisation of α-ketoglutaric acid, although
plasmid complementation studies were not included for this organism. These
findings suggest that in some E. coli genetic backgrounds, the plasmid positively
contributes to the metabolic capacity of the organism.
Somewhat surprisingly, the plasmidless SAP44-cured strain respired better in
the absence of any plasmids for one carbon compound, D-malic acid. Increased
carbon utilisation has also been reported following deletion of an transcriptional
regulator linked to antimicrobial resistant in Salmonella Typhimurium (Zheng et al.,
2011). Similarly, it is possible that some genes present on the ESBL plasmid may
regulate genes involved in metabolic pathways.
Fumaric and malic acid can be used as ‘acidulents’ to improve the feed
conversion ratio of broiler chickens when used as a supplement in poultry feed
(Skinner et al., 1991).These compounds have the ability to reduce the pH of the crop
and gizzard contents of chickens (Cengiz et al., 2012), thereby, reducing the load of

193
pathogenic bacteria which prefer the higher pH of the digestive system (Rocha et al.,
2011). Organic acids have been put forward as a potential alternative to replace
antibiotic growth promotors because of the fears of antibiotic resistance and the
consequences for human health (Hassan et al., 2010). It is tempting to speculate
that acidification of the chicken crop is counteracted by the conversion of these weak
organic acids into neutral compounds (Leonhartsberger et al., 2002). Alternatively,
reduced growth of ESBL-producing organisms in the presence of malic acid may act
as a signal to the organism that it is not in the correct niche in the chicken intestine.
Moreover, it seems that protein expression of genes on the ESBL plasmid does not
occur optimally at low pH. For example, the frequency of APEC conjugation
increased in parallel with increasing pH (see chapter 5) and ESBL-producing SAP44
was less able to survive in acidic environments than non-ESBL-producing derivatives
(i.e. those carrying pFIB44 or the cured derivative). In addition, investigation of the
genome annotations generated by RAST (see Chapter 4), revealed that genes
coding for transcription regulators of these compunds (e.g. succinate, malate and
fumarate) are found in APEC genomes. When taken together, there appear to be
many ways through which the plasmid affects the global metabolic capability and
growth of the host bacterium.
For most sulphur compounds, the presence of either the ESBL or the FIB
plasmid had a positive impact on the respiratory capacity of the host strain. In fact,
plasmid-free strains respired less than the other three (plasmid-containing) strains on
over 60% of the sulphur sources. This is in contrast to when single-plasmid
derivatives of SAP44 are tested on different carbon sources, when these strains

194
respired significantly less in nearly 70% of the sources tested. SAP44 wild type and
plasmid-free derivative respire less in two and four phosphorus compounds
respectively when compared to SAP44F and SAP44C (D-mannose-1-phosphate, o-
phospho-D-serine, carbamyl phosphate and thymidine-5’-monophosphate)
comparing to the derivative strains. Further analysis in the genome annotations also
revealed several clusters of sulphate and phosphate regulons are located in the
bacterial genome which again emphasises the plasmid potential influence on the
bacterial metabolic regulation system.
The metabolic burden of plasmid carriage has been attributed to the
consumption of limiting intracellular metabolites and the need for extra ATP for
plasmid maintenance (Diaz-Ricci et al., 1995). This idea was based on evidence
which indicates that plasmids maintain enhanced gene expression in the host cells.
The authors measured cyclic adenosine monophosphate (cAMP) gene expression to
determine metabolic processes. Higher levels of glucose were taken up in the strains
carrying plasmids compared to those without plasmids. The same study emphasised
that this phenomenon of the plasmid and host interaction has to take into account
the genetic background of the host and this effects was independent of the type and
number of plasmids. Furthermore, it has long been recognised that high plasmid
copy number in E. coli HB101 causes increases in the level of enzymes involved in
the tricarboxylic acid (TCA) cycle, including succinate dehydrogenase (Birnbaum &
Bailey, 1991). Plasmids may also affect cellular metabolism by increasing ATP
synthesis necessary for the expression of resistance genes (Rozkov et al., 2004).

195
The metabolic burden found in carbon metabolisms could be related to the
expression of plasmid gene products interfering with the regulation of carbon
metabolism in E. coli, while there is no metabolic stress found harbouring them as a
single plasmid in sulphur sources may suggest exchange roles between plasmid
DNA and bacterial genome in sulphur metabolisms.
In conclusion, carriage of large ESBL-producing plasmids are associated with
both positive and negative impacts on the respiratory activity of the host bacterium
when grown on different carbon, phosphorus and sulphate substrates. While such
studies are useful for obtaining an overview of the metabolic ‘fingerprint’ of
organisms, ultimately, within the host, bacteria are exposed to a complex mix of
substrates as well as competition from other members of the microbiota. It is only by
considering the organism’s fitness within the context of the host that a more accurate
picture emerges and this is the focus of the next chapter.

196
Chapter 7: Impact of ESBL plasmid on APEC
virulence

197
7 . Impact of ESBL plasmid on APEC virulence
7.1 Introduction
APEC strains belong to O78, O1 and O2 group cause infection outside of the
gastrointestinal tract (extra-intestinal pathogenic E. coli, ExPEC), are the causative
agent for 80% of colibasillosis in poultry (Dziva & Stevens, 2008). The pathogenicity
of APEC is mostly associated by harboring virulence genes found on bacterial
genome or plasmids (Janßen et al., 2001). Most known virulence genes detected in
APEC in Chapter4 such as iss, IbeA, iroBCDN and tsh were carried on IncFIB
plasmids. The virulence properties of such genes include adhesion, invasion, iron
uptake system, serum resistance and toxins (Mellata et al., 2009). Plasmids
belonging to Inc1 type have previously been detected in pathogenic E. coli of avian
and human origin and commonly belong to the E. coli subtypes ExPEC and InPEC.
The plasmids are commonly found as integrative plasmids and or free plasmids.
However, few plasmid sequences of this type have been deposited in public
databases. Interestingly, the plasmids are similar to pSAP44 in that they contain a
transfer region, transposon-like element and genes encoding ColIb proteins
(Johnson & Nolan, 2009). With the exception of the colonization factors and
resistance genes found in pSAP44, the characterization of the plasmid DNA in
Chapter4 did not detect most known virulence genes that have been reported in
avian pathogenic E. coli isolates. However, 45 unidentified functional genes were
detected in the plasmid and these may play a role in APEC pathogenicity. This led to
hypothesis that ESBL plasmids found in the APEC strains examined in this thesis

198
may have certain genes of unknown functions, but with properties that may enhance
APEC virulence. Therefore, the aim of this chapter was to investigate the impact of
ESBL plasmid carriage on the virulence of APEC strains. In order to achieve this, the
following assays were performed;
Study the impact of ESBL plasmid acquisition in biofilm formation at different
temperatures representative of the poultry unit, human and chicken intestine,
respectively
Study the impact of ESBL plasmid acquisition in adherence and invasion in
avian and human macrophage–like cell lines.
Study the impact of ESBL plasmid acquisition in adherence and invasion in
human intestinal epithelial cell line (Caco-2)
Utilise the Galleria mellonella model to study the contribution of ESBL
plasmids to virulence.
7.2 Impact of ESBL plasmid carriage on APEC biofilm formation
To study the role of ESBL plasmid in biofilm formation, wild type APEC strain SAP44,
the naïve non-ESBL APEC strain SAP24 and their respective derivatives were tested
using the crystal violet biofilm assay. The effect of the ESBL plasmid on APEC
strains belonging to different O serogroups was also included in this study. Each
strain was tested in quadruplicate and biofilm development after 5 days was studied
at three different temperatures 30˚C, 37˚C and 42˚C to simulate temperatures found
in commercial poultry production units, the human and chicken intestines,
respectively.

199
Generally, wild type APEC (with the exception of SAP45 which formed poor
biofilms under all conditions), formed larger biofilms at 30˚C than at 37 ˚C or 42 ˚C
(Figure 50, A and B). However, the amount of biofilm formed was not correlated with
serotype as APEC strains of the same serotype (e.g. SAP44 and SAP24) formed
significantly (p<0.05) different amounts of biofilm. In contrast to APEC, laboratory E.
coli K12 (SAP59 and its derivative SAP56) formed larger biofilms at 42 ˚C compared
to 30˚C or 37˚C, perhaps the biofilm formation at 42oC was stimulated by non-plasmid
related features.
The role of the APEC plasmids on biofilm formation was investigated using
the APEC derivatives described previously (section 3.2.4). Curing wild type APEC
SAP44 of both its plasmids did not significantly alter the amount of biofilm formed by
the organism. Loss of the ESBL plasmid from SAP46, the APEC O15 isolate,
significantly (P<0.05) reduced the amount of biofilm formed by the organism when
grown at 30˚C. This finding however, was not supported by plasmid complementation
as biofilm formation was not restored to the original levels when the plasmid was re-
introduced to the cured strain.
The re-introduction of pSAP44 into the cured strain gave surprising results.
The complemented strain SAP44C made significantly (P<0.05) less biofilm at 30˚C
than the cured strain from which it was derived. However, the inverse was found at
37˚C and 42˚C, where SAP44C formed significantly (P<0.05) larger biofilms than the
cured strain. These conflicting results may suggest a temperature-dependent role for
pSAP44 in biofilm formation. In order to test this further, pSAP44 transconjugants
derived from the naïve APEC strain (SAP24) or from laboratory E. coli K12 were

200
tested for their ability to form biofilms. The presence of the plasmid had no significant
effect on biofilm formation by either strain at any of the temperatures. When taken
together, it is clear that further studies are needed to elucidate a role, if any, for
ESBL-harbouring plasmids in biofilm formation by APEC.
Figure 50. Biofilm formation of APEC with and without ESBL plasmids in different temperatures.
SA
P2 4
SA
P1 4 0
SA
P4 4 (W
T)
SA
P4 4 (p
las m
idle
s s )
SA
P4 4 C
SA
P4 4 F
0
1
2
3
4
OD
54
0
30
37
42
A
s tra in s
SA
P5 9
SA
P5 6 (E
SB
L)
SA
P4 5 (W
T)
SA
P4 5 (c
ure
d)
SA
P4 6 (W
T)
SA
P4 6 (c
ure
d)
0
1
2
3
4
OD
54
0
30
37
42
B
s ta r in s
The effect of ESBL plasmids and temperature on biofilm formation. Biofilm formation by different APEC strains and their cured and complemented derivative strains were compared at different temperatures (30Co, 37Co and 42Co). SAP44(WT) and its derivative strains : SAP44 (plasmidless strain), SAP44C ( plasmidless strain complemented with ESBL pSAP44 plasmid) and SAP44F (non ESBL but containing FIB plasmid) ; SAP24(WT) and its derivative strain SAP140(containing ESBL pSAP44 plasmid) (A) , E.coli k12 (SAP59) and its derivative SAP56(containing ESBL pSAP44 plasmid), SAP45 (WT) and its derivative cured strain SAP45(cured), SAP46(WT) and its derivative cured strain SAP46(cured) (B).Data are calculated from at least three biological and two technical repeats. When P-value < 0.05 is considered significant which is displayed as a star symbol.

201
7.3 APEC adherence and invasion of macrophage-like cells.
APEC causes systemic disease in poultry, however it is not clear where or how
APEC reaches the bloodstream (Dziva and Stevens, 2008). Uptake by macrophages
represents a possible route of dissemination (Antão et al., 2008). In order to
investigate the role of the ESBL plasmid on APEC interactions with macrophages, in
vitro cell-based assays were set up to measure bacterial adherence, invasion and
survival in the chicken macrophage–like cell line HD11.The numbers of intracellular
APEC were determined using the gentamicin protection assay and the number of
extracellular (adherent) bacteria derived by difference between the total numbers of
APEC recovered prior to gentamicin treatment minus any intracellular organisms.
The ability of APEC to survive inside macrophages was calculated after an additional
4 h incubation. The invasive isolate Sallmonella.Typhimurium SL1344 strain and low-
invasive E. coli DH5α K12 strain were used as positive and negative controls,
respectively. Wild type ESBL-producing APEC and naïve non-ESBL-producing
APEC and their various derivatives were tested in this study.
7.3.1 Avian macrophage-like cells (HD11)
Regardless of plasmid content, all APEC isolates adhered to the HD11
macrophage cell line as well as the positive control strain SL1344 (Figure 51 and
Figure 52). In all cases, the numbers of recovered bacteria were approximately 1 log
higher than for the negative control strain (P<0.05). In contrast, the non-APEC E. coli
strains SAP59 and its plasmid-containing derivative (SAP56) adhered significantly
(P<0.05) less well than APEC, at a level similar to the negative control strain (Figure
52). These results indicate that while the ESBL plasmid has no impact on the ability

202
of APEC isolates to adhere to HD11 cells, in general APEC are able to adhere more
effectively than laboratory E. coli.
By 4 h post infection, the numbers of intracellular bacteria for SAP44 and its
derivatives were similar to that of the negative control indicating very low levels of
invasion had occurred. No effect of the ESBL plasmid on invasion was found. In
contrast, approximately 100-fold more intracellular bacteria were recovered from
assays using the positive control strain SL1344 (p-value <0.05) (Figure 51, chart B)
indicating the HD11 macrophage cells were functioning as expected. While the
ESBL plasmid of SAP44 and SAP45 had no effect of APEC invasion, curing the
plasmid from the third APEC strain, SAP46, gave rise to significantly (P<0.05) higher
numbers of intracellular bacteria than the parental strain (Figure 52, chart B). This
was manifest despite no difference in adherence evident for these two strains.
Overall, it seems that the ESBL plasmid has no effect on the adherence and only a
marginal effect on the invasion of one APEC isolate (SAP46 cured strain).
In general, similar numbers of intracellular bacteria were recovered for wild
type SAP44 and its derivatives, and the negative control strain at 8 h post infection.
The one exception to this was found for the ESBL transconjugant (SAP44C) in which
significantly (P<0.05) higher numbers of intracellular bacteria were recorded than for
the strain from which it was derived (SAP44cured). In contrast, the other two APEC
isolates were better able to survive inside the macrophage than the negative control,
with 5 to 10-fold higher numbers of intracellular bacteria recovered. For one of these
isolates (SAP45), loss of the ESBL plasmid significantly increased survival (Figure
51 and Figure 52, chart C). In summary, it appears that APEC are better able to

203
survive inside avian macrophages than laboratory E. coli, but the impact of the ESBL
plasmids on this process is minimal.
HD11 assays (A: Adherence, B: Invasion and C: survival after 8 hours (P.I: post infection) of APEC SAP44 (WT) and SAP24 (WT) strains with their derivatives (see table ) compared with highly virulent S. Typhimurium SL1344 and the low invasive control strain E. coli K12 over time. Chart A shows the number of bacteria adhered 2h P.I (calculated by numbers of viable counts associated minus numbers invaded). Chart B shows the number of bacteria invaded at 4 h P.I following the addition of 100µg/ml gentamicin to kill any extra cellular bacteria prior to disrupting the cells. (P.I = post infection). Chart C shows the numbers of gentamicin protected intracellular bacteria surviving at 8h P.I. Note that the scale of the y-axis is logarithmic. Each assay was performed in duplicate for each strain with 3 biological repeats. The probability level for significance was regarded as P <0·05.
A :A d h e re n c e
s tra in s
Lo
g o
f C
FU
/ml
K12
SL
1344
SA
P44(W
T)
SA
P44(c
ure
d)
SA
P44C
SA
P44F
SA
P24
SA
P140
0
1
2
3
4
5
6
7
8
K 1 2
S L 1 3 4 4
S A P 4 4 (W T )
S A P 4 4 (c u re d )
S A P 4 4 C
S A P 4 4 F
S A P 2 4
S A P 1 4 0
B : In v a s io n
s tra in s
Lo
g o
f C
FU
/ml
K12
SL
1344
SA
P44(W
T)
SA
P44(c
ure
d)
SA
P44C
SA
P44F
SA
P24
SA
P140
0
1
2
3
4
5
6
7
K 1 2
S L 1 3 4 4
S A P 4 4 (W T )
S A P 4 4 (c u re d )
S A P 4 4 C
S A P 4 4 F
S A P 2 4
S A P 1 4 0
C :S u rv iv a l 8 h P .I
s tra in s
Lo
g o
f C
FU
/ml
K12
SL
1344
SA
P44(W
T)
SA
P44-(
cu
red
)
SA
P44C
SA
P44F
SA
P24
SA
P140
0
1
2
3
4
5
6
K 1 2
S L 1 3 4 4
S A P 4 4 (W T )
S A P 4 4 -(c u re d )
S A P 4 4 C
S A P 4 4 F
S A P 2 4
S A P 1 4 0
Figure 51. The ability of APEC O78 strains carrying the ESBL plasmid to adhere, invade and survive in HD11 cells.

204
HD11 assays (A: Adherence, B: Invasion and C: survival after 8 hours (P.I: post infection) of APEC SAP45, SAP46 and K12 SAP59 strains with their derivatives (see table ) compared with highly virulent S. Typhimurium SL1344 and the low invasive control strain E.coli K12 over time. Chart A shows the number of bacteria adhered (calculated by numbers of viable counts associated minus numbers invaded). Chart B shows the number of bacteria invaded at 4 h P.I following the addition of 100µg/ml gentamicin to kill any extra cellular bacteria prior to disrupting the cells. (P.I = post infection). Chart C shows the numbers of gentamicin protected intracellular bacteria surviving at 8h P.I. Note that the scale of the y-axis is logarithmic. Each assay was performed in duplicate for each strain with 3 biological repeats. The probability level for significance was regarded as P <0·05.
K12
SL
1344
SA
P45(E
SB
L)
SA
P45(c
ure
d)
SA
P46(E
SB
L)
SA
P46(c
ure
d)
SA
P59(K
12)
SA
P56(E
SB
L)
0
1
2
3
4
5
6
7
8
A :A d h e re n c e
s tra in s
Lo
g o
f C
FU
/ml
K 1 2
S L 1 3 4 4
S A P 4 5 (E S B L )
S A P 4 5 (c u re d )
S A P 4 6 (E S B L )
S A P 4 6 (c u re d )
S A P 5 9 (K 1 2 )
S A P 5 6 (E S B L )
K12
SL
1344
SA
P45(E
SB
L)
SA
P45(c
ure
d)
SA
P46(E
SB
L)
SA
P46(c
ure
d)
SA
P59(K
12)
SA
P56(E
SB
L)
0
1
2
3
4
5
6
7
B : In v a s io n
s tra in s
Lo
g o
f C
FU
/ml
K 1 2
S L 1 3 4 4
S A P 4 5 (E S B L )
S A P 4 5 (c u re d )
S A P 4 6 (E S B L )
S A P 5 9 (K 1 2 )
S A P 5 6 (E S B L )
K12
SL
1344
SA
P45(E
SB
L)
SA
P45(c
ure
d)
SA
P46(E
SB
L)
SA
P46(c
ure
d)
SA
P59(K
12)
SA
P56(E
SB
L)
0
1
2
3
4
5
6
C :S u rv iv a l 8 h P .I
s tra in s
Lo
g o
f C
FU
/ml
K 1 2
S L 1 3 4 4
S A P 4 5 (E S B L )
S A P 4 5 (c u re d )
S A P 4 6 (E S B L )
S A P 4 6 (c u re d )
S A P 5 9 (K 1 2 )
S A P 5 6 (E S B L )
Figure 52. The ability of APEC strains (SAP45 and SAP46) and K12 E.coli
carrying the ESBL plasmid to adhere, invade and survive in HD11 cells.

205
7.3.2 Human macrophage-like cells (THP1)
APEC are well-established pathogens of birds and recent evidence suggests that
this group of organisms may also be pathogenic to human (Mellata, 2013). For
example, the genomic sequences of human pathogenic E. coli strains and APEC
are very similar (Johnson et al., 2007). In addition, the IncI1 type ESBL plasmid
found in APEC strains, are also commonly found in human pathogenic E. coli strains
(Johnson & Nolan, 2009). Thus, the ability of APEC to adhere, invade and survive in
the human macrophage cell line THP-1 was examined. In addition, the influence of
the ESBL plasmid on these processes was examined. The assay protocols used
here mimicked those already described for the HD11 assays (adherence, invasion
and survival).
In general, approximately 10-fold more SAP44 cells adhered to THP-1 cells
than compared to the negative control strain (P<0.05) (Chart A in Figure 53). Yet
despite an increased number of SAP44 organisms attaching to the THP-1 cells, the
level of invasion found for SAP44 was similar to that for the poorly invasive negative
control strain. Furthermore, once SAP44 gained entry to the cells, there was no
evidence that it was not better able to survive than the negative control. Loss of both
plasmids from SAP44 did not significantly alter the ability of the strains to adhere,
invade or survive under these conditions. Only SAP44C, the SAP44 strain
complemented with the ESBL plasmid showed a different response. This strain
appeared to invade and survive in THP-1 cells better than all other SAP44

206
derivatives. For example, approximately 3 fold more intracellular cells were
recovered compared to the cured strains at 4 h post infection. By 8 h post-infection
the number of SAPP44C cells found within the macrophage was nearly 1 log higher
than for wild type SAP44 (Chart C in Figure 53 ). These findings may indicate that
recent acquisition of the ESBL plasmid suggest a role for conferring virulence
phenotype, but may be induced by different host cell line.
On the other hand, other APEC of different types harbouring ESBL plasmid did not
show the same pattern of variation that seen in SAP44 derivatives in invasion or
survivability into THP-1 cells. Indeed, one APEC isolate, SAP46 adhered at levels
even higher than the positive control strain, SL1344. The invasiveness of SAP45 WT
(O7) and its derivative SAP45 cured strains was less than the positive control
SL1344 but was remarkably more than the poorly invasive control E.coli K12 strain
and SAP46, SAP24 and their derivatives P-value ˂ 0.05 ( Chart B in Figure 54).
However, reduction in the survivability was equal to the E. coli, K12 and other tested
strain when compared to the positive control SL1344 with a P-value ˂ 0.05 (Chart C
in Figure 54).

207
Figure 53. The ability of APEC O78 strains carrying the ESBL plasmid to adhere, invade and survive in THP-1 cells.
K12
SL
1344
SA
P44(W
T)
SA
P44F
SA
P44(c
ure
d)
SA
P44C
0
1
2
3
4
5
6
7
8
A :A d h e re n c e
s tra in s
Lo
g o
f C
FU
/ml
K 1 2
S L 1 3 4 4
S A P 4 4 (W T )
S A P 4 4 (c u re d )
S A P 4 4 C
S A P 4 4 F
K12
SL
1344
SA
P44(W
T)
SA
P44F
SA
P44(c
ure
d)
SA
P44C
0
1
2
3
4
5
6
7
B : In v a s io n
s tra in s
Lo
g o
f C
FU
/ml
K 1 2
S L 1 3 4 4
S A P 4 4 (W T )
S A P 4 4 (c u re d )
S A P 4 4 F
S A P 4 4 C
K12
SL
1344
SA
P44(W
T)
SA
P44F
SA
P44(c
ure
d)
SA
P44C
0
1
2
3
4
5
6
C :S u rv iv a l 8 h P .I
s tra in s
Lo
g o
f C
FU
/ml
K 1 2
S L 1 3 4 4
S A P 4 4 (W T )
S A P 4 4 (c u re d )
S A P 4 4 C
S A P 4 4 F
THP-1 assays (A: Adherence, B: Invasion and C: survival after 8 hours (P.I: post infection) of APEC SAP44 (WT) and its derivatives (see table) compared with highly virulent S. Typhimurium SL1344 and the low invasive control strain E. coli K12 over time. Chart A shows the number of bacteria adhered (calculated by numbers of viable counts associated minus numbers invaded). 2h P.I. Chart B shows the number of bacteria invaded at 4 h P.I following the addition of 100µg/ml gentamicin to kill any extra cellular bacteria prior to disrupting the cells. (P.I = post infection). Chart C shows the numbers of gentamicin protected intracellular bacteria surviving at 8h P.I. Note that the scale of the y-axis is logarithmic. Each assay was performed in duplicate for each strain with 3 biological repeats. The probability level for significance was regarded as P <0·05.

208
Figure 54. The ability of APEC strains (SAP45 and SAP46) and K12 E.coli carrying the ESBL plasmid to adhere, invade and survive in THP-1 cells.
A :A d h e re n c e
s tra in s
Lo
g o
f C
FU
/ml
K1
2
SL
13
44
SA
P4
5(W
T)
SA
P4
5(c
ure
d)
SA
P4
6(W
T)
SA
P4
6(c
ure
d)
SA
P2
4
SA
P1
40
(ES
BL
)
0
2
4
6
8
K 1 2
S L 1 3 4 4
S A P 4 5 (W T )
S A P 4 5 (c u re d )
S A P 4 6 (W T )
S A P 4 6 (c u re d )
S A P 2 4
S A P 1 4 0 (E S B L )
B : In v a s io n
s tra in sL
og
of
CF
U/m
l
K1
2
SL
13
44
SA
P4
5(W
T)
SA
P4
5(c
ure
d)
SA
P4
6(W
T)
SA
P4
6(c
ure
d)
SA
P2
4
SA
P1
40
(ES
BL
)
0
2
4
6
8
K 1 2
S L 1 3 4 4
S A P 4 5 (W T )
S A P 4 5 (c u re d )
S A P 4 6 (W T )
S A P 4 6 (c u re d )
S A P 2 4
S A P 1 4 0 (E S B L )
C :S u rv iv a l 8 h P .I
s tra in s
Lo
g o
f C
FU
/ml
K1
2
SL
13
44
SA
P4
5(W
T)
SA
P4
5(c
ure
d)
SA
P4
6(W
T)
SA
P4
6(c
ure
d)
SA
P2
4
SA
P1
40
(ES
BL
)
0
1
2
3
4
5
K 1 2
S L 1 3 4 4
S A P 4 5 (W T )
S A P 4 5 (c u re d )
S A P 4 6 (W T )
S A P 4 6 (c u re d )
S A P 2 4
S A P 1 4 0 (E S B L )
THP-1assays (A: Adherence, B: Invasion and C: survival after 8 hours (P.I: post infection) of APEC SAP45, SAP46 and SAP24 strains with their derivatives compared with highly virulent S. Typhimurium SL1344 and the low invasive control strain E. coli K12 over time. Chart A shows the number of bacteria adhered (calculated by numbers of viable counts associated minus numbers invaded).2h P.I. Chart B shows the number of bacteria invaded at 4 h P.I following the addition of 100µg/ml gentamicin to kill any extra cellular bacteria prior to disrupting the cells. (P.I = post infection). Chart C shows the numbers of gentamicin protected intracellular bacteria surviving at 8h P.I. Note that the scale of the y-axis is logarithmic. Each assay was performed in duplicate for each strain with 3 biological repeats. The probability level for significance was regarded as P <0·05.

209
7.4 APEC interactions with human intestinal Caco2 epithelial cells
As well as interacting with macrophages, it is likely that APEC come into contact with
intestinal epithelial cells when transmitting through the intestine and this may
represent an alternative route of infection (Dziva & Stevens, 2008). In order to
examine the role of the plasmids on APEC interactions with intestinal epithelial cells,
adherence and invasion studies were also performed using Caco2 cells. As before,
the different APEC strains as well as the E. coli K12 transconjugants were included
to enable comparative analysis.
Approximately 10-fold more SAP44 cells adhered to the Caco2 epithelial cells
than the E. coli negative control strain. Indeed, the level of adherence was not
significantly different to that achieved by the positive control strain. However, SAP44
were much less able to invade Caco-2 cells than SL1344. The number of
intracellular SAP44 bacteria detected was of an intermediate level of approximately
103 cfu/mL compared to the positive (105) and negative (<102 cfu) controls,
respectively (Figure 55). The loss of both or one of the plasmids present in SAP44
had no significant impact of any of the parameters tested.
Both of the other wildtype APEC strains adhered effectively to Caco2 cells,
with SAP46 adhering at a level significantly higher than the positive control strain
(SL1344). However, compared to SL1344, this strain was poorly invasive, with 103
cfu fewer intracellular bacteria being found at 4 h post infection. Carriage of the
ESBL plasmid appeared to promote cellular invasion in this strain as significantly

210
fewer cells were recovered in assays using the cured strain compared to the wild
type. Of the three APEC isolates, SAP45 invaded Caco2 cells to the greatest extent
with 105 cfu/ml found (Figure 56, chart B). No significant difference in adherence or
invasion was found in E. coli K12 (SAP59) following acquisition of the ESBL plasmid
(SAP 56), although both strains adhered significantly more (1 log) than the negative
control strain (Figure 56).
These results suggest that the ability of APEC O78 strains to adhere and invade to
Caco2 is not associated with the ESBL plasmid, but more likely due to the carriage
of host-specific virulence factors. It is also possible that the ESBL plasmid may play
a different role in APEC belonging to different O serogroups and/or at different stage
of the infection process.

211
CACO2 assays (A: Adherence, and B: Invasion) of APEC SAP44 (WT) and SAP24 (WT) strains with their derivatives compared with highly virulent S. Typhimurium SL1344 and the low invasive control strain E. coli K12 over time. Chart A: shows the number of bacteria adhered (calculated by numbers of viable counts associated minus numbers invaded). Chart B shows the number of bacteria invaded at 4 h P.I following the addition of 100µg/ml gentamicin to kill any extra cellular bacteria prior to disrupting the cells. (P.I = post infection). Note that the scale of the y-axis is logarithmic. Each assay was performed in duplicate for each strain with 3 biological repeats. The probability level for significance was regarded as P <0·05.
K12
SL1344
SA
P44(W
T)
SA
P44(p
lasm
idle
ss)
SA
P44C
SA
P44F
SA
P24
SA
P140
0
2
4
6
8
A :A d h e re n c e
s tra in s
Lo
g o
f C
FU
/m
l
K 1 2
S L 1 3 4 4
S A P 4 4 (W T )
S A P 4 4 (p la s m id le s s )
S A P 4 4 C
S A P 2 4
S A P 1 4 0
S A P 4 4 F
k12
SL1344
SA
P44(W
T)
SA
P44(p
lasm
idle
ss)
SA
P44C
SA
P44F
SA
P24
SA
P140
0
2
4
6
B : In v a s io n
s tra in s
Lo
g o
f C
FU
/m
l
k 12
S L 1 3 4 4
S A P 4 4 (W T )
S A P 4 4 (p la s m id le s s )
S A P 4 4 C
S A P 4 4 F
S A P 2 4
S A P 1 4 0
Figure 55. The ability of APEC O78 strains carrying the ESBL plasmid to
adhere, invade CACO2 cells.

212
CACO2 assays (A: Adherence and B: Invasion) of APEC SAP45, SAP46 and K12 SAP59 strains with their derivatives compared with highly virulent S. Typhimurium SL1344 and the low invasive control strain E.coli K12 over time. Chart A: shows the number of bacteria adhered (calculated by numbers of viable counts associated minus numbers invaded). Chart B: shows the number of bacteria invaded at 4 h P.I following the addition of 100µg/ml gentamicin to kill any extra cellular bacteria prior to disrupting the cells. (P.I = post infection).Note that the scale of the y-axis is logarithmic. Each assay was performed in duplicate for each strain with 3 biological repeats. The probability level for significance was regarded as P <0·05.
K12 P
SAP45(E
SBL)
SAP45(c
ure
d)
SAP46(W
T)
SAP46(c
ure
d)
SAP59(K
12)
SAP56(E
SBL)
0
2
4
6
8
s tra in s
Lo
g o
f C
FU
/m
l
K 1 2
P
S A P 4 5 (E S B L )
S A P 4 5 (c u re d )
S A P 4 6 (W T )
S A P 5 9 (K 1 2 )
S A P 5 6 (E S B L )
S A P 4 6 (c u re d )
A : A d h e re n c e
k12
SL1344
SAP45(W
T)
SAP45(c
ure
d)
SAP46(W
T)
SAP46(c
ure
d)
SAP59(K
12)
SAP56(E
SBL)
0
2
4
6
s tra in s
Lo
g o
f C
FU
/m
l
k 12
S L 1 3 4 4
S A P 4 5 (W T )
S A P 4 5 (c u re d )
S A P 4 6 (W T )
S A P 4 6 (c u re d )
S A P 5 9 (K 1 2 )
S A P 5 6 (E S B L )
B : In v a s io n
Figure 56. The ability of APEC strains (SAP45 and SAP46) and K12 E.coli carrying the ESBL plasmid to adhere, invade CACO2 cells.

213
7.5 Colonisation and lethality of Galleria mellonella infected with APEC
Previous studies using Galleria mellonella as an in vivo model indicated how the
levels of virulence factors carried by UPEC isolates associated with the degree of
lethality to the larvae which makes it a good tool to investigate the virulence of a
range of bacteria (Alghoribi et al., 2014). Here, it was used to assess the differences
between APEC containing ESBL plasmid and their derivative cured strains. Galleria
mellonella larvae were infected with each strain with a dose of 104 CFU of bacterial
cells or PBS (as a negative control) in 10 µl in the right foreleg using a Hamilton
syringe. All larvae were incubated at 37oC for 24 hours to determine the rate of
survival and macroscopic appearance.
Injection of 104 cfu of SAP44 resulted in the death of most larvae with only
10% still alive by 12 h (Figure 57, Table 24). In contrast, nearly 100% of
uninoculated or PBS-inoculated larvae present in the control groups survived. With
the exception of SAP44C, all other SAP44 derivatives regardless of plasmid content
caused a similar percentage of larvae death as the wild type. In contrast only 40% of
larvae infected with SAP44C died giving rise to a significant difference in the survival
caused by these strains (two tailed t test (P<0.05) (see the table in appendix IV).
The number of bacteria recovered in the larvae at different times post infection is
shown in Figure 58 . While the number of bacteria recovered for most SAP44
derivatives increased over the course of the infection, this was not the case for
SAP44C. The number of SAP44C cells recovered declined over 3 logs before rapidly
increasing between 5 and 10 h post infection. The percentage of viable larvae
following injection with the naïve O78 isolate (SAP24) or its ESBL-harbouring
derivative SAP140 was similar at about 10%. Whereas the survival following

214
injection with the non-APEC E. coli K12 strain (SAP59) or its ESBL-harbouring
derivative (SAP56) was slightly higher at 15%. Overall, APEC isolates appear slightly
more virulent in the larvae model than laboratory E. coli K12 strains, although
carriage of APEC plasmids does not appear to play a role in this phenotype.
Figure 57. The ability of bacterial hosts carrying ESBL plasmid to cause infection in
Galleria mellonella.
s tra in s
Per
cen
tag
e su
rviv
al (
%)
Un in
fec te
d co n tr
o l
P BS c
o n tro l
S AP 4 4 (W
T )
S AP 4 4 (c
u re d )
S AP 4 4 C
S AP 4 4 F
S AP 2 4
S AP 1 4 0
S AP 5 9 (K
1 2 )
S AP 5 6 (E
S BL )
0
2 0
4 0
6 0
8 0
1 0 0
The ability of APEC and K12 strains (104 cfu) to kill Galleria mellonella at 37oC. Results are presented as percentage survival of the larvae. Group of 10 larvae were used, and the results presented are the mean of at least 5 independent experiments reported at 12 hours post infection. Significant analysis was tested using two-tailed t test (p <0.05).

215
Figure 58. Number of bacteria (cfu/ml) recovered from larvae infected with APEC at various
times post infection.
T im e in h o u rs
Lo
g o
f C
FU
/ml
0 5 1 0 1 5
0
5
1 0
1 5
S A P 4 4 (W T )
S A P 4 4 (c u re d )
S A P 4 4 F
S A P 4 4 C
P <0.05
Larvae were injected with 104 cfu of APEC isolate SAP44 or its various plasmid-bearing derivatives. Haemolymph from representative viable larvae at various times post infection was collected and the number of viable bacteria enumerated by serial dilution and plating on selective media. As it can be seen SAP44C showed significant reduction in CFU after 5 hours post infection while other SAP44 strains remain increasing in cfu during infection period. P <0.05.

216
7.6 Discussion
APEC are implicated in a complex of systemic infections in poultry which can result
in high morbidity and mortality (Pourbakhsh et al., 1997). The high genome
homology between APEC and other ExPEC of human and animal origin draw
attention to the potential zoonotic risk of APEC (Mellata, 2013). In this study the
potential contribution of ESBL plasmid to APEC virulence was assessed using
biofilm formation and three different cell cultures lines (HD11, THP1 and CACO2).
Furthermore, an in vivo, Gallaria mellonella larvae virulence model was also used.
In general, APEC strains belonging to the O78 serotype with and without the
ESBL plasmid formed better biofilms at 30˚C than 37˚C and 42˚C. However,
variability in the level of biofilm formation was significant. The wild type strain SAP44
(O78) and its derivatives produce more biofilm when compared to wild type strain
SAP24 (O78) and its derivative SAP140. Interestingly, when SAP44 (O78) carrying
the ESBL plasmid as a single plasmid the production of biofilm was reduced
compared to the wild type and the other derivative strains at 30˚C . However, at
different temperatures that mimic the host temperature of humans and poultry at
37˚C and 42˚C, respectively the ESBL plasmid significantly enhanced the biofilm
production, whereas the wild type and derivative strains were not able to form
biofilms at these conditions. A correlation between ESBL production and biofilm
formation was also observed in E. coli strains by other researchers (Subramanian et
al., 2012). Interestingly, the plasmid did not seem to have any significant effect on
K12 E.coli, SAP45 and SAP46 and their derivatives in all test conditions. The biofilm
produced by the plasmid-cured strains (SAP44 plasmidless) was high at 30˚C , is

217
probably induced by non-plasmidic genes being expressed only at 30˚C such as
curli required for development of biofilm and adhesions at the early stage of biofilm
formation (Kikuchi et al., 2005).
The analysis of the ESBL plasmid DNA from APEC in the previous chapter
(Figure 22) showed that it contains genes encoding type IV pili mediate conjugal
transfer of this plasmid. These genes have been shown to be essential in adherence
to and invasion of epithelial cells (Zhang et al., 2000). In this study, the carriage of an
ESBL plasmid by K12 E.coli strains did not confer any virulence advantage over a
plasmid-less strain, even though the plasmid contains the IV pili genes. APEC
strains with and without ESBL plasmids were able to adhere to tissue culture cells in
the same pattern as the positive control Salmonella strain (SL1344). This may also
confirm that the IV pili is not essential in the bacterial adherence. These results
comes in agreement with Srimanote et al. (2002) who stated that, the pili in plasmid
PO113 belong to IncI has no role in adhesion to the epithelial cells. However, recent
acquisition of ESBL plasmid by APEC O78 strain as a single plasmid showed ability
to invade human macrophage cells and to survive in both avian and human
macrophages. The results were consistence with the ability to this strain to form
biofilm in conditions that mimic the temperature in human and chicken host.
The tissue culture data generated for APEC strains of other O groups, SAP45
and SAP46 were rather complex. For example, the wild type SAP45 (O7) and its
cured strain showed ability to adhere and invade the THP-1 and Caco2 cells, but
only the cured strain was able to survive in HD11 cells. Likewise, the wild type APEC
SAP46 (O15) showed ability to adhere toTHP-1 cells significantly more than its cured

218
strains and other APEC tested strains, but were not able to invade or survive in
HD11 cells. It seems that the elimination of the plasmid that encoded the ESBL
production did not influence the ability of strains to adhere or invade the cells,
indicating that the adherence or invasion of these APEC strains is chromosomal
rather than plasmid mediated.
In this study, the Galleria mellonella virulence model was employed to further
assess the difference between APEC O78 strains carrying the ESBL plasmid and
their respective cured strains. Galleria mellonella, the larvae of the Greater wax moth
were infected with each strain to evaluate the ability to kill the larvae. This model has
been used previously to assess the virulence of different bacterial species including
ExPEC strains (Alghoribi et al., 2014; Senior et al., 2011; Mukherjee et al., 2010).
Almost all of uninfected larvae and larvae infected with PBS were alive at
12hr, but the survival rate of larvae infected with K12 and APEC O78 strains with
and without the ESBL plasmids was reduced compared to the control. In addition,
SAP44C strains contains ESBL plasmid as a single plasmid was less efficient at
killing the larvae and was attenuated compared to the wild type SAP44 (contains two
plasmids:pSAP44 and pFIB44) and plasmid cured strains indicating that the plasmid
may has attenuated the bacteria virulence. This result was also confirmed by the
level SAP44C strain in the larvae during the infection time which was 5 times less
than the parent and derivative strains. The difference in in vivo growth was not seen
in the in vitro growth rates of isolates with and without ESBL plasmid in rich media. It
seems that the majority SAP44C was killed in the first 5 hours and may be
persistence bacterial cells start to multiply after the 5 hours of infection or the

219
bacterial cells has a long lag phase before they reach the exponential growth phase.
However, from the virulent model experiments the effect of the absence or presence
the ESBL plasmid in APEC O78 strains was less clear as the cured plasmid was still
able to kill the larvae as the wild type and other strain, but in different background
harbouring the plasmid (K12, E. coli).

220
Final Discussion

221
8 .Final Disccussion
The increased prevalence of ESBL producing E. coli represent a significant concern
in human and veterinary health (Smet et al., 2010). The emergence of community-
acquired ESBL E. coli infections and their detection in livestock has increased in
recent years, indicating the successful transmission of this resistance determinant
outside of the clinical disease setting (Guenther et al., 2011). Molecular
epidemiological studies have indicated that certain conjugative plasmids such as
IncI1, are associated with prevalent ESBL types in particular the CTX-M allele, in E.
coli and ExPEC in particular (Johnson et al., 2012; Smet et al., 2010; Hopkins et al.,
2006; Cantón et al., 2012). Plasmids belonging to the IncI1 replicon are thus viewed
as ‘epidemic plasmids’ responsible for the dissemination of CTX-M resistance genes
across different bacterial species in human and animals (Hopkins et al., 2006). For
example, in recent years ESBL types such as CTX-M-1, CTX-M-2 and CTX-M-14,
has been found in E. coli poultry isolates from many European countries (Cantón et
al., 2012).
A wide range of virulence genes have been reported for APEC, several of
which are associated with large plasmids, such as the Col V plasmid (Mellata et al.,
2009). Plasmid-encoded virulence genes enhance the ability of APEC to exploit the
host, promoting its spread and persistence in the bacterial community (Pitout, 2012).
However, there are limited studies on the role of common plasmids such as the IncI1
rep type, in APEC. Most studies highlight the epidemiological prevalence of drug
resistant and/or virulence plasmids in isolates of E. coli from human and poultry

222
origins (Ben Sallem et al., 2014; Accogli et al., 2013; Johnson et al., 2012). However,
fewer consider the impact of plasmid acquisition on APEC virulence, or how multiple
large plasmids function together inside the host bacterium. This is surprising given
that several studies indicate that the zoonotic risk of APEC is linked to the presence
of these mobile genetic elements (Stehling et al., 2003). Thus, in order to better
understand the reasons for the widespread dissemination of ESBL plasmids, this
thesis examined the advantages and disadvantages of ESBL plasmid carriage in
APEC, including the impact of such plasmids on the co-existing plasmids that are
characteristic of this pathotype.
In this study, four wild type APEC strains were selected for detailed
phenotypic and genotypic investigations. Three of the isolates were confirmed as
ESBL-producers, whereas the fourth was a non-ESBL-producing APEC O78 strain.
In chapter 3 and 4 of this thesis, the selected strains and their plasmids were
characterised phenotypically and genetically. Cured and plasmid-complemented
derivatives of these strains were generated and used in chapters 5, 6 and 7 to study
the impact of ESBL plasmid carriage on the phenotype of APEC strain in a variety of
in vitro and in vivo assays.
While the ESBL-producing isolates examined in this study belonged to
different O-antigen types and phylogenetic groups, all harboured an identical ESBL
plasmid belonging to the IncI1replicon type and containing the blaCTX-M-1 gene. The
plasmid (herein named pSAP44) was 105,610 bp in size and encoded all three
genes inc, repY and repZ that are essential for replication maintenance and control
of the plasmid copy number in the host bacterium (Sampei et al., 2010). Sequencing

223
revealed the presence of several virulence genes in addition to another antibiotic
resistance element (tetracycline resistance cassette). The IncI1 plasmid was
transferable via conjugation and mobilised to other APEC strains in conditions that
mimic the chicken caeca.
Further analysis of the region adjacent to blaCTX-M-1 identified that the insertion
sequence ISEcp1 was located downstream of the gene. Previous data from
molecular epidemiology studies has shown that ISEcp1 is associated with the
prevalence of CTX-M-1(Jacoby, 2009). Interestingly, the plasmid also encoded
resistance genes to tetracycline (tetRA); therefore persistence and spread of the
IncI1 plasmid could also be driven by antibiotic pressure from non-β-lactam drugs.
This is particularly relevant for APEC because tetracycline was a commonly used
antimicrobial growth promoter (AGP) prior to the 2006 EU ban on their use in food
producing animals. The ban was initiated through the European Common Market in
the mid-1970s as a result of increased antimicrobial resistance in bacteria isolated
from animal and farm workers (Marshall & Levy, 2011).
In epidemiological studies, IncI1 plasmids have been related to a number of
ESBL types such as CTX, SHV and TEM-encoding β-lactamases (Bortolaia et al,.
2010; Ben Sallem et al., 2014; Accogli et al., 2013; Johnson et al., 2012). In addition,
IncI1 plasmids harbouring ESBL genes have been detected in different isolates of
Enterobacteriaceae (Dolejska et al., 2013).These data suggest that IncI1 plasmids
are common in bacterial pathogens isolated from humans and animals.
Compared to other CTX-M-1-encoding IncI1 plasmids (e.g. pC49-108(Wang et al.,
2014)), pSAP44 showed few differences in DNA content. However, regions of

224
difference were found in mobile elements and insertion sequences, including the
presence of an inverted repeat sequence of 7 bp (tatttgc-ataaacg) downstream of the
replicon region. These sequences flanked the tetR-tetA-pecM gene cluster in
pSAP44, whereas in pC49-108, they flanked a class 1 integron.
Therefore, this inverted repeat sequence located downstream of the replicon
region may act as a ‘hotspot’ for the deletion and insertion of new mobile elements.
In addition, two genes were absent in pSAP44, traD, which usually forms part of the
traABCD operon responsible for transfer expression, and pilJ, one of the pil genes
which are involved in formation of the type IV pilus involved in conjugation (Sampei
et al., 2010). Given that pSAP44 readily transferred to recipient cells, the data
suggests that these two genes are not essential for the conjugation process.
Examination of the sequence data revealed that pSAP44 contained a large
number of genes of unknown function (hypothetical proteins) compared to the co-
resident pFIB virulence plasmid present in the organism. Therefore, it would be
interesting to study the functional and role of these predicted proteins, as many
appear to be conserved in IncI1 plasmids.
The impact of ESBL-producing plasmids on strain fitness has been investigated
by a number of investigators (Yates et al., 2006; Humphrey et al., 2012; Vogwill &
MacLean 2015; Starikova et al., 2013; Enne et al., 2005). However, to date most
have overlooked the fact that other plasmids co-exist in the same host bacterium.
Yet such plasmids may have a profound impact on ESBL gene expression and/or on
the fitness ‘cost’ or ‘benefit’ associated with carriage of resistance elements. This
significant gap in knowledge was investigated in this thesis.

225
In addition to pSAP44, plasmids belonging to the IncFIB replicon type were
present in all the ESBL-producing APEC isolates examined. In fact, the IncFIB
plasmid type is prevalent in APEC strains and most virulence genes found in APEC
have been associated with this element (Johnson & Nolan, 2009). The FIB plasmid
from the APEC O78 isolate SAP44 was chosen for further study. This plasmid
(pFIB44) was 97, 245 bp in size and shared significant DNA identity to the Col V
plasmid (pAPEC-1(Mellata et al., 2009)). At least 80 kb of pFIB44 coded for
virulence factors which were similar to the factors harboured in previously
sequenced IncFIB plasmids of APEC origin (Mellata et al., 2009). The virulence
genes found on the IncFIB plasmid included three iron acquisition systems
(iroBCDN, sitABCD and iutA iucABCD), a colicin V operon (cvi and cva ABC),
temperature sensitive haemagglutinin (tsh), haemolysin protein (hlyF), macrolide
resistant genes (etsABC), increased serum survival (iss), and the outer membrane
protease gene (ompT). Interestingly, pSAP44 and pFIB 44 both encode colocin
proteins, but of different classes, Col1b and ColV, respectively. The presence of two
colicin types may provide a competitive advantage for survival and persistence in the
poultry intestinal tract (Johnson et al., 2010).
Comparative genomic analysis of the ESBL-producing and non-ESBL-
producing APEC O78 isolates revealed only minor differences in their content,
mainly to do with the number of plasmids, bacteriophages and other transposable
elements they harbour. The O78 strains (SAP44 and SAP24) contained fewer
bacteriophages and transposable elements than other unrelated APEC strain such
as APEC O1 and APEC O2, perhaps suggesting that APEC O78 serogroup

226
harbours mostly conserved genes. Regardless, this does not rule out that the
plasmids affect bacterial physiology and metabolism. As evident from the carbon
utilisation data, the acquisition of pSAP44 enhanced the respiratory capability of the
host bacterium compared to that of the cured host derivative. Specifically the ESBL-
complemented strain (SAP44C) was better to utilise formic acid, α-keto glutaric acid
and mono-methyl succinate than the cured strain. Conversely, the cured strain
exhibited better utilisation of D-Malic acid than derivatives harbouring either the FIB
or IncI1 plasmid. In general, the single plasmid-containing derivatives exhibited
decreased respiratory activity when exposed to 78% of the carbon sources whereas
there was increased respiratory activity when they were exposed to approximately
50% of the sulphur compounds compared to the wild type and plasmid-less strains.
This may be due to the plasmid interfering with chromosomally-encoded genes that
are involved in carbon metabolism in E. coli, which may be less likely for the sulphur-
containing compounds. A study examining the metabolic changes in resistant
Salmonella Typhimurium LTL found reduced utilisation of 10 and 5 carbon and
phosphorus sources, respectively, compared to the sensitive strain (Zheng et al.,
2011). Both findings suggest there is an alteration in the metabolic processes of the
cell due to the presence of antibiotic resistance genes.
Many virulence genes are controlled by the carbon catabolic repression
which means that the expression of these genes is linked to the supply of carbon in
the cell (as reviewed by Fuchs et al., 2012). In addition, virulence genes may have
dual function a part from its main role in virulence. For example, iron uptake systems

227
is not only involved in iron acquistion but also for expression of other virulence genes
in pathogenic E. coli strains (as reviewed by Fuchs et al., 2012).
The fitness of ESBL-producing and non-ESBL-producing APEC isolates and
transconjugants was determined by single strain and competitive growth assays.
There was no significant difference in the phenotypic growth rate in APEC strains
harbouring the ESBL plasmid. Moreover, no significant cost was observed when the
plasmid was introduced into a non-ESBL wild type APEC (SAP24). This may be
because the non-ESBL strain used in this thesis harbours multiple plasmids and so
the strain was able to adapt to the newly-introduced plasmid with no effect in its
growth rate. ESBL plasmid carriage in APEC O78 showed no fitness impact during
the longterm competitive growth assays. These results are different from those
reported by others. For example, plasmid RP1 belonging to IncP containing the
blaTEM-2 and tet genes conferring resistance to 1st generation β-lactams and
tetracycline respectively, caused a fitness deficit in five unrelated host strains
(Humphrey et al., 2012). However, Lenski et al. (1994) found in their study that the
tetracycline resistance gene (tetC) increased the fitness of the strains when the
plasmid was present in a co-evolved host. Although, the pSAP44 (ESBL plasmid)
contains tetracycline resistance genes, a fitness enhancement by these genes was
not detected. This would suggest that the role of tetracycline resistance gene in
increasing plasmid fitness was not significant.
Interestingly, the fitness cost in the wild type SAP44 (O78) strain was
associated with the presence of another plasmid belonging to the IncFIB replicon
during longterm competitive assays. Although, the overall size of pFIB44 (97.245bp)

228
was determined to be reduced compared to pSAP44 (IncI1 plasmid: 105,610bp), the
fitness burden could be attributed to the continual virulence gene expression by the
FIB plasmid compared to the IncI1 plasmid. On the other hand, pSAP44 (IncI1)
showed a fitness burden on its host carriage in different conditions. In low pH,
pFIB44 showed better acid tolerance for SAP44 whereas carrying ESBL plasmid
pSAP44 showed a cost fitness when exposed for a long time to acidic conditions.
The acid effect was also evident when the conjugation frequency of IncI1 plasmid
was increased in proportional with the increase in pH (from 4.3 to 7.0) which may
suggest that pSAP44 plasmid is not functional properly in low acid environment. Acid
tolerance in the presence of FIB plasmid may explain the association and prevalence
of this replicon type in APEC. Despite an apparent role for iron acquisition system in
FIB plasmid in APEC (Mellata et al., 2012), it was also evident in this study that
pSAP44 (IncI1) plasmid enhanced the growth of APEC O78 strains in iron limited
media. Further work is necessary to identify the genes required for iron acquisition in
pSAP44 (IncI1). The above findings may suggest that these plasmids play different
role in APEC’s ability to persist in the poultry intestinal tract and virulence, but in
different conditions.
The results of the virulence experiments showed variability among APEC
invasion and survivability in in vitro infection assays using HD11, THP-1 and Caco-2
cell lines. However, when cured plasmid-less O78 strains complemented with
pSAP44 plasmid, the virulence increased with regard to invasion and survival in
human and chicken macrophages. Furthermore, when the cured plasmid-less O78
strains complemented with pSAP44 plasmid were tested, the biofilm production was

229
enhanced at 37oC and 42oC which mimic the human and chicken temperature,
respectively. The IncI1 plasmid carrying CTX-M-1 has been reported in E. coli strains
isolated from human patients and in poultry suggesting the potential link between
these human and animal settings (da Silva & Mendonça, 2012). In this study
sequence analysis identified type IV pili genes in IncI1 plasmid. These genes were
described previously to contribute to the adhesion and invasion of Shiga-toxigenic E.
coli (da Silva & Mendonça, 2012). The results presented in SAP44 O78 strain may
not always apply to other strains. This was evident when the cured strain
complemented with pSAP44 showed less invasion rate at the early hours (post
infection) in G. mellonella model comparing to the cured, wildtype strains and SAP24
related O78 strain.
In conclusion, this thesis suggests that the pSAP44 (IncI1) plasmid
harbouring CTX-M-1 is prominent among avian pathogenic E. coli strains of different
O and phylogenetic groups. The epidemiological success of this plasmid could be
attributed to chromosomal and/or specific plasmid elements rather than one
particular attribute. These beneficial elements may include the stability and
persistence in a broad range of hosts within the family Enterobacteriacae, the ability
to efficiently mobilise plasmids in both the chicken gut model and on solid media at
different pHs, and the lack of a fitness burden to new host strains following
stabilisation. However, further research is still required to understand the interactions
between the plasmid and the genome of the host bacterium. Thus, the original
hypothesis of this thesis that carriage of ESBL plasmids confers a burden to the host
bacterium is not as straightforward as expected. In particular a neglected area is the

230
interaction of ESBL plasmids with other plasmids and how these may interact with
bacterial host gene expression and affect the phenotype of the host bacterium. Thus,
the studies presented in this thesis have laid sound foundations for the further
investigation of the contribution of plasmids to APEC fitness and future studies
should investigate other APEC serotypes and plasmids of different replicon types.

231
Future perspectives
The emergence of ESBL-producing isolates in human and animal populations
remains problematic and is unlikely to slow in coming years. Added to this, the
possibility that zoonotic transmission of isolates between these two populations may
act to means to re-supply the ESBL plasmid pool is of grave concern. The findings
from this study have led to the identification of several areas of further study:
1. Distribution of CTX-M-1-harbouring plasmid in APEC population. This study
revealed that all three ESBL-producing isolates harboured identical blaCTX-M-1
containing plasmids. It would be interesting to explore in a larger number of isolates
and/or at different geographical locations how widespread this particular plasmid is in
APEC. It may also be interesting to examine if a similar plasmid has been detected
in human ExPEC isolates.
2. Role of the insertion element ISEcp1 in transmission of the resistance
plasmid. The ISEcp1 element was found to lie immediately upstream of the blaCTX-M-1
gene in the plasmid. Previous studies suggest a role for the element in the
dissemination of the plasmid. It would be interesting to explore the mechanistic basis
of this interaction with the idea of finding small molecule inhibitors that interfere with
its function and potentially abrogate ESBL plasmid transmission.
3. Role of host microbiota as a reservoir for resistance plasmids. In this
study, the ESBL plasmid readily transferred to other E. coli isolates, however, it
would be interesting to explore whether this plasmid was capable of transferring to
other species commonly found in the host intestine (e.g. Lactobacillus) . As such, it
may be that the normal host microbiota (of chickens or humans) acts a reserviour for

232
resistance plasmids. Ideally this would need to be assessed using a culture-
independent method as most of the intestinal microorganisms are not readily
cultured in the laboratory.
4. Impact of multiple large plasmids on plasmid biology and transmission. In
this study, often contrasting results were obtained when the target (resistance)
plasmid was present singly or in the presence of other plasmids in the host
bacterium. Further studies are required tease apart this phenomenon and
investigate how multiple plasmids function together within a single cell. To date, this
represents a largely unstudied aspect of plasmid biology, certainly in the context of
antimicrobial resistance.
5. The fitness advantage of ESBL plasmid in APEC O78 growth in iron limited
media. In these studies, the ESBL plasmid was beneficial to APEC O78 growth in
iron-limited media. It would be interesting to explore the genes that encode iron
transporters that are related to those found in the IncFIB plasmid.

233
9 .References
Accogli, M., Fortini, D., Giufrè, M., Graziani, C., Dolejska, M., Carattoli, A., & Cerquetti, M. (2013).
IncI1 plasmids associated with the spread of CMY-2, CTX-M-1 and SHV-12 in Escherichia coli
of animal and human origin. Clinical Microbiology and Infection, 19(5).
Adriana, H., Diana, O. I., Iulia, N., Victoria, A., & Raluca, J. (2012). Importance of moleculsar
epidemiology of gram negative bacilli. Therapeutics, Pharmacology and Clinical Toxicology.
Ajiboye, R. M., Solberg, O. D., Lee, B. M., Raphael, E., Debroy, C., & Riley, L. W. (2009). Global
spread of mobile antimicrobial drug resistance determinants in human and animal Escherichia
coli and Salmonella strains causing community-acquired infections. Clinical Infectious
Diseases : An Official Publication of the Infectious Diseases Society of America, 49(3), 365–
371.
Alghoribi, M. F., Gibreel, T. M., Dodgson, A. R., Beatson, S. A., & Upton, M. (2014). Galleria
mellonella infection model demonstrates high lethality of ST69 and ST127 uropathogenic E.
coli. PLoS ONE, 9(7).
Alvarez-Martinez, C. E., & Christie, P. J. (2009). Biological diversity of prokaryotic type IV secretion
systems. Microbiology and Molecular Biology Reviews : MMBR, 73(4), 775–808.
Ambler, R. (1980). The structure of beta-lactamases. Philos Trans R Soc Lond B Biol Sci, 289, 321–
31. Retrieved from http://www.ncbi.nlm.nih.gov/pubmed/6109327
Ambler, R. P., Coulson, A. F., Frère, J. M., Ghuysen, J. M., Joris, B., Forsman, M., … Waley, S. G.
(1991). A standard numbering scheme for the class A beta-lactamases. The Biochemical
Journal.
Angulo, F. J., Baker, N. L., Olsen, S. J., Anderson, A., & Barrett, T. J. (2004). Antimicrobial use in
agriculture: Controlling the transfer of antimicrobial resistance to humans. Seminars in Pediatric
Infectious Diseases.
Antão, E. M., Glodde, S., Li, G., Sharifi, R., Homeier, T., Laturnus, C., … Ewers, C. (2008). The
chicken as a natural model for extraintestinal infections caused by avian pathogenic Escherichia
coli (APEC). Microbial Pathogenesis, 45(5-6), 361–369. doi:10.1016/j.micpath.2008.08.005
Antão, E.-M., Wieler, L. H., & Ewers, C. (2009). Adhesive threads of extraintestinal pathogenic
Escherichia coli. Gut Pathogens, 1(1), 22.
Aoki, S., Hirakata, Y., Kondoh, A., Gotoh, N., Yanagihara, K., Miyazaki, Y., … Kamihira, S. (2004).
Virulence of metallo-beta-lactamase-producing Pseudomonas aeruginosa in vitro and in vivo.
Antimicrobial Agents and Chemotherapy, 48(5), 1876–1878.
Arabi, S., Jafarpour, M., Mirinargesi, M., Asl, S. B., Naghshbandi, R., & Shabanpour, M. (2013).
Molecular characterization of avian pathogenic escherichia coli in broilers bred in Northern Iran.
Global Veterinaria, 10(4), 382–386. doi:10.5829/idosi.gv.2013.10.4.72117

234
Asai, T., Masani, K., Sato, C., Hiki, M., Usui, M., Baba, K., … Sawada, T. (2011). Phylogenetic
groups and cephalosporin resistance genes of Escherichia coli from diseased food-producing
animals in Japan. Acta Veterinaria Scandinavica.
Aziz, R. K., Bartels, D., Best, A. A., DeJongh, M., Disz, T., Edwards, R. A., … Zagnitko, O. (2008).
The RAST Server: rapid annotations using subsystems technology. BMC Genomics, 9, 75.
Barrick, J. E., Kauth, M. R., Strelioff, C. C., & Lenski, R. E. (2010). Escherichia coli rpoB mutants
have increased evolvability in proportion to their fitness defects. Molecular Biology and
Evolution, 27(6), 1338–1347.
Bauchart, P., Germon, P., Brée, A., Oswald, E., Hacker, J., & Dobrindt, U. (2010a). Pathogenomic
comparison of human extraintestinal and avian pathogenic Escherichia coli - Search for factors
involved in host specificity or zoonotic potential. Microbial Pathogenesis, 49(3), 105–115.
Bauchart, P., Germon, P., Brée, A., Oswald, E., Hacker, J., & Dobrindt, U. (2010b). Pathogenomic
comparison of human extraintestinal and avian pathogenic Escherichia coli--search for factors
involved in host specificity or zoonotic potential. Microbial Pathogenesis, 49(3), 105–15.
doi:10.1016/j.micpath.2010.05.004
Bauernfeind, A., Grimm, H., & Schweighart, S. (1990). A new plasmidic cefotaximase in a clinical
isolate of Escherichia coli. Infection, 5, 294–5. Retrieved from
http://www.ncbi.nlm.nih.gov/pubmed/2276823
Bauernfeind, A., Holley, M., Jungwirth, R., Mangold, P., Röhnisch, T., Schweighart, S., … Goldberg,
M. (1992). A new plasmidic cefotaximase from patients infected with Salmonella typhimurium.
Infection, 20(3), 158–163.
Bauernfeind, A., Stemplinger, I., Jungwirth, R., Ernst, S., & Casellas, J. M. (1996). Sequences of
beta-lactamase genes encoding CTX-M-1 (MEN-1) and CTX-M-2 and relationship of their
amino acid sequences with those of other beta-lactamases. Antimicrobial Agents and
Chemotherapy, 40(2), 509–513.
Bearson, B. L., Wilson, L., & Foster, J. W. (1998). A low pH-inducible, PhoPQ-dependent acid
tolerance response protects Salmonella typhimurium against inorganic acid stress. Journal of
Bacteriology, 180(9), 2409–2417.
Ben Sallem, R., Ben Slama, K., Rojo-Bezares, B., Porres-Osante, N., Jouini, A., Klibi, N., … Torres,
C. (2014). IncI1 Plasmids Carrying blaCTX-M-1 or blaCMY-2 Genes in Escherichia coli from
Healthy Humans and Animals in Tunisia. Microbial Drug Resistance (Larchmont, N.Y.), 00(00).
Retrieved from http://www.ncbi.nlm.nih.gov/pubmed/24826863
Binns, M. M., Davies, D. L., & Hardy, K. G. (1979). Cloned fragments of the plasmid ColV,I-K94
specifying virulence and serum resistance. Nature, 279(5716), 778–781.
Birnbaum, S., & Bailey, J. (1991). Plasmid presence changes the relative levels of many host cell
proteins and ribosome components in recombinant Escherichia coli. Biotechnology and
Bioengineering, 37, 736–45. Retrieved from http://www.ncbi.nlm.nih.gov/pubmed/18600670

235
Björkman, J., Nagaev, I., Berg, O. G., Hughes, D., & Andersson, D. I. (2000). Effects of environment
on compensatory mutations to ameliorate costs of antibiotic resistance. Science (New York,
N.Y.), 287(5457), 1479–1482.
Blondeau, J. M. (2004). Fluoroquinolones: Mechanism of action, classification, and development of
resistance. Survey of Ophthalmology.
Bochner, B. R. (2009). Global phenotypic characterization of bacteria. FEMS Microbiology Reviews.
Bochner, B. R., Gadzinski, P., & Panomitros, E. (2001). Phenotype Microarrays for high-throughput
phenotypic testing and assay of gene function. Genome Research, 11(7), 1246–1255.
Bonnet.R. (2004). Growing Group of Extended-Spectrum �-Lactamases: the CTX-M Enzymes.
ANTIMICROBIAL AGENTS AND CHEMOTHERAPY, 48(1), 1–14. doi:10.1128/AAC.48.1.1–
14.2004
Bortolaia, V., Guardabassi, L., Trevisani, M., Bisgaard, M., Venturi, L., & Bojesen, A. M. (2010).
High diversity of extended-spectrum ??-lactamases in Escherichia coli isolates from Italian
broiler flocks. Antimicrobial Agents and Chemotherapy, 54(4), 1623–1626.
doi:10.1128/AAC.01361-09
Bortolaia, V., Larsen, J., Damborg, P., & Guardabassi, L. (2011). Potential pathogenicity and host
range of extended-spectrum ??-lactamase-producing Escherichia coli isolates from healthy
poultry. Applied and Environmental Microbiology, 77(16), 5830–5833.
Bradford, P. A. (2001). Extended-spectrum ??-lactamases in the 21st century: Characterization,
epidemiology, and detection of this important resistance threat. Clinical Microbiology Reviews.
Bradford, P. A., Urban, C., Jaiswal, A., Mariano, N., Rasmussen, B. A., Projan, S. J., … Bush, K.
(1995). SHV-7, a novel cefotaxime-hydrolyzing beta-lactamase, identified in Escherichia coli
isolates from hospitalized nursing home patients. Antimicrobial Agents and Chemotherapy,
39(4), 899–905.
Brolund, A., Edquist, P. J., Mäkitalo, B., Olsson-Liljequist, B., Söderblom, T., Wisell, K. T., & Giske,
C. G. (2014). Epidemiology of extended-spectrum β-lactamase-producing Escherichia coli in
Sweden 2007-2011. Clinical Microbiology and Infection, 20(6).
Bush, K., & Jacoby, G. A. (2010). Updated functional classification of ??-lactamases. Antimicrobial
Agents and Chemotherapy.
Bush, K., Jacoby, G. A., & Medeiros, A. A. (1995). A Functional Classification Scheme for beta-
Lactamases and Its Correlation with Molecular Structure. Antimicrobial Agents and
Chemotherapy, 39(6), 1211–1233. doi:10.1128/AAC.39.6.1211.Updated
Campbell, E. a., Korzheva, N., Mustaev, A., Murakami, K., Nair, S., Goldfarb, A., & Darst, S. a.
(2001). Structural mechanism for rifampicin inhibition of bacterial RNA polymerase. Cell,
104(6), 901–912. doi:10.1016/S0092-8674(01)00286-0

236
Cantón, R., & Coque, T. M. (2006). The CTX-M beta-lactamase pandemic. Current Opinion in
Microbiology, 9(5), 466–475.
Cantón, R., González-Alba, J. M., & Galán, J. C. (2012). CTX-M enzymes: Origin and diffusion.
Frontiers in Microbiology.
Cantón, R., Novais, a., Valverde, a., Machado, E., Peixe, L., Baquero, F., & Coque, T. M. (2008).
Prevalence and spread of extended-spectrum β-lactamase-producing Enterobacteriaceae in
Europe. Clinical Microbiology and Infection, 14(SUPPL. 1), 144–153. doi:10.1111/j.1469-
0691.2007.01850.x
Carattoli, A. (2009). Resistance plasmid families in enterobacteriaceae. American Society for
Microbiology, 53(6), 2227–2238. doi:10.1128/AAC.01707-08
Carattoli, A. (2011). Plasmids in Gram negatives: Molecular typing of resistance plasmids.
International Journal of Medical Microbiology.
Carattoli, A. (2013). Plasmids and the spread of resistance. International Journal of Medical
Microbiology.
Castanheira, M., Farrell, S. E., Krause, K. M., Jones, R. N., & Sader, H. S. (2014). Contemporary
diversity of β-lactamases among enterobacteriaceae in the nine U.S. census regions and
ceftazidime-avibactam activity tested against isolates producing the most prevalent β-lactamase
groups. Antimicrobial Agents and Chemotherapy, 58(2), 833–838.
Caudry, S. D., & Stanisich, V. a. (1979). Incidence of antibiotic-resistant Escherichia coli associated
with frozen chicken carcasses and characterization of conjugative R plasmids derived from such
strains. Antimicrobial Agents and Chemotherapy, 16(6), 701–709. doi:10.1128/AAC.16.6.701
Cengiz, O., Koksal, B. H., Tatli, O., Sevim, O., Avci, H., Epikmen, T., … Onol, a. G. (2012).
Influence of dietary organic acid blend supplementation and interaction with delayed feed access
after hatch on broiler growth performance and intestinal health. Veterinarni Medicina, 57(10),
515–528.
Chiu, C. H., Tang, P., Chu, C., Hu, S., Bao, Q., Yu, J., … Lee, Y. S. (2005). The genome sequence of
Salmonella enterica serovar Choleraesuis, a highly invasive and resistant zoonotic pathogen.
Nucleic Acids Research, 33(5), 1690–1698.
Clermont, O., Olier, M., Hoede, C., Diancourt, L., Brisse, S., Keroudean, M., … Denamur, E. (2011).
Animal and human pathogenic Escherichia coli strains share common genetic backgrounds.
Infection, Genetics and Evolution : Journal of Molecular Epidemiology and Evolutionary
Genetics in Infectious Diseases, 11(3), 654–62. doi:10.1016/j.meegid.2011.02.005
Cloeckaert, A., Praud, K., Lefevre, M., Doublet, B., Pardos, M., Granier, S. A., … Weill, F. X.
(2010). IncI1 plasmid carrying extended-spectrum-β-lactamase gene bla CTX-M-1 in
Salmonella enterica isolates from poultry and humans in France, 2003 to 2008. Antimicrobial
Agents and Chemotherapy, 54(10), 4484–4486.

237
Collingwood, C., Kemmett, K., Williams, N., & Wigley, P. (2014). Is the Concept of Avian
Pathogenic Escherichia coli as a Single Pathotype Fundamentally Flawed? Frontiers in
Veterinary Science, 1(October), 1–4. doi:10.3389/fvets.2014.00005
Connell, S. R., Tracz, D. M., Nierhaus, K. H., & Taylor, D. E. (2003). Ribosomal Protection Proteins
and Their Mechanism of Tetracycline Resistance. Antimicrobial Agents and Chemotherapy.
Connor, E. E. (1998). Sulfonamide antibiotics. Primary Care Update for Ob/Gyns, 5(1), 32–35.
doi:10.1016/S1068-607X(97)00121-2
Cooksey, R., Swenson, J., Clark, N., Gay, E., & Thornsberry, C. (1990). Patterns and mechanisms of
beta-lactam resistance among isolates of Escherichia coli from hospitals in the United States.
Antimicrobial Agents and Chemotherapy, 34(5), 739–745.
Coque, T. M., Novais, Â., Carattoli, A., Poirel, L., Pitout, J., Peixe, L., … Nordmann, P. (2008).
Dissemination of clonally related Escherichia coli strains expressing extended-spectrum β-
lactamase CTX-M-15. Emerging Infectious Diseases, 14(2), 195–200.
Costa, D., Vinué, L., Poeta, P., Coelho, A. C., Matos, M., Sáenz, Y., … Torres, C. (2009). Prevalence
of extended-spectrum beta-lactamase-producing Escherichia coli isolates in faecal samples of
broilers. Veterinary Microbiology, 138(3-4), 339–344.
Croxen, M. A., & Finlay, B. B. (2010). Molecular mechanisms of Escherichia coli pathogenicity.
Nature Reviews. Microbiology, 8(1), 26–38.
Da Silva, G. J., & Mendonça, N. (2012). Association between antimicrobial resistance and virulence
in Escherichia coli. Virulence, 3(1), 18–28. doi:10.4161/viru.3.1.18382
Dahlberg, C., & Chao, L. (2003). Amelioration of the Cost of Conjugative Plasmid Carriage in
Eschericha coli K12. Genetics, 165(4), 1641–1649.
Datta, N., & Kontomichalou, P. (1965). Penicillinase synthesis controlled by infectious R factors in
Enterobacteriaceae. Nature, 208(5007), 239–241.
Dhillon, A., & Jack, O. (1996). Two outbreaks of colibacillosis in commercial caged layers. Avian
Diseases, 40(3), 742–746. Retrieved from http://www.ncbi.nlm.nih.gov/pubmed/8883810
Dhillon, F. S. L. (2015). “IslandViewer 3: more flexible, interactive genomic island discovery,
visualization and analysis.” Nucleic Acids Research . doi:doi: 10.1093/nar/gkv401
Dho-Moulin, M., & Fairbrother, J. M. (1999). Avian pathogenic Escherichia coli (APEC). Veterinary
Research.
Dias Da Silveira, W., Ferreira, A., Brocchi, M., Maria De Hollanda, L., Pestana De Castro, A. F.,
Tatsumi Yamada, A., & Lancellotti, M. (2002). Biological characteristics and pathogenicity of
avian Escherichia coli strains. Veterinary Microbiology, 85(1), 47–53.
Diaz-Ricci, J. C., Bode, J., Jong Il Rhee, & Schugerl, K. (1995). Gene expression enhancement due to
plasmid maintenance. Journal of Bacteriology, 177(22), 6684–6687.

238
Dionisio, F., Conceição, I. C., Marques, A. C. R., Fernandes, L., & Gordo, I. (2005). The evolution of
a conjugative plasmid and its ability to increase bacterial fitness. Biology Letters, 1(2), 250–252.
Doi, Y., & Arakawa, Y. (2007). 16S ribosomal RNA methylation: emerging resistance mechanism
against aminoglycosides. Clinical Infectious Diseases : An Official Publication of the Infectious
Diseases Society of America, 45(1), 88–94.
Dolejska, M., Villa, L., Hasman, H., Hansen, L., & Carattoli, A. (2013). Characterization of IncN
plasmids carrying blaCTX-M-1 and qnr genes in Escherichia coli and Salmonella from animals,
the environment and humans. Journal of Antimicrobial Chemotherapy, 68(2), 333–339.
Dozois, C. M., Daigle, F., & Curtiss, R. (2003). Identification of pathogen-specific and conserved
genes expressed in vivo by an avian pathogenic Escherichia coli strain. Proceedings of the
National Academy of Sciences of the United States of America, 100(1), 247–252.
Dubois, D., Prasadarao, N. V, Mittal, R., Bret, L., Roujou-Gris, M., & Bonnet, R. CTX-M beta-
lactamase production and virulence of Escherichia coli K1., 15 Emerging infectious diseases
1988–1990 (2009).
Dziva, F., & Stevens, M. P. (2008). Colibacillosis in poultry: unravelling the molecular basis of
virulence of avian pathogenic Escherichia coli in their natural hosts. Avian Pathology : Journal
of the W.V.P.A, 37(4), 355–366.
Ebersbach, G., & Gerdes, K. (2005). Plasmid segregation mechanisms. Annual Review of Genetics,
39, 453–479.
Edwards, A. M., & Massey, R. C. (2011). Invasion of human cells by a bacterial pathogen. Journal of
Visualized Experiments : JoVE.
EFSA. (2011). Scientific Opinion on the public health risks of bacterial strains producing extended-
spectrum β -lactamases and / or AmpC β -lactamases in food and food producing strains. EFSA
Journal, 9(8), 1–95.
El-Sukhon, S., Musa, A., & Al-Attar, M. (2002). Studies on the bacterial etiology of airsacculitis of
broilers in northern and middle Jordan with special reference to Escherichia coli,
Ornithobacterium rhinotracheale, and Bordetella avium. Avian Diseases, 46(3), 605–612.
Retrieved from http://www.ncbi.nlm.nih.gov/pubmed/12243524
Enne, V. I., Delsol, A. A., Davis, G. R., Hayward, S. L., Roe, J. M., & Bennett, P. M. (2005).
Assessment of the fitness impacts on Escherichia of acquisition of antibiotic resistance genes
encoded by different types of genetic element. Journal of Antimicrobial Chemotherapy, 56(3),
544–551.
Enoch, D. A., Brown, F., Sismey, A. W., Mlangeni, D. A., Curran, M. D., Karas, J. A., … Woodford,
N. (2012). Epidemiology of extended-spectrum beta-lactamase-producing Enterobacteriaceae in
a UK district hospital; an observational study. Journal of Hospital Infection, 81(4), 270–277.
Evans, B. A., & Amyes, S. G. B. (2014). OXA β-lactamases. Clinical Microbiology Reviews, 27(2),
241–263.
239
Ewers, C., JanBen, T., KieBling, S., Philipp, H.-C., & Wieler, L. H. (2009). Rapid Detection of
Virulence-Associated Genes in Avian Pathogenic Escherichia coli by Multiplex Polymerase
Chain Reaction. Avian Diseases, 49(2), 269–273. doi:10.1637/7293-102604r
Ewers, C., Janssen, T., & Wieler, L. (2003). Avian pathogenic Escherichia coli (APEC). Berl Munch
Tierarztl Wochenschr, 16, 381–95. Retrieved from
http://www.ncbi.nlm.nih.gov/pubmed/14526468
Ewers, C., Li, G., Wilking, H., Kießling, S., Alt, K., Antáo, E. M., … Wieler, L. H. (2007). Avian
pathogenic, uropathogenic, and newborn meningitis-causing Escherichia coli: How closely
related are they? International Journal of Medical Microbiology, 297(3), 163–176.
Falagas, M. E., & Karageorgopoulos, D. E. (2009). Extended-spectrum beta-lactamase-producing
organisms. The Journal of Hospital Infection, 73(4), 345–354. doi:10.1016/j.jhin.2009.02.021
Fang, H., Ataker, F., Hedin, G., & Dornbusch, K. (2008). Molecular epidemiology of extended-
spectrum β-lactamases among Escherichia coli isolates collected in a Swedish hospital and its
associated health care facilities from 2001 to 2006. Journal of Clinical Microbiology, 46(2),
707–712.
Fantinatti, F., Silveira, W. D., & Castro, A. F. P. (1994). Characteristics associated with pathogenicity
of avian septicaemic Escherichia coli strains. Veterinary Microbiology, 41(1-2), 75–86.
Fei, Q., Guarnieri, M. T., Tao, L., Laurens, L. M. L., Dowe, N., & Pienkos, P. T. (2014).
Bioconversion of natural gas to liquid fuel: Opportunities and challenges. Biotechnology
Advances. Elsevier Inc.
Fischbach, M. A., Lin, H., Liu, D. R., & Walsh, C. T. (2006). How pathogenic bacteria evade
mammalian sabotage in the battle for iron. Nature Chemical Biology, 2(3), 132–138.
Fischer, E. A. J., Dierikx, C. M., van Essen-Zandbergen, A., van Roermund, H. J. W., Mevius, D. J.,
Stegeman, A., & Klinkenberg, D. (2014). The IncI1 plasmid carrying the blaCTX-M-1 gene
persists in in vitro culture of a Escherichia coli strain from broilers. BMC Microbiology, 14, 77.
Retrieved from
http://www.pubmedcentral.nih.gov/articlerender.fcgi?artid=3987674&tool=pmcentrez&renderty
pe=abstract
Foster, J. W., & Hall, H. K. (1992). Effect of Salmonella typhimurium ferric uptake regulator (fur)
mutations on iron- and pH-regulated protein synthesis. Journal of Bacteriology, 174(13), 4317–
4323.
Fricke, W. F., McDermott, P. F., Mammel, M. K., Zhao, S., Johnson, T. J., Rasko, D. A., … Ravel, J.
(2009). Antimicrobial resistance-conferring plasmids with similarity to virulence plasmids from
avian pathogenic Escherichia coli strains in Salmonella enterica serovar Kentucky isolates from
poultry. Applied and Environmental Microbiology, 75(18), 5963–5971.
Frost, L. S., Leplae, R., Summers, A. O., & Toussaint, A. (2005). Mobile genetic elements: the agents
of open source evolution. Nature Reviews. Microbiology, 3(9), 722–732.

240
Fuchs, T. M., Eisenreich, W., Heesemann, J., & Goebel, W. (2012). Metabolic adaptation of human
pathogenic and related nonpathogenic bacteria to extra- and intracellular habitats. FEMS
Microbiology Reviews, 36(2), 435–462. doi:10.1111/j.1574-6976.2011.00301.x
Fujita, S. I., Yosizaki, K., Ogushi, T., Uechi, K., Takemori, Y., & Senda, Y. (2011). Rapid
identification of gram-negative bacteria with and without CTX-M extended-spectrum β-
lactamase from positive blood culture bottles by PCR followed by microchip gel electrophoresis.
Journal of Clinical Microbiology, 49(4), 1483–1488.
Gao, Q., Wang, X., Xu, H., Xu, Y., Ling, J., Zhang, D., … Liu, X. (2012a). Roles of iron acquisition
systems in virulence of extraintestinal pathogenic Escherichia coli: salmochelin and aerobactin
contribute more to virulence than heme in a chicken infection model. BMC Microbiology, 12(1),
143. doi:10.1186/1471-2180-12-143
Gao, Q., Wang, X., Xu, H., Xu, Y., Ling, J., Zhang, D., … Liu, X. (2012b). Roles of iron acquisition
systems in virulence of extraintestinal pathogenic Escherichia coli: salmochelin and aerobactin
contribute more to virulence than heme in a chicken infection model. BMC Microbiology.
García-Fernández, A., Chiaretto, G., Bertini, A., Villa, L., Fortini, D., Ricci, A., & Carattoli, A.
(2008). Multilocus sequence typing of IncI1 plasmids carrying extended-spectrum β-lactamases
in Escherichia coli and Salmonella of human and animal origin. Journal of Antimicrobial
Chemotherapy, 61(6), 1229–1233.
Garcillán-Barcia, M. P., Alvarado, A., & De la Cruz, F. (2011). Identification of bacterial plasmids
based on mobility and plasmid population biology. FEMS Microbiology Reviews.
Germon, P., Chen, Y. H., He, L., Blanco, J. E., Brée, A., Schouler, C., … Moulin-Schouleur, M.
(2005). ibeA, a virulence factor of avian pathogenic Escherichia coli. Microbiology, 151(4),
1179–1186.
Guenther, S., Ewers, C., & Wieler, L. H. (2011). Extended-spectrum beta-lactamases producing E.
coli in wildlife, yet another form of environmental pollution? Frontiers in Microbiology,
2(DEC), 1–13. doi:10.3389/fmicb.2011.00246
Hacker, J., & Carniel, E. (2001). Ecological fitness, genomic islands and bacterial pathogenicity. A
Darwinian view of the evolution of microbes. EMBO Reports, 2(5), 376–381.
Hale, L., Lazos, O., Haines, A. S., & Thomas, C. M. (2010). An efficient stress-free strategy to
displace stable bacterial plasmids. BioTechniques, 48(3), 223–228.
Harding, C. R., Schroeder, G. N., Collins, J. W., & Frankel, G. (2013). Use of Galleria mellonella as a
model organism to study Legionella pneumophila infection. Journal of Visualized Experiments :
JoVE, (81), e50964. doi:10.3791/50964
Hassan, H. M. a, Mohamed, M. a., Youssef, A. W., & Hassan, E. R. (2010). Effect of using organic
acids to substitute antibiotic growth promoters on performance and intestinal microflora of
broilers. Asian-Australasian Journal of Animal Sciences, 23(10), 1348–1353.
doi:10.5713/ajas.2010.10085

241
Hawkey, P. M., & Jones, A. M. (2009). The changing epidemiology of resistance. Journal of
Antimicrobial Chemotherapy, 64(SUPPL.1).
Heffron, F., Sublett, R., Hedges, R. W., Jacob, A., & Falkow, S. (1975). Origin of the TEM-beta-
lactamase gene found on plasmids. Journal of Bacteriology, 122(1), 250–256.
Henriques Normark, B., & Normark, S. (2002). Evolution and spread of antibiotic resistance. Journal
of Internal Medicine.
Heritage, J., M’Zali, F. H., Gascoyne-Binzi, D., & Hawkey, P. M. (1999). Evolution and spread of
SHV extended-spectrum ??-lactamases in gram-negative bacteria. Journal of Antimicrobial
Chemotherapy.
Hernández, J. R., Martínez-Martínez, L., Cantón, R., Coque, T. M., & Pascual, A. (2005). Nationwide
study of Escherichia coli and Klebsiella pneumoniae producing extended-spectrum beta-
lactamases in Spain. Antimicrobial Agents and Chemotherapy, 49(5), 2122–2125.
Hopkins, K. L., Liebana, E., Villa, L., Batchelor, M., Threlfall, E. J., & Carattoli, A. (2006). Replicon
typing of plasmids carrying CTX-M or CMY ??-lactamases circulating among Salmonella and
Escherichia coli isolates. Antimicrobial Agents and Chemotherapy, 50(9), 3203–3206.
doi:10.1128/AAC.00149-06
Humphrey, B., Thomson, N. R., Thomas, C. M., Brooks, K., Sanders, M., Delsol, A. A., … Enne, V.
I. (2012). Fitness of Escherichia coli strains carrying expressed and partially silent IncN and
IncP1 plasmids. BMC Microbiology.
Jacoby, G. A. (2009). AmpC beta-lactamases. Clinical Microbiology Reviews, 22(1), 161–182, Table
of Contents.
Jakobsen, L., Garneau, P., Bruant, G., Harel, J., Olsen, S. S., Porsbo, L. J., … Frimodt-Møller, N.
(2012). Is Escherichia coli urinary tract infection a zoonosis? Proof of direct link with
production animals and meat. European Journal of Clinical Microbiology and Infectious
Diseases, 31(6), 1121–1129.
Jakobsen, L., Kurbasic, A., Skjøt-Rasmussen, L., Ejrnaes, K., Porsbo, L. J., Pedersen, K., …
Hammerum, A. M. (2010). Escherichia coli isolates from broiler chicken meat, broiler chickens,
pork, and pigs share phylogroups and antimicrobial resistance with community-dwelling humans
and patients with urinary tract infection. Foodborne Pathogens and Disease, 7(5), 537–547.
Janben, T., Schwarz, C., Preikschat, P., Voss, M., Philipp, H. C., & Wieler, L. H. (2001). Virulence-
associated genes in avian pathogenic Escherichia coli (APEC) isolated from internal organs of
poultry having died from colibacillosis. International Journal of Medical Microbiology : IJMM,
291(5), 371–378.
Janßen, T., Schwarz, C., Preikschat, P., Voss, M., Philipp, H. C., & Wieler, L. H. (2001). Virulence-
associated genes in avian pathogenic Escherichia coli (APEC) isolated from internal organs of
poultry having died from colibacillosis. International Journal of Medical Microbiology, 291(5),
371–378. Retrieved from http://www.sciencedirect.com/science/article/pii/S1438422104700466

242
Jaurin, B., & Grundström, T. (1981). ampC cephalosporinase of Escherichia coli K-12 has a different
evolutionary origin from that of beta-lactamases of the penicillinase type. Proceedings of the
National Academy of Sciences of the United States of America, 78(8), 4897–4901.
doi:10.1073/pnas.78.8.4897
Ji, Y. L., Sheng, H., Keun, S. S., Yong, H. P., & Hovde, C. J. (2007). Characterization of an
Escherichia coli O157:H7 plasmid O157 deletion mutant and its survival and persistence in
cattle. Applied and Environmental Microbiology, 73(7), 2037–2047.
Johnson, T. J., Johnson, S. J., & Nolan, L. K. (2006). Complete DNA sequence of a ColBM plasmid
from avian pathogenic Escherichia coli suggests that it evolved from closely related ColV
virulence plasmids. Journal of Bacteriology, 188(16), 5975–5983.
Johnson, T. J., Jordan, D., Kariyawasam, S., Stell, A. L., Bell, N. P., Wannemuehler, Y. M., … Nolan,
L. K. (2010). Sequence analysis and characterization of a transferable hybrid plasmid encoding
multidrug resistance and enabling zoonotic potential for extraintestinal Escherichia coli.
Infection and Immunity, 78(5), 1931–1942.
Johnson, T. J., Kariyawasam, S., Wannemuehler, Y., Mangiamele, P., Johnson, S. J., Doetkott, C., …
Nolan, L. K. (2007). The genome sequence of avian pathogenic Escherichia coli strain
O1:K1:H7 shares strong similarities with human extraintestinal pathogenic E. coli genomes.
Journal of Bacteriology, 189(8), 3228–36. doi:10.1128/JB.01726-06
Johnson, T. J., Logue, C. M., Johnson, J. R., Kuskowski, M. A., Sherwood, J. S., Barnes, H. J., …
Nolan, L. K. (2012). Associations between multidrug resistance, plasmid content, and virulence
potential among extraintestinal pathogenic and commensal Escherichia coli from humans and
poultry. Foodborne Pathogens and Disease, 9(1), 37–46. Retrieved from
http://www.pubmedcentral.nih.gov/articlerender.fcgi?artid=3250628&tool=pmcentrez&renderty
pe=abstract
Johnson, T. J., & Nolan, L. K. (2009). Pathogenomics of the virulence plasmids of Escherichia coli.
Microbiology and Molecular Biology Reviews : MMBR, 73(4), 750–774.
Johnson, T. J., Shepard, S. M., Rivet, B., Danzeisen, J. L., & Carattoli, A. (2011). Comparative
genomics and phylogeny of the IncI1 plasmids: A common plasmid type among porcine
enterotoxigenic Escherichia coli. Plasmid, 66(3), 144–151.
Johnson, T. J., Siek, K. E., Johnson, S. J., & Nolan, L. K. (2006). DNA sequence of a ColV plasmid
and prevalence of selected plasmid-encoded virulence genes among avian Escherichia coli
strains. Journal of Bacteriology, 188(2), 745–758.
Johnson, T. J., Thorsness, J. L., Anderson, C. P., Lynne, A. M., Foley, S. L., Han, J., … Singer, R. S.
(2010). Horizontal gene transfer of a colV plasmid has resulted in a dominant avian clonal type
of salmonella enterica serovar kentucky. PLoS ONE, 5(12), 1–10.
doi:10.1371/journal.pone.0015524
Johnson, T. J., Wannemuehler, Y., Doetkott, C., Johnson, S. J., Rosenberger, S. C., & Nolan, L. K.
(2008). Identification of minimal predictors of avian pathogenic Escherichia coli virulence for
use as a rapid diagnostic tool. Journal of Clinical Microbiology, 46(12), 3987–3996.

243
Johnson, T. J., Wannemuehler, Y. M., Johnson, S. J., Logue, C. M., White, D. G., Doetkott, C., &
Nolan, L. K. (2007). Plasmid replicon typing of commensal and pathogenic Escherichia coli
isolates. Applied and Environmental Microbiology, 73(6), 1976–1983.
Johnson, T. J., Wannemuehler, Y. M., & Nolan, L. K. (2008). Evolution of the iss gene in Escherichia
coli. Applied and Environmental Microbiology, 74(8), 2360–2369.
Kado, C. I., & LIU, S. . (1981). Rapid Procedure for Detection and Isolation of Large and Small
Plasmids. Journal of Bacteriology, 146(3), 1174.
Kanj, S. S., & Kanafani, Z. A. (2011). Current concepts in antimicrobial therapy against resistant
gram-negative organisms: extended-spectrum beta-lactamase-producing Enterobacteriaceae,
carbapenem-resistant Enterobacteriaceae, and multidrug-resistant Pseudomonas aeruginosa.
Mayo Clinic Proceedings. Mayo Clinic, 86(3), 250–259.
Kanjee, U., & Houry, W. a. (2013). Mechanisms of acid resistance in Escherichia coli. Annual Review
of Microbiology, 67, 65–81. Retrieved from http://www.ncbi.nlm.nih.gov/pubmed/23701194
Kaper, J. B., Nataro, J. P., & Mobley, H. L. (2004). Pathogenic Escherichia coli. Nature Reviews.
Microbiology, 2(2), 123–140. doi:10.1038/nrmicro818
Keller, L., & Surette, M. G. (2006). Communication in bacteria: an ecological and evolutionary
perspective. Nature Reviews. Microbiology, 4(4), 249–258.
Kemmett, K., Williams, N. J., Chaloner, G., Humphrey, S., Wigley, P., & Humphrey, T. (2014). The
contribution of systemic Escherichia coli infection to the early mortalities of commercial broiler
chickens. Avian Pathology : Journal of the W.V.P.A, 43(1), 37–42.
doi:10.1080/03079457.2013.866213
Khan, K. a, Khan, S. a, Aslam, a, Rabbani, M., & Tipu, M. Y. (2004). Factors Contributing To Yolk
Retention in Poultry : a Review. Infection, 24(1).
Kikuchi, T., Mizunoe, Y., Takade, A., Naito, S., & Yoshida, S. (2005). Curli fibers are required for
development of biofilm architecture in Escherichia coli K-12 and enhance bacterial adherence to
human uroepithelial cells. Microbiology and Immunology, 49(9), 875–884.
Kjerulf, A., Hansen, D. S., Sandvang, D., Hansen, F., & Frimodt-Møller, N. (2008). The prevalence of
ESBL-producing E. coli and Klebsiella strains in the Copenhagen area of Denmark. APMIS,
116(2), 118–124.
Knöbl, T., Saidenberg, A. B. S., Moreno, A. M., Gomes, T. a T., Vieira, M. a M., Leite, D. S., …
Leite, D. S. (2011). Serogroups and virulence genes of Escherichia coli isolated from psittacine
birds 1. Pesquisa Veterinária Brasileira, 31(10), 916–921.
Knothe, H., Shah, P., Krcmery, V., Antal, M., & Mitsuhashi, S. (1983). Transferable resistance to
cefotaxime, cefoxitin, cefamandole and cefuroxime in clinical isolates of Klebsiella pneumoniae
and Serratia marcescens. Infection, 11(6), 315–317.

244
Köhler, C. D., & Dobrindt, U. (2011). What defines extraintestinal pathogenic Escherichia coli?
International Journal of Medical Microbiology.
Komano, T., Kubo, A., & Nisioka, T. (1987). Shufflon: Multi-inversion of four contiguous DNA
segments of plasmid R64 creates seven different open reading frames. Nucleic Acids Research,
15(3), 1165–1172.
Kotra, L. P., Haddad, J., & Mobashery, S. (2000). Aminoglycosides : Perspectives on Mechanisms of
Action and Resistance and Strategies to Counter Resistance MINIREVIEW Aminoglycosides :
Perspectives on Mechanisms of Action and Resistance and Strategies to Counter Resistance,
44(12), 3249–3256. doi:10.1128/AAC.44.12.3249-3256.2000.Updated
Kwon, S.-G., Cha, S.-Y., Choi, E.-J., Kim, B., Song, H.-J., & Jang, H.-K. (2008). Epidemiological
Prevalence of Avian Pathogenic Escherichia coli Differentiated by Multiplex PCR from
Commercial Chickens and Hatchery in Korea. Journal of Bacteriology and Virology, 38(4), 179.
doi:10.4167/jbv.2008.38.4.179
La Ragione, R. M., & Woodward, M. J. (2002). Virulence factors of Escherichia coli serotypes
associated with avian colisepticaemia. Research in Veterinary Science.
La Ragione, R., McLaren, I., Foster, G., Cooley, W., & Woodward, M. (2002). Phenotypic and
genotypic characterization of avian Escherichia coli O86: K61 isolates possessing a gamma-like
intimin. Applied and Environmental Microbiology, 68(10), 4932. doi:10.1128/AEM.68.10.4932
Lambie, N., Ngeleka, M., Brown, G., & Ryan, J. (2000). Retrospective study on Escherichia coli
infection in broilers subjected to postmortem examination and antibiotic resistance of isolates in
Trinidad. Avian Diseases, 44(1), 155–160. Retrieved from
http://www.ncbi.nlm.nih.gov/pubmed/10737656
Landman, D., Georgescu, C., Martin, D. A., & Quale, J. (2008). Polymyxins revisited. Clinical
Microbiology Reviews, 21(3), 449–465. doi:10.1128/CMR.00006-08
Landman, W. J. M., Buter, G. J., Dijkman, R., & van Eck, J. H. H. (2014). Molecular typing of avian
pathogenic Escherichia coli colonies originating from outbreaks of E. coli peritonitis syndrome
in chicken flocks. Avian Pathology, 43(4), 345–356. doi:10.1080/03079457.2014.935291
Laurent, F., Lelièvre, H., Cornu, M., Vandenesch, F., Carret, G., Etienne, J., & Flandrois, J. P. (2001).
Fitness and competitive growth advantage of new gentamicin-susceptible MRSA clones
spreading in French hospitals. The Journal of Antimicrobial Chemotherapy, 47(3), 277–283.
Lavigne, J. P., Blanc-Potard, A. B., Bourg, G., Moreau, J., Chanal, C., Bouziges, N., … Sotto, A.
(2006). Virulence genotype and nematode-killing properties of extra-intestinal Escherichia coli
producing CTX-M ??-lactamases. Clinical Microbiology and Infection, 12(12), 1199–1206.
Lavigne, J.-P., Marchandin, H., Delmas, J., Moreau, J., Bouziges, N., Lecaillon, E., … Sotto, A.
(2007). CTX-M beta-lactamase-producing Escherichia coli in French hospitals: prevalence,
molecular epidemiology, and risk factors. Journal of Clinical Microbiology, 45(2), 620–626.

245
Leekitcharoenphon, P., Kaas, R. S., Thomsen, M. C. F., Friis, C., Rasmussen, S., & Aarestrup, F. M.
(2012). snpTree--a web-server to identify and construct SNP trees from whole genome sequence
data. BMC Genomics, 13 Suppl 7(Suppl 7), S6. Retrieved from
http://www.pubmedcentral.nih.gov/articlerender.fcgi?artid=3521233&tool=pmcentrez&renderty
pe=abstract
Lenski, R. E. (1998). Bacterial evolution and the cost of antibiotic resistance. International
Microbiology, 1(4), 265–270.
Lenski, R. E., Simpson, S. C., & Nguyen, T. T. (1994). Genetic analysis of a plasmid-encoded, host
genotype-specific enhancement of bacterial fitness. Journal of Bacteriology, 176(11), 3140–
3147.
Leonhartsberger, S., Korsa, I., & Böck, A. (2002). The molecular biology of formate metabolism in
enterobacteria. Journal of Molecular Microbiology and Biotechnology, 4(3), 269–276.
Leverstein-van Hall, M. A., Dierikx, C. M., Cohen Stuart, J., Voets, G. M., van den Munckhof, M. P.,
van Essen-Zandbergen, A., … Mevius, D. J. (2011). Dutch patients, retail chicken meat and
poultry share the same ESBL genes, plasmids and strains. Clinical Microbiology and Infection,
17(6), 873–880.
Levin, B. R., Perrot, V., & Walker, N. (2000). Compensatory mutations, antibiotic resistance and the
population genetics of adaptive evolution in bacteria. Genetics, 154(3), 985–997.
Li, L., Jiang, Z. G., Xia, L. N., Shen, J. Z., Dai, L., Wang, Y., … Wu, C. M. (2010). Characterization
of antimicrobial resistance and molecular determinants of beta-lactamase in Escherichia coli
isolated from chickens in China during 1970-2007. Veterinary Microbiology, 144(3-4), 505–
510.
Li, X.-Z., Mehrotra, M., Ghimire, S., & Adewoye, L. (2007). beta-Lactam resistance and beta-
lactamases in bacteria of animal origin. Veterinary Microbiology, 121(3-4), 197–214.
doi:10.1016/j.vetmic.2007.01.015
Lima-Filho, J. V., Martins, L. V., Nascimento, D. C. de O., Ventura, R. F., Batista, J. E. C., Silva, A.
F. B., … Evêncio-Neto, J. (2013). Zoonotic potential of multidrug-resistant extraintestinal
pathogenic Escherichia coli obtained from healthy poultry carcasses in Salvador, Brazil.
Brazilian Journal of Infectious Diseases, 17(1), 54–61.
Litwin, C. M., & Calderwood, S. B. (1993). Role of iron in regulation of virulence genes. Clinical
Microbiology Reviews, 6(2), 137–149.
Livermore, D. M., & Hawkey, P. M. (2005). CTX-M: Changing the face of ESBLs in the UK.
Journal of Antimicrobial Chemotherapy.
Livermore, D. M., & Woodford, N. (2006). The beta-lactamase threat in Enterobacteriaceae,
Pseudomonas and Acinetobacter. Trends in Microbiology, 14, 413–20.
doi:10.1016/j.tim.2006.07.008

246
Lutful Kabir, S. M. (2010). Avian colibacillosis and salmonellosis: A closer look at epidemiology,
pathogenesis, diagnosis, control and public health concerns. International Journal of
Environmental Research and Public Health.
Lynne, A. M., Skyberg, J. A., Logue, C. M., Doetkott, C., Foley, S. L., & Nolan, L. K. (2007).
Characterization of a series of transconjugant mutants of an avian pathogenic Escherichia coli
isolate for resistance to serum complement. Avian Diseases, 51(3), 771–776.
MA, R., MA, S., MB, R., & SML, K. (2004). Bacterio-pathological Studies on Salmonellosis,
Colibacillosis and Pasteurellosis in Natural and Experimental Infections in Chickens.
Bangladesh Journal of Veterinary Medicine, 2(1), 1–8. Retrieved from
http://www.banglajol.info/index.php/BJVM/article/view/1926
Mangiamele, P., Nicholson, B., Wannemuehler, Y., Seemann, T., Logue, C. M., Ganwu Li, … Nolan,
L. K. (2013). Complete Genome Sequence of the Avian Pathogenic Escherichia coli Strain
APEC O78. Genome Announc, 1(2), 2–3.
Marshall, B. M., & Levy, S. B. (2011). Food animals and antimicrobials: Impacts on human health.
Clinical Microbiology Reviews.
Matsumoto, Y., Ikeda, F., Kamimura, T., Yokota, Y., & Mine, Y. (1988). Novel plasmid-mediated ??-
lactamase from Escherichia coli that inactivates oxyimino-cephalosporins. Antimicrobial Agents
and Chemotherapy, 32(8), 1243–1246.
Matter, L. B., Barbieri, N. L., Nordhoff, M., Ewers, C., & Horn, F. (2011). Avian pathogenic
Escherichia coli MT78 invades chicken fibroblasts. Veterinary Microbiology, 148(1), 51–59.
doi:10.1016/j.vetmic.2010.08.006
Mazel, D. (2006). Integrons: agents of bacterial evolution. Nature Reviews. Microbiology, 4(8), 608–
620.
Mellata, M. (2013). Human and avian extraintestinal pathogenic Escherichia coli: infections, zoonotic
risks, and antibiotic resistance trends. Foodborne Pathogens and Disease, 10(11), 916–32.
Retrieved from http://www.ncbi.nlm.nih.gov/pubmed/23962019
Mellata, M., Ameiss, K., Mo, H., & Curtiss, R. (2010). Characterization of the contribution to
virulence of three large plasmids of avian pathogenic Escherichia coli ??7122 (O78:K80:H9).
Infection and Immunity, 78(4), 1528–1541.
Mellata, M., Curtiss, R., Diseases, I., One, P., & Touchman, J. (2009). New insights into a avian
pathogenic E . coli and its risks to human health, 1–2.
Mellata, M., Dho-Moulin, M., Dozois, C. M., Curtiss III, R., Lehoux, B., & Fairbrother, J. M. (2003).
Role of avian pathogenic Escherichia coli virulence factors in bacterial interaction with chicken
heterophils and macrophages. Infection and Immunity, 71(1), 494. doi:10.1128/IAI.71.1.494
Mellata, M., Maddux, J. T., Nam, T., Thomson, N., Hauser, H., Stevens, M. P., … Curtiss, R. (2012).
New insights into the bacterial fitness-associated mechanisms revealed by the characterization of
large plasmids of an avian pathogenic E. coli. PLoS ONE, 7(1).

247
Mellata, M., Touchman, J. W., & Curtis, R. (2009). Full sequence and comparative analysis of the
plasmid pAPEC-1 of avian pathogenic E. coli ??7122 (O78:k80:H9). PLoS ONE, 4(1).
Mendonça, N., Leitão, J., Manageiro, V., Ferreira, E., & Caniça, M. (2007). Spread of extended-
spectrum β-lactamase CTX-M-producing Escherichia coli clinical isolates in community and
nosocomial environments in Portugal. Antimicrobial Agents and Chemotherapy, 51(6), 1946–
1955.
Michon, A., Allou, N., Chau, F., Podglajen, I., Fantin, B., & Cambau, E. (2011). Plasmidic qnrA3
enhances Escherichia coli fitness in absence of antibiotic exposure. PLoS ONE, 6(9).
Momtaz, H., Karimian, A., Madani, M., Safarpoor Dehkordi, F., Ranjbar, R., Sarshar, M., & Souod,
N. (2013). Uropathogenic Escherichia coli in Iran: serogroup distributions, virulence factors and
antimicrobial resistance properties. Annals of Clinical Microbiology and Antimicrobials, 12, 8.
Retrieved from
http://www.pubmedcentral.nih.gov/articlerender.fcgi?artid=3651382&tool=pmcentrez&renderty
pe=abstract
Mugnaioli, C., Luzzaro, F., De Luca, F., Brigante, G., Perilli, M., Amicosante, G., … Rossolini, G. M.
(2006). CTX-M-type extended-spectrum ??-lactamases in Italy: Molecular epidemiology of an
emerging countrywide problem. Antimicrobial Agents and Chemotherapy.
Mukherjee, K., Altincicek, B., Hain, T., Domann, E., Vilcinskas, A., & Chakraborty, T. (2010).
Galleria mellonella as a model system for studying Listeria pathogenesis. Applied and
Environmental Microbiology, 76(1), 310–317.
Musa, H. H., He, S. F., Wu, S. L., Zhu, C. H., Liu, Z. H., Zhang, Z. N., … Zhu, G. Q. (2009). Genetic
engineering of avian pathogenic E. coli to study the functions of Fimh adhesin. Indian Journal
of Experimental Biology, 47(11), 916–920.
Naas, T., & Nordmann, P. (1999). OXA-type beta-lactamases. Current Pharmaceutical Design, 5(11),
865–879.
Nakamura, K., Mase, M., Tanimura, N., Yamaguchi, S., Nakazawa, M., & Yuasa, N. (1997). Swollen
head syndrome in broiler chickens in Japan: Its pathology, microbiology and biochemistry.
Avian Pathology : Journal of the W.V.P.A, 26(1), 139–154.
Nakazato, G., Campos, T. A. De, Stehling, E. G., Brocchi, M., & Silveira, W. D. Da. (2009).
Virulence factors of avian pathogenic Escherichia coli (APEC). Pesquisa Veterinária Brasileira,
29(7), 479–486. doi:10.1590/S0100-736X2009000700001
Nataro, J. P., & Kaper, J. B. (1998). Diarrheagenic Escherichia coli. Clinical Microbiology Reviews.
Natoli, M., Leoni, B. D., D’Agnano, I., Zucco, F., & Felsani, A. (2012). Good Caco-2 cell culture
practices. Toxicology in Vitro.
Nisbet, D. J., Anderson, R. C., Corrier, D. E., Harvey, R. B., & Stanker, L. H. (2000). Modeling the
survivability of Salmonella typhimurium in the Chicken Cecae Using an Anaerobic Continuous-

248
Culture of Chicken Cecal Bacteria. Microbial Ecology in Health and Disease, 12(1), 42–47.
doi:10.1080/089106000435581
Novais, Â., Viana, D., Baquero, F., Martínez-Botas, J., Cantón, R., & Coque, T. M. (2012).
Contribution of IncFII and broad-host IncA/C and IncN plasmids to the local expansion and
diversification of phylogroup B2 Escherichia coli ST131 clones carrying bla CTX-M-15and
qnrS1 genes. Antimicrobial Agents and Chemotherapy, 56(5), 2763–2766.
Ouellette, M., Bissonnette, L., & Roy, P. H. (1987). Precise insertion of antibiotic resistance
determinants into Tn21-like transposons: nucleotide sequence of the OXA-1 beta-lactamase
gene. Proceedings of the National Academy of Sciences of the United States of America, 84(21),
7378–7382. doi:10.1073/pnas.84.21.7378
Overdevest, I., Willemsen, I., Rijnsburger, M., Eustace, A., Xu, L., Hawkey, P., … Kluytmans, J.
(2011). Extended-spectrum β-lactamase genes of Escherichia coli in chicken meat and humans,
the Netherlands. Emerging Infectious Diseases, 17(7), 1216–1222.
Paterson, D. L., & Bonomo, R. A. (2005). Extended-spectrum beta-lactamases: a clinical update.
Clinical Microbiology Reviews, 18(4), 657–686.
Pitout, J. D. D. (2012). Extraintestinal pathogenic Escherichia coli: A combination of virulence with
antibiotic resistance. Frontiers in Microbiology.
Platell, J. L., Johnson, J. R., Cobbold, R. N., & Trott, D. J. (2011). Multidrug-resistant extraintestinal
pathogenic Escherichia coli of sequence type ST131 in animals and foods. Veterinary
Microbiology, 153(1-2), 99–108. doi:10.1016/j.vetmic.2011.05.007
Pourbakhsh, S. a, Boulianne, M., Martineau-Doizé, B., & Fairbrother, J. M. (1997). Virulence
mechanisms of avian fimbriated Escherichia coli in experimentally inoculated chickens.
Veterinary Microbiology, 58(2-4), 195–213. Retrieved from
http://www.ncbi.nlm.nih.gov/pubmed/9453131
Provence, D. L., & Curtiss, R. (1994). Isolation and characterization of a gene involved in
hemagglutination by an avian pathogenic Escherichia coli strain. Infection and Immunity, 62(4),
1369–1380.
Randall, L. P., Clouting, C., Horton, R. A., Coldham, N. G., Wu, G., Clifton-Hadley, F. A., … Teale,
C. J. (2011). Prevalence of Escherichia coli carrying extended-spectrum β-lactamases (CTX-M
and TEM-52) from broiler chickens and turkeys in Great Britain between 2006 and 2009.
Journal of Antimicrobial Chemotherapy, 66(1), 86–95.
Randall, L., Wu, G., Phillips, N., Coldham, N., Mevius, D., Woodford, N., & Teale, C. (2011).
Virulence genes in bla(CTX-M)Escherichia coli isolates from chickens and humans. Research in
Veterinary Science. doi:10.1016/j.rvsc.2011.06.016
Rice, L. B. (2006). Antimicrobial resistance in gram-positive bacteria. American Journal of Infection
Control, 34(5 SUPPL.).

249
Roberts, M. C. (2008). Update on macrolide-lincosamide-streptogramin, ketolide, and oxazolidinone
resistance genes. FEMS Microbiology Letters, 282(2), 147–159. doi:10.1111/j.1574-
6968.2008.01145.x
Rocha, T. M., Andrade, M. A., Souza, E. S., Stringhini, J. H., Café, M. B., Rezende, C. S. M., &
Pôrto, R. N. G. (2011). Performance and intestinal health of broilers inoculated with nalidixic
acidresistant: Salmonella Typhimurium and treated with organic acids. Revista Brasileira de
Zootecnia, 40(12), 2776–2782. doi:10.1590/S1516-35982011001200023
Rossolini, G. M., D'Andrea, M. M., & Mugnaioli, C. (2008). The spread of CTX-M-type
extended-spectrum ??-lactamases. Clinical Microbiology and Infection.
Rozkov, A., Avignone-Rossa, C. a., Ertl, P. F., Jones, P., O’Kennedy, R. D., Smith, J. J., … Bushell,
M. E. (2004). Characterization of the metabolic burden on Escherichia coli DH1 cells imposed
by the presence of a plasmid containing a gene therapy sequence. Biotechnology and
Bioengineering, 88(7), 909–915. doi:10.1002/bit.20327
Sagi, D. (2015). Genomic Avenue to Avian Colisepticemia. mBio, 6(1), 13. doi:10.1128
Salyers, a a, Shoemaker, N. B., Stevens, a M., & Li, L. Y. (1995). Conjugative transposons: an
unusual and diverse set of integrated gene transfer elements. Microbiological Reviews, 59(4),
579–590.
Sampei, G. ichi, Furuya, N., Tachibana, K., Saitou, Y., Suzuki, T., Mizobuchi, K., & Komano, T.
(2010). Complete genome sequence of the incompatibility group I1 plasmid R64. Plasmid,
64(2), 92–103.
Schink, A.-K., Kadlec, K., & Schwarz, S. (2011). Analysis of blaCTX-M-Carrying Plasmids from
Escherichia coli Isolates Collected in the BfT-GermVet Study. Applied and Environmental
Microbiology. doi:10.1128/AEM.00559-11
Schouler, C., Schaeffer, B., Brée, A., Mora, A., Dahbi, G., Biet, F., … Moulin-Schouleur, M. (2012).
Diagnostic strategy for identifying avian pathogenic Escherichia coli based on four patterns of
virulence genes. Journal of Clinical Microbiology, 50(5), 1673–1678.
Senior, N. J., Bagnall, M. C., Champion, O. L., Reynolds, S. E., la Ragione, R. M., Woodward, M. J.,
… Titball, R. W. (2011). Galleria mellonella as an infection model for campylobacter jejuni
virulence. Journal of Medical Microbiology, 60(5), 661–669.
Seol, W., & Shatkin, A. J. (1991). Escherichia coli kgtP encodes an α-ketoglutarate transporter.
Proceedings of the National Academy of Sciences of the United States of America, 88(12), 5477.
doi:10.1073/pnas.88.12.5477c
Shibata, N., Kurokawa, H., Doi, Y., Yagi, T., Yamane, K., Wachino, J. I., … Arakawa, Y. (2006).
PCR classification of CTX-M-type ??-lactamase genes identified in clinically isolated gram-
negative bacilli in Japan. Antimicrobial Agents and Chemotherapy, 50(2), 791–795.

250
Shulman, S. T., Friedmann, H. C., & Sims, R. H. (2007). Theodor Escherich: the first pediatric
infectious diseases physician? Clinical Infectious Diseases : An Official Publication of the
Infectious Diseases Society of America, 45(8), 1025–1029.
Skinner, J. T., Izat, a L., & Waldroup, P. W. (1991). Research note: fumaric acid enhances
performance of broiler chickens. Poultry Science, 70(6), 1444–1447. doi:10.3382/ps.0701444
Sköld, O. (2001). Resistance to trimethoprim and sulfonamides. In Veterinary Research (Vol. 32, pp.
261–273).
Smet, A., Martel, A., Persoons, D., Dewulf, J., Heyndrickx, M., Herman, L., … Butaye, P. (2010).
Broad-spectrum β-lactamases among Enterobacteriaceae of animal origin: Molecular aspects,
mobility and impact on public health. FEMS Microbiology Reviews, 34(3), 295–316.
doi:10.1111/j.1574-6976.2009.00198.x
Smet, A., van Nieuwerburgh, F., Vandekerckhove, T. T. M., Martel, A., Deforce, D., Butaye, P., &
Haesebrouck, F. (2010). Complete nucleotide sequence of CTX-M-15-plasmids from clinical
Escherichia coli isolates: Insertional events of transposons and insertion sequences. PLoS ONE,
5(6).
Sougakoff, W., Goussard, S., & Courvalin, P. (1988). The TEM-3 ??-lactamase, which hydrolyzes
broad-spectrum cephalosporins, is derived from the TEM-2 penicillinase by two amino acid
substitutions. FEMS Microbiology Letters.
Srimanote, P., Paton, A. W., & Paton, J. C. (2002). Characterization of a novel type IV pilus locus
encoded on the large plasmid of locus of enterocyte effacement-negative Shiga-toxigenic
Escherichia coli strains that are virulent for humans. Infection and Immunity, 70(6), 3094–3100.
Starikova, I., Al-Haroni, M., Werner, G., Roberts, A. P., Sørum, V., Nielsen, K. M., & Johnsen, P. J.
(2013). Fitness costs of various mobile genetic elements in Enterococcus faecium and
Enterococcus faecalis. The Journal of Antimicrobial Chemotherapy, 68(12), 2755–65.
doi:10.1093/jac/dkt270
Stehling, E. G., Yano, T., Brocchi, M., & Da Silveira, W. D. (2003). Characterization of a plasmid-
encoded adhesin of an avian pathogenic Escherichia coli (APEC) strain isolated from a case of
swollen head syndrome (SHS). Veterinary Microbiology, 95(1-2), 111–120. doi:10.1016/S0378-
1135(03)00125-1
Stokes, H. W., & Gillings, M. R. (2011). Gene flow, mobile genetic elements and the recruitment of
antibiotic resistance genes into Gram-negative pathogens. FEMS Microbiology Reviews, 35(5),
790–819. doi:10.1111/j.1574-6976.2011.00273.x
Strauch, E., Lurz, R., & Beutin, L. (2001). Characterization of a Shiga toxin-encoding temperate
bacteriophage of Shigella sonnei. Infection and Immunity, 69(12), 7588–7595.
Subramanian, P., Umadevi, S., Kumar, S., & Stephen, S. (2012). Determination of correlation
between biofilm and extended spectrum β lactamases producers of Enterobacteriaceae. Scholars’
Research Journal, 2(1), 2. doi:10.4103/2249-5975.119797

251
Takahashi, H., Shao, M., Furuya, N., & Komano, T. (2011). The genome sequence of the
incompatibility group I?? plasmid R621a: Evolution of IncI plasmids. Plasmid, 66(2), 112–121.
Tenover, F. C. Mechanisms of antimicrobial resistance in bacteria., 119 The American journal of
medicine S3–S10; discussion S62–S70 (2006). doi:10.1016/j.amjmed.2006.03.011
Therrien, C., & Levesque, R. C. (2000). Molecular basis of antibiotic resistance and beta-lactamase
inhibition by mechanism-based inactivators: perspectives and future directions. FEMS
Microbiology Reviews, 24(3), 251–262.
Timothy, S., Shafi, K., Leatherbarrow, A. H., Jordan, F. T. W., & Wigley, P. (2008). Molecular
epidemiology of a reproductive tract-associated colibacillosis outbreak in a layer breeder flock
associated with atypical avian pathogenic Escherichia coli. Avian Pathology : Journal of the
W.V.P.A, 37(4), 375–378.
Tofteland, S., Haldorsen, B., Dahl, K. H., Simonsen, G. S., Steinbakk, M., Walsh, T. R., &
Sundsfjord, A. (2007). Effects of phenotype and genotype on methods for detection of extended-
spectrum-beta-lactamase-producing clinical isolates of Escherichia coli and Klebsiella
pneumoniae in Norway. Journal of Clinical Microbiology, 45(1), 199–205.
Turner, P., Cooper, V., & Lenski, R. (1998). Tradeoff between horizontal and vertical modes of
transmission in bacterial plasmids. Evolution, 52(2), 315–329. Retrieved from
http://cooperlab.wikidot.com/local--files/publications/turner cooper lenski evolution 1998.pdf
Tzouvelekis, L. S., & Bonomo, R. A. (1999). SHV-type beta-lactamases. Current Pharmaceutical
Design, 5(11), 847–864.
Tzouvelekis, L. S., Tzelepi, E., Tassios, P. T., & Legakis, N. J. (2000). CTX-M-type ??-lactamases:
An emerging group of extended-spectrum enzymes. International Journal of Antimicrobial
Agents.
Van den Bogaard, A. E., Willems, R., London, N., Top, J., & Stobberingh, E. E. (2002). Antibiotic
resistance of faecal enterococci in poultry, poultry farmers and poultry slaughterers. The Journal
of Antimicrobial Chemotherapy, 49(3), 497–505.
Vandekerchove, D., De Herdt, P., Laevens, H., & Pasmans, F. (2004a). Colibacillosis in caged layer
hens: characteristics of the disease and the aetiological agent. Avian Pathology : Journal of the
W.V.P.A, 33(2), 117–125. doi:10.1080/03079450310001642149
Vandekerchove, D., De Herdt, P., Laevens, H., & Pasmans, F. (2004b). Risk factors associated with
colibacillosis outbreaks in caged layer flocks. Avian Pathology : Journal of the W.V.P.A, 33(3),
337–342.
Vogwill, T., & MacLean, R. C. (2015). The genetic basis of the fitness costs of antimicrobial
resistance:a meta analysis apprroach. Evol Appl, 8(3), 284–295. doi:10.1111/eva.12202
Wang J, H. H. and F. S. (2015). Characterization of the genetic environment of blaESBL genes,
integrons and toxin-antitoxin systems identified on large transferrable plasmids in multi-drug
resistant Escherichia coli. Front. Microbiol, 5(716), 8. doi:10.3389/fmicb

252
Wang, J., Stephan, R., Power, K., Yan, Q., Hächler, H., & Fanning, S. (2014). Nucleotide sequences
of 16 transmissible plasmids identified in nine multidrug-resistant Escherichia coli isolates
expressing an ESBL phenotype isolated from food-producing animals and healthy humans. The
Journal of Antimicrobial Chemotherapy, dku206–. Retrieved from
http://jac.oxfordjournals.org/content/early/2014/06/10/jac.dku206.long
Wang, S., Bao, Y., Meng, Q., Xia, Y., Zhao, Y., Wang, Y., … Dai, J. (2015). IbeR Facilitates Stress-
Resistance , Invasion and Pathogenicity of Avian Pathogenic Escherichia coli, 5–10.
doi:10.1371/journal.pone.0119698
Wu, N., Matand, K., Kebede, B., Acquaah, G., & Williams, S. (2010). Enhancing DNA
electrotransformation efficiency in Escherichia coli DH10B electrocompetent cells. Electronic
Journal of Biotechnology, 13. doi:10.2225
Yassin, H., Velthuis, a G. J., Boerjan, M., & van Riel, J. (2009). Field study on broilers’ first-week
mortality. Poultry Science, 88(4), 798–804. doi:10.3382/ps.2008-00292
Yates, C. M., Shaw, D. J., Roe, A. J., Woolhouse, M. E. J., & Amyes, S. G. B. (2006). Enhancement
of bacterial competitive fitness by apramycin resistance plasmids from non-pathogenic
Escherichia coli. Biology Letters, 2(3), 463–465.
Yeaman, M. R., & Yount, N. Y. (2003). Mechanisms of antimicrobial peptide action and resistance.
Pharmacological Reviews, 55(1), 27–55.
Zhang, X. L., Tsui, I. S. M., Yip, C. M. C., Fung, A. W. Y., Wong, D. K. H., Dai, X., … Morris, C.
(2000). Salmonella enterica serovar Typhi uses type IVB pili to enter human intestinal epithelial
cells. Infection and Immunity, 68(6), 3067–3073.
Zhao, L., Gao, S., Huan, H., Xu, X., Zhu, X., Yang, W., … Liu, X. (2009). Comparison of virulence
factors and expression of specific genes between uropathogenic Escherichia coli and avian
pathogenic E. coli in a murine urinary tract infection model and a chicken challenge model.
Microbiology, 155(5), 1634–1644. doi:10.1099/mic.0.024869-0
Zhao, S., Maurer, J. J., Hubert, S., De Villena, J. F., McDermott, P. F., Meng, J., … White, D. G.
(2005). Antimicrobial susceptibility and molecular characterization of avian pathogenic
Escherichia coli isolates. Veterinary Microbiology, 107(3-4), 215–24.
doi:10.1016/j.vetmic.2005.01.021
Zhao, W.-H., & Hu, Z.-Q. (2012). Epidemiology and genetics of CTX-M extended-spectrum β-
lactamases in Gram-negative bacteria. Critical Reviews in Microbiology.
Zheng, J., Tian, F., Cui, S., Song, J., Zhao, S., Brown, E. W., & Meng, J. (2011). Differential gene
expression by ramA in ciprofloxacin-resistant Salmonella Typhimurium. PLoS ONE, 6(7), 1–8.
doi:10.1371/journal.pone.0022161
Zhou, Y., Liang, Y., Lynch, K. H., Dennis, J. J., & Wishart, D. S. (2011). PHAST: A Fast Phage
Search Tool. Nucleic Acids Research, 39(SUPPL. 2).

253
Zhu, C., Ngeleka, M., Potter, A. A., & Allan, B. J. (2002). Effect of fur mutation on acid-tolerance
response and in vivo virulence of avian septicemic Escherichia coli. Canadian Journal of
Microbiology, 48(5), 458–462.
European Centre for Disease Prevention and Control. 2013. Antimicrobial resistance
surveillance in Europe 2013. [ONLINE] Available at:
http://ecdc.europa.eu/en/publications/_layouts/forms/Publication_DispForm.aspx?List=4f55a
d51-4aed-4d32-b960-af70113dbb90&ID=1205. [Accessed 01 August 15].
UK-VARSS 2013. UK Veterinary Antibiotic. 2013. UK Veterinary Antibiotic Resistance and
Sales Surveillance. [ONLINE] Available at:
https://www.gov.uk/government/publications/veterinary-antimicrobial-resistance-and-sales-
surveillance-2013. [Accessed 01 August 15].

254
Conference participation
- Diagnostic microbiology: Lab life but not as we know it, Public Health
England, London, May 2015
- Presented at workshop held by the Genome analysis centre September 2014
(TGAC)
- SfAM-MVNA Summer Conference in Brighton July 2014.
- PGR conference1/2014 in Surrey University.
- Poster presentation in conference held by the FHMS at the Surrey University,
July 2013.
- Workshop in UK plasmid mobile Genetic Element, july 2013 in Birmingham
University.
- Poster presentation in conference held by MedVetNet Association
International Scientific inTechnical University of Denmark in 24-25th, June
2013.
- Poster presentation in conference held by BASC at Birmingham 29-30th
November 2013.
- Poster presentation in conference held by BASC at Birmingham 29-30th
November 2012
- Poster presentation in conference held by the FHMS at the Surrey University,
July 2012.
- Advances in Microbial & Mammalian cell phenotyping linking phenotyping to
genotyping at Surrey University November 2011.

255
Appendices

256
10 .Appendix
Appendix I. Growth curve of the wildtype strains and their derivatives with and without ESBL
plasmid in LB broth media.
T im e in h o u rs
Lo
f o
f C
FU
/ml
0 2 4 6 8 1 0
5
6
7
8
9
1 0
S A P 5 6
S A P 5 9
Growth curve of SAP59 (k12, E.coli strain) and SAP59 strain carry CTX-M plasmid
represented by SAP56 grew on LB broth media. The growth kinetics of each
bacterial strain using three biological and tow technical repeats. No significant
difference was found between the strains although SAP59 carry the ESBL plasmid
gave generation time of 25 min/generation which was a bit higher than the parent
strain which was 22 min/generation.

257
T im e in h o u rs
Lo
g o
f C
FU
/ml
0 2 4 6 8 1 0
5
6
7
8
9
1 0
1 1
S A 2 4
S A P 1 4 0
Growth curve of non ESBL APEC SAP24 and SAP24 strain transformed with ESBL
plasmid represented by SAP140 on LB broth media. The growth kinetics of each
bacterial strain using three biological and tow technical repeats. The graph shows no
significant difference was found among the tested strains using a student’s T test.

258
T im e in h o u rs
Lo
g o
f C
FU
/ml
0 2 4 6 8 1 0
5
6
7
8
9
1 0
1 1
S A P 4 4 (W T )
S A P 4 4 C
S A P 4 4 (p la s m id le s s )
S A P 4 4 F
Growth curve of ESBL APEC wild type strain SAP44 and its derivative strains
(SAP44C: cured strains complemented with ESBL plasmid, SAP44: plasmidless
strains and SAP44F: carries FIB plasmid) on LB broth media. The growth kinetics of
each bacterial strain using three biological and tow technical repeats. The graph
shows no significant difference was found among the tested strains using a student’s
T test.

259
Appendix II. Kinetic curve respiration of SAP44W and its derivatives utilising different
carbon sources.
The difference pattern of respiration kinetics by wild type ESBL SAP44 (black curve
line) and its derivative strains (SAP44C (yellow curve line): cured strains
complemented with ESBL plasmid, SAP44 (white curve line): plasmidless strains and
SAP44F (blue curve line): carries FIB plasmid) utilizing the sole carbon source in
PM1. The growth kinetics of each bacterial strain using three biological and tow
technical repeats.

260
The difference pattern of respiration kinetics by wild type ESBL SAP44 (black curve
line) and its derivative strains (SAP44C (yellow curve line): cured strains
complemented with ESBL plasmid, SAP44 (white curve line): plasmidless strains and
SAP44F (blue curve line): carries FIB plasmid) utilizing the sole carbon source in
PM2. The growth kinetics of each bacterial strain using three biological and tow
technical repeats.

261
Appendix III. Biolog PMs with component names
PM1 MicroPlate™ Carbon Sources
A1 Negative Control
A2 L-Arabinose
A3 N-Acetyl-D-Glucosamine
A4 D-Saccharic Acid
A5 Succinic Acid
A6 D-Galactose
A7 L-Aspartic Acid
A8 L-Proline
A9 D-Alanine
A10 D-Trehalose
A11 D-Mannose
A12 Dulcitol
B1 D-Serine
B2 D-Sorbitol
B3 Glycerol
B4 L-Fucose
B5 D-Glucuronic Acid
B6 D-Gluconic Acid
B7 D,L- -Glycerol- Phosphate
B8 D-Xylose
B9 L-Lactic Acid
B10 Formic Acid
B11 D-Mannitol
B12 L-Glutamic Acid
C1 D-Glucose-6-Phosphate
C2 D-Galactonic Acid- -Lactone
C3 D,L-Malic Acid
C4 D-Ribose
C5 Tween 20
C6 L-Rhamnose
C7 D-Fructose
C8 Acetic Acid
C9 -D-Glucose
C10 Maltose
C11 D-Melibiose
C12 Thymidine
D-1 L-Asparagine
D2 D-Aspartic Acid
D3 D-Glucosaminic Acid
D4 1,2-Propanediol
D5 Tween 40
D6 -Keto-
Glutaric Acid
D7 -Keto-
Butyric Acid
D8 -Methyl-D-
Galactoside
D9 -D-Lactose
D10 Lactulose
D11 Sucrose
D12 Uridine
E1 L-Glutamine
E2 m-Tartaric Acid
E3 D-Glucose-1-Phosphate
E4 D-Fructose-6-Phosphate
E5 Tween 80
E6 -Hydroxy
Glutaric Acid--Lactone
E7 -Hydroxy
Butyric Acid
E8 -Methyl-D-
Glucoside
E9 Adonitol
E10 Maltotriose
E11 2-Deoxy Adenosine
E12 Adenosine
F1 Glycyl-L-Aspartic Acid
F2 Citric Acid
F3 m-Inositol
F4 D-Threonine
F5 Fumaric Acid
F6 Bromo Succinic Acid
F7 Propionic Acid
F8 Mucic Acid
F9 Glycolic Acid
F10 Glyoxylic Acid
F11 D-Cellobiose
F12 Inosine
G1 Glycyl-L-Glutamic Acid
G2 Tricarballylic Acid
G3 L-Serine
G4 L-Threonine
G5 L-Alanine
G6 L-Alanyl-Glycine
G7 Acetoacetic Acid
G8 N-Acetyl- -D-Mannosamine
G9 Mono Methyl Succinate
G10 Methyl Pyruvate
G11 D-Malic Acid
G12 L-Malic Acid
H1 Glycyl-L-Proline
H2 p-Hydroxy Phenyl Acetic Acid
H3 m-Hydroxy Phenyl Acetic Acid
H4 Tyramine
H5 D-Psicose
H6 L-Lyxose
H7 Glucuronamide
H8 Pyruvic Acid
H9 L-Galactonic Acid- -Lactone
H10 D-Galacturonic Acid
H11 Phenylethyl- amine
H12 2-Aminoethanol

262
PM2A MicroPlate™ Carbon Sources
Negative Control A2 Chondroitin
Sulfate C
A3 -Cyclodextrin
A4 -Cyclodextrin
A5 -Cyclodextrin
A6
Dextrin
A7
Gelatin
A8
Glycogen
A9
Inulin
A10
Laminarin
A11
Mannan
A12
Pectin
B1
N-Acetyl-D-Galactosamine
B2
N-Acetyl-
Neuraminic
Acid
B3 -D-Allose
B4
Amygdalin
B5
D-Arabinose
B6
D-Arabitol
B7
L-Arabitol
B8 Arbutin B9 2-Deoxy-D-
Ribose
B10
i-Erythritol
B11 D-Fucose B12 3-0- -D-
Galacto-
pyranosyl-D-
Arabinose
C1 Gentiobiose C2
L-Glucose
C3 Lactitol C4 D-
Melezitose
C5 Maltitol C6 a-Methyl-D-
Glucoside
C7 -Methyl-D-
Galactoside
C8 3-Methyl
Glucose
C9 -Methyl-D-
Glucuronic
Acid
C10 -Methyl-D-
Mannoside
C11 -Methyl-D-
Xyloside
C12
Palatinose
D1 D-Raffinose D2 Salicin
D3
Sedoheptulosan
D4
L-Sorbose
D5 Stachyose D6 D-Tagatose D7 Turanose D8 Xylitol D9 N-Acetyl-D-
Glucosaminitol
D10 -Amino
Butyric Acid
D11 -Amino
Valeric Acid
D12
Butyric Acid
E1 Capric Acid E2
Caproic Acid
E3
Citraconic Acid
E4 Citramalic
Acid
E5 D-
Glucosamine
E6 2-Hydroxy
Benzoic Acid
E7
4-Hydroxy
Benzoic Acid
E8 -Hydroxy
Butyric Acid
E9 -Hydroxy
Butyric Acid
E10
a-Keto-Valeric
Acid
E11
Itaconic Acid
E12
5-Keto-D-
Gluconic Acid
F1
D-Lactic Acid Methyl Ester
F2
Malonic Acid
F3
Melibionic
Acid
F4
Oxalic Acid
F5
Oxalomalic
Acid
F6
Quinic Acid
F7 D-Ribono-
1,4-Lactone
F8 Sebacic
Acid
F9
Sorbic Acid
F10
Succinamic
Acid
F11
D-Tartaric
Acid
F12
L-Tartaric
Acid
G1
Acetamide
G2
L-Alaninamide
G3 N-Acetyl-L-
Glutamic Acid
G4 L-Arginine G5 Glycine G6 L-Histidine G7 L-
Homoserine
G8 Hydroxy-L-
Proline
G9 L-
Isoleucine
G10 L-Leucine G11
L-Lysine
G12
L-Methionine
H1
L-Ornithine
H2
L-
Phenylalanine
H3
L-Pyroglutamic
Acid
H4
L-Valine
H5
D,L-Carnitine
H6
Sec-Butylamine
H7 D.L-
Octopamine
H8
Putrescine
H9 Dihydroxy
Acetone
H10
2,3-Butanediol
H11 2,3-
Butanone
H12
3-Hydroxy 2-
Butanone

263
PM4A MicroPlate™ Phosphorus and Sulfur Sources
A1 Negative Control A2 Phosphate A3
Pyrophosphate
A4
Trimeta-phosphate
A5
Tripoly-phosphate
A6
Triethyl Phosphate
A7
Hypophosphite
A8
Adenosine- 2’-
monophosphate
A9
Adenosine- 3’-
monophosphate
A10
Adenosine- 5’-
monophosphate
A11 Adenosine-
2’,3’-cyclic
monophosphate
A12
Adenosine- 3’,5’-
cyclic
monophosphate
B1
Thiophosphate
B2
Dithiophosphate
B3 D,L- -Glycerol
Phosphate
B4 -Glycerol
Phosphate
B5
Carbamyl
Phosphate
B6
D-2-Phospho-
Glyceric Acid
B7
D-3-Phospho-
Glyceric Acid
B8 Guanosine- 2’-
monophosphate
B9 Guanosine- 3’-
monophosphate
B10
Guanosine- 5’-
monophosphate
B11 Guanosine-
2’,3’-cyclic
monophosphate
B12 Guanosine-
3’,5’-cyclic
monophosphate
C1 Phosphoenol Pyruvate C2
Phospho- Glycolic
Acid
C3
D-Glucose-1-
Phosphate
C4 D-Glucose-6-
Phosphate
C5 2-Deoxy-D-
Glucose 6-
Phosphate
C6 D-Glucosamine-
6-Phosphate
C7 6-Phospho-
Gluconic Acid
C8 Cytidine- 2’-
monophosphate
C9
Cytidine- 3’-
monophosphate
C10
Cytidine- 5’-
monophosphate
C11 Cytidine- 2’,3’-
cyclic
monophosphate
C12
Cytidine- 3’,5’-
cyclic
monophosphate
D1 D-Mannose-1-Phosphate D2
D-Mannose-6-
Phosphate
D3 Cysteamine-S-
Phosphate
D4
Phospho-L-
Arginine
D5 O-Phospho-D-
Serine
D6 O-Phospho-L-
Serine
D7 O-Phospho-L-
Threonine
D8 Uridine- 2’-
monophosphate
D9 Uridine- 3’-
monophosphate
D10 Uridine- 5’-
monophosphate
D11
Uridine- 2’,3’-
cyclic
monophosphate
D12
Uridine- 3’,5’-
cyclic
monophosphate
E1 O-Phospho-D-Tyrosine E2
O-Phospho-L-
Tyrosine
E3
Phosphocreatine
E4 Phosphoryl
Choline
E5 O-Phosphoryl-
Ethanolamine
E6 Phosphono
Acetic Acid
E7
2-Aminoethyl
Phosphonic Acid
E8
Methylene
Diphosphonic Acid
E9
Thymidine- 3’-
monophosphate
E10
Thymidine- 5’-
monophosphate
E11
Inositol
Hexaphosphate
E12
Thymidine 3’,5’-
cyclic
monophosphate
F1
Negative Control
F2
Sulfate
F3
Thiosulfate
F4
Tetrathionate
F5
Thiophosphate
F6
Dithiophosphate
F7 L-Cysteine F8 D-Cysteine F9
L-Cysteinyl-
Glycine
F10
L-Cysteic Acid
F11
Cysteamine
F12
L-Cysteine Sulfinic
Acid
G1
N-Acetyl-L-Cysteine
G2
S-Methyl-L-
Cysteine
G3 Cystathionine G4 Lanthionine G5 Glutathione G6 D,L-Ethionine G7 L-Methionine G8 D-Methionine G9 Glycyl-L-
Methionine
G10 N-Acetyl-D,L-
Methionine
G11
L- Methionine
Sulfoxide
G12
L-Methionine
Sulfone
H1
L-Djenkolic Acid
H2
Thiourea
H3 1-Thio- -D-
Glucose
H4
D,L-Lipoamide
H5
Taurocholic Acid
H6
Taurine
H7 Hypotaurine H8
p-Amino Benzene
Sulfonic Acid
H9
Butane Sulfonic
Acid
H10
2-Hydroxyethane
Sulfonic Acid
H11 Methane
Sulfonic Acid
H12
Tetramethylene
Sulfone

264
Appendix IV. The macroscopic appearance of infected larvae was illustrated in
the table below.
APEC strains/control Macro-
colour
(0-3)
Number of
Galleria
Diarrhoea or
pellet
Mean Galleria
survival (%)
Control?unifected larvae 0
1
2
3
49/50
1/50
0/50
0/50
Normal feacal
pellet
100
Control/PBS infected larvae 0
1
2
3
49/50
0/50
0/50
1/50
Green/yellow
pellet
98
ESBL APEC O78,SAP44(WT) 0
1
2
3
0/50
2/50
3/50
45/50
No feacal pellet 10
SAP44 cured(plasmidless) 0
1
2
3
0/50
2/50
6/50
42/50
No feacal pellet 10
SAP44F(p44FIB,FIB plasmid) 0
1
2
3
0/50
3/50
3/50
44/50
No feacal pellet 10
SAP44C (pSAP44,ESBL 0 30/50 Few larvae 60

265
APEC strains/control Macro-
colour
(0-3)
Number of
Galleria
Diarrhoea or
pellet
Mean Galleria
survival (%)
plasmid) 1
2
3
2/50
5/50
13/50
present
diarrhea but not
all over the
plate
Non-ESBL APEC O78,SAP24 0
1
2
3
0/50
5/50
0/50
45/50
No feacal pellet 10
SAP140 (pSAP44,ESBL
plasmid)
0
1
2
3
0/50
3/50
2/50
45/50
No feacal pellet 10
SAP59(K12) 0
1
2
3
0/50
8/50
1/50
41/50
No feacal pellet 15
SAP56(pSAP44,ESBL plasmid) 0
1
2
3
0/50
10/50
5/50
35/50
No feacal pellet 16
Macroscopic evaluation of G. mellonella larvae following APEC strains infection in terms of colour and presence of diarrhoea. APEC infected and uninfected larvae were incubated at 37oC. A score of 3 refers to fatality. Cream, score 0; beige score 1; dark beige to dark brown score 2; black score 3. Based on 5 replicates of group (10 larvae per group).

266
Appendix V. Media
A. Media
All culture media were obtained from Oxoid (Basingstoke) and prepared using
distilled water. Sterilization was carried out by autoclaving at 121ºC for 15 minutes at
15 pounds per square inch (p.s.i). The media plates were stored at 4ºC.
LB broth media
Tryptone 5g
Yeast Extract 2.5g
NaCl 5g
Distilled water 500 ml
LB agar
Tryptone 5g
Yeast extract 2.5g
Sodium chloride 5g
Agar 6g
Distilled water 500 ml
Iso-Sensitest Media
Iso-Sensitesy agar 15.7 g
Distilled water 500 ml

267
B. Davise minimal media
Potassium Phosphate (dibasic) K2HPO4 MW 228.17 3.5 g
Potassium Phosphate (monobasic) KH2PO4 MW 136.07 1 g
Ammonium Sulfate (NH4)2 SO4 MW 132.08 0.5 g
Sodium Citrate (trisodium, dihydrate) Na3C6H5O7 (H2O)2 MW 294.10 0.25 g
Distilled water 500 ml
After autoclaving the following stock solutions were added:
0.5ml of 10% (w/v) Magnesium Sulfate MgSO4 (separately autoclaved stock)
0.5ml of 0.2% (w/v) Thiamine (vitamin B1) (filter sterilized)
125 µl of 10% (w/v) glucose
C. M9 minimal media
Sodium phosphate, Na2HPO4 6 g
Potassium phosphate, KH2PO4 3g
Sodium chloride, NaCl 05g
Ammonium chloride, NH4Cl 1.0 g
After autoclaving the following stock solutions were added:
1 ml of 1M Magnesium sulfate, MgSO4
1 ml of 0.1M Calcium chloride CaCl2
10 ml of 10% (w/v) glucose (or other carbon source)

268
D. VLA media
Beef extract 2.5 g
Yeast extract 5.0 g
Glucose 2.5 g
Tryptose 10 g
L-cysteine HCL 0.6 g
NaCl 5.0 g
Buffer solutions 1.0/ L
Buffered solutions was adjusted at pH of 5.8 by adding the following soultions:
118 ml of 1M citric acid
382ml of 1M sodium citrate