understanding household trading behavior 2011–2018 · trading behavior 2011–2018 ... median...
TRANSCRIPT

Vanguard Research August 2019
Understanding household trading behavior 2011–2018
■ In aggregate, trading among Vanguard households is low. In 2018, only 16% of Vanguard households traded in their accounts, a rate relatively unchanged over the 2011–2018 period of this study.
■ Propensity to trade varies across types of household account relationships with Vanguard. Households that have only a defined contribution (DC) account relationship had the lowest incidence of trading—only 6% traded in 2018. Among households with any retail account relationship, 23% traded in 2018. Trading was most frequent among affluent households with both IRA and taxable account relationships. In 2018, 4 in 10 of those households traded at least once in the year.
■ Household trading sentiment is not single-minded and unidirectional. Instead, like the market, individual investors are typically on “both sides of the trade.” In 2018, these traders exchanged the dollar equivalent of 19% of average household assets. On a net basis, households took a marginally more conservative position, shifting 1% of assets from equities to fixed income. However, during any given month, trading households shifted significant gross flows both into and out of equities.
■ It’s important to note that the period of this study, 2011 to 2018, was a period of generally low market volatility.
Jeffrey W. Clark, Stephen P. Utkus, and Jean A. Young
Acknowledgment: The authors would like to thank Daniel L. Horwath for his support of the data analysis.

2
Introduction
This report examines Vanguard household trading behavior over the 2011–2018 period. Trading is the act of moving monies from one investment option to another, and is thus a valuable measure of individual investor sentiment. This paper provides a baseline assessment of trading behavior and factors influencing household decision-making.
Many analyses of investor trading and sentiment use readily available market flow data—for example, dollars moving between investments, as reported by fund industry statistics. By contrast, we examine the behavior of individuals separate from dollar movement, and examine trading not just among traders but also among a relevant universe of investors. We are thus able to examine the behavior of decision-makers and estimate the incidence of trading across households.
This report begins with an overview of our study population. Next, we move to market and economic events both historically over a longer period and during our study period. We then analyze the level of household trading and the demographic characteristics that influence trading. We conclude with observations about the nature of household trading during this period.
Observations on our results
At the outset, we must note that over the period of our study, U.S. equity markets exhibited relatively low volatility. Thus, our findings must be interpreted in light of these relatively benign market conditions. We anticipate that trading would be more severe during large market shocks, and we anticipate reporting on such events as they unfold.
It’s also important to note that our results may be unique to Vanguard investors for a variety of reasons. The first is self-selection. Investors coming to Vanguard, particularly retail investors, may be drawn to Vanguard’s investment philosophy, which includes emphasizing the importance of asset allocation and broad market diversification over security selection, market timing, and trading generally.1 In addition, our sample includes investors who are Vanguard households not because they chose Vanguard but because their employer selected Vanguard as a DC administrative services provider.
Another important consideration is platform-related. Historically, most Vanguard households have been on a mutual fund transfer agency or defined contribution system, where all trading during the day is aggregated and executed at the close of the U.S. stock market at
1 See Vanguard’s Principles for Investing Success (2017), available at institutional.vanguard.com.
3
4 p.m. (Eastern time). By 2018, about half of our retail households were on a brokerage platform with intra-day trading. Only about 20% of these retail households held individual securities or ETFs.
Finally, it should be noted that we observe only a portion of the household’s total financial wealth. In other words, investors may choose to trade in non-Vanguard accounts, which we do not observe.
Despite these caveats, our findings are based on the actual records of millions of investors and, to our knowledge, is the most comprehensive survey of historical household trading behavior published.
Study population
Our study is based on 8.4 million Vanguard households drawn from Vanguard’s U.S. retail business and its U.S. DC business. All 8.4 million households have account
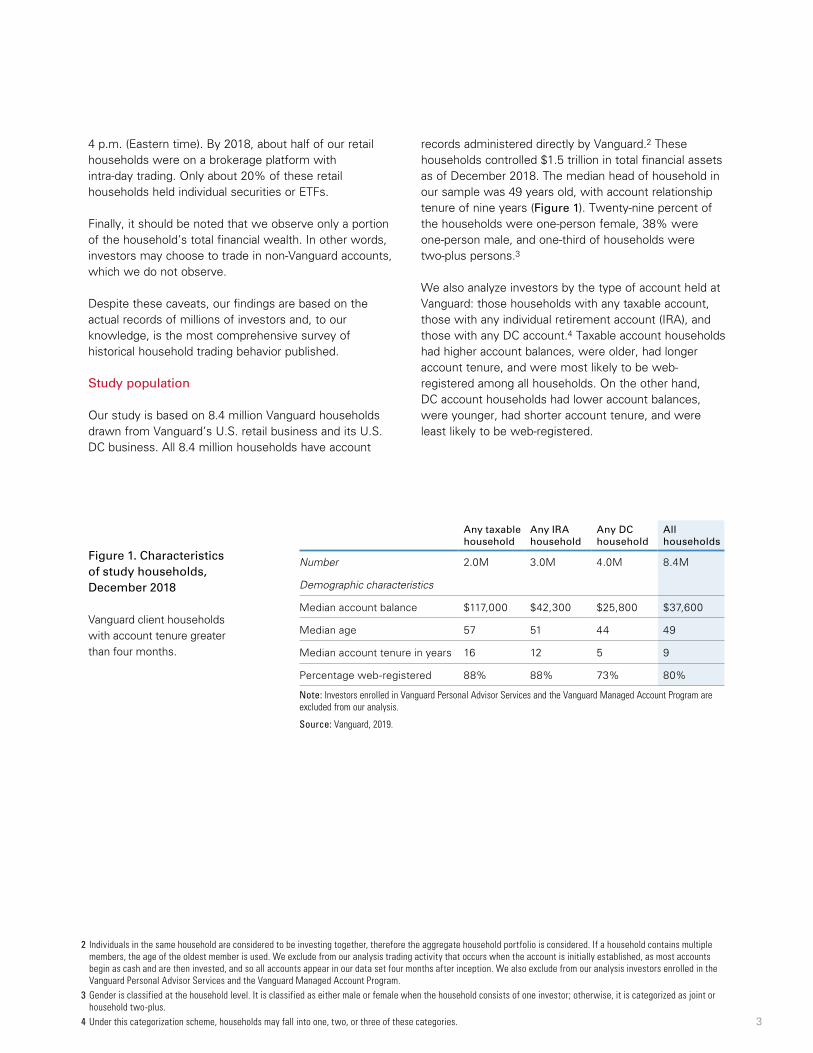
records administered directly by Vanguard.2 These households controlled $1.5 trillion in total financial assets as of December 2018. The median head of household in our sample was 49 years old, with account relationship tenure of nine years (Figure 1). Twenty-nine percent of the households were one-person female, 38% were one-person male, and one-third of households were two-plus persons.3
We also analyze investors by the type of account held at Vanguard: those households with any taxable account, those with any individual retirement account (IRA), and those with any DC account.4 Taxable account households had higher account balances, were older, had longer account tenure, and were most likely to be web-registered among all households. On the other hand, DC account households had lower account balances, were younger, had shorter account tenure, and were least likely to be web-registered.
Figure 1. Characteristics of study households, December 2018
Vanguard client households with account tenure greater than four months.
Any taxable household
Any IRA household
Any DC household
All households
Number 2.0M 3.0M 4.0M 8.4M
Demographic characteristics
Median account balance $117,000 $42,300 $25,800 $37,600
Median age 57 51 44 49
Median account tenure in years 16 12 5 9
Percentage web-registered 88% 88% 73% 80%
Note: Investors enrolled in Vanguard Personal Advisor Services and the Vanguard Managed Account Program are excluded from our analysis.
Source: Vanguard, 2019.
2 Individuals in the same household are considered to be investing together, therefore the aggregate household portfolio is considered. If a household contains multiple members, the age of the oldest member is used. We exclude from our analysis trading activity that occurs when the account is initially established, as most accounts begin as cash and are then invested, and so all accounts appear in our data set four months after inception. We also exclude from our analysis investors enrolled in the Vanguard Personal Advisor Services and the Vanguard Managed Account Program.
3 Gender is classified at the household level. It is classified as either male or female when the household consists of one investor; otherwise, it is categorized as joint or household two-plus.
4 Under this categorization scheme, households may fall into one, two, or three of these categories.

4
Market environment
The U.S. equity market, as represented by the Standard & Poor’s 500 Index’s closing value, rose fairly steadily between 2011 and 2018, although the period was interspersed with some volatile days (Figure 2). While markets may have felt more volatile in 2018 following a period of low volatility, they were actually in line with historical trends. During 2018, markets reached a new peak in September, rising 8% year-to-date. However, in the fourth quarter, markets fell 20% from the September peak and for the year they fell 8%. In the longer period of 1980 to 2018, stock prices were exceptionally volatile during the global financial crisis, the tech boom/bust, and the period around Black Monday.
High-level trading metrics
Household trading or exchange activity is the movement of existing account assets from one investment option to another. Exchange activity is a proxy for a household’s holding period for investments, as well as a measure of the household’s willingness to change its portfolio in response to short-term market volatility.
The ability to trade daily is nearly universal for Vanguard households. But while assets can be traded daily, Vanguard mutual funds generally have “30-day round trip” restrictions designed to thwart the minority of households who seek to engage in active market-timing.5
5 Vanguard mutual funds generally do not accommodate frequent trading. Such trading can increase a fund’s costs for all shareholders and disrupt management of the fund. Vanguard funds have adopted policies and procedures reasonably designed to detect and discourage frequent trading. The funds generally prohibit an investor’s purchases or exchanges into a fund for 30 calendar days after the investor has redeemed or exchanged out of that fund account.
Figure 2. Volatility and prices for the S&P 500 Index, January 1, 1980, to December 31, 2018
Note: Intraday volatility is calculated as daily range of trading prices [(high-low)/opening price] for the S&P 500 Index. Source: Vanguard calculations, using data from Bloomberg.Past performance is no guarantee of future results. The performance of an index is not an exact representation of any particular investment, as you cannot invest directly in an index.
0
7%
1980 1985 1990 1995 2000 2005 2010 20150
3,500
Global �nancial
crisis
Study period2011 to 2018
Black Monday
Tech boom/bust
30-d
ay a
vera
ge
intr
aday
vo
lati
lity
S&
P 5
00 In
dex

5
In 2018, only 16% of households made one or more portfolio trades or exchanges during the year (Figure 3).6 During our study period, 15% to 17% of investors traded during a given year. This is a quite low level of aggregate trading, although, as we describe later, trading levels vary significantly across different account relationships.
Another measure of trading is the volume of dollars traded. We measure dollar volume movements as a fraction of total household assets in order to scale them to growth in assets and underlying business growth. In effect, the fraction of assets traded is a measure of portfolio turnover.
In 2018, traders exchanged the dollar equivalent of 19% of average household assets. On a net basis, 1% of household assets were shifted from equities to fixed income in 2018. In 2011, traders exchanged the dollar equivalent of 22% of assets and 2% of assets were shifted from equities to fixed income. During our study period, 2018 and 2011 had the highest number of volatile days as measured by the S&P 500 Index volatility. Historically, 1% of stock market trading days are associated with a change in stock prices of plus or minus 3%. In 2018, 2.4% of days had a change of plus or minus 3%, and in 2011, 4.8% of days did. Generally, less than 1% of days had a change of plus or minus 3% between 2012 and 2017.
Figure 3. High-level trading metrics
Vanguard client households
2011 2012 2013 2014 2015 2016 2017 2018
Percentage of households trading 16% 15% 17% 17% 16% 15% 15% 16%
Percentage of average assets
Percentage traded 22% 21% 21% 18% 17% 17% 16% 19%
Percentage moved to equities (fixed income)
(2%) 4% 6% 4% 3% (3%) 1% (1%)
Dollar flows (in billions)
Dollars traded $220.1 $216.4 $257.1 $243.2 $242.3 $256.7 $276.3 $351.1
Dollars moved to equities (fixed income) ($5.2) $9.3 $16.2 $9.0 $8.5 ($8.0) $2.4 ($1.9)
S&P 500 Index volatility
Percentage of days down 3% or more 2.4% 0.0% 0.0% 0.0% 0.8% 0.4% 0.0% 2.0%
Percentage of days up 3% or more 2.4% 0.0% 0.0% 0.0% 0.4% 0.0% 0.0% 0.4%
4.8% 0.0% 0.0% 0.0% 1.2% 0.4% 0.0% 2.4%
Percentage of days down 1% or more 18.0% 8.4% 6.7% 7.5% 12.3% 8.7% 1.6% 12.7%
Percentage of days up 1% or more 19.0% 11.6% 8.7% 7.5% 16.7% 10.3% 1.6% 12.7%
37.0% 20.0% 15.4% 15.0% 29.0% 19.0% 3.2% 25.4%
Source: Vanguard, 2019.
6 Our trading statistics are generally adjusted for DC-sponsor-initiated trading—e.g., replacement of one plan option with another. On the date the option is eliminated and the balances are moved to a different fund, we are able to capture and adjust for the fund replacement effect. However, some DC participants initiate exchanges either before or after the fund is eliminated. We are not able to isolate the DC participant activity but estimate that it could account for up to one-third of the trading activity in DC plans.

6
Direction of money movement
Financial market statistics sometimes give the misleading impression that all individual investor trading is like-minded and goes in one particular direction. This is sometimes known as the “dumb money” or “herding” hypothesis—that individual investors, particularly retail investors, make uniform trading decisions that chase recent performance. This observation is often the result of relying on asset-flow data in the financial markets, which reports on aggregate dollar movement, rather than individual decisions, and does so on a net, rather than a gross, basis.
While trading may still indeed be strongly influenced by recent market performance, it is also the case that individual household trading decisions are not uniform and unidirectional. Our detailed trading records allow us to distinguish buyers from sellers and so provide a more nuanced view of trading by households. In any given month, households that trade are trading meaningful dollar amounts both into and out of equities (Figure 4). Even in volatile markets, as some traders shift their portfolios toward fixed income assets, others shift toward equities.
During the 2011 to 2018 period, the net movement of money among traders was slightly toward equity investments. Nonetheless, throughout our study period there were significant gross flows toward both equities and fixed income among Vanguard investors.
Trading by household type
While 16% of investor households traded in 2018, trading by household type varied dramatically. In our analysis of trading by investor type we categorize investors by the type of account held. Our five detailed investor categories are: DC only, IRA only, taxable only, DC crossover (DC investors who also hold IRA and/or taxable accounts), and IRA and taxable account holders. We add a sixth summary category for households with any retail account relationship.
In 2018, DC-only households had the lowest trading rate, at 6% of households trading (Figure 5). Households with any retail relationship had a 23% trading rate. IRA/taxable households had the highest trading rate in 2018. The relatively low (and declining) rate of DC trading can be explained by the nature of the account relationship (long-term retirement-oriented) and by the growing reliance on target-date funds as investments. Over half of DC-only households held a single target-date fund in 2018 as their entire portfolio. In target-date funds, trading is conducted by the portfolio manager in underlying investments, but few DC participants with target-date funds trade out of the target-date option.7
7 For a more detailed look at DC trading at Vanguard, see How America Saves 2019, at institutional.vanguard.com.

7
Figure 5. Trading summary by investor type, 2018
Vanguard client households
DC only
IRA only
Taxable only
DC crossover
IRA / taxable
Any retail All
Percentage of investors 44% 26% 14% 11% 5% 56%
Percentage of households trading 6% 14% 20% 31% 42% 23% 16%
Percentage of average assets traded 10% 22% 19% 17% 22% 21% 19%
Source: Vanguard, 2019.
Figure 4. Direction of money movement, January 2011 to December 2018
Monthly money movement as a percentage of average household assets
Source: Vanguard, 2019.
2
1
1
0
2%
2011 2012 2013 2014 2015 2016 2017 2018
Gross movement into equities
Gross movement into �xed income
Net �ow

8
Trading during market shocks
In a monthly time-series of trading, these cross-sectional differences in trading by account type persist. IRA/taxable investors traded most frequently, while DC-only investors had the lowest trading rates (Figure 6). A longitudinal look illustrates the significant impact that market events have on household trading behavior. All household types traded more frequently during periods of market uncertainty, such as the 2011 debt crisis; global events in 2015 such as the conflict in Syria, the Ebola outbreak, and China concerns; the 2016 U.S.
election; and the early-2018 market correction. Trading in household assets followed similar patterns, spiking in response to the same market uncertainties (Figure 7).
2018 had the highest proportion of active investor trading days during our study period. As noted previously, overall, 2018 was characterized by a return of normal market volatility following several years of very low market volatility as measured by plus or minus 3% market fluctuations. The fourth quarter of 2018 saw a decline of 20% in market value from a September peak.

9
Figure 6. Monthly household trading by investor type, January 2011 to December 2018
Percentage of households trading
Figure 7. Monthly assets traded by investor type, January 2011 to December 2018
Percentage of assets traded
Source: Vanguard, 2019.
Source: Vanguard, 2019.
0
1
2
3
4%
2011 2012 2013 2014 2015 2016 2017 2018
2011 2012 2013 2014 2015 2016 2017 2018
Debt crisisGlobal fears(Syria, Ebola)
Chinaconcerns Election
Marketcorrection
Debt crisisGlobal fears(Syria, Ebola)
Chinaconcerns Election
Marketcorrection
DC only
IRA only
Taxable only
DC crossover
IRA and taxable only
All households
DC only
DC crossover
IRA onlyTaxable only
IRA and taxable only
All households
0
5
10
15
20
25%
0
1
2
3
4%
2011 2012 2013 2014 2015 2016 2017 2018
2011 2012 2013 2014 2015 2016 2017 2018
Debt crisisGlobal fears(Syria, Ebola)
Chinaconcerns Election
Marketcorrection
Debt crisisGlobal fears(Syria, Ebola)
Chinaconcerns Election
Marketcorrection
DC only
IRA only
Taxable only
DC crossover
IRA and taxable only
All households
DC only
DC crossover
IRA onlyTaxable only
IRA and taxable only
All households
0
5
10
15
20
25%

10
Figure 8. Household activity on the 20 highest trading days, January 2011 to December 2018
Days are listed by proportion of households trading
Source: Vanguard, 2019.
0.2%
0.2%
0.1%
0.2%
0.1%
0.2%
0.3%
0.2%
0.2%
0.2%
0.1%
0.2%
0.2%
0.2%
0.2%
0.2%
0.2%
0.3%
0.4%
0.3%
0.1%
0.8%
0.8%
0.8%
0.8%
0.8%
0.8%
0.8%
0.8%
0.8%
0.8%
0.8%
0.8%
0.8%
0.8%
0.9%
0.9%
0.9%
0.9%
1.1%
1.2%
0.4%
August 25, 2015
February 9, 2018
April 15, 2013
January 2, 2014
January 2, 2018
January 3, 2011
August 9, 2011
August 5, 2011
January 16, 2018
February 3, 2014
January 15, 2016
October 15, 2014
June 24, 2016
January 5, 2015
August 21, 2015
January 4, 2016
February 6, 2018
February 5, 2018
August 8, 2011
August 24, 2015
Growing concern that China’s economywas slowing down.
Highly volatile day, bounce back from daywhen S&P 500 was down 3.75%.
Concerns of economic slowdown in China,coupled with Boston Marathon explosion.
First trading day of the year, coupledwith concerns about economic growth in China.
First trading day of year, coupledwith strong economic sentiment.
Positive economic news to start the new year.
Federal Reserve announcement that interestrates would remain low.
Highly volatile day, concerns about U.S. economyand European debt crisis.
Concerns of a government shutdown.
Concerning manufacturing data.
Concerning economic news regarding retail sales.
Concerns regarding economic growth, Ebola fears,and Middle East con�icts.
United Kingdom voted in referendumto leave the European Union.
Crude oil traded below $50/barrel and concernsregarding global economic growth.
Concern regarding China devaluing itscurrency in addition to slowing economic growth.
First trading day of year, coupled withconcern regarding China’s manufacturing sector.
Market correction/interest rates rising.
Market correction/interest rates rising.
Standard & Poor’s downgraded theU.S. AAA credit rating.
Growing concern that China’s economywas slowing down.
–1.4%
1.5%
–2.3%
–0.9%
0.8%
1.1%
4.7%
–0.1%
–0.4%
–2.3%
–2.2%
–0.8%
–3.6%
–1.8%
–3.2%
–1.5%
–4.1%
–2.1%
–6.7%
–3.9%
Daily averageTrading day
S&P 500movementUnderlying market event
Percentage of households trading
Percentage of assets traded

11
Top trading days
On any given day, only 0.4% of Vanguard households traded, and they traded only 0.1% of average household assets—a relatively low trading level (Figure 8). During our study period, the most active trading day was August 24, 2015—on this date, three times as many investors as usual traded and these households traded three times as many assets. In August 2015, there was growing concern that China’s economy was slowing down.
Investors appear to react to negative market news—80% of the 20 most active investor trading days were characterized by negative news.
Overall, on the 20 most active investor trading days, there was a net movement to fixed income of less than 0.01%. However, much like our monthly money movement trends, on any given trading day investors moved both into and out of equities (Figure 9).
Figure 9. Investor money movement on the 20 highest trading days, January 2011 to December 2018
Percentage of investors moving into and out of equities
Source: Vanguard, 2019.
August 25, 2015
February 9, 2018
April 15, 2013
January 2, 2014
January 2, 2018
January 3, 2011
August 9, 2011
August 5, 2011
January 16, 2018
February 3, 2014
January 15, 2016
October 15, 2014
June 24, 2016
January 5, 2015
August 21, 2015
January 4, 2016
February 6, 2018
February 5, 2018
August 8, 2011
August 24, 2015
To equities
71% 6% 23%
67% 4% 29%
62% 13% 25%
60% 14% 26%
54% 13% 33%
54% 19% 27%
60% 7% 33%
59% 7% 34%
58% 10% 32%
66% 9% 25%
74% 6% 20%
67% 6% 27%
75% 4% 21%
64% 14% 22%
72% 4% 24%
67% 13% 20%
64% 4% 32%
57% 6% 37%
57% 6% 37%
66% 4% 30%
56% 12% 32%
To �xed incomeNo change

12
Who trades?
To better understand the factors influencing household trading, we used a regression model to investigate the relationship between trading and observed demographic characteristics and household type. This statistical technique helps us distinguish the unique effect of a given factor on trading, controlling for the broad differences that exist among Vanguard households.
Our model estimates how much a given factor was associated with a household’s propensity to trade during 2018 (Figure 10). We find that these are the most economically and statistically significant factors:
• Assets. The higher a household’s assets at Vanguard, the more likely the household is to trade. Households with over $1 million in Vanguard assets are 13% more likely to trade than those with $25,000–$49,999 in Vanguard assets. Households with less than $10,000 in Vanguard assets are 4% less likely to trade.
• Household type. Households with both IRA and taxable accounts are 11% more likely to trade than DC-only investors.
• Target-date fund households. Households holding only target-date funds are 19% less likely to trade than households constructing portfolios on their own.
Age and Vanguard account tenure data suggest that younger and shorter-tenured households are somewhat more likely to trade.
How frequently do traders trade?
Conditional on trading, how frequently do households trade? While households can execute multiple trades in a single day, here we examine the number of days a household chooses to trade. Again, to understand the factors influencing the number of household trading days, we used a regression model to investigate the relationship between trading and observed demographic characteristics and household account type. Contingent on trading, our model estimates how a given factor is associated with the number of investor trading days during 2018. We find that these are the most economically and statistically significant factors:
• Assets. The higher a household’s assets at Vanguard, the more days a household trades. Households with over $1 million in Vanguard assets had 5.1 more trading days than those with $25,000–$49,999 in Vanguard assets. Households with less than $10,000 at Vanguard had 1.1 fewer trading days.
• Household type. Households with both IRA and taxable accounts had 4.6 more trading days than DC-only investors.
• Gender. Women had 1.7 fewer trading days than men.
Age suggests that investors younger or older had fewer trading days. Shorter-tenured investors had slightly more trading days.

13
Figure 10. Factors influencing all household trading behavior, 2018 trading activity
Notes: Traders are measured against a reference of: age 45–54, tenure 7–9 years, assets of $25,000–$49,999, male, non-pure-target-date-fund investor, and DC-only. We also included a control for income; however, the results were not economically significant and are not shown. All results are statistically significant at the 95% level. Source: Vanguard, 2019.
IRA/retail
DC crossover
Taxable only
IRA only
Pure TDF
Household two-plus
Female
$1,000,000+
$500,000–$999,999
$250,000–$499,999
$100,000–$249,999
$75,000–$99,999
$50,000–$74,999
$10,000–$24,999
Less than $10,000
25+
20–24
15–19
10–14
4–6
2–3
Less than 2
85+
75–84
65–74
55–64
35–44
25–34
Less than 25
Age
Vanguard assets
Gender
Target-date fund investor
11%
7%
6%
5%
–19%
–3%
–3%
13%
10%
8%
5%
3%
1%
–2%
–4%
–3%
–3%
–2%
–2%
1%
3%
5%
–1%
1%
1%
0%
2%
3%
3%
Tenure (in years)
Investor type

14
Implications
This report provides a baseline assessment of Vanguard household trading behavior and factors influencing household trading over the 2011–2018 period. We examine individual behavior and look at trading relative to all investors and total Vanguard investor account balances—not just the individuals engaged in trading activity.
During this relatively benign market period, few households traded. Overall, only about 1 in 7 households traded in a given year. DC-only households were least likely to trade, with only 6% trading, while 4 in 10 households holding both IRA and taxable accounts traded.
Household trading is not unidirectional but, like the market, reflects “both sides of the trade.” Household trading is highly heterogeneous. That is, on any given high-volume trading day, households move both into and out of equities.
Households do appear to trade in reaction to market volatility when the news is negative and major market indexes decline. Both the propensity to trade and the amount of trading varies with wealth—wealthier investors are more likely to trade.
We believe this report provides a baseline for understanding household trading behavior during our reference period, and expect it will be useful in gauging investor behavior during periods of market volatility. We also hope that it will encourage publication of similar trading analyses by other institutions serving different types of investors.

© 2019 The Vanguard Group, Inc. All rights reserved. Vanguard Marketing Corporation, Distributor.
CIRHTRB 082019
Vanguard Research
P.O. Box 2600 Valley Forge, PA 19482-2600
Connect with Vanguard® > vanguard.com
For more information about Vanguard funds, visit vanguard.com or call 800-662-2739 to obtain a prospectus. Investment objectives, risks, charges, expenses, and other important information about a fund are contained in the prospectus; read and consider it carefully before investing.
All investing is subject to risk, including possible loss of principal.
Investments in target-date funds are subject to the risks of their underlying funds. The year in the fund name refers to the approximate year (the target date) when an investor in the fund would retire and leave the work force. The fund will gradually shift its emphasis from more aggressive investments to more conservative ones based on its target date. An investment in target date funds is not guaranteed at any time, including on or after the target date.