understanding contemporary us birth and the role of midwives eugene declercq, phd boston university...
TRANSCRIPT

Understanding Contemporary US Birth and the Role of
Midwives
Eugene Declercq, PhD
Boston University School of Public Health
Grantmakers in Health Annual Meeting
Atlanta, Georgia
March 6, 2014
BirthByTheNumbers.org

Three Trends of Interest
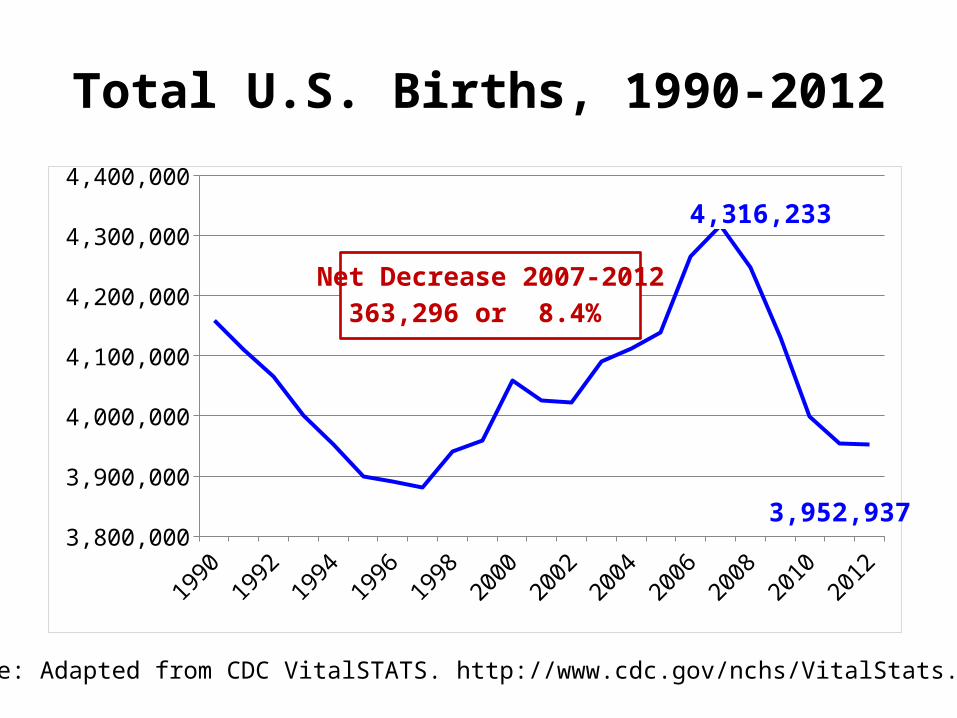
Total U.S. Births, 1990-2012
19901992
19941996
19982000
20022004
20062008
20102012
3,800,000
3,900,000
4,000,000
4,100,000
4,200,000
4,300,000
4,400,000
3,952,937
4,316,233
Net Decrease 2007-2012363,296 or 8.4%
Source: Adapted from CDC VitalSTATS. http://www.cdc.gov/nchs/VitalStats.htm

Prematurity and Low Birthweight, U.S., 1981-2012
1981
1982
1983
1984
1985
1986
1987
1988
1989
1990
1991
1992
1993
1994
1995
1996
1997
1998
1999
2000
2001
2002
2003
2004
2005
2006
2007
2008
2009
2010
2011
2012
6
7
8
9
10
11
12
13
Prematurity
Low Birthweight

Percent of all births occurring outside a hospital, at home, or in a birthing center, United States,
1990-2012
19901995
20002005
20102012
0
0.2
0.4
0.6
0.8
1
1.2
1.4
Total out of hospital
Home
Birthing center
46,956(1.13%) 35,587
(0.87%)
50,761(1.28%)
43% Increase 2004-2013

BirthByTheNumbers.org
Key Question
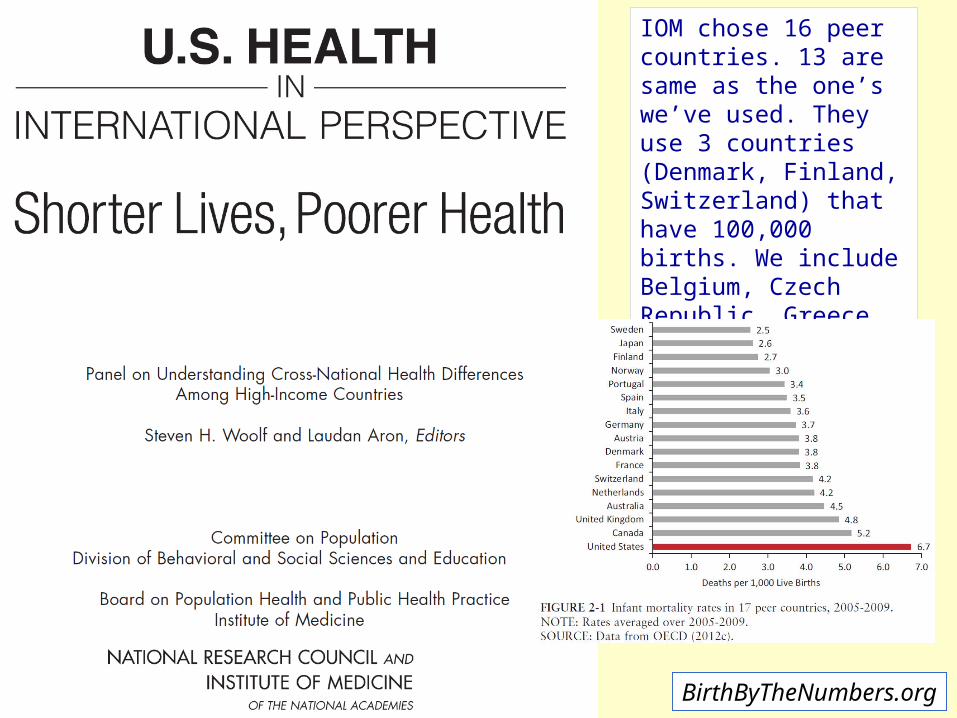
Is the U.S. really doing as badly as it seems in
international comparisons?
BirthByTheNumbers.org
BirthByTheNumbers.org
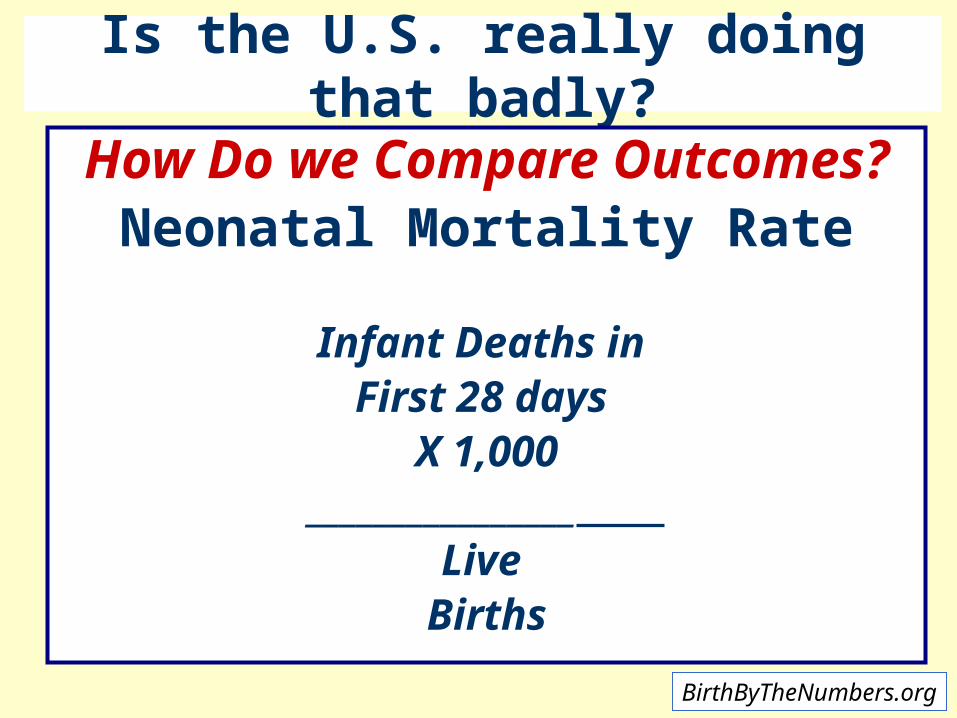
Is the U.S. really doing that badly?
How Do we Compare Outcomes?Neonatal Mortality Rate
Infant Deaths in First 28 days
X 1,000________________
Live Births

Outcomes: Comparative Neonatal Mortality RatesRank Country Rank Country Rank Country
1 San Marino (1) 14 Israel 27 Belarus
Andorra Monaco Netherlands
IcelandRepublic of Korea Greece
Japan Ireland Cuba
Singapore Belgium Lithuania
Cyprus Czech Republic New Zealand7 Luxembourg (2) France United Kingdom
Slovenia Germany Switzerland
Sweden Italy Croatia
Finland Denmark Malaysia
Estonia 24 Austria (3) 37 United States (4)
Norway Spain Canada, Hungary, U.A.E.
13 Portugal 26 Australia Poland, Qatar, Serbia
Source: State of the World’s Children2013. http://www.unicef.org/sowc2013/statistics.html
BirthByTheNumbers.org
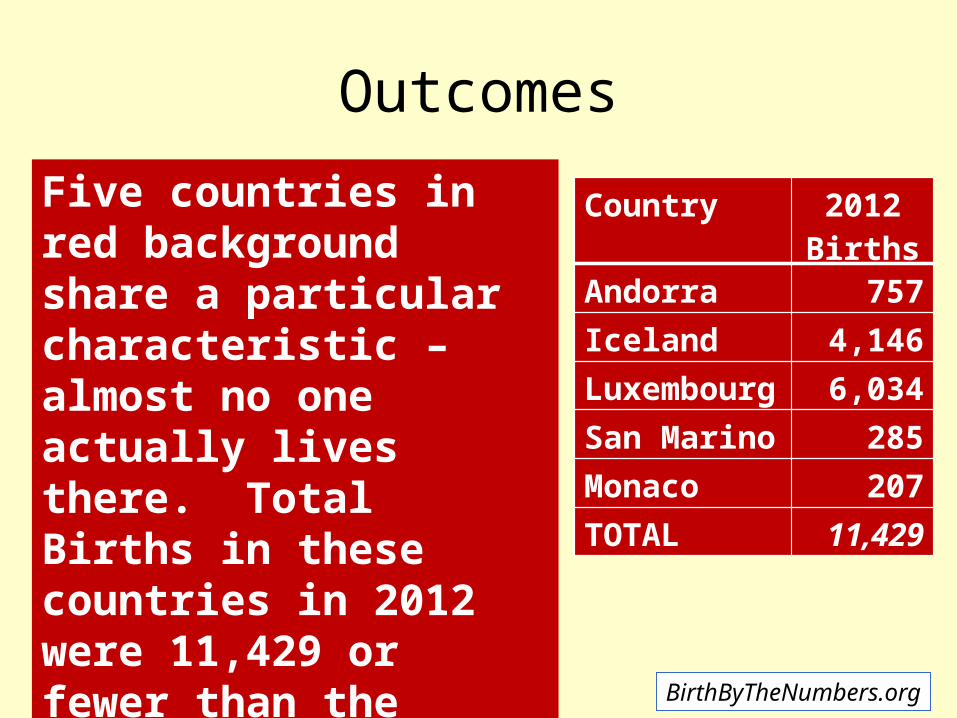
Outcomes
Five countries in red background share a particular characteristic – almost no one actually lives there. Total Births in these countries in 2012 were 11,429 or fewer than the 11,450 in Alaska in 2011
Country 2012Births
Andorra 757
Iceland 4,146
Luxembourg 6,034
San Marino 285
Monaco 207
TOTAL 11,429
BirthByTheNumbers.org

BirthByTheNumbers.org
What’s a Fair Comparison with the US?
In the most recent year available (2010):
• Countries with at least 100,000 births
• Countries with a total per capita annual expenditure on health of at least $1,500 in US dollars.
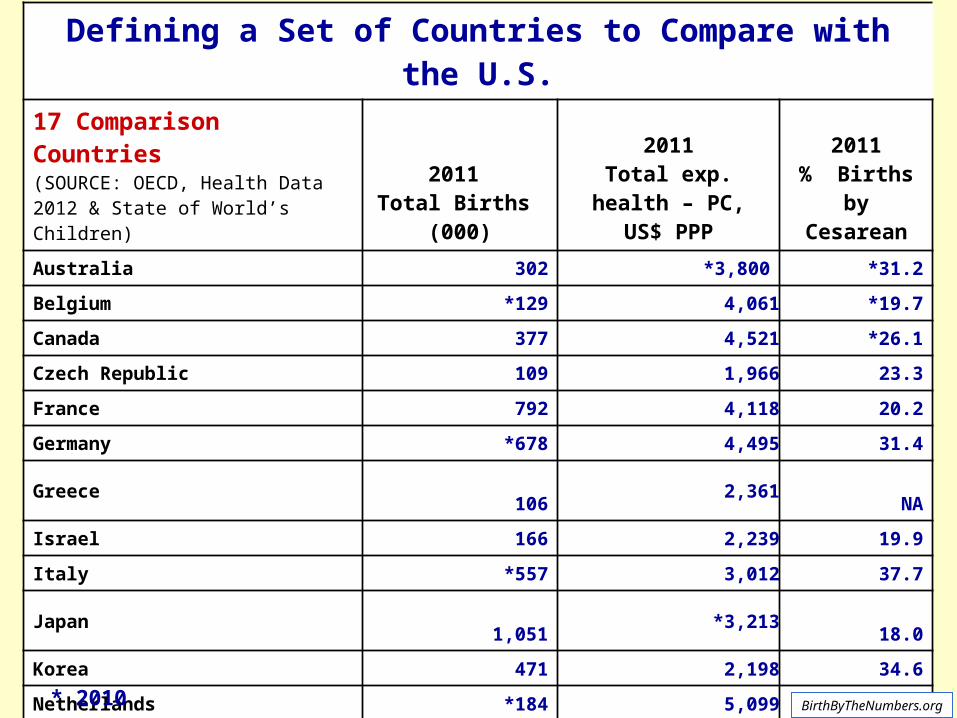
Defining a Set of Countries to Compare with the U.S.17 Comparison Countries (SOURCE: OECD, Health Data 2012 & State of World’s Children)
2011 Total Births
(000)
2011Total exp. health –
PC, US$ PPP
2011% Births by
Cesarean
Australia 302 *3,800 *31.2
Belgium *129 4,061 *19.7
Canada 377 4,521 *26.1
Czech Republic 109 1,966 23.3
France 792 4,118 20.2
Germany *678 4,495 31.4
Greece 106 2,361 NA
Israel 166 2,239 19.9
Italy *557 3,012 37.7
Japan 1,051 *3,213 18.0
Korea 471 2,198 34.6
Netherlands *184 5,099 *15.6
Portugal 97 2,619 33.3
Spain 471 3,072 24.9
Sweden 112 3,925 16.2
United Kingdom 808 3,406 24.1
United States 3,954 8,508 32.8
BirthByTheNumbers.org* 2010
BirthByTheNumbers.org
IOM chose 16 peer countries. 13 are same as the one’s we’ve used. They use 3 countries (Denmark, Finland, Switzerland) that have 100,000 births. We include Belgium, Czech Republic, Greece and Hungary
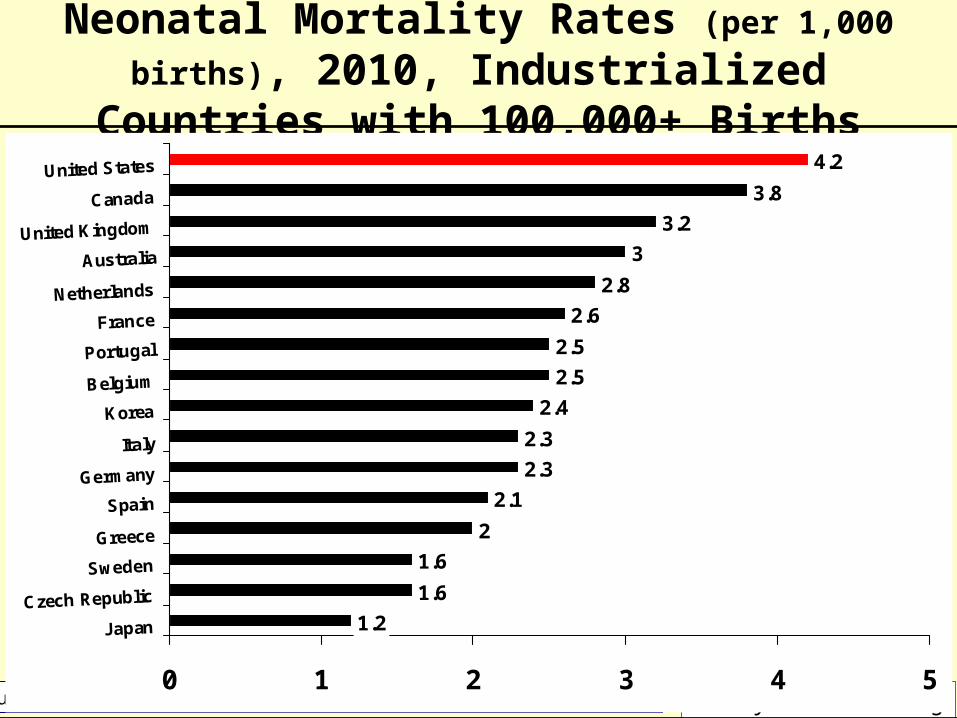
Neonatal Mortality Rates (per 1,000 births), 2010, Industrialized Countries with 100,000+ Births
1.2
1.6
1.6
2
2.1
2.3
2.3
2.4
2.5
2.5
2.6
2.8
3
3.2
3.8
4.2
0 1 2 3 4 5
Japan
Czech Republic
Sweden
Greece
Spain
Germany
Italy
Korea
Belgium
Portugal
France
Netherlands
AustraliaUnited Kingdom
Canada
United States
Source: OECD Health Data 2013 and NCHS, Deaths Final Data for 2007. BirthByTheNumbers.org

Neonatal Mortality Rates (per 1,000 births), 2010, Industrialized Countries with 100,000+ Births
1.2
1.6
1.6
2
2.1
2.3
2.3
2.4
2.5
2.5
2.6
2.8
3
3.2
3.4
3.8
0 1 2 3 4
Japan
Czech Republic
Sweden
Greece
Spain
Germany
Italy
Korea
Belgium
Portugal
France
Netherlands
AustraliaUnited Kingdom
U.S. White
Canada
Source: OECD Health Data 2013 and NCHS, Deaths Final Data for 2007. BirthByTheNumbers.org
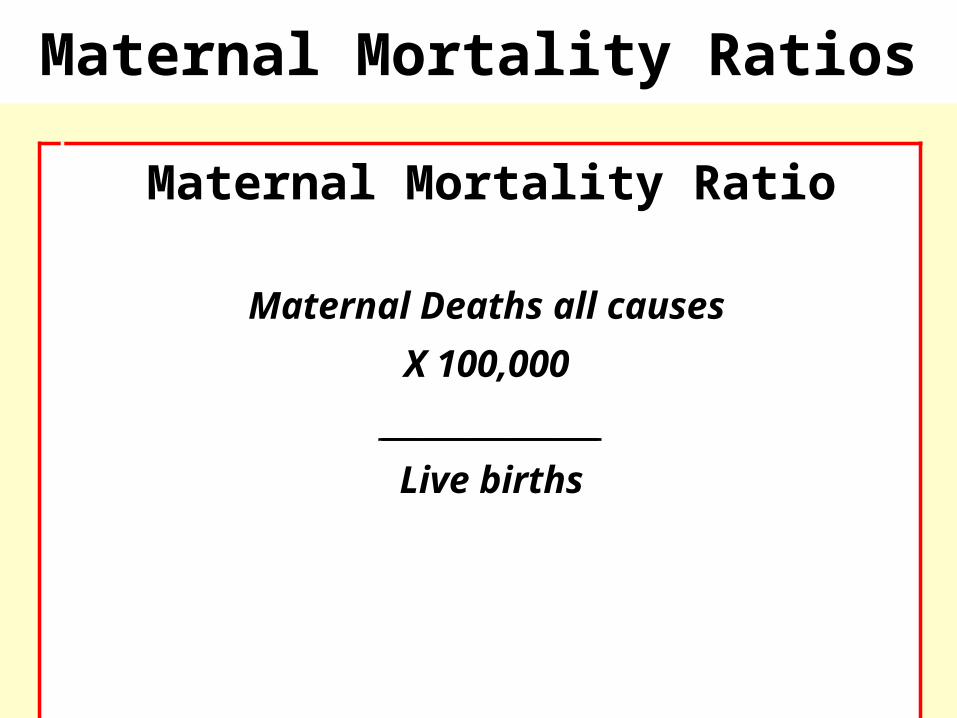
Maternal Mortality Ratios
Maternal Mortality Ratio
Maternal Deaths all causes X 100,000
_______________Live births

Maternal Mortality Rates, (per 100,000 births), 2010, Industrialized Countries with 300,000+ births
2.4
3.4
4.1
4.2
5
5.5
7.7
9
10.5
14.7
16.8
2 17
Australia*
Italy*
Spain
Japan
United Kingdom
Germany
France#
Canada#
US WNH**
Korea*
United States^
Sources: OECD Health Data 2013; NCHS. 2009. Deaths, Final Data, 2007.
U.S. 2007:Black non-Hispanic 28.4White non-Hispanic 10.5Hispanic 8.9
Maternal Mortality Rate
*2009; #2008; **2007; ^Estimate

BirthByTheNumbers.org
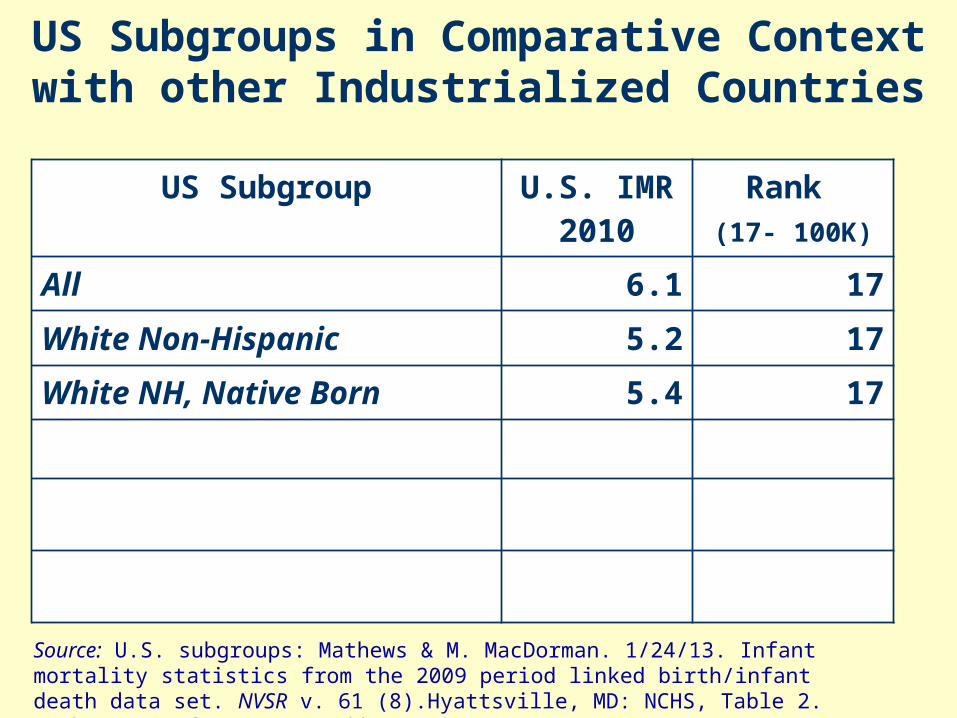
Other countries do better because the U.S. is different: -- more diversity, -- weaker social support system, -- inequality in our health care
system.
What if we compared subgroups in the U.S. to other countries?

US Subgroups in Comparative Contextwith other Industrialized Countries
US Subgroup U.S. IMR 2010
Rank (17- 100K)
All 6.1 17
Source: U.S. subgroups: Mathews & M. MacDorman. 1/24/13. Infant mortality statistics from the 2009 period linked birth/infant death data set. NVSR v. 61 (8).Hyattsville, MD: NCHS, Table 2. *Other IMRs from OECD Health Data 2013.

US Subgroups in Comparative Contextwith other Industrialized Countries
US Subgroup U.S. IMR 2010
Rank (17- 100K)
All 6.1 17
White Non-Hispanic 5.2 17
Source: U.S. subgroups: Mathews & M. MacDorman. 1/24/13. Infant mortality statistics from the 2009 period linked birth/infant death data set. NVSR v. 61 (8).Hyattsville, MD: NCHS, Table 2. *Other IMRs from OECD Health Data 2013.
US Subgroups in Comparative Contextwith other Industrialized Countries
US Subgroup U.S. IMR 2010
Rank (17- 100K)
All 6.1 17
White Non-Hispanic 5.2 17
White NH, Native Born 5.4 17
Source: U.S. subgroups: Mathews & M. MacDorman. 1/24/13. Infant mortality statistics from the 2009 period linked birth/infant death data set. NVSR v. 61 (8).Hyattsville, MD: NCHS, Table 2. *Other IMRs from OECD Health Data 2013.

US Subgroups in Comparative Contextwith other Industrialized Countries
US Subgroup U.S. IMR 2010
Rank (17- 100K)
All 6.1 17
White Non-Hispanic 5.2 17
White NH, Native Born 5.4 17
White NH, Singleton Birth 4.6 16
White NH, 30-34 yrs old 4.1 15
White NH, 39-41 weeks 1.8 1
Source: U.S. subgroups: Mathews & M. MacDorman. 1/24/13. Infant mortality statistics from the 2009 period linked birth/infant death data set. NVSR v. 61 (8).Hyattsville, MD: NCHS, Table 2. *Other IMRs from OECD Health Data 2013.

Examining Trends over Time

Neonatal Mortality Rate (per 1,000 births), 2000-2011, U.S., & Ave. for Industrialized Countries*
2.0
3.0
4.0
5.0
2000
2001
2002
2003
2004
2005
2006
2007
2008
2009
2010
2011
Rate
per
1,0
00 l
ive b
irth
s
Source: OECD Health Data, 2014 & MacDorman MF, et al. Recent declines in infant mortality in the United States, 2005–2011. NCHS data brief, no 120. Hyattsville, MD: NCHS. 2013.
U.S.
* Countries with 100,000+ births (2009): Australia, Belgium, Canada, Czech Republic, France, Germany, Greece, Israel, Italy, Japan, Netherlands, Portugal, Spain, S. Korea, Sweden, U.K.
2.3
4.0
4.6
3.1
Industrialized Countries
23% decrease
13% decrease

Neonatal Mortality Rate (per 1,000 births), 2000-2011, U.S., & Ave. for Industrialized Countries*
2.0
3.0
4.0
5.0
2000
2001
2002
2003
2004
2005
2006
2007
2008
2009
2010
2011
Rate
per
1,0
00 l
ive b
irth
s
Source: OECD Health Data, 2014 & MacDorman MF, et al. Recent declines in infant mortality in the United States, 2005–2011. NCHS data brief, no 120. Hyattsville, MD: NCHS. 2013.
U.S.
* Countries with 100,000+ births (2009): Australia, Belgium, Canada, Czech Republic, France, Germany, Greece, Israel, Italy, Japan, Netherlands, Portugal, Spain, S. Korea, Sweden, U.K.
2.3
4.0
4.6
3.1
If the U,S. neonatal mortality rate equaled the current average rate of the other countries in 2011, that would mean almost 6,955 fewer deaths to babies 28 days or younger annually.

Maternal Mortality Ratios (per 100,000 births), 2000-2011, U.S. & Ave.
Industrialized Countries*
4
8
12
16
20
2000 2001 2002 2003 2004 2005 2006 2007 2008 2009 2010 2011
Dea
ths
per
100
,000
live
bir
ths
Industrialized Countries
3 % Increase
U.S.71%
Increase
Sources: OECD Health Data 2014; NCHS. 2010. Deaths, Final Data, 2007.
* Countries with 300,000+ births (2011): Australia, Canada, France, Germany, Italy, Japan, S. Korea, Spain, United Kingdom NOTE: 2008-2010 US
rates unofficial

BirthByTheNumbers.org
But Gene, you’ve only looked at outcomes
What about process?
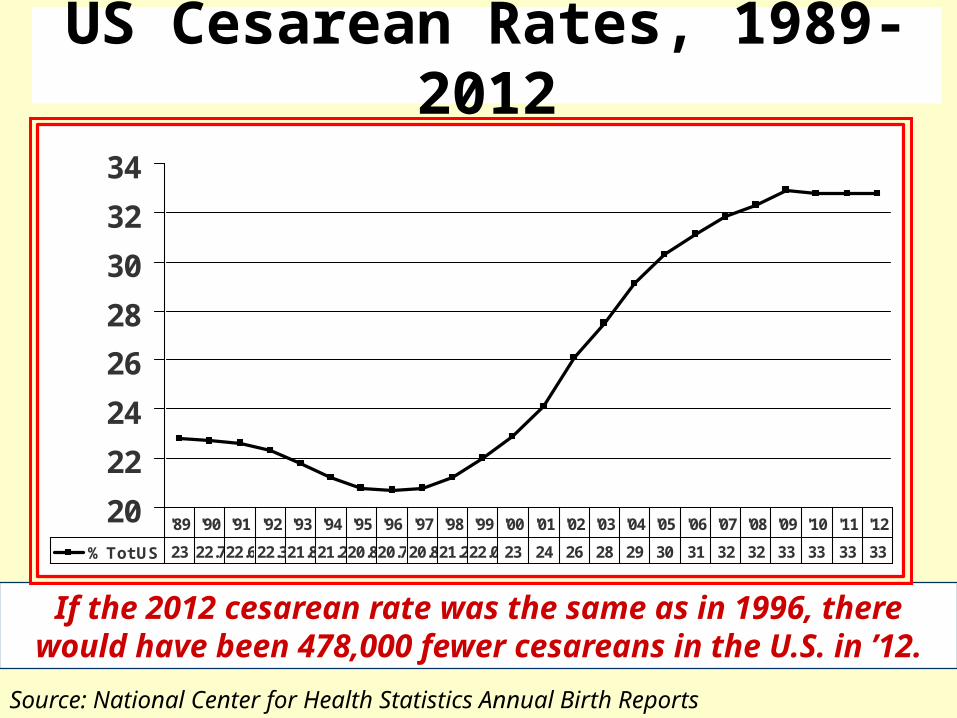
US Cesarean Rates, 1989-2012
20
22
24
26
28
30
32
34
% Tot US 23 22.722.622.321.821.220.820.720.821.222.0 23 24 26 28 29 30 31 32 32 33 33 33 33
'89 '90 '91 '92 '93 '94 '95 '96 '97 '98 '99 '00 '01 '02 '03 '04 '05 '06 '07 '08 '09 '10 '11 '12
%
Source: National Center for Health Statistics Annual Birth Reports
%
1,296,070
If the 2012 cesarean rate was the same as in 1996, there would have been 478,000 fewer cesareans in the U.S. in ’12.

BirthByTheNumbers.org

BirthByTheNumbers.org
Do High Rates of Intervention Matter?
1. Outcomes 2. Costs
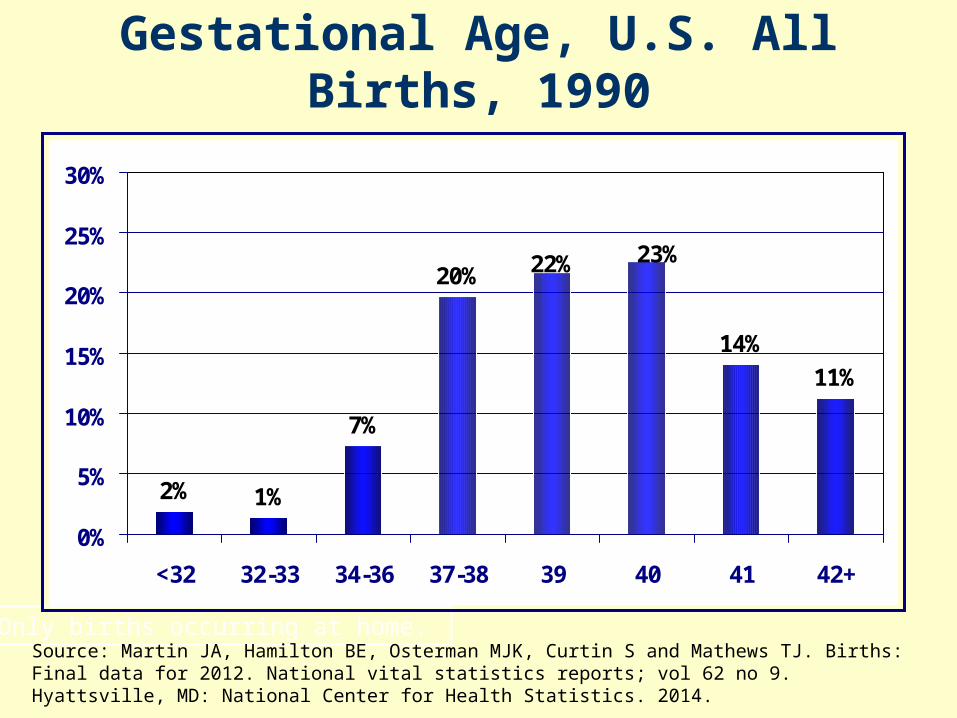
Gestational Age, U.S. All Births, 1990
2% 1%
7%
20%
14%
11%
22% 23%
0%
5%
10%
15%
20%
25%
30%
<32 32-33 34-36 37-38 39 40 41 42+
* Only births occurring at home. Source: Martin JA, Hamilton BE, Osterman MJK, Curtin S and Mathews TJ. Births: Final data for 2012. National vital statistics reports; vol 62 no 9. Hyattsville, MD: National Center for Health Statistics. 2014.

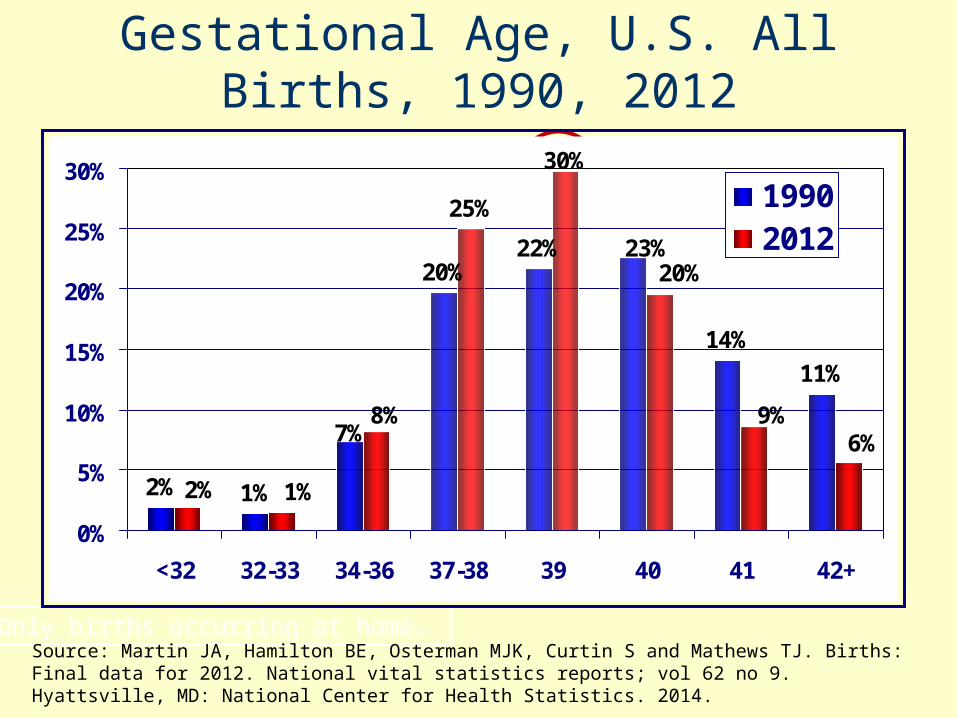
Gestational Age, U.S. All Births, 1990, 2012
2% 1%
8%
25%
30%
20%
9%
6%
0%
5%
10%
15%
20%
25%
30%
<32 32-33 34-36 37-38 39 40 41 42+
* Only births occurring at home. Source: Martin JA, Hamilton BE, Osterman MJK, Curtin S and Mathews TJ. Births: Final data for 2012. National vital statistics reports; vol 62 no 9. Hyattsville, MD: National Center for Health Statistics. 2014.
Gestational Age, U.S. All Births, 1990, 2012
2% 1%
20%22%
14%
11%
25%
30%
7%
23%
9%6%
2% 1%
8%
20%
0%
5%
10%
15%
20%
25%
30%
<32 32-33 34-36 37-38 39 40 41 42+
19902012
* Only births occurring at home. Source: Martin JA, Hamilton BE, Osterman MJK, Curtin S and Mathews TJ. Births: Final data for 2012. National vital statistics reports; vol 62 no 9. Hyattsville, MD: National Center for Health Statistics. 2014.

Source: Althabe F.Cesarean Section Rates and Maternal & Neonatal Mortality Birth.2006;33:270
Cesarean Rates and Neonatal Mortality
Low Income
Medium Income
High Income

But Gene, while our foundation focuses on health, we’ve never prioritized birth.
Why should we start now?
Economics of Childbirth in the U.S.
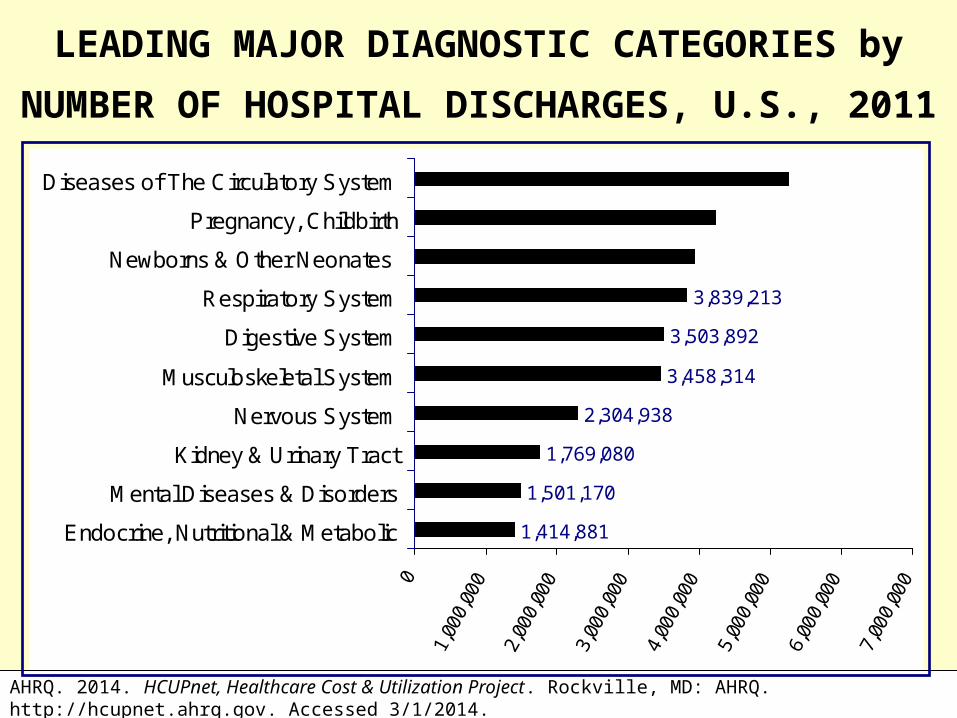
LEADING MAJOR DIAGNOSTIC CATEGORIES by
NUMBER OF HOSPITAL DISCHARGES, U.S., 2011
1,414,881
1,501,170
1,769,080
2,304,938
3,458,314
3,503,892
3,839,213
0
1,00
0,00
0
2,00
0,00
0
3,00
0,00
0
4,00
0,00
0
5,00
0,00
0
6,00
0,00
0
7,00
0,00
0
Endocrine, Nutritional & Metabolic
Mental Diseases & Disorders
Kidney & Urinary Tract
Nervous System
Musculoskeletal System
Digestive System
Respiratory System
Newborns & Other Neonates
Pregnancy, Childbirth
Diseases of The Circulatory System
AHRQ. 2014. HCUPnet, Healthcare Cost & Utilization Project. Rockville, MD: AHRQ. http://hcupnet.ahrq.gov. Accessed 3/1/2014.
5,258,172
4,237,975
3,941,545
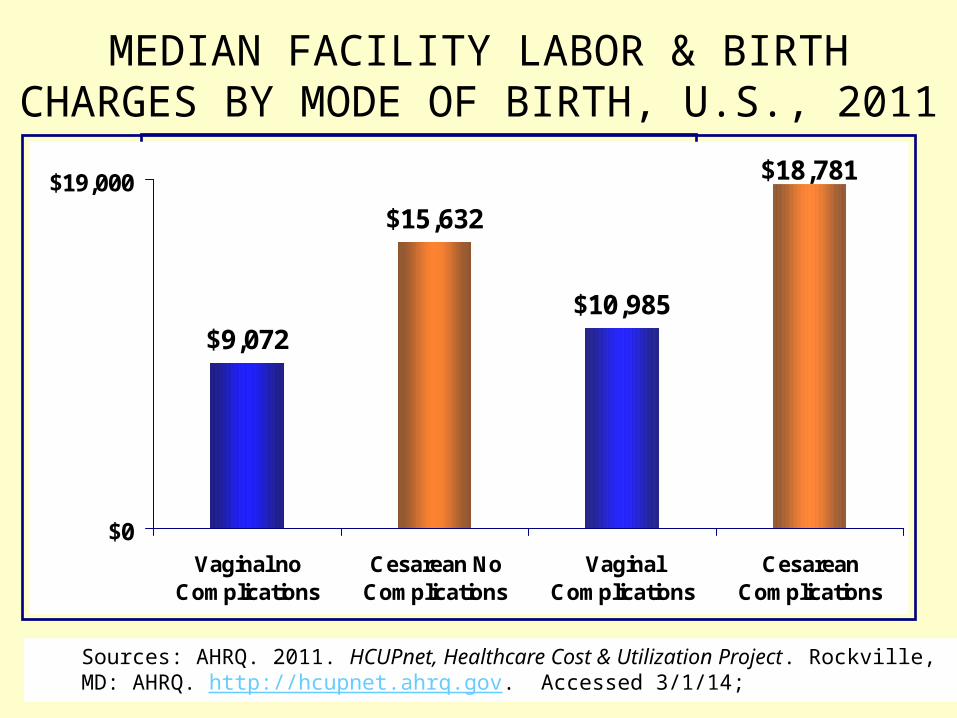
MEDIAN FACILITY LABOR & BIRTH CHARGES BY MODE OF BIRTH, U.S., 2011
$9,072
$15,632
$10,985
$18,781
$0
$19,000
Vaginal noComplications
Cesarean NoComplications
VaginalComplications
CesareanComplications
Sources: AHRQ. 2011. HCUPnet, Healthcare Cost & Utilization Project. Rockville, MD: AHRQ. http://hcupnet.ahrq.gov. Accessed 3/1/14;
NOTE: Hospital charges; no physician costs
72%

Estimated Total Charges, Hospital Birth, U.S., 1993-2011 (000,000)
0
10,000
20,000
30,000
40,000
50,000
60,000
1993
1995
1997
1999
2001
2003
2005
2007
2009
2011
Vag no Compl.
Vag w Compl.
Ces no Compl.
Ces w/ Compl.
Sources: AHRQ. 2009. HCUPnet, Healthcare Cost & Utilization Project. Rockville, MD: AHRQ. http://hcupnet.ahrq.gov. Accessed 3/1614.
$ 52,734
$ 14,039

Can Midwives Make a Difference?
BirthByTheNumbers.org
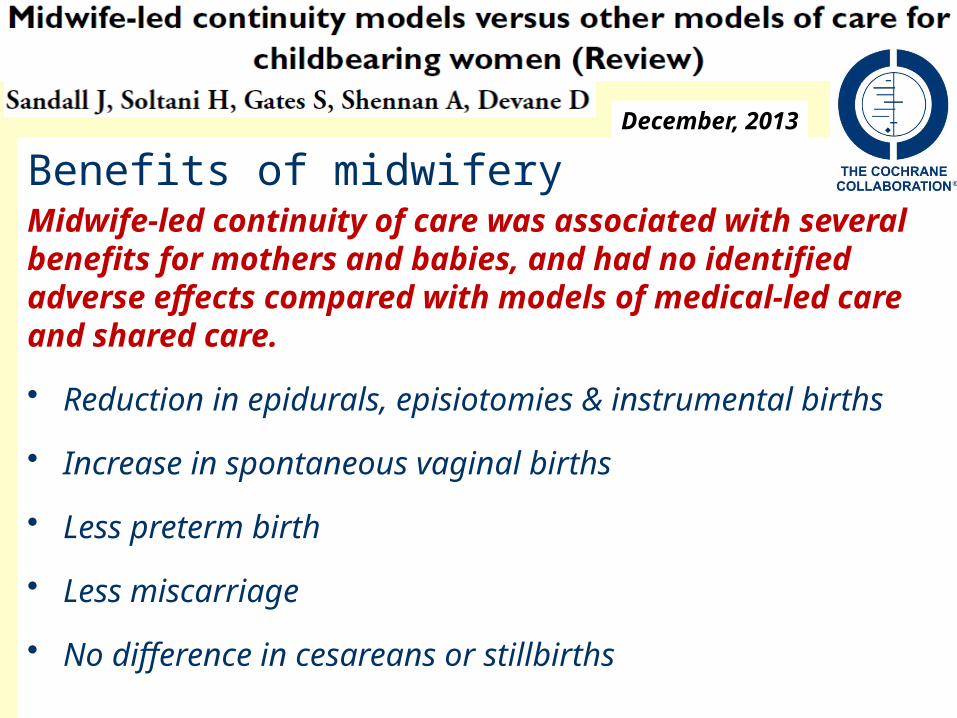
Benefits of midwiferyMidwife-led continuity of care was associated with several benefits for mothers and babies, and had no identified adverse effects compared with models of medical-led care and shared care.
• Reduction in epidurals, episiotomies & instrumental births
• Increase in spontaneous vaginal births
• Less preterm birth
• Less miscarriage
• No difference in cesareans or stillbirths
December, 2013

BirthByTheNumbers.org
CNMs per births & Cesarean Rate in State 2011
0.00 2.00 4.00 6.00 8.00 10.00 12.0020%
25%
30%
35%
40%
45%
r = -.28
CNM per 1,000 births in state
Ces
area
n R
ate
LA
UT
FL
NJ
VT
NH
ID
TX
MICANYGA
MA
NMAL
CO
WAAZ
BirthByTheNumbers.org
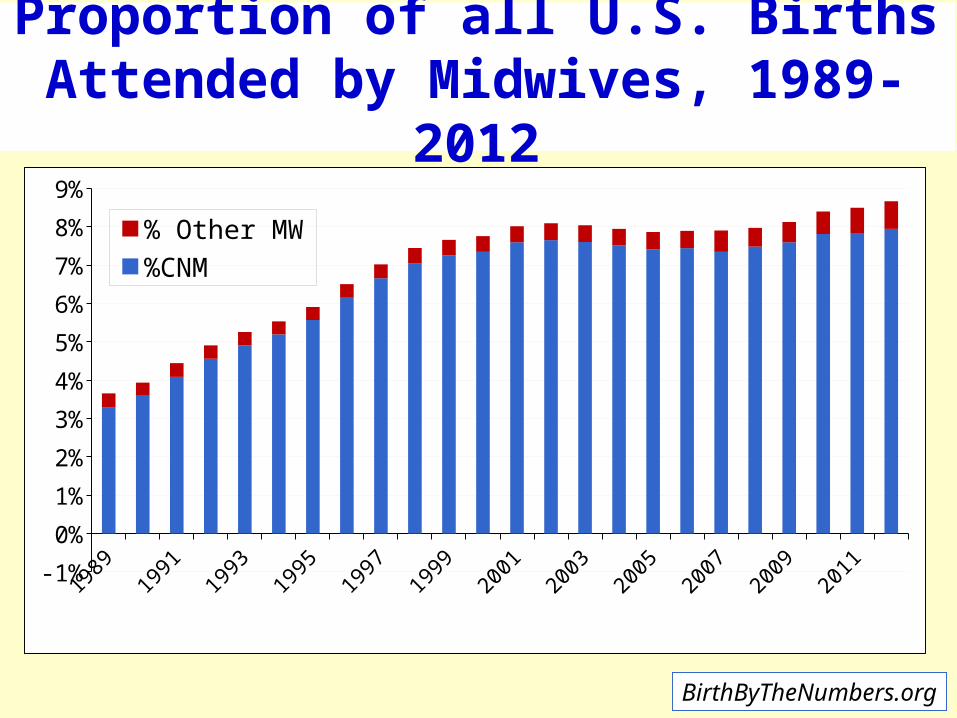
Proportion of all U.S. Births Attended by Midwives, 1989-2012
1989
1990
1991
1992
1993
1994
1995
1996
1997
1998
1999
2000
2001
2002
2003
2004
2005
2006
2007
2008
2009
2010
2011
2012-1%
0%
1%
2%
3%
4%
5%
6%
7%
8%
9%
% Other MW%CNM

OBGYN per 100K, 2011
SOURCE: Area Resource File
1,459 (46%) U.S. Counties with no OB
3,142 U.S. Counties

CNMs per 100K, 2011
SOURCE: Area Resource File
3,142 U.S. Counties
1,758 (56%) U.S. Counties with no CNM

SOURCE: Area Resource File
CNMs & OBs per 100K, 2011 3,142 U.S.
Counties
1,263 (40%) U.S. Counties with no OB or CNM

Childbirth Advocacy Led by Mothers
www.birthbythenumbers.org
www.childbirthconnection.org

BirthByTheNumbers.org
Extra Slides
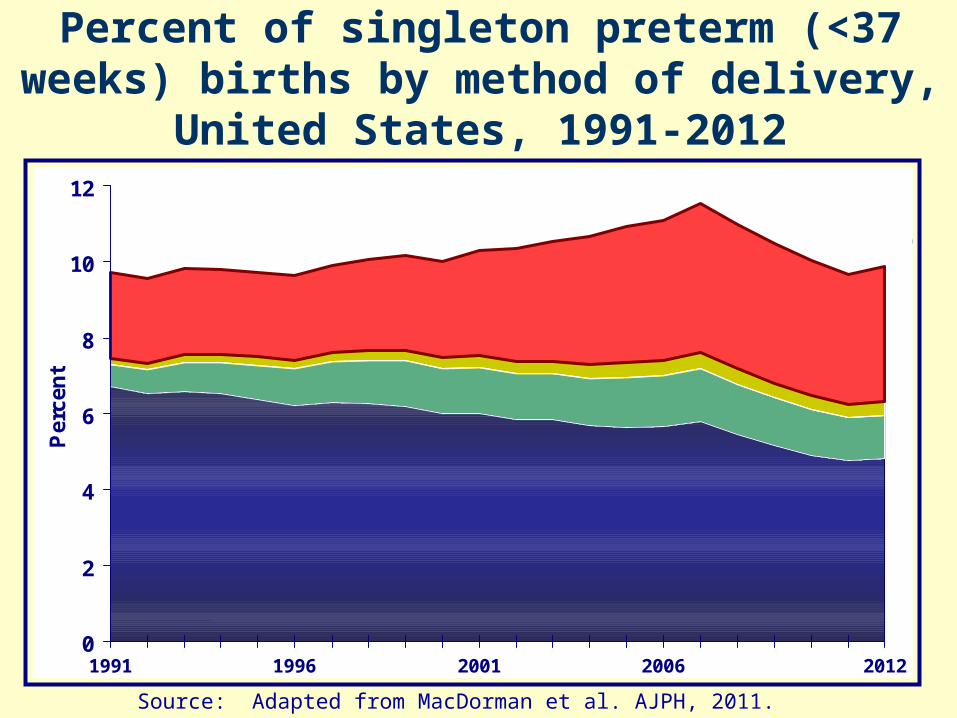
Percent of singleton preterm (<37 weeks) births by method of delivery, United States,
1991-2012
0
2
4
6
8
10
12
1991 1996 2001 2006 2012
Per
cen
t
Source: Adapted from MacDorman et al. AJPH, 2011.
9.7%
5.7%
6.7%
11.1%
10.0%
4.8%
3.6%
3.9%
2.3%
Spontaneous Vaginal
Cesarean
Cesarean post induction
Induced Vaginal
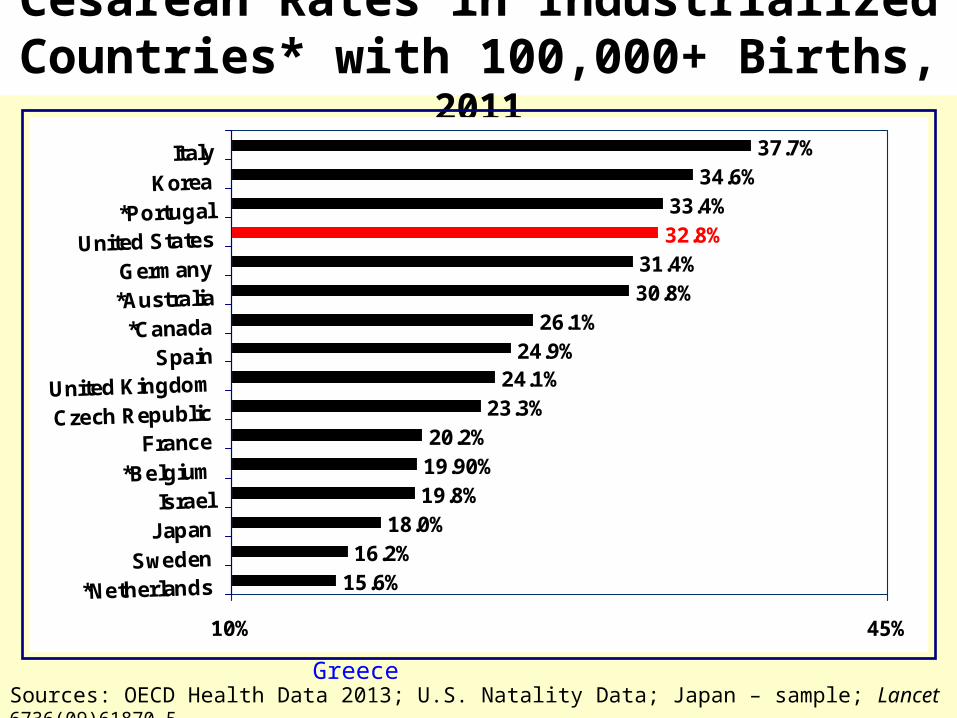
15.6%16.2%
18.0%19.8%19.90%20.2%
23.3%24.1%
24.9%26.1%
34.6%37.7%
32.8%31.4%
33.4%
30.8%
10% 45%
*NetherlandsSweden
JapanIsrael
*BelgiumFrance
Czech RepublicUnited Kingdom
Spain*Canada
*AustraliaGermany
United States*Portugal
KoreaItaly
Sources: OECD Health Data 2013; U.S. Natality Data; Japan – sample; Lancet 6736(09)61870-5.
Cesarean Rates in Industrialized Countries* with 100,000+ Births, 2011
*2010
* No data on cesarean rates in Greece

BirthByTheNumbers.org
Are mothers & babies the cause of these
changes?

BirthByTheNumbers.org
Is it Older Mothers?Total Cesarean Rates (per 100 births) by Age of Mother:
United States, 1996 and 2012
14.517.4
20.623.8
27.431.6
22.3
27.931.5
35.8
42.1
49.1
0
10
20
30
40
50
60
<20 20-24 25-29 30-34 35-39 40-54
1996 2012
54% 60% 53% 50% 54% 55%%
Source: National vital statistics system, NCHS, CDC.
Per
cent
Overall increase, 1996-2012: 58.5%

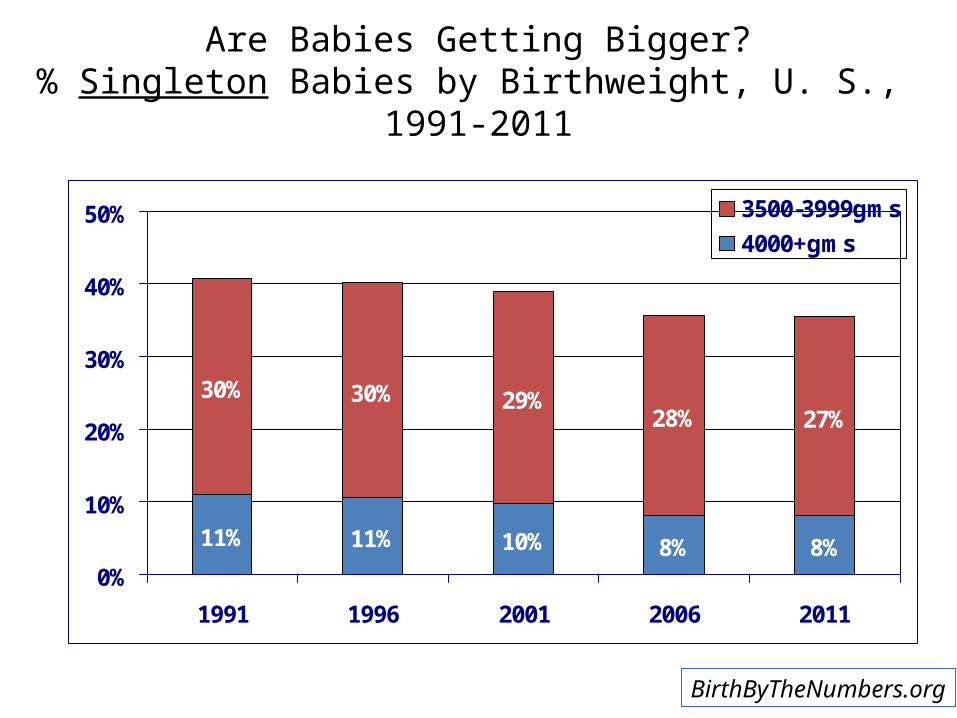
Are Babies Getting Bigger?% Singleton Babies by Birthweight, U. S.,
1991-2012
11% 11% 10% 8% 8%
30% 30% 29%28% 28%
0%
10%
20%
30%
40%
50%
1991 1996 2001 2006 2012
3500-3999gms
4000+gms41% 41% 39%
36% 36%
BirthByTheNumbers.org
BirthByTheNumbers.org
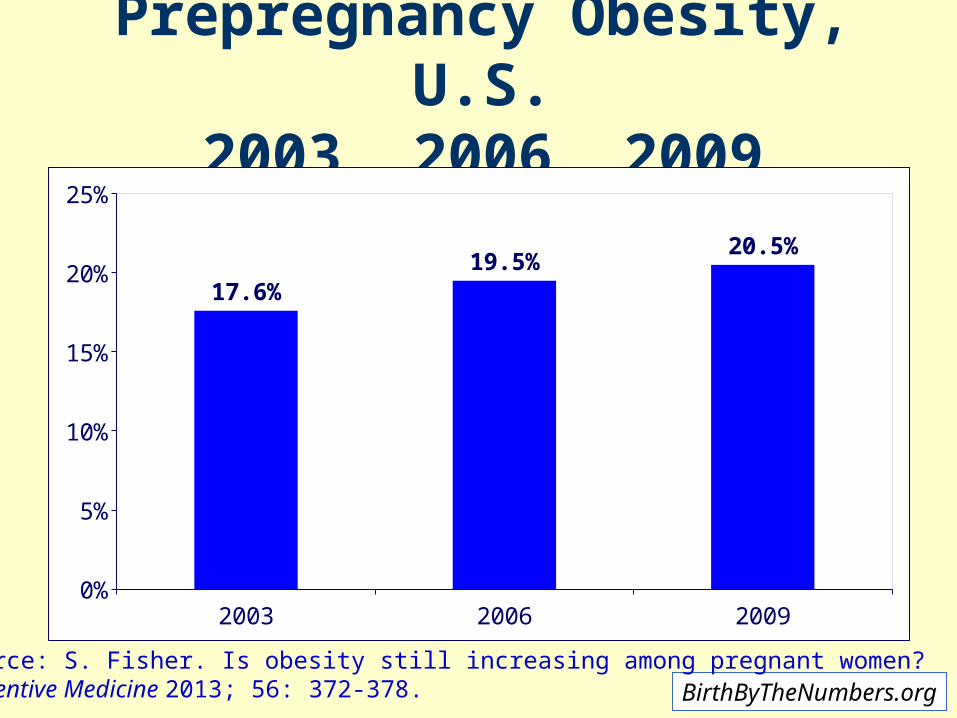
Prepregnancy Obesity, U.S.2003, 2006, 2009
2003 2006 20090%
5%
10%
15%
20%
25%
17.6%19.5%
20.5%
Source: S. Fisher. Is obesity still increasing among pregnant women?Preventive Medicine 2013; 56: 372-378.
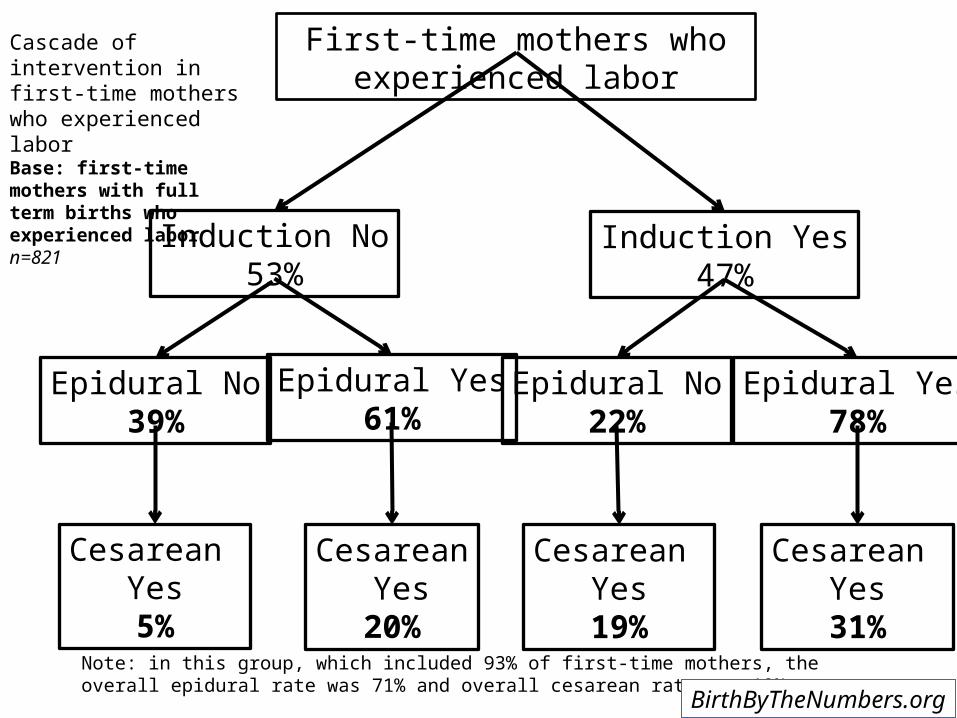
Induction No53%
Epidural No39%
Epidural Yes61%
Induction Yes47%
Epidural No22%
Epidural Yes78%
First-time mothers who experienced labor
Cesarean Yes20%
Cesarean Yes5%
Cesarean Yes31%
Cesarean Yes19%
Cascade of intervention in first-time mothers who experienced laborBase: first-time mothers with full term births who experienced labor n=821
Note: in this group, which included 93% of first-time mothers, the overall epidural rate was 71% and overall cesarean rate was 19%
BirthByTheNumbers.org
BirthByTheNumbers.org
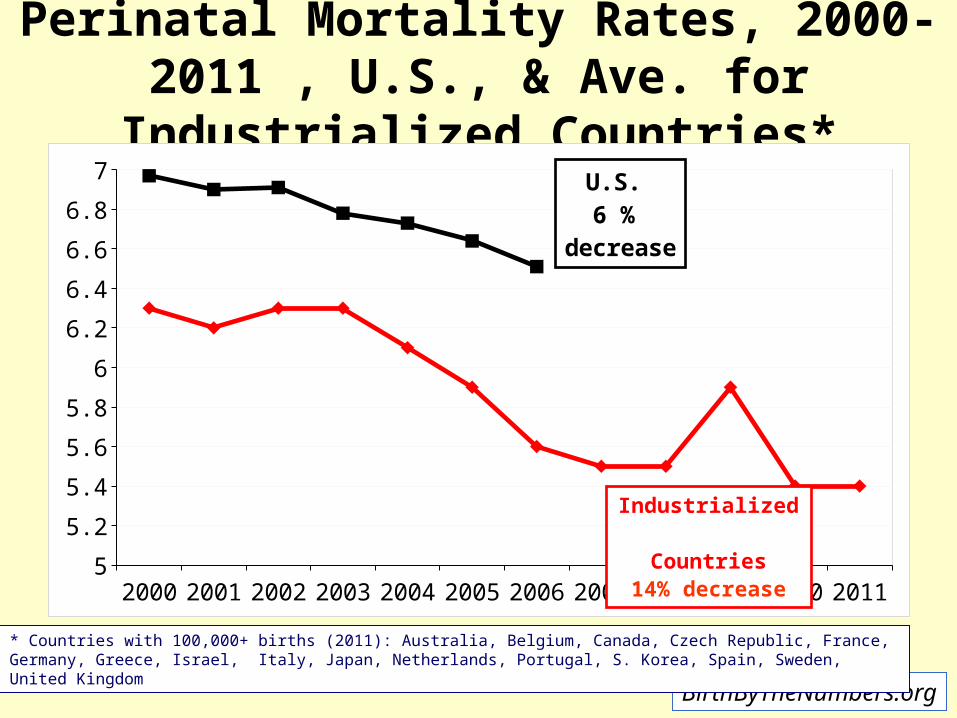
Perinatal Mortality Rates, 2000-2011 , U.S., & Ave. for Industrialized Countries*
2000 2001 2002 2003 2004 2005 2006 2007 2008 2009 2010 20115
5.2
5.4
5.6
5.8
6
6.2
6.4
6.6
6.8
7 U.S. 6 %
decrease
Industrialized Countries
14% decrease
* Countries with 100,000+ births (2011): Australia, Belgium, Canada, Czech Republic, France, Germany, Greece, Israel, Italy, Japan, Netherlands, Portugal, S. Korea, Spain, Sweden, United Kingdom
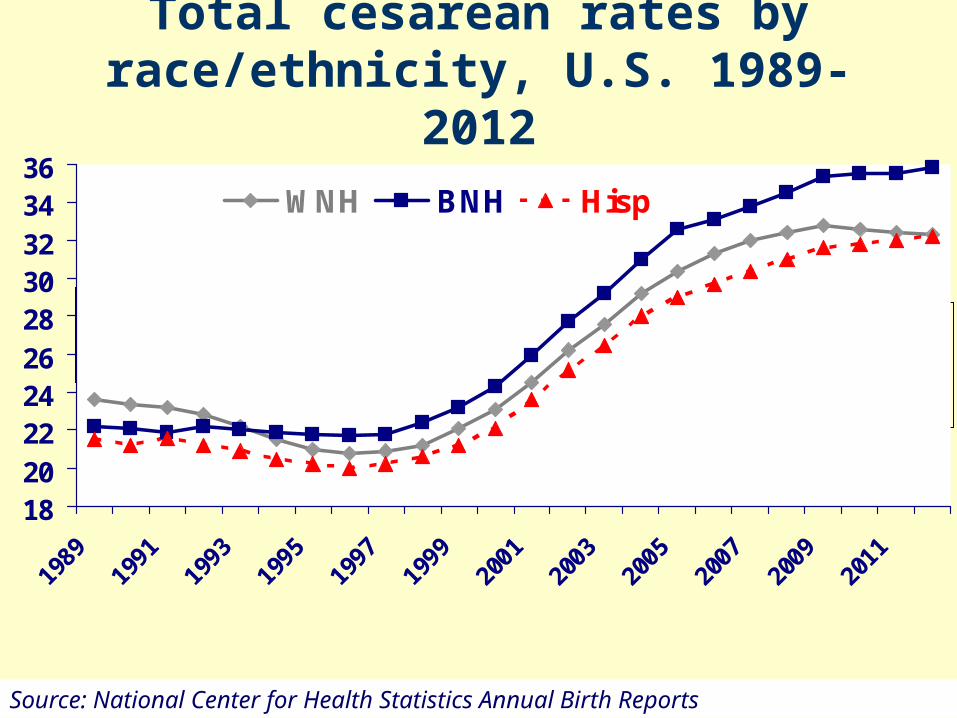
18202224262830323436
1989
1991
1993
1995
1997
1999
2001
2003
2005
2007
2009
2011
WNH BNH Hisp
Total cesarean rates by race/ethnicity, U.S. 1989-2012
Source: National Center for Health Statistics Annual Birth Reports
1989 WNH +1.4percentage
points
2011 BNH +3.5 percentage
points

VBAC Rates, Selected Countries, 2004
0 10 20 30 40 50 60
NetherlandsNorwayFinland
SwedenGermany
Czech RepDenmark
FranceBelg-Flanders
ScotlandSpain-Valencia
SloveniaMalta
EstoniaCanada
LithuaniaLatvia
U.S. VBACs
51
41
45
5155
25
2732
3539
41
919
24
25
25
20
8
Source: Adapted from Peristats, US & Canadian Data

BirthByTheNumbers.org
Have maternal request cesareans played a major role in these
increases?

BirthByTheNumbers.org
Two Components to Maternal Request Primary Cesarean
1. Mother made request for planned cesarean before labor
BirthByTheNumbers.org
Two Components to Maternal Request Primary Cesarean
1. Mother made request for planned cesarean before labor
2. Cesarean for no medical reason

BirthByTheNumbers.org
Patient Choice Primary Cesareans• Combining reason for cesarean and timing of
decision found only about 1% of respondents had a planned primary cesarean for no medical reason.
“I think that [cesarean] is… the best way … to give birth. It is a planned way, no hassle, no pain, the baby doesn’t struggle to come out, the baby is not pressed to come out …I think that … everybody should have the baby by cesarean section.” (quote from LtM2)
Studies from England and Canada confirm very low rates of maternal request cesareans

Pressure to Accept Interventions by Method of Delivery
Did you feel pressure from any health professional to have a cesarean? % yes
7%
28%
28%
22%
0% 5% 10% 15% 20% 25% 30%
Vaginal
VBAC
PrimaryCesarean
RepeatCesarean
Source: Declercq et al. 2013. Listening to Mothers III.BirthByTheNumbers.org

Inductions in Vaginal Births, U.S., 1990-2012
5%
10%
15%
20%
25%
30%
1990
1992
1994
1996
1998
2000
2002
2004
2006
2008
2010
2012
Source: Centers for Disease Control and Prevention. National Center for Health Statistics. VitalStats. http://www.cdc.gov/nchs/vitalstats.htm. BirthByTheNumbers.org
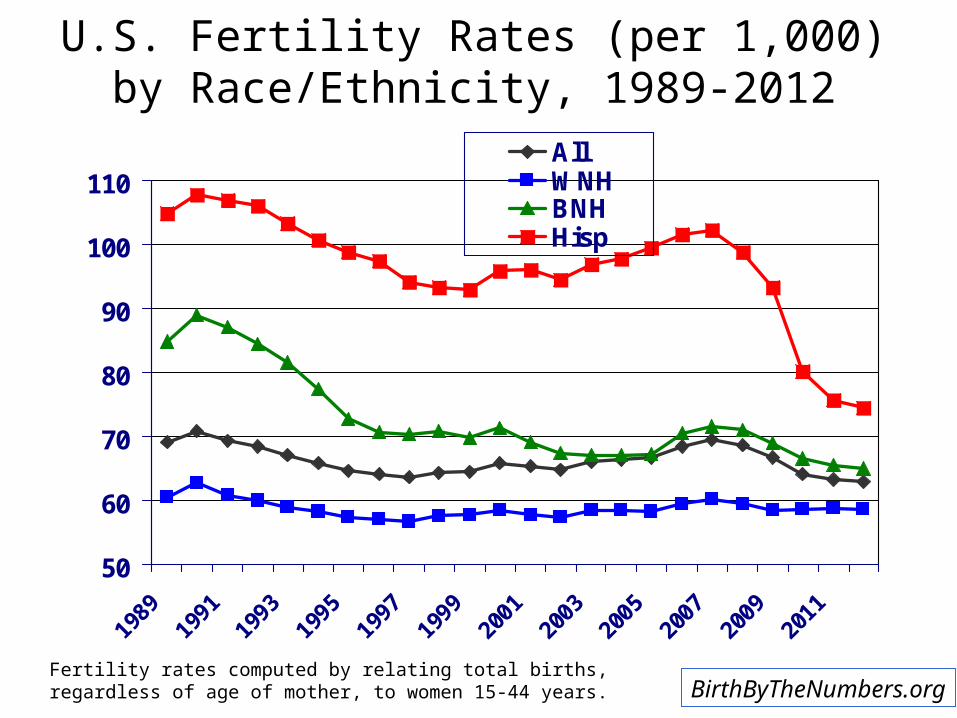
U.S. Fertility Rates (per 1,000) by Race/Ethnicity, 1989-2012
50
60
70
80
90
100
110
1989
1991
1993
1995
1997
1999
2001
2003
2005
2007
2009
2011
AllWNHBNHHisp
Fertility rates computed by relating total births, regardless of age of mother, to women 15-44 years. BirthByTheNumbers.org

Proportion of Births to Older Mothers, U.S. 1990-2012
0%
5%
10%
15%
20%
25%
30%
35%
40%
45%
1990
1991
1992
1993
1994
1995
1996
1997
1998
1999
2000
2001
2002
2003
2004
2005
2006
2007
2008
2009
2010
2011
2012
NOTE: Since 2003Cesarean Rate Increased by 20%
> 35> 35
>30
BirthByTheNumbers.org
Are Babies Getting Bigger?% Singleton Babies by Birthweight, U. S.,
1991-2011
11% 11% 10% 8% 8%
30% 30% 29%28% 27%
0%
10%
20%
30%
40%
50%
1991 1996 2001 2006 2011
3500-3999gms
4000+gms41% 41% 39%
36% 36%
BirthByTheNumbers.org

Rates of Multiple Births (proportion of all babies in multiple births), U.S., 1980-2012
1.5%
2.0%
2.5%
3.0%
3.5%
4.0%
1980
1982
1984
1986
1988
1990
1992
1994
1996
1998
2000
2002
2004
2006
2008
2010
2012
BirthByTheNumbers.org
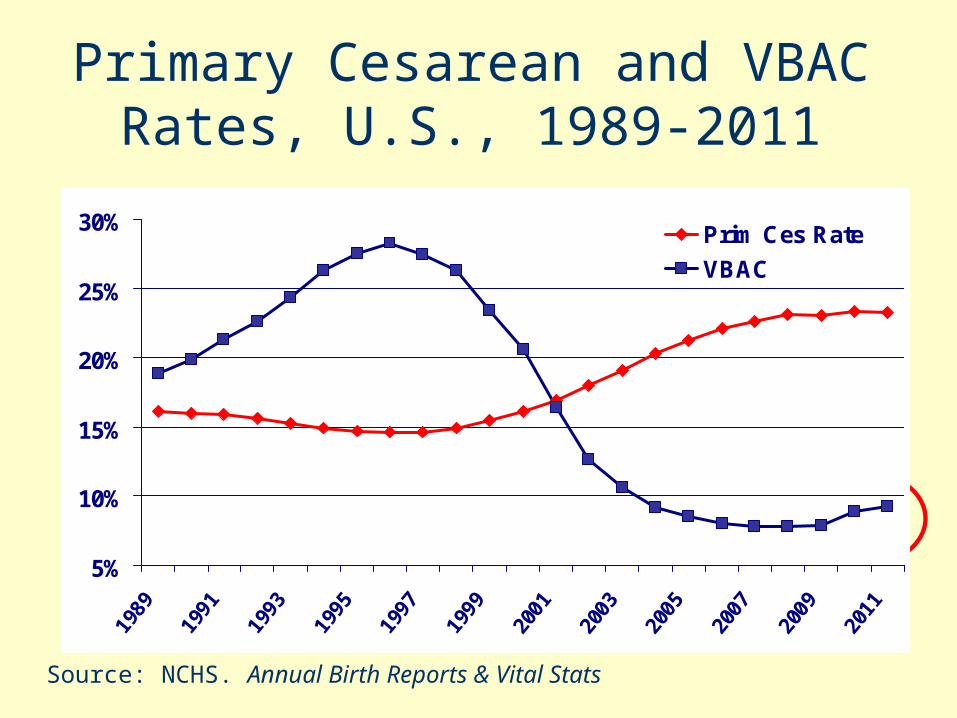
Primary Cesarean and VBAC Rates, U.S., 1989-2011
5%
10%
15%
20%
25%
30%
1989
1991
1993
1995
1997
1999
2001
2003
2005
2007
2009
2011
Prim Ces Rate
VBAC
r = -.95
Source: NCHS. Annual Birth Reports & Vital Stats
Note: 2005-2011 unofficial

VBAC Rates*, U.S.,1990-2011
5%
10%
15%
20%
25%
30%
1990
1991
1992
1993
1994
1995
1996
1997
1998
1999
2000
2001
2002
2003
2004
2005
2006
2007
2008
2009
2010
2011
Source: NCHS Vital Stats. http://www.cdc.gov/nchs/VitalStats.htm
* Number of VBACs among women with prior cesarean
NOTE: Rates for 2005-2011 are unofficial
BirthByTheNumbers.org
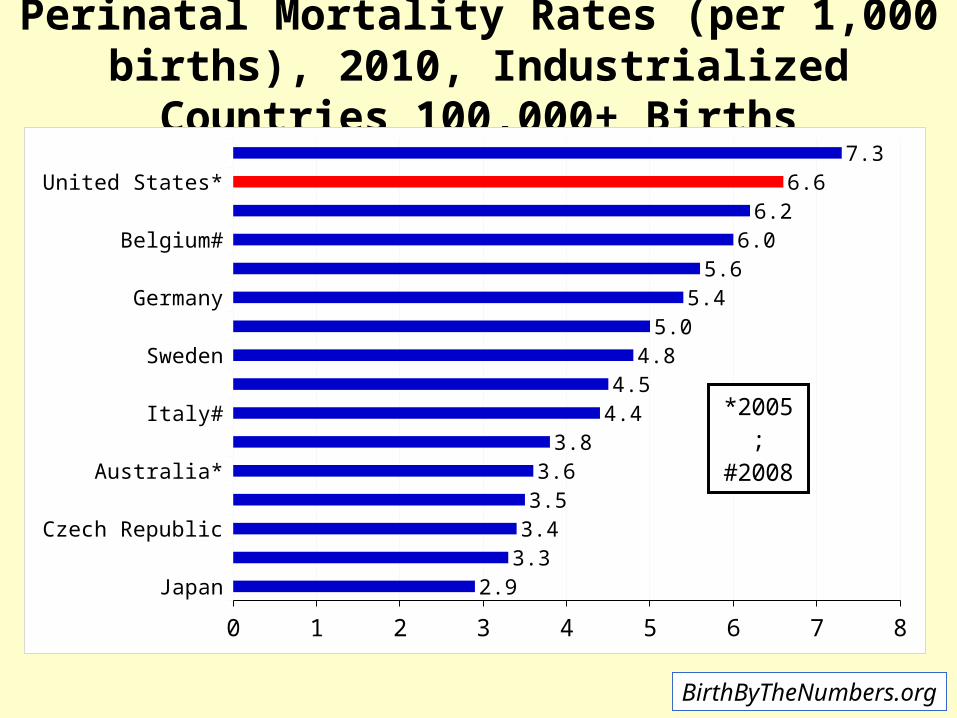
Perinatal Mortality Rates (per 1,000 births), 2010, Industrialized Countries 100,000+ Births
JapanKorea
Czech RepublicPortugal
Australia*SpainItaly#Israel
SwedenGreece
GermanyNetherlands
Belgium#Canada#
United States*United Kingdom
0 1 2 3 4 5 6 7 8
2.93.33.43.53.6
3.84.44.5
4.85.0
5.45.6
6.06.2
6.67.3
*2005; #2008

How is the U.S. doing relative to comparison countries?
Neonatal Mortality Rate
Infant Deaths in First 27 days
X 1,000_____________
Live Births
Perinatal Mortality Rate
Fetal deaths + deaths in the first week
X 1,000 _______________Live births + fetal
deaths
BirthByTheNumbers.org