understanding and projecting sea level change ... · understanding and projecting . sea level...
TRANSCRIPT

© Yann Arthus-Bertrand / Altitude
Understanding and projecting sea level change:
improvements and uncertainties Jonathan Gregory
On behalf of all the lead authors of Chapter 13, Sea level change John Church, Peter Clark, Anny Cazenave, Jonathan Gregory, Svetlana Jevrejeva,
Anders Levermann, Mark Merrifield, Glenn Milne, Steven Nerem, Patrick Nunn, Antony Payne, Tad Pfeffer, Detlef Stammer, Alakkat Unnikrishnan
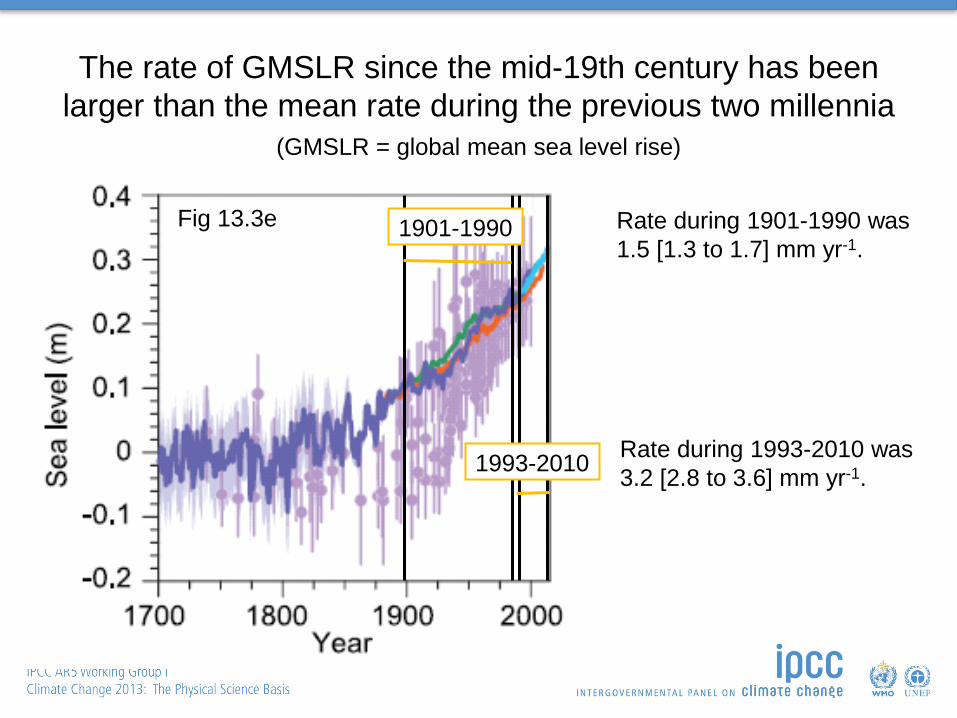
The rate of GMSLR since the mid-19th century has been larger than the mean rate during the previous two millennia
(GMSLR = global mean sea level rise)
Fig 13.3e
Rate during 1901-1990 was 1.5 [1.3 to 1.7] mm yr-1.
1901-1990
Rate during 1993-2010 was 3.2 [2.8 to 3.6] mm yr-1. 1993-2010

Causes of global mean sea level rise (GMSLR)
This in turn is caused by: Warming the ocean (thermal expansion, global thermosteric sea level rise). Adding mass to the ocean (barystatic sea level rise, not eustatic), due to: Loss of ice by glaciers. Loss of ice by ice sheets. Reduction of liquid water storage on land.
Global mean sea level rise is caused by an increase in the volume of the global ocean.

Expansion + glaciers explain most of GMSLR 1901-1990
Estimates of these terms are larger than in the AR4. The residual could be explained by mass loss from the Greenland ice sheet (especially during the early 20th century) and the Antarctic ice sheet (long-term), but no observational estimates are available. There is a net negative contribution from anthropogenic influence in land water storage.

Observed GMSLR 1993-2010 is consistent with the sum of observed contributions (high confidence)
Data from Table 13.1
High confidence in an anthropogenic influence on these largest contributions
Likely anthropogenic influence Low confidence in
attributing the causes

8–16 mm yr-1 in 2081-2100
Under all RCPs the rate of GMSLR will very likely exceed that observed during 1971–2010
Medium confidence in likely ranges
SPM Fig 9
Stabilising global mean surface temperature does not stabilise global mean sea level
Earlier CO2 emissions cause greater GMSLR

Confidence in projections of GMSLR has increased
High confidence
Medium confidence
Medium confidence Not included in AR4 Not included in AR4
Medium confidence
High confidence
Data from Table 13.5 for RCP4.5 for 2081-2100 relative to 1986-2005

Collapse of marine-based sectors of the Antarctic ice sheet
Only this effect, if initiated, could cause GMSL to rise substantially above the likely range during the 21st century. Medium confidence that this additional contribution would not exceed several tenths of a metre. Current evidence and understanding do not allow a quantification of either the timing of its onset or of the magnitude of its multi-century contribution.
It is virtually certain that global mean sea level rise will continue for many centuries beyond 2100
Sustained warming greater than a certain threshold above preindustrial would lead to the near-complete loss of the Greenland ice sheet (high confidence). The threshold is estimated to be greater than 1°C (low confidence) but less than 4°C (medium confidence) global mean warming with respect to preindustrial.

Regional sea level rise by the end of the 21st century due to ocean density and circulation change
Fig 13.16
CMIP5 ensemble mean Includes GSMLR due to thermal expansion of 0.18 m
Ensemble standard deviation
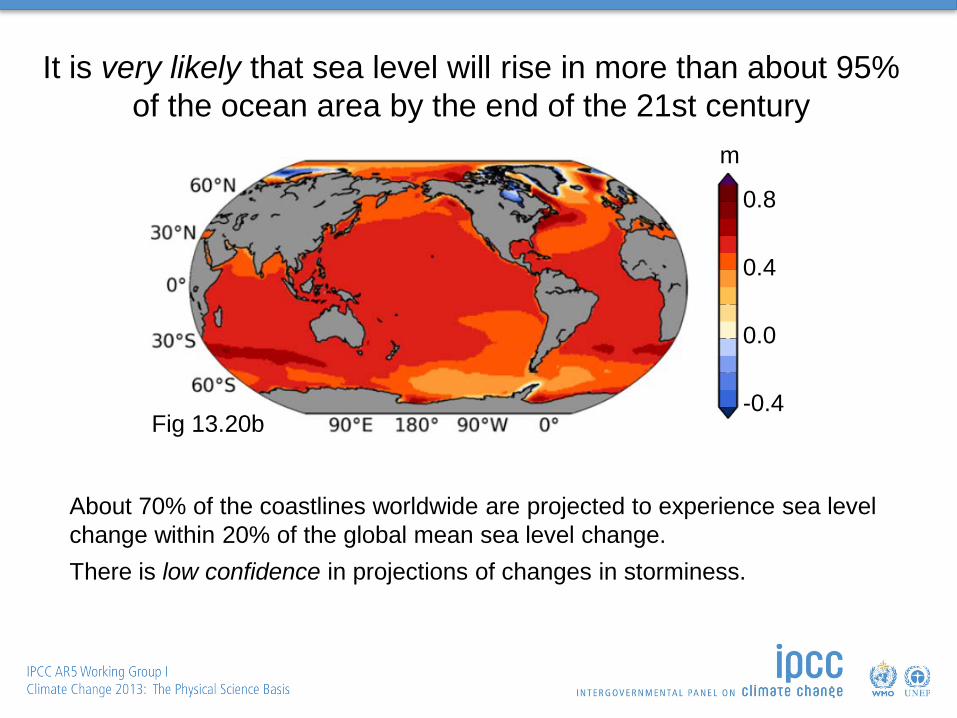
It is very likely that sea level will rise in more than about 95% of the ocean area by the end of the 21st century
0.0
-0.4
0.4
m
0.8
Fig 13.20b
About 70% of the coastlines worldwide are projected to experience sea level change within 20% of the global mean sea level change. There is low confidence in projections of changes in storminess.
We can account for GMSLR during 1901–2010, with uncertainties especially from the ice sheets in earlier decades. It is very likely that the 21st-century mean rate of GMSLR under all RCPs will exceed that of 1971–2010. The likely range of GMSLR for 2081–2100 compared with1986–2005 is 0.26–0.55 m for RCP2.6, 0.45–0.82 m for RCP8.5, with uncertainties arising from both climate and land ice modelling. The collapse of marine-based sectors of the Antarctic Ice Sheet, if initiated, would add no more than several tenths of a meter during the 21st century (medium confidence). Despite much scientific progress since the AR4, ice-sheet/shelf–ocean–climate interactions cannot yet be confidently modelled. It is very likely that sea level will rise in more than about 95% of the ocean area. Model agreement is still limited regarding regional patterns of sea level rise. It is virtually certain that global mean sea level rise will continue for many centuries beyond 2100. There are important uncertainties in future dynamical changes in the Antarctic ice sheet, and in the threshold warming beyond which the Greenland ice sheet would be eliminated.
Summary of main findings and uncertainties

© Yann Arthus-Bertrand / Altitude
www.climatechange2013.org Further Information